 Maria L. Paulsen1*
 Hugo Doré2
 Laurence Garczarek2
 Lena Seuthe3
 Oliver Müller1
 Ruth-Anne Sandaa1
 Gunnar Bratbak1
 Aud Larsen4
- 1Department of Biology, University of Bergen, Bergen, Norway
- 2Centre National de la Recherche Scientifique, UMR 7144, Station Biologique, Sorbonne Universités, UPMC Université Paris 06, Roscoff, France
- 3Department of Arctic and Marine Biology, Faculty of Biosciences, Fisheries and Economics, UiT-The Arctic University of Norway, Tromsø, Norway
- 4Hjort Centre for Marine Ecosystem Dynamics, Uni Research Environment, Bergen, Norway
Increasing temperatures, with pronounced effects at high latitudes, have raised questions about potential changes in species composition, as well as possible increased importance of small-celled phytoplankton in marine systems. In this study, we mapped out one of the smallest and globally most widespread primary producers, the picocyanobacterium Synechococcus, within the Atlantic inflow to the Arctic Ocean. In contrast to the general understanding that Synechococcus is almost absent in polar oceans due to low temperatures, we encountered high abundances (up to 21,000 cells mL−1) at 79°N, and documented their presence as far north as 82.5°N. Covering an annual cycle in 2014, we found that during autumn and winter, Synechococcus was often more abundant than picoeukaryotes, which usually dominate the picophytoplankton communities in the Arctic. Synechococcus community composition shifted from a quite high genetic diversity during the spring bloom to a clear dominance of two specific operational taxonomic units (OTUs) in autumn and winter. We observed abundances higher than 1000 cells mL−1 in water colder than 2°C at seven distinct stations and size-fractionation experiments demonstrated a net growth of Synechococcus at 2°C in the absence of nano-sized grazers at certain periods of the year. Phylogenetic analysis of petB sequences demonstrated that these high latitude Synechococcus group within the previously described cold-adapted clades I and IV, but also contributed to unveil novel genetic diversity, especially within clade I.
Introduction
The widely abundant picocyanobacterium Synechococcus is estimated to be responsible for about 17% of ocean net primary productivity and thus to have a high impact on ocean ecosystems and biogeochemical cycles (Flombaum et al., 2013). Synechococcus is normally not considered to be bloom-forming even though they can appear in abundances as high as 1.2–3.7 × 10⁶ cells mL−1 in the Costa Rica dome (Saito et al., 2005). Using 37,699 discrete global Synechococcus observations between 69°S and 81°N and quantitative niche models, Flombaum et al. (2013) demonstrated temperature to be the main environmental parameter explaining the global distribution of Synechococcus. Accordingly, the regional range of temperature was found to be a relatively good predictor for the seasonal change in Synechococcus abundance (Tsai et al., 2013). Although the marine Synechococcus that have been studied in culture so far have a temperature optimum ranging from 20 to 33°C depending on the clade (Pittera et al., 2014), the highest annual average in situ cell abundances were found at temperatures around 10°C in the Indian and western Pacific Oceans, with averages of 34,000 and 40,000 cells mL−1, respectively (Flombaum et al., 2013).
There has been observations of Synechococcus at low temperatures e.g., < 4°C in low numbers (< 100 cells mL−1; Waterbury et al., 1986) and <2°C (Shapiro and Haugen, 1988; Gradinger and Lenz, 1995), but they are still often considered to be nearly absent from the polar ocean (Pedrós-Alió et al., 2015) in contrast to cold adapted eukaryotic picophytoplankton that occur in high abundances both in Arctic (Sherr et al., 2003; Lovejoy et al., 2007; Tremblay et al., 2009; Zhang et al., 2015) and in Antarctic waters (Doolittle et al., 2008). Only a few studies have actually documented Synechococcus north of 70° and none have so far described the genetic diversity of these northern populations or tested their temperature optimum.
During four expeditions Gradinger and Lenz (1995) observed maximal abundances of 5500 Synechococcus cells mL−1 in the Atlantic inflow to the Arctic Ocean west of Svalbard at 78°N, while they did not find any Synechococcus cells in surface samples of polar water (defined as water having Temp < 0°C; Salinity < 34). Further south, following a transect from 70.5 to 74°N, Not et al. (2005) recorded a maximum abundance of 25,000 cells mL−1 in the Norwegian and Barents Seas in August 2002. In the western Canadian Arctic, Cottrell and Kirchman (2012) found abundances of 40–80 cells mL−1 in coastal waters of the Chukchi Sea and the Beaufort Sea at 71.5°N, both during summer and winter cruises. Nelson et al. (2014) concluded in their overview that the Synechococcus distribution in this region is controlled mainly by inflow of the relatively warm Pacific water, but argue that water temperature alone cannot be used to define environments in which Synechococcus may reside as they do persist at water temperatures near the freezing point (−1.8°C) (Nelson et al., 2014).
Synechococcus is often found in Arctic lakes and rivers, and freshwater runoff may thus also represent a source of Synechococcus cells to the Arctic Ocean (Vincent et al., 2000). Using 16S rRNA analysis, Waleron et al. (2007) revealed that picocyanobacteria present in the Canadian Beaufort Sea originate from the Mackenzie River and other nearby inflows. High abundances of Synechococcus (30,000 cells mL−1) were also found in the Laptev Sea, but were restricted to brackish waters near the Lena River delta, while further away from the delta, abundances decreased with increasing salinity to a total absence at salinities >20 (Moreira-Turcq and Martin, 1998). All these studies support Waterbury et al. (1986) claiming that only few brackish species tolerate wide salinity ranges and that many strains are obligate marine. Assuming that Atlantic Synechococcus have a low tolerance to salinity changes, the question remains whether the low salinity in the Arctic surface waters constrains their distribution in the polar ocean.
The Atlantic inflow is the main conveyor, not only of water and heat, but also of more southern species into the Arctic Ocean. Synechococcus has accordingly been suggested as a bio-indicator for the advection of Atlantic waters into the Arctic Ocean (Murphy and Haugen, 1985; Gradinger and Lenz, 1995). The main transport follows the West Spitsbergen Current (WSC) which is an extension of the Norwegian Atlantic Current splitting up into two branches around 79–80°N (Figure 1). The WSC is about 100 km wide and is confined over the continental slope along the Norwegian coast. It has an average speed of 10 cm s−1 (Cokelet et al., 2008) but can reach a speed of up to 24–35 cm s−1 (Boyd and D'Asaro, 1994; Fahrbach et al., 2001). The inflow follows a strong annual cycle with maximum volume transport during winter (20 Sv in February) and minimum during summer (5 Sv in August, Fahrbach et al., 2001) (N.B. the unit sverdrup (Sv) is equal to 1 million m3 s−1). Strong variations in the strength of the Atlantic inflow combined with varying sea ice extension make it challenging to assess the spread of Atlantic organisms in this area. Little is known about how Synechococcus populations, originating from the Norwegian coast or further south, are affected as they are transported into the Arctic Ocean or whether some Synechococcus lineages are favored under the transition to more Arctic conditions.
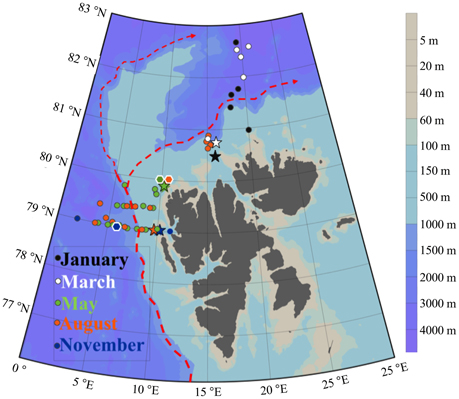
Figure 1. Study area Northwest of Svalbard. Sampled stations are colored according to the month of sampling: January (black), March (white), May (green), August (orange), and November (blue). Star-symbols indicate sampling of water for fractionated growth experiments. Hexagon symbols with white border indicate sampling for molecular analysis. Red arrows indicate the main flow of the West Spitsbergen Current drawn after Cokelet et al. (2008), Randelhoff et al. (submitted).
Temperature is one of the main drivers of Synechococcus biogeography. Among the five globally dominating Synechococcus lineages (clades I, II, III, IV, and CRD1), clades I and IV dominate at high latitudes in cold and coastal waters, while clades II and III are mostly found in warm, (sub)tropical areas (Zwirglmaier et al., 2008; Farrant et al., 2016; Sohm et al., 2016). Populations adapted to distinct thermal niches were also identified within the CRD1 clade, including one co-occurring with clade I and IV in cold, mixed waters of the Pacific Ocean (Farrant et al., 2016).
Increasing ocean temperature in high latitude systems has drawn attention towards the growth of invasive organisms with higher temperature optima and subsequent ecosystem changes. In marine systems, small phytoplankton are expected to become relatively more abundant with warming (Morán et al., 2010; Tremblay et al., 2012) and it has been speculated that the warming of the Arctic Ocean could lead to a shift from picoeukaryotes to picocyanobacteria, with implications for food quality (Vincent, 2010). Flombaum et al. (2013) projected up to a 50% increase in Synechococcus at 60°N by the end of the twenty first century. Their models were however not able to make projections for higher latitude systems because observations in these areas are scarce. The aim of the present study is therefore to examine the distribution of Synechococcus in relation to environmental parameters and other microbial plankton groups within the Atlantic gateway to the Arctic. The genetic diversity of Synechococcus populations was also unveiled using a high resolution genetic marker, the petB gene (encoding the cytochrome b6 subunit), in order to trace the geographical origin and seasonal changes of these populations.
Materials and Methods
Locality and Sampling
This study covers the eastern part of the Fram Strait, where Atlantic water (AW) is transported northward by the West Spitsbergen Current (WSC). Data were collected during five cruises in 2014: January (06.01–15.01), March (05.03–10.03), May (15.05–02.06), August (07.08–18.08), and November (03.11–10.11). Transects were made across the core of AW inflow at 79 and 79.4°N during May, August and November. Further north (80.5 to 82.6°N) we investigated the WSC southern branch into the Arctic Ocean in January, March and August (Figure 1). The choice of sampling area and stations was largely determined by the extension of the sea ice (Figure 3). Vertical profiles of temperature, salinity and fluorescence were recorded on each sampling occasion using a SBE 911plus system. Water masses were defined based on the criteria presented in Table 1. Discrete water samples for analyses of nutrients ( + , , , H4SiO4) and enumeration of phytoplankton, viruses, bacteria, and heterotrophic nanoflagellates (HNF) were collected from 11 depths (1, 5, 10, 20, 30, 50, 100, 200, 500, 750, and 1000 m) using 10 L Niskin bottles. During the summer cruises we collected additional samples from the Deep Chlorophyll Maximum (DCM) (when different from any of the standard depths). The shallow shelf stations were sampled to near bottom and with higher sampling resolution in the surface.
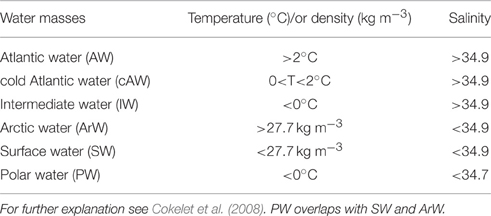
Table 1. Criteria determining the water masses.
Flow Cytometry
Abundances of pico- and nano-sized phytoplankton, viruses, bacteria and HNF were determined on an Attune® Acoustic Focusing Flow Cytometer (Applied Biosystems by Life technologies) with a syringe-based fluidic system and a 20 mW 488 nm (blue) laser. Samples were fixed with glutaraldehyde (0.5% final conc.) at 4°C for a minimum of 2 h, flash frozen in liquid nitrogen and stored at −80°C until analysis, except in November, when phytoplankton was enumerated using fresh samples. For analysis of HNF the samples were stained with SYBR Green I (Molecular Probes, Eugene, Oregon, USA) for 2 h in the dark and a minimum of 1 mL was measured at a flow rate of 500 μl min−1 following the protocol of Zubkov et al. (2007). The HNF population was discriminated from nano-sized phytoplankton based on green vs. red fluorescence and from large bacteria on a plot of side scatter vs. green fluorescence following the recommendations of Christaki et al. (2011). Pico- and nano-sized phytoplankton were counted directly after thawing and the various groups discriminated based on their side scatter signals (SSC) vs. orange fluorescence (Figure 2A; Marie et al., 1997; Larsen et al., 2001) as well as their red vs. orange fluorescence (Figure 2B). Synechococcus was identified in plots of orange fluorescence vs. side scatter signals (Figure 2A). For samples with low abundance of phytoplankton (March and January) a volume of 1.5 mL was counted, while 0.5 mL was sufficient for May, August and November-samples. Regular blank measurements using Milli-Q® water were made to ensure that there was no carry over of cells between samples and that electronic noise did not disturb the counts. Due to the inherent uncertainty connected to enumeration of cells when concentrations are low, we only included samples with > 20 cells mL−1 when relating counts to other environmental parameters (Figure 5). Samples for which 0–20 cells were detected (i.e., mainly those deeper than 500 m) are included in our total data set (Table S1, Figure S2).
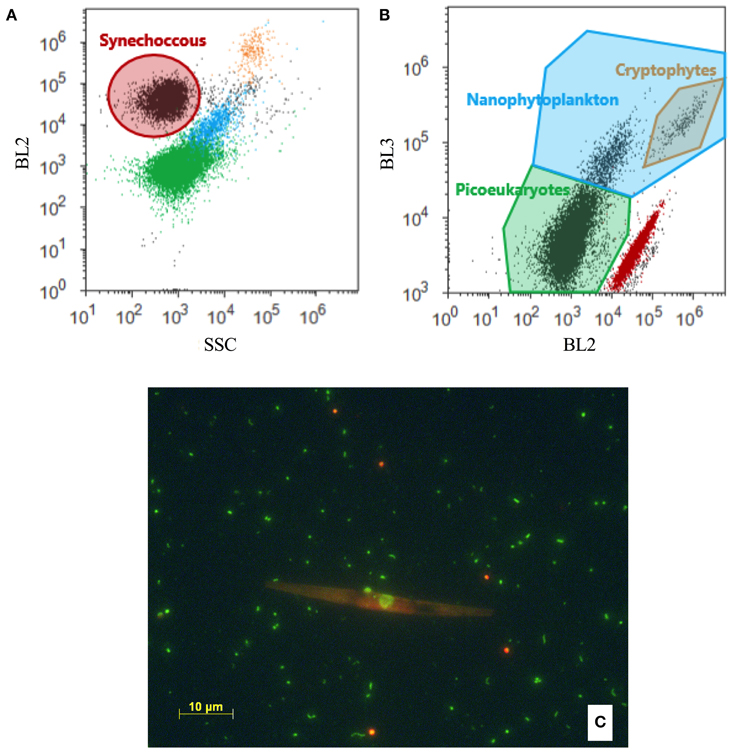
Figure 2. (A,B) Biparametric flow cytometry plots with the applied grouping of the different phytoplankton groups indicated by the solid line. Groups are colored according to their grouping in order to appear on both (A) BL2 (orange fluorescence) vs. SSC (side scatter) and (B) BL3 (red fluorescence) vs. BL2. (C) Microscope image showing the difference in the autofluorescence spectrum of Synechococcus (appear orange) and picoeukaryotes (appear green). The long orange cell is a diatom.
Microscopy
The presence of Synechococcus was also confirmed by fluorescence microscopy (Figure 2C). Samples were fixed and stored as for flow cytometry. The samples were thawed, filtered onto Anodisc filters (Whatman, pore size 0.2 μm) and stained with SYBR Green I (Molecular Probes Inc., Eugene, Oregon) according to Patel et al. (2007). The samples were viewed and photographed at 400X using a Zeiss Axio Imager Z1 microscope with AxioCam MRm BW-camera, extended focus, epifluorescence illumination (HXP Illuminator) and Zeiss filter sets 09 and 43 for SYBR Green and chlorophyll fluorescence, respectively.
Size-Fractionated Growth Experiments
Water fractionation experiments were used to examine interaction between different size groups of microorganisms and to estimate growth rates of the different microbial components (Simek and Chrzanowski, 1992; Jürgens et al., 2000; Christaki et al., 2001; Sato et al., 2007). Experiments were performed once every cruise using water collected from 20 m (in August and May this depth was near DCM) at stations on the shelf (marked on Figure 1). The water was gently screened through 3, 5, 10, and 90 μm mesh size filters by reverse filtration in order to successively exclude grazers of different sizes and thus create communities with increasing “top-predators” sizes. Water from each filtration treatment was gently transferred into triplicate 3.9 L transparent polycarbonate bottles (Nalgene®) by staggered filling using silicone tubing. The incubation experiments ran for 5 to 10 days but we show data only from the initial 5 days of incubation in order to better represent dynamics of the initial communities. Incubation water was sampled daily for enumeration of microorganisms and every second day for nutrients. Prior to setup, all bottles, carboys and silicon tubs were acid washed and then rinsed with Milli-Q® water. During the summer cruises (May and August) the experimental bottles were incubated on deck in plexiglass tanks with seawater flow-through (continuously pumped from 7 m depth), keeping the temperature close to in situ (May: 1.7 ± 1.6°C and August: 1 ± 0.8°C). A nylon net was wrapped around each bottle to reduce the PAR to about 30% of the surface irradiation. In the winter months (January, March, November), incubations were kept in a cooling room at a constant temperature of 2°C and in darkness, except in March were an in situ light cycle was set (16 h darkness and 8 h at 5 μmol photons m−2 s−1). The fractionation experiments provided net growth rates of Synechococcus and HNF by fitting exponential functions to the change in the abundance of cells every 24 h during the first 5 days of the experiments (Figure S1).
DNA Extraction, PCR Cloning and Phylogenetic Analysis
Environmental samples for molecular analysis were collected by filtering water onto 0.22 μm pore size Millipore® Sterivex filters. The filters were immediately flash frozen in liquid nitrogen and stored at −80°C until extraction. DNA and RNA were extracted simultaneously using the AllPrep DNA/RNA Mini Kit (Qiagen, Hilden, Germany) according to manufacturer's instructions with some optimisation for extraction from Sterivex filters as follows. The filters were thawed on ice and 1 mL extraction buffer (990 μl RLT buffer; containing guanidine isothiocyanate + 10 μL ß-mercaptoethanol) was added before incubating for 4 min on a Vortex adapter at medium speed. The resulting lysates were recovered using a 10 mL syringe and used for nucleic acids extraction. DNA samples harvested from Arctic surface water collected in May (80°N, 10.7°E at 1 m depth, 10 L water filtered), August (80°N, 10.8°E at 1 m, 7.5 L filtered) and November (79°N, 6°E, 20 m, 20 L filtered) were selected to amplify the Synechococcus petB marker gene (stations marked on Figure 1 and profiles of picophytoplankton are included in Figure S2). Polymerase chain reaction (PCR) were performed using the petB primers and set-up recommended by Mazard et al. (2012) using 30–40 amplification cycles (iCycler, Bio-Rad, CA, USA). Positive PCR products were purified using the Zymo DNA Clean and Concentrator™-5 kit (Zymo research, CA, USA) and subsequently cloned with the StrataClone™ PCR Cloning Kit (Agilent Technologies, CA, USA) following the manufacturer's instructions. A total of 96 clones from each of the three samples were picked (total 288 clones) and sequenced by LCG Genomic GmbH (Berlin, Germany) using Sanger sequencing. A total of 229 petB sequences were obtained and deposited in the GenBank database (accession no. KX345947–KX346174). These sequences are in the following referred to as “MicroPolar sequences.”
The 229 MicroPolar sequences include 174 unique full-length sequences. Together with 721 petB sequences from a non-redundant reference database (representing most of the genetic diversity so far identified within Prochlorococcus and Synechococcus genera; Farrant et al., 2016), the MicroPolar sequences were used to define operational taxonomical units (OTUs) at 97% identity using Mothur v1.34.4 (Table S2). Since all MicroPolar sequences clustered with clades I and IV reference sequences, a subset of the petB database, comprising only the 117 reference sequences of these clades, as well as the 174 unique MicroPolar petB sequences was used for a subsequent analysis. Phylogenetic reconstructions were based on multiple alignments of petB nucleotide sequences generated using MAFFT v7.164b with default parameters (Katoh and Standley, 2014). A maximum likelihood tree was inferred using PHYML v3.0, (Guindon and Gascuel, 2003) with the HKY + G substitution model, as determined using jModeltest v2.1.4 (Darriba et al., 2012) and estimation of the gamma distribution parameter of the substitution rates among sites and of the proportion of invariable sites. The tree was drawn using iTOL (Letunic and Bork, 2007). The 229 sequences retrieved from MicroPolar were recruited using BLASTN (v2.2.28+) against the full petB database: reads with more than 90% of their sequence aligned and with more than 80% sequence identity to their BLASTN best-hit were taxonomically assigned to their best-hit and subsequently used to build per-sequence read counts tables. Counts were then aggregated by OTUs and relative abundance was computed for each MicroPolar station.
Nutrients
Unfiltered seawater was filled directly from the Niskin bottles into 30 mL acid washed HDPE bottles and stored at −20°C. Nitrite and nitrate ( + ), phosphate () and silicic acid (H4SiO4) were measured on a Smartchem200 (by AMS Alliance) autoanalyser following procedures as outlined in Wood et al. (1967) for + , Murphy and Riley (1962) for and Koroleff (1983) for the determination of H4SiO4. The determination of was done by reduction to on a built-in cadmium column, which was loaded prior to every sample run. Seven-point standard curves were made prior to every run. Two internal standards and one blank were inserted for every 8 samples and these were used to correct for any drift in the measurements. Concentration of was determined directly in fresh samples using ortho-phthaladehyde according to Holmes et al. (1999).
Results
Synechococcus cells were detected by flow cytometry in all samples within the upper 100 m of the water column during all seasons (Figure 3 and Figure S2). The identity of Synechococcus was confirmed by epifluorescence microscopy (Figure 2C) and by sequencing of the petB gene (Figure 7). The closely related genus Prochlorococcus was never detected.
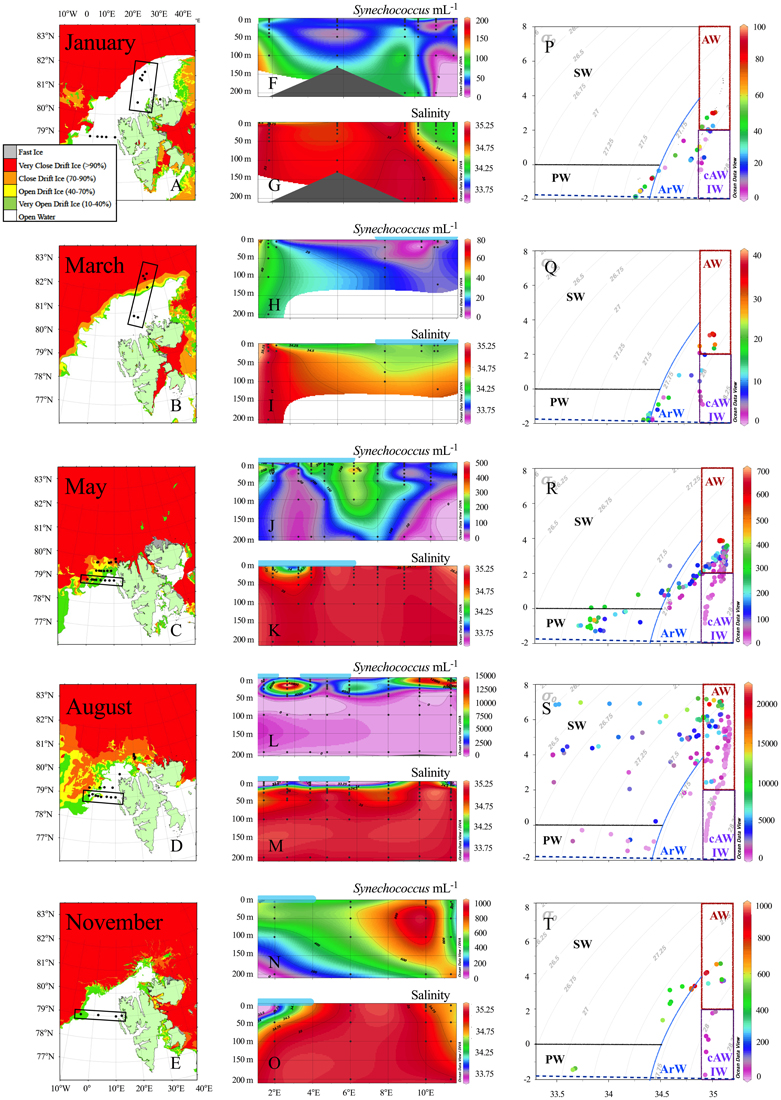
Figure 3. (Left panel) Ice-maps provided from the Norwegian Meteorological Institute (istjenesten@met.no) from following dates; January 10, March 7, May 23, August 12, and November 7, 2014. Transects shown in the middle panel as contour plots are marked with black boxes. (Middle panel) Contour plots showing the abundance (cells mL−1) of Synechococcus and salinity of the upper 200 m from 4 cruises. January transect stretches from North-South between 15 and 20°E, while the remaining transects expands West-East (2–11°E) following the 79°N latitude isoline (see transect marked in boxes left of plots). The horizontal light blue lines above the plots roughly mark the cover of open drift ice. Note different scales for Synechococcus abundance. (Right panel) Potential temperature and salinity (TS) diagram for each month. Data included for all depths 1–1000 m. Synechococcus abundance is given on the z-axis by color gradient (N.B. different scales). Potential density (σ0, kg/m3) isolines overlaid with gray and the surface freezing line is show in dashed blue. Following water masses (Table 1) are marked: Atlantic water (AW), cold Atlantic water or Intermediate water (cAW or IW), which consist mainly of deep water samples (>500 m), Arctic water (ArW), surface water (SW) and Polar water (PW).
Synechococcus Distribution
The highest sampling frequency was obtained in May and August, when the sampling sites were restricted to latitudes below 80°N (May) and 81°N (August) by sea ice (Figure 3), while the most northern samples were acquired in January and March at around 82.5°N. Synechococcus was present in abundances higher than 50 cells mL−1 in 337 samples both within the Atlantic water, Arctic water, Surface water and Polar water (water mass definitions are shown in Table 1). Within the cold surface water (< 2°C, upper 50 m), 60% of the samples contained Synechococcus with abundances ranging from 50 to 4300 cells mL−1. Synechococcus was not detected in the cold Atlantic water or intermediate water masses, which comprise water collected deeper than 500 m (see temperature-salinity plots in Figure 3).
In January, the average abundance in the upper 100 m was 51 cells mL−1, with highest abundance found at 100 m depth (maximum 106 cells mL−1) and generally low numbers in the surface (Figures 3F, 4A). The lowest average abundance of Synechococcus was found in March with 13 cells mL−1 and a maximum abundance that did not exceed 40 cells mL−1 (Figures 3H, 4B). In May the maximum abundance was around 1300 cells mL−1 and the average ± SD was 181 ± 147 cells mL−1 (n = 150; Figures 3J, 4C). The highest Synechococcus abundances were detected in August with a maximum of 21,300 cells mL−1. When averaged for the upper 50 m at most southern stations (79–79.4°N), abundances were 5700 ± 4200 cells mL−1 (n = 61) (Figure 3L) over the whole transect, while abundances at the stations north of 80°N averaged to about 3000 ± 2000 cells mL−1 (n = 27). In November Synechococcus cells were evenly distributed down to 200 m (Figure 4E), with a maximum of 1000 cells mL−1 and an average abundance of 600 ± 250 cells mL−1 (n = 18) within the upper 200 m. The vertical distribution of Synechococcus varied from mainly surface peaks in May (upper 20 m) to maximum abundance at depths greater than 50 m in August and November, to a more vertically uniform distribution in January and March with maxima in abundance at around 100 m depth (Figures 4A–E and Figure S2).
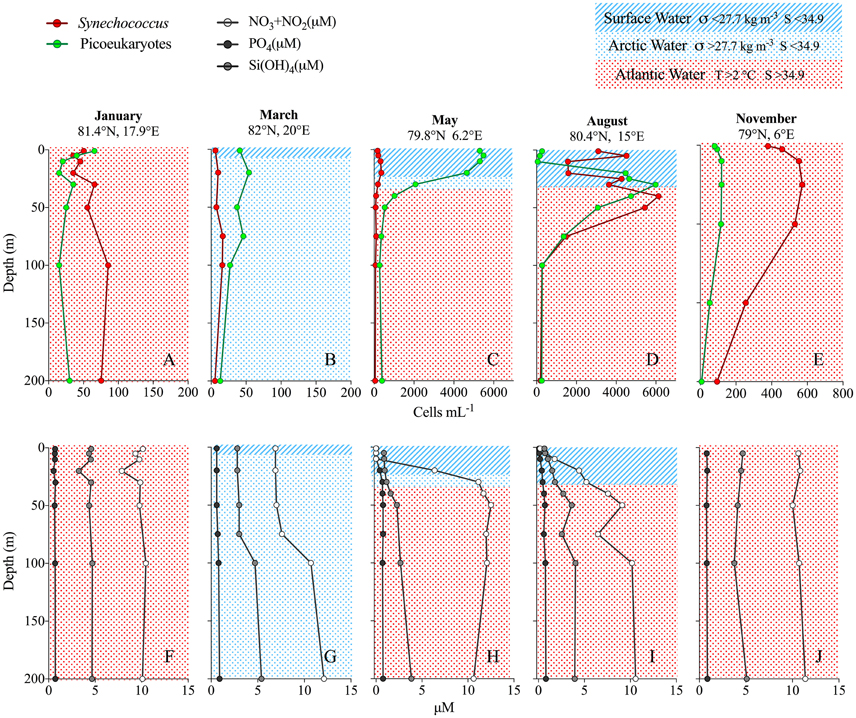
Figure 4. (A–E) profiles of Synechococcus (red) and picoeukaryotes (green) abundance (cells mL−1) from each of the cruises at given coordinates. Notice different scales on the x-axis. (F–J) nutrient concentrations (μM) from the same profiles. Background colors and pattern indicate water masses.
Biotic and Abiotic Environment
The association between phytoplankton abundances and environmental parameters showed that the abundance of both Synechococcus and picoeukaryotes decreased with increasing latitude, but that picoeukaryotes were relatively more abundant at the northernmost stations (Figure 5A). No clear relationship was found for salinity (ranging from 31 to 35 in this study), although the highest Synechococcus abundances were found at salinities >34.5, while picoeukaryotes had their peak abundance at lower salinities of 33.5–34 (Figure 5B). Further, we found picoeukaryotes to be strongly dominant over Synechococcus in 14 out of 17 samples with lowest salinity (31–33), all sampled in August. The abundance of Synechococcus ranged from 250 to 4000 cells mL−1 in these low salinity samples (Figure 3S). The presence of sea ice had no clear effect on the vertical distribution of picophytoplankton but at the ice-covered stations, a subsurface maximum of Synechococcus was most prominent. On the other hand, picoeukaryotes tended to peak near surface in ice-covered stations in March and May, while in August the highest surface maximum of picoeukaryotes was found within the freshwater lens at stations without ice-cover (Figure S2).
The highest water temperatures were measured in August followed by those measured in January. The lowest surface temperatures were recorded in the ice-influenced surface waters in March and May. Temperature was the only parameter that displayed a strong relationship with Synechococcus abundance resulting in an exponential fit (r2 = 0.66, p < 0.005, n = 346; Figure 5C), while picoeukaryotes did not show a similar strong relationship (r2 = 0.31, p < 0.005, n = 372; Figure 5C). Synechococcus was more dominant at stations with low chlorophyll a (i.e., chl a fluorescence) compared to larger nanophytoplankton, which correlated positively to chl a (Figure 5D).
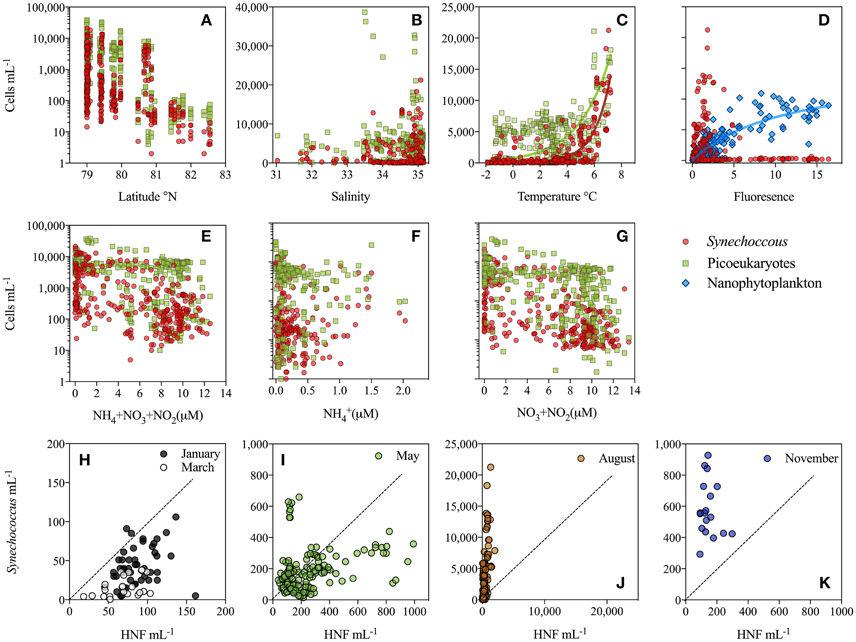
Figure 5. (Two upper panels) Data collected within upper 100 m from all cruises plotted to see how abundance of Synechococcus (red) relates to environmental parameters, such as (A) latitude (B) salinity (C) temperature (D) chlorophyll fluorescence and (E–G) concentration of different sources of mineral nitrogen. Additionally (A,B,E–G) contain abundance of picoeukaryotes (green) and (D) nanophytoplankton (blue). Notice log-scale for (A,B,E–G). (Lower panel) (H–K) Synechococcus abundance (mL−1) plotted against HNF abundance during the different months (indicated by color) within the upper 200 m. The broken line illustrates the one-to-one line. Notice different y-axis between months. Only samples with Synechococcus abundance >20 cells mL−1 were included.
Nutrients were evenly distributed over the upper 200 m in the winter months (January to November), although a slightly lower concentration was observed in March within the upper 100 m (Figures 4F,G,J). In May and August all nutrients were depleted in the upper 10–20 m, with reaching the lowest values (Figures 4H,I). reached the highest values around 2 μM in August at depths below 20 m. At high N concentrations (>2 μM; Figure 5E) Synechococcus were generally less abundant than picoeukaryotes, while under low N conditions they were equally numerous. When looking at the N sources separately it appears that at > 0.5 μM, Synechococcus increased at higher levels, whereas they decreased with increasing + (Figures 5F,G).
The abundance of HNF increased during the summer months, from less than 200 cells mL−1 in the winter months up to 1000 and 1500 HNF mL−1 in May and August, respectively (Figures 5H–K). Synechococcus and HNF abundances generally showed a positive relationship within the upper 100 m. In January and March, Synechococcus and HNF cell numbers were within the same order of magnitude, but with slightly more HNF than Synechococcus (i.e., below the dotted line; Figure 5H). In May highest Synechococcus abundances were found at the lowest HNF abundance and vice versa (Figure 5I). In August, Synechococcus was generally 10 times more abundant than HNF, a trend also observed in November, although less pronounced (Figures 5J,K).
Growth and Microbial Interactions
Net-growth rates of Synechococcus and HNF were estimated from four different size fractions (< 3, < 5, < 10, and < 90 μm) from each of the five cruises and summarized in Figure 6 (for abundances during incubation see Figure S1). Synechococcus showed positive net growth in 9 out of 20 experiments mainly in January and March. Positive growth rates ranged from 0.01 to 0.13 d−1. HNF showed positive growth in 14 out of 20 experiments, displaying a maximum growth rate of 0.45 d−1 when water was filtered through a 5 μm mesh (Treat < 5 μm) in January, otherwise the highest HNF growth rates were measured in May ranging from 0.13 to 0.3 d−1. In January, November, and August HNF growth was reduced to close to zero after filtering in the Treat < 90 μm and in March HNF showed negative growth in all treatments. Synechococcus showed positive growth in January, March in all size-fractions and in the Treat < 90 μm in May, which became strongly dominated by Phaeocystis sp. and where both HNF, picoeukaryotes and heterotrophic bacteria increased in abundance simultaneously. Synechococcus had the strongest negative growth in August and in the Treat < 3 μm in May (Figure 6). In summary, we measured a positive growth of Synechococcus and negative growth of HNF in March, but in general negative Synechococcus and positive HNF growth in May, August, and November. Only in January and in the May < 90 μm treatment, both Synechococcus and HNF displayed positive net growth. Corresponding to the seasonal changes in abundance (Figures 5H–K) the prey:HNF ratio (prey being the sum of all picoplankton; Synechococcus + picoeukaryotes + heterotrophic bacteria) of the initial community was highest in May i.e., most prey per HNF grazer and lowest in August, when HNF were more abundant. Generally, the maximum growth rates of Synechococcus were found when prey:HNF was at its highest (Figure S1).
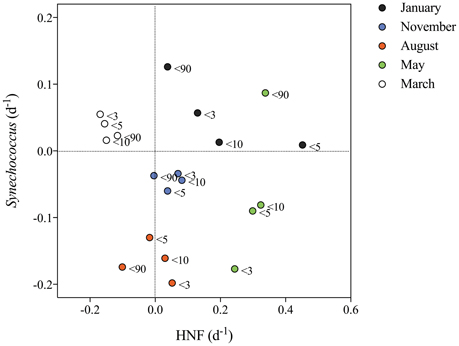
Figure 6. Net growth rates (d−1) of Synechococcus plotted against HNF net-growth. Net growth rates are obtained from the fractionation experiments from each cruise where an exponential growth curve was fitted to the change in abundance of the respective cells during a 5-day period (Figure S1). The color indicates the month and the legend at each point indicates the size-fraction treatment from which the values were obtained.
Synechococcus Diversity
The gene petB, which has proved to display a high taxonomic resolution for picocyanobacteria (Mazard et al., 2012), was used as phylogenetic marker for Synechococcus genetic diversity. Only petB sequences related to clade I and IV were retrieved from our dataset (MicroPolar). Based on a petB reference database (including 117 sequences from clade I and IV, described in Farrant et al., 2016), enriched with the 174 unique petB sequences retrieved from MicroPolar samples, 41 OTUs were defined at 97% ID within clade I and IV (Figure 7). The petB sequences obtained in the present study correspond more specifically to sub-clades Ib and IVb, with a clear dominance of subclade Ib. Although none of these 41 OTUs form a new subclade, 17 OTUs were composed of only MicroPolar sequences and were not represented in the previous reference database (colored branches, Figure 7). In May sub-clade Ib was the only one present, whereas subclade IVb appeared in August and increased in relative abundance in November, indicating seasonal changes in the community composition. Seasonality was also found within subclade Ib. The majority of sequences obtained in August and November belonged to two specific OTUs (Arctic732-2b_Ib_IA and Arctic732-35b_Ib_IA), which mostly gather reference sequences from the Barents Sea (“Arctic,” 72.5°N, 19.57°W) and the North Atlantic Ocean (The Extended Ellett Line; “EEL,” 57–63°N). In contrast, sequences retrieved from samples harvested in May were more evenly distributed over all other OTUs defined within subclade Ib that mainly gather sequences from The Atlantic Meridional Transect (“AMT,” http://www.amt-uk.org/) and the North Sea (“MICROVIR” cruise 50–60°N).
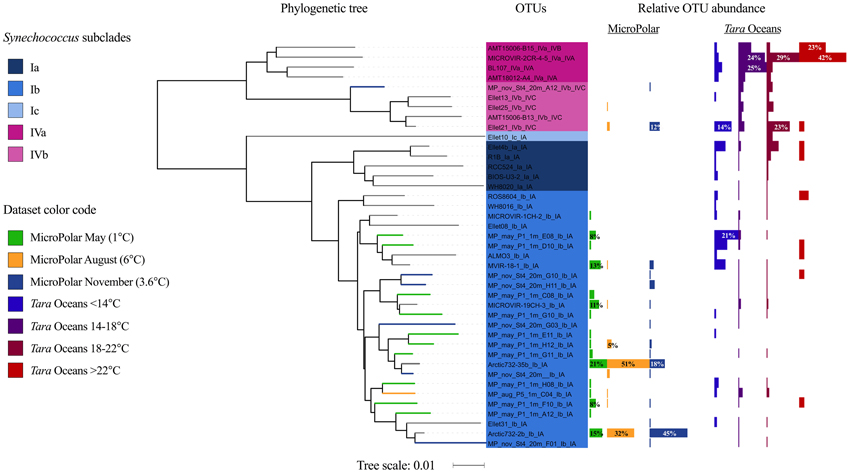
Figure 7. (Left panel) Phylogenetic tree of the 41 petB OTUs at 97% ID, representative of the genetic diversity of Synechococcus within clades I and IV in the reference database (117 sequences) and in three MicroPolar samples (174 sequences). The colored thick branches indicate OTUs that are unique to the MicroPolar study (named MP_month_station_depth_) and colored according to the sampling month: May (green), August (orange) and November (blue). (Right panel) Relative abundance of the OTUs in each MicroPolar months (following the same color code as the branches) and in Tara Oceans stations grouped by surface water temperature ranges of the sampling site. The relative abundance is additionally given in percentage on selected bars.
In order to assess whether the genetic populations sampled in MicroPolar cruises could be related to other cold-water populations, we also recruited Illumina reads from 62 surface water metagenomes collected during the Tara Oceans cross-ocean ecosystem study using the same petB database (Karsenti et al., 2011; Farrant et al., 2016) (https://doi.pangaea.de/10.1594/PANGAEA.840718, note that the Tara Oceans samples analyzed here do not include recent Arctic samples from the latest Tara Ocean cruise as they are not yet published). These data showed that the two most abundant MicroPolar OTUs in subclade Ib (Arctic732-2b_1b_1A and Arctic732-35b_1b_1A) had a low relative abundance in Tara Oceans stations. Other OTUs identified in MicroPolar samples were also poorly represented in the Tara Oceans dataset, with the notable exception of two subclade Ib OTUs, “MP_may_P1_1m_E08_Ib_I” and “MP_may_P1_1m_D10_Ib_IA” (formed only of MicroPolar sequences), that were dominant in Tara Oceans coldest stations (< 14°C), and of the subclade IVb OTU “Ellet21_IVb_IVC” present in the Tara Oceans dataset at all temperatures and especially at cold (< 14°C) and intermediate (18–22°C) temperatures. Other MicroPolar OTUs were detected at a similarly low level in all temperature ranges of Tara Oceans stations.
Discussion
Arctic Adaptation; Synechococcus vs. Micromonas
For the first time we here documented a high abundance of Synechococcus in the Atlantic gateway to the Arctic Ocean north of 79°N. Synechococcus is generally not thought to be part of the picophytoplankton community in Arctic water masses (e.g., Pedrós-Alió et al., 2015), which has repeatedly been found to be dominated by picoeukaryotes, such as Micromonas spp. (Not et al., 2005). Li et al. (2013) do document their existence in the Canadian Basin of the Arctic proper although as a very small fraction (2%) of the total picophytoplankton community at the only one station higher north than 70°. Arctic Micromonas spp. differ from Micromonas genotypes identified elsewhere in the World Ocean (Lovejoy et al., 2007), with these Arctic types being adapted to low temperatures. Similarly, by combining our observations with data from the Tara Ocean we confirmed the latitudinal shift previously described within the Synechococcus genus between the warm-adapted clades II and III and the cold-adapted clades I and IV (Zwirglmaier et al., 2008; Mazard et al., 2012; Farrant et al., 2016). Interestingly, clade IV was clearly dominating in Atlantic waters from the Tara Oceans dataset and its relative contribution seemed to increase with temperature in August and November in MicroPolar samples, while clade I appeared to dominate in colder Arctic waters. Thus, although this would need to be confirmed by physiological characterization of representative strains, it suggests that clade I could be adapted to colder waters than clade IV. Overall, it seems that temperature is the main driver of Synechococcus abundance and diversity in this area.
In laboratory experiments using isolates from tropical sites, Synechococcus has been found not to grow at temperatures below 10°C (Mackey et al., 2013), even though they have been observed in nature at temperatures as cold as 2°C (Shapiro and Haugen, 1988), and 0°C (Gradinger and Lenz, 1995). Our deck incubation experiments showed that northern Synechococcus populations can actually grow at 2°C, although with a quite low growth rate (maximum of 0.13 d−1), suggesting a physiological adaptation of Arctic populations to low temperatures that further supports the existence of Synechococcus thermotypes (Pittera et al., 2014). This hypothesis is strengthened by our findings that many MicroPolar sequences formed new OTUs, unveiling an important novel genetic diversity (especially within clade I), which seems to be specific to this geographic area (17 OTUs out of the 41 OTU identified within clades I and IV). Furthermore, sequences obtained from August and November are mainly found in two OTUs within subclade Ib, gathering reference sequences retrieved only at high latitude from the Barents Sea (72°N) and the North Atlantic Ocean (57°N), but hardly detected in the Tara Oceans dataset. Altogether, these results point toward the existence of Synechococcus populations endemic to these Arctic or subarctic areas.
The peak-values of Synechococcus were clearly associated with the Atlantic inflow (salinity > 34.9) and abundances decreased exponentially with decreasing temperature and were most often low in ice-associated water. This, along with the tendency of decreasing concentrations with decreasing salinity, is in accordance with the suggestion of Synechococcus being an indicator of saline Atlantic water transported into the Arctic (Murphy and Haugen, 1985; Gradinger and Lenz, 1995) as well as the low tolerance to wide salinity ranges of obligate marine Synechococcus (Waterbury et al., 1986). It should also be noted that although Synechococcus peak abundances were found in the relatively warm, saline Atlantic water, equally high abundances were observed in discrete samples from non-Atlantic water masses throughout the year (Figure 3), indicating the potential of Synechococcus to adapt to cold, low saline water, as also suggested by Nelson et al. (2014) for Canadian Arctic Synechococcus. The observed maximum abundance of picoeukaryotes, on the other hand, was found at a salinity of 33.5 and they were in general less affected by low salinities than Synechococcus. The dominance of picoeukaryotes over Synechococcus in the Arctic region may thus be connected to their capacity to stand a wide range of salinities in addition to an adaptation to low temperature. As only a few of our samples had a low salinity (17 surface samples in August have salinity < 33), more efforts are needed to confirm this trend. In the Canada Basin of the Arctic Ocean proper Synechococcus abundance of 60 cell mL−1 was found at salinities substantially lower than 33 (Li et al., 2013).
The extreme changes in light conditions in polar environments may also have been a driver for the diversification of the Synechococcus populations. However, in contrast to Prochlorococcus, obvious light partitioning is usually not observed for Synechococcus (Scanlan et al., 2009) since only one study reported a vertical partitioning of some Synechococcus genotypes so far (Gutiérrez-Rodríguez et al., 2014). In our incubations Synechococcus surprisingly showed a net growth in January and March when light was absent or low, respectively, while picoeukaryotes did not grow (data not shown) (Figure 6). The ability of Synechococcus to grow under very low light conditions is presumably related to their capacity to consume dissolved organic matter (Palenik et al., 2003; Cottrell and Kirchman, 2009). Yelton et al. (2016) indeed found that the genetic potential for mixotrophy in picocyanobacteria (through osmotrophy) is globally distributed. Although this still needs to be confirmed by laboratory experiments, it is possible that Synechococcus OTUs detected in November, when there is no light, belong to mixotrophic populations that are adapted to slow growth in the dark. Picoeukaryotes may use another mixotrophic strategy, i.e., bacterial grazing, to sustain growth during dark months (Sanders and Gast, 2012). Our observations that Synechococcus can be more abundant than picoeukaryotes in the Arctic in autumn and winter (Figure 4) are consistent with previous results [Gradinger and Lenz, 1995; unpublished results from Adventfjorden, Svalbard (I. Kessel Nordgård, personal communication)] and may suggest that cyanobacterial osmotrophy is a more efficient strategy than picoeukaryotic phagotrophy to survive in the dark.
Grazing on Synechococcus
The highest Synechococcus abundances were observed when concentrations were low. Hence, there is no reason to believe that they were resource controlled. The tendency of increased growth when potential grazers were removed, rather points at a top-down control. The all-year-round presence of heterotrophic flagellates (HNF), considered to be their main predators (Sanders et al., 1992; Christaki et al., 2001; Kuipers et al., 2003; Zwirglmaier et al., 2009) indeed allows for grazer control of the Synechococcus populations. Still, grazing losses of Synechococcus are challenging to estimate as potential grazers can include various nano—but also microzooplankton and the specific loss also depends on the presence of other prey types (i.e., bacteria and picoeukaryotes; Pernthaler, 2005). This is illustrated by the different outcomes of successively removing various grazer fractions, which in March, August and November did not result in different growth patterns, but in January and May led to higher growth rates of Synechococcus when organisms larger than 90 μm were removed (Figure S1). Thus, this may reflect a trophic cascade where the microzooplankton graze on HNF and thereby release picoplankton from grazing pressure in the < 90 μm fraction. In March, August and November, however, there was little effect of size fractionation, which indicates that small HNF (< 3 μm) were the main grazers of picoplankton and that these were not grazer-controlled themselves. Exactly “who” were the most important Synechococcus grazers is not possible to deduce from the presented data, and probably varies over the season. In addition, infection by viruses probably also functions as a top down regulator of these Synechococcus populations (Sandaa and Larsen, 2006), however virus counts remained relatively constant in all five experiments (data not shown). Still, we did find the highest net growth rates for Synechococcus when the HNF abundance was lowest (January and March) as well as the highest Synechococcus in situ abundance in water with low HNF concentration (and vice versa), which is in accordance with the view that HNF control their abundance and distribution at large. The picoeukaryote abundance did not follow the same patterns (data not shown), suggesting that they may have different predators. The fact that autotrophs, such as Synechococcus and picoeukaryotes, persist during winter in very low abundances further suggests that low encounter rates between predator and prey in the highly diluted wintry environment release the picophytoplankton from grazing pressure and allows survival despite adverse growth conditions (Kiørboe, 2008). The experiments also illustrate that Synechococcus in both January, March and August have the highest growth rates in the fractions where the total prey:HNF ratio is highest, indicating that Synechococcus might escape the grazers when other potential prey organisms are relatively abundant.
Synechococcus As an Active Player in the Arctic and Future Implications
It may be questioned whether the observed occurrence of Synechococcus was simply a result of advection and passive transport via the Atlantic water inflow. Since the highest measured abundances were found within the core of the Atlantic water, this probably represents the major source. The seasonal maximum Synechococcus abundance, which was observed in August, does however coincide in time with the seasonal Synechococcus bloom further south along the Norwegian coast. Given the average transportation time is at its minimum in summer (Fahrbach et al., 2001), it seems unlikely that the encountered seasonal change in Synechococcus community we observed was a mere product of advection of Atlantic water. Moreover, the spatial and temporal distribution of clades and OTUs as well as the observed growth at low temperatures when released from grazing pressure, rather suggests that at least some of the observed Synechococcus populations are adapted to Arctic conditions and are indigenous to these waters.
Due to their small size (1.1 ± 0.4 μm diameter in the subarctic Atlantic; Paulsen et al., 2015), Synechococcus cells are largely grazed by HNF and microzooplankton (Christaki et al., 1999, 2005). This implies that their biomass production will be largely recycled in the microbial food web and thus be of minor contribution to higher trophic levels in the grazing food web. Even at the highest abundances observed in this study, Synechococcus only constitutes a minor part of the Arctic epipelagic carbon and energy pool (e.g., 21,000 cells mL−1 is equal to 2.3 μg C L−1, assuming a diameter of 1.1 μm and 250 fg C μm−3; Kana and Glibert, 1987) relative to the total phytoplankton biomass of 42 μg C L−1 (assuming a carbon to chl a conversion of 30). A warmer Arctic ocean that may favor Synechococcus at the expense of larger phytoplankton species (Flombaum et al., 2013) implies that more energy and carbon could be retained within the microbial food web, further reducing the contribution of Arctic primary production to the top of the food chain.
Author Contributions
MP led the collection and analysis of data, and the writing of the paper. All other authors contributed to writing the paper and in addition AL, OM, RS, and LS helped collecting data and performing experiments. LG, HD, OM, and GB helped analyse the data and prepare figures.
Funding
The work was conducted by the projects MicroPolar (RCN 225956) and CarbonBridge (RCN 226415), both funded by the Norwegian Research Council. HD and LG were supported by the French “Agence Nationale de la Recherche” Program SAMOSA (ANR-13-ADAP-0010).
Conflict of Interest Statement
The authors declare that the research was conducted in the absence of any commercial or financial relationships that could be construed as a potential conflict of interest.
Acknowledgments
We thank the helpful crew of RV Helmer Hanssen and RV Lance and to the MicroPolar and CarbonBridge teams for always being helpful during sample collection. A special thank you to Jean-Éric Tremblay for providing ammonium measurements and to Sophie Radeke for steadfast assistance at the flow cytometer and to Hilde M. K. Stabell for making the clone library. We also thank Daniel Vaulot for fruitful discussions.
Supplementary Material
The Supplementary Material for this article can be found online at: http://journal.frontiersin.org/article/10.3389/fmars.2016.00191
Figure S1. The abundance (cells mL−1) of Synechococcus (red) and HNF (blue) plotted on the left y-axis during the first 5 days of fractionation experiments performed during the 5 cruises. The fractions < 90 μm (A-E), < 10 μm (F-J), < 5 μm (K-O) and < 3 μm (Q-U) are represented on each row. Exponential functions were fitted (lines) to the abundance providing the net growth rates (μ) given in the upper left corner for Synechococcus (red) and HNF (blue). The total prey (sum of Synechococcus, picoeukaryotes and heterotrophic bacteria) to HNF ratio is plotted for each triplicate on he right y-axis (open black circles), the black line connects the daily average prey:HNF ratio.
Figure S2. The abundance (cells mL−1) of Synechococcus (red) and picoeukaryotes (green) for all months within the upper 500 m, except for March where profiles are shown down to 1000 and 3000 m. Horizontal light blue lines mark the stations that were influenced by sea ice. Note the different x-axis for different months. Coordinates are given for each station above each graph.
Table S1. Environmental from the cruises containing: dates (mm/dd/yy), latitude and longitude of stations (decimal degrees), depth (m), flow cytometer counts of Synechococcus, picoeukaryotes, nanophytoplankton, heterotrophic bacteria, and nanoflagellates (cells mL−1), the growth rates Synechococcus and HNF (d−1) from the < 90 μm incubation, salinity, temperature and potential temperature (°C), CTD-fluorescence (RUF), total chl a and the chl a fraction >10 μm (μg L−1), and nutrients (, , , PO, Si(OH)4 (μM). N.B. nutrients from January, May and August are not included here but will be available in Randelhoff et al. submitted.
Table S2. Sequence ID of the members of each Operational Taxonomical Unit (OTU) defined for petB at 97% nucleotide sequence identity.
References
Boyd, T. J., and D'Asaro, E. A. (1994). Cooling of the West Spitsbergen Current: wintertime observations west of Svalbard. J. Geophys. Res. 99, 22597–22618. doi: 10.1029/94JC01824
Christaki, U., Courties, C., Massana, R., Catala, P., Lebaron, P., Gasol, J. M., et al. (2011). Optimized routine flow cytometric enumeration of heterotrophic flagellates using SYBR Green I. Limnol. Oceanogr. Methods 9, 329–339. doi: 10.4319/lom.2011.9.329
Christaki, U., Giannakourou, A., Wambeke, F. V., and Grégori, G. (2001). Nanoflagellate predation on auto- and heterotrophic picoplankton in the oligotrophic Mediterranean Sea. J. Plankton Res. 23, 1297–1310. doi: 10.1093/plankt/23.11.1297
Christaki, U., Jacquet, S., Dolan, J. R., Vaulot, D., and Rassoulzadegan, F. (1999). Growth and grazing on Prochlorococcus and Synechococcus by two marine ciliates. Limnol. Oceanogr. 44, 52–61. doi: 10.4319/lo.1999.44.1.0052
Christaki, U., Vázquez-Domínguez, E., Courties, C., and Lebaron, P. (2005). Grazing impact of different heterotrophic nanoflagellates on eukaryotic (Ostreococcus tauri) and prokaryotic picoautotrophs (Prochlorococcus and Synechococcus). Environ. Microbiol. 7, 1200–1210. doi: 10.1111/j.1462-2920.2005.00800.x
Cokelet, E. D., Tervalon, N., and Bellingham, J. G. (2008). Hydrography of the West Spitsbergen Current, Svalbard Branch: autumn 2001. J. Geophys. Res. Ocean. 113, 1–17. doi: 10.1029/2007JC004150
Cottrell, M., and Kirchman, D. (2012). Virus genes in Arctic marine bacteria identified by metagenomic analysis. Aquat. Microb. Ecol. 66, 107–116. doi: 10.3354/ame01569
Cottrell, M. T., and Kirchman, D. L. (2009). Photoheterotrophic microbes in the arctic ocean in summer and winter. Appl. Environ. Microbiol. 75, 4958–4966. doi: 10.1128/AEM.00117-09
Darriba, D., Taboada, G. L., Doallo, R., and Posada, D. (2012). jModelTest 2: more models, new heuristics and parallel computing. Nat. Methods 9, 772–772. doi: 10.1038/nmeth.2109
Doolittle, D. F., Li, W. K. W., and Wood, A. M. (2008). Wintertime abundance of picoplankton in the Atlantic sector of the Southern Ocean by. Nov. Hedwigia 133, 147–160.
Fahrbach, E., Meincke, J., Østerhus, S., Rohardt, G., Schauer, U., Tverberg, V., et al. (2001). Direct measurements of volume transports through Fram Strait. Polar Res. 20, 217–224. doi: 10.1111/j.1751-8369.2001.tb00059.x
Farrant, G. K., Doré, H., Cornejo-Castillo, F. M., Partensky, F., Ratin, M., Ostrowski, M., et al. (2016). Delineating ecologically significant taxonomic units from global patterns of marine picocyanobacteria. Proc. Natl. Acad. Sci. U.S.A. 113, E3365–E3374. doi: 10.1073/pnas.1524865113
Flombaum, P., Gallegos, J. L., Gordillo, R. A., Rincón, J., Zabala, L. L., Jiao, N., et al. (2013). Present and future global distributions of the marine Cyanobacteria Prochlrococcus and Synechococcus. Proc. Natl. Acad. Sci. U.S.A. 110, 9824–9829. doi: 10.1073/pnas.1307701110
Gradinger, R., and Lenz, J. (1995). Seasonal occurrence of picocyanobacteria in the Greenland Sea and central Arctic Ocean. Polar Biol. 15, 447–452. doi: 10.1007/BF00239722
Guindon, S., and Gascuel, O. (2003). A simple, fast, and accurate algorithm to estimate large phylogenies by maximum likelihood. Syst. Biol. 52, 696–704. doi: 10.1080/10635150390235520
Gutiérrez-Rodríguez, A., Slack, G., Daniels, E. F., Selph, K. E., Palenik, B., and Landry, M. R. (2014). Fine spatial structure of genetically distinct picocyanobacterial populations across environmental gradients in the Costa Rica Dome. Limnol. Oceanogr. 59, 705–723. doi: 10.4319/lo.2014.59.3.0705
Holmes, R. M., Aminot, A., Kérouel, R., Hooker, B. A., and Peterson, B. J. (1999). A simple and precise method for measuring ammonium in marine and freshwater ecosystems. Can. J. Fish. Aquat. Sci. 56, 1801–1808. doi: 10.1139/f99-128
Jürgens, K., Gasol, J. M., and Vaqué, D. (2000). Bacteria-flagellate coupling in microcosm experiments in the Central Atlantic Ocean. J. Exp. Mar. Biol. Ecol. 245, 127–147. doi: 10.1016/S0022-0981(99)00156-2
Kana, T. M., and Glibert, P. M. (1987). Effect of irradiances up to 2000 μE m−2s−1 on marine Synechococcus WH7803-I. Growth, pigmentation, and cell composition. Deep Sea Res. 34, 479–495. doi: 10.1016/0198-0149(87)90001-X
Karsenti, E., Acinas, S. G., Bork, P., Bowler, C., de Vargas, C., Raes, J., et al. (2011). A holistic approach to marine eco-systems biology. PLoS Biol. 9:e1001177. doi: 10.1371/journal.pbio.1001177
Katoh, K., and Standley, D. M. (2014). MAFFT: iterative refinement and additional methods. Methods Mol. Biol. 1079, 131–146. doi: 10.1007/978-1-62703-646-7_8
Kiørboe, T. (2008). “Zooplankton feeding rates and bioenergetics,” in A Mechanistic Approach to Plankton Ecology (Oxfordshire: Princeton University Press), 224.
Koroleff, F. (1983). “Determination of nutrients,” in Methods of Seawater Analysis, eds K. Grasshoff, M. Erhardt, and K. Kremling (Weinheim: Verlag Chemie), 125–187.
Kuipers, B., Witte, H., van Noort, G., and Gonzalez, S. (2003). Grazing loss-rates in pico- and nanoplankton in the Faroe-Shetland Channel and their different relations with prey density. J. Sea Res. 50, 1–9. doi: 10.1016/S1385-1101(03)00043-1
Larsen, A., Castberg, T., Sandaa, R. A., Brussaard, C. P. D., Egge, J., Heldal, M., et al. (2001). Population dynamics and diversity of phytoplankton, bacteria and viruses in a seawater enclosure. Mar. Ecol. Prog. Ser. 221, 47–57. doi: 10.3354/meps221047
Letunic, I., and Bork, P. (2007). Interactive Tree Of Life (iTOL): an online tool for phylogenetic tree display and annotation. Bioinformatics 23, 127–128. doi: 10.1093/bioinformatics/btl529
Li, W. K. W., Carmack, E. C., Mclaughlin, F. A., Nelson, R. J., and Williams, W. J. (2013). Space-for-time substitution in predicting the state of picoplankton and nanoplankton in a changing Arctic Ocean. J. Geophys. Res. Ocean 118, 5750–5759. doi: 10.1002/jgrc.20417
Lovejoy, C., Vincent, W. F., Bonilla, S., Roy, S., Martineau, M.-J., Terrado, R., et al. (2007). Distribution, phylogeny, and growth of cold-adapted picoprasinophytes in Arctic seas. J. Phycol. 43, 78–89. doi: 10.1111/j.1529-8817.2006.00310.x
Mackey, K. R. M., Paytan, A., Caldeira, K., Grossman, A. R., Moran, D., McIlvin, M., et al. (2013). Effect of temperature on photosynthesis and growth in marine Synechococcus spp. Plant Physiol. 163, 815–829. doi: 10.1104/pp.113.221937
Marie, D., Partensky, F., Jacquet, S., and Vaulot, D. (1997). Enumeration and cell cycle analysis of natural populations of marine picoplankton by flow cytometry using the nucleic acid stain SYBR Green I. Appl. Environ. Microbiol. 63, 186–93.
Mazard, S., Ostrowski, M., Partensky, F., and Scanlan, D. J. (2012). Multi-locus sequence analysis, taxonomic resolution and biogeography of marine Synechococcus. Environ. Microbiol. 14, 372–386. doi: 10.1111/j.1462-2920.2011.02514.x
Morán, X. A. G., López-Urrutia, À., Calvo-Díaz, A., and Li, W. K. W. (2010). Increasing importance of small phytoplankton in a warmer ocean. Glob. Change Biol. 16, 1137–1144. doi: 10.1111/j.1365-2486.2009.01960.x
Moreira-Turcq, P. F., and Martin, J. M. (1998). Characterisation of fine particles by flow cytometry in estuarine and coastal Arctic waters. J. Sea Res. 39, 217–226. doi: 10.1016/S1385-1101(97)00053-1
Murphy, J., and Riley, J. P. (1962). A modified single solution method for the determination of phosphate in natural waters. Anal. Chim. Acta 26, 31–36. doi: 10.1016/S0003-2670(00)88444-5
Murphy, L. S., and Haugen, E. M. (1985). The distribution and abundance of phototrophic ultraplankton in the North Atlantic. Limnol. Oceanogr. 30, 47–58. doi: 10.4319/lo.1985.30.1.0047
Nelson, R. J., Ashjian, C. J., Bluhm, B. A., Conlan, K. E., Gradinger, R. R., Grebmeier, J. M., et al. (2014). “Biodiversity and biogeography of the lower trophic taxa of the Pacific Arctic Region: sensitivities to climate change,” in The Pacific Arctic Region: Ecosystem Status and Trends in a Rapidly Changing Environment, eds J. M. Grebmeier and W. Maslowski (Dordrecht, NL: Springer Science+Business Media Dordrecht 2014), 269–336.
Not, F., Teissier, P. G., Massana, R., Latasa, M., Marie, D., Colson, C., et al. (2005). Late summer community composition and abundance of photosynthetic picoeukaryotes in Norwegian and Barents Seas. Limnol. Oceanogr. 50, 1677–1686. doi: 10.4319/lo.2005.50.5.1677
Palenik, B., Brahamsha, B., Larimer, F. W., Land, M., Hauser, L., Chain, P., et al. (2003). The genome of a motile marine Synechococcus. Nature 424, 1035–1037. doi: 10.1038/nature01883.1
Patel, A., Noble, R. T., Steele, J. A., Schwalbach, M. S., Hewson, I., and Fuhrman, J. A. (2007). Virus and prokaryote enumeration from planktonic aquatic environments by epifluorescence microscopy with SYBR Green I. Nat. Protoc. 2, 269–276. doi: 10.1038/nprot.2007.6
Paulsen, M. L., Riisgaard, K., Thingstad, T. F., and St. John, M. (2015). Winter −spring transition in the subarctic Atlantic: microbial response to deep mixing and pre-bloom production. Aquat. Microb. Ecol. 76, 49–69. doi: 10.3354/ame01767
Pedrós-Alió, C., Potvin, M., and Lovejoy, C. (2015). Diversity of planktonic microorganisms in the Arctic Ocean. Prog. Oceanogr. 139, 233–243. doi: 10.1016/j.pocean.2015.07.009
Pernthaler, J. (2005). Predation on prokaryotes in the water column and its ecological implications. Nat. Rev. Microbiol. 3, 537–546. doi: 10.1038/nrmicro1180
Pittera, J., Humily, F., Thorel, M., Grulois, D., Garczarek, L., and Six, C. (2014). Connecting thermal physiology and latitudinal niche partitioning in marine Synechococcus. ISME J. 8, 1221–1236. doi: 10.1038/ismej.2013.228
Saito, M. A., Rocap, G., and Moffett, J. W. (2005). Production of cobalt binding ligands in a Synechococcus feature at the Costa Rica upwelling dome. Limnol. Oceanogr. 50, 279–290. doi: 10.4319/lo.2005.50.1.0279
Sandaa, R.-A., and Larsen, A. (2006). Seasonal variations in virus-host populations in Norwegian coastal waters: focusing on the cyanophage community infecting marine Synechococcus spp. Appl. Environ. Microbiol. 72, 4610–4618. doi: 10.1128/AEM.00168-06
Sanders, R. W., Caron, D. A., and Berninger, U.-G. (1992). Relationships between bacteria and heterotrophic nanoplankton in marine and fresh waters: an inter-ecosystem comparison. Mar. Ecol. Prog. Ser. 86, 1–14.
Sanders, R. W., and Gast, R. J. (2012). Bacterivory by phototrophic picoplankton and nanoplankton in Arctic waters. FEMS Microbiol. Ecol. 82, 242–253. doi: 10.1111/j.1574-6941.2011.01253.x
Sato, M., Yoshikawa, T., Takeda, S., and Furuya, K. (2007). Application of the size-fractionation method to simultaneous estimation of clearance rates by heterotrophic flagellates and ciliates of pico- and nanophytoplankton. J. Exp. Mar. Biol. Ecol. 349, 334–343. doi: 10.1016/j.jembe.2007.05.027
Scanlan, D. J., Ostrowski, M., Mazard, S., Dufresne, A., Garczarek, L., Hess, W. R., et al. (2009). Ecological genomics of marine picocyanobacteria. Microbiol. Mol. Biol. Rev. 73, 249–299. doi: 10.1128/MMBR.00035-08
Shapiro, L. P., and Haugen, E. M. (1988). Seasonal distribution and temperature tolerance of Synechococcus in Boothbay Harbor, Maine. Estuar. Coast. Shelf Sci. 26, 517–525.
Sherr, E. B., Sherr, B. F., Wheeler, P. A., and Thompson, K. (2003). Temporal and spatial variation in stocks of autotrophic and heterotrophic microbes in the upper water column of the central Arctic Ocean. Deep Sea Res. I 50, 557–571. doi: 10.1016/S0967-0637(03)00031-1
Simek, K., and Chrzanowski, T. (1992). Direct and indirect evidence of size-selective grazing on pelagic bacteria by fresh-water nanoflagellates. Appl. Environ. Microbiol. 58, 3715–3720.
Sohm, J. A., Ahlgren, N. A., Thomson, Z. J., Williams, C., Moffett, J. W., Saito, M. A., et al. (2016). Co-occurring Synechococcus ecotypes occupy four major oceanic regimes defined by temperature, macronutrients and iron. ISME J. 10, 333–345. doi: 10.1038/ismej.2015.115
Tremblay, G., Belzile, C., Gosselin, M., Poulin, M., Roy, S., and Tremblay, J. (2009). Late summer phytoplankton distribution along a 3500 km transect in Canadian Arctic waters: strong numerical dominance by picoeukaryotes. Aquat. Microb. Ecol. 54, 55–70. doi: 10.3354/ame01257
Tremblay, J.-É., Robert, D., Varela, D. E., Lovejoy, C., Darnis, G., Nelson, R. J., et al. (2012). Current state and trends in Canadian Arctic marine ecosystems: I. Primary production. Clim. Change 115, 161–178. doi: 10.1007/s10584-012-0496-3
Tsai, A. Y., Gong, G. C., Sanders, R. W., and Chiang, K. P. (2013). Relationship of Synechococcus abundance to seasonal ocean temperature ranges. Terr. Atmos. Ocean. Sci. 24, 925–932. doi: 10.3319/TAO.2013.06.17.01(Oc)
Vincent, W. F. (2010). Microbial ecosystem responses to rapid climate change in the Arctic. ISME J. 4, 1087–1090. doi: 10.1038/ismej.2010.108
Vincent, W. F., Bowman, J. P., Rankin, L. M., and Mcmeekin, T. A. (2000). “Microbial biosystems,” in New Frontiers Proceedings of the 8th International Symposium on Microbial Ecology, eds C. R. Bell, M. Brylinsky, and P. Johnson-Green (Halifax, NS: Atlantic Canada Society for Microbial Ecology).
Waleron, M., Waleron, K., Vincent, W. F., and Wilmotte, A. (2007). Allochthonous inputs of riverine picocyanobacteria to coastal waters in the Arctic Ocean. FEMS Microbiol. Ecol. 59, 356–365. doi: 10.1111/j.1574-6941.2006.00236.x
Waterbury, J. B., Watson, S. W., Valois, F. W., and Franks, D. G. (1986). “Biological and ecological characterisation of the marine unicellular cyanobacterium Synechococcus,” in Photosynthetic Picoplankton, eds T. Platt and W. K. W. Li (Ottawa, ON: Canadian Bulletin of Fisheries and Aquatic Sciences), 71–120.
Wood, E. D., Armstrong, F. A. J., and Rich, F. A. (1967). Determination of nitrate in seawater by cadmium-copper reduction to nitrate. J. Biol. Assoc. UK. 47, 23–31.
Yelton, A. P., Acinas, S. G., Sunagawa, S., Bork, P., Pedrós-Alió, C., and Chisholm, S. W. (2016). Global genetic capacity for mixotrophy in marine picocyanobacteria. ISME J. [Epub ahead of print]. doi: 10.1038/ismej.2016.64
Zhang, F., He, J., Lin, L., and Jin, H. (2015). Dominance of picophytoplankton in the newly open surface water of the central Arctic Ocean. Polar Biol. 38, 1081–1089. doi: 10.1007/s00300-015-1662-7
Zubkov, M. V., Burkill, P. H., and Topping, J. N. (2007). Flow cytometric enumeration of DNA-stained oceanic planktonic protists. J. Plankton Res. 29, 79–86. doi: 10.1093/plankt/fbl059
Zwirglmaier, K., Jardillier, L., Ostrowski, M., Mazard, S., Garczarek, L., Vaulot, D., et al. (2008). Global phylogeography of marine Synechococcus and Prochlorococcus reveals a distinct partitioning of lineages among oceanic biomes. Environ. Microbiol. 10, 147–161. doi: 10.1111/j.14622920.2007.01440.x
Keywords: picocyanobacteria, picoeukaryotes, temperature adaptation, petB sequences, flow cytometry, high latitude ecosystems, Svalbard, West Spitsbergen Current
Citation: Paulsen ML, Doré H, Garczarek L, Seuthe L, Müller O, Sandaa R-A, Bratbak G and Larsen A (2016) Synechococcus in the Atlantic Gateway to the Arctic Ocean. Front. Mar. Sci. 3:191. doi: 10.3389/fmars.2016.00191
Received: 28 June 2016; Accepted: 21 September 2016;
Published: 05 October 2016.
Edited by:
Connie Lovejoy, Laval University, CanadaReviewed by:
David J. Scanlan, University of Warwick, UKWilliam Li, Fisheries and Oceans Canada, Canada
Copyright © 2016 Paulsen, Doré, Garczarek, Seuthe, Müller, Sandaa, Bratbak and Larsen. This is an open-access article distributed under the terms of the Creative Commons Attribution License (CC BY). The use, distribution or reproduction in other forums is permitted, provided the original author(s) or licensor are credited and that the original publication in this journal is cited, in accordance with accepted academic practice. No use, distribution or reproduction is permitted which does not comply with these terms.
*Correspondence: Maria L. Paulsen, bWFyaWEubC5wYXVsc2VuQHVpYi5ubw==