 Sergej Olenin1*
 Aleksas Narščius2Stephan Gollasch3Maiju Lehtiniemi4
 Agnese Marchini5
 Dan Minchin1,6
 Greta Srėbalienė1
- 1Marine Science and Technology Centre, Klaipėda University, Klaipėda, Lithuania
- 2Open Access Centre for Marine Research, Klaipėda University, Klaipėda, Lithuania
- 3GoConsult, Hamburg, Germany
- 4Marine Research Center, Finnish Environment Institute, Helsinki, Finland
- 5Department of Earth and Environmental Sciences, University of Pavia, Pavia, Italy
- 6Marine Organism Investigations, Killaloe, Ireland
Several legal and administrative instruments aimed to reduce the spread of non-indigenous species, that may pose harm to the environment, economy and/or human health, were developed in recent years at international and national levels, such as the International Convention for the Control and Management of Ship's Ballast Water and Sediments, the International Council for the Exploration of the Sea Code of Practice on the Introductions and Transfers of Marine Organisms, the EU Regulation on Invasive Alien Species and the Marine Strategy Framework Directive, the US Invasive Species Act, the Biosecurity Act of New Zealand, etc. The effectiveness of these instruments can only be measured by successes in the prevention of new introductions. We propose an indicator, the arrival of new non-indigenous species (nNIS), which helps to assess introduction rates, especially in relation to pathways and vectors of introduction, and is aimed to support management. The technical precondition for the calculation of nNIS is the availability of a global, continuously updated and verified source of information on aquatic non-indigenous species. Such a database is needed, because the indicator should be calculated at different geographical scales: (1) for a particular area, such as port or coast of a country within a Large Marine Ecosystem (LME); (2) for a whole LME; and (3) for a larger biogeographical region, including two or more neighboring LMEs. The geographical scale of nNIS helps to distinguish between a primary introduction and secondary spread, which may involve different pathways and vectors. This, in turn, determines the availability of management options, because it is more feasible to prevent a primary introduction than to stop subsequent secondary spread. The definition of environmental target, size of assessment unit and possible limitations of the indicator are also discussed.
Introduction
The Convention on Biological Diversity (CBD, 1992) set an ambitious goal “…significant reduction in the current rate of biodiversity loss…,” calling to “…Prevent the introduction of, control or eradicate those alien species which threaten ecosystems, habitats or species….” Several legally binding and advisory instruments, aimed to reduce the spread of NIS species by particular vectors of introduction, were developed in recent years at international level. For example, the International Convention for the Control and Management of Ship's Ballast Water and Sediments (BWMC) (IMO, 2004), which shall come into force in September 2017 (IMO, 2016) defines procedures and sets technical requirements to reduce the threat of harmful aquatic organisms and pathogens transferred by ships ballast water. Another instrument is the Code of Practice on the Introductions and Transfers of Marine Organisms by the International Council for the Exploration of the Sea (ICES, 2005; Gollasch, 2007) recommends procedures and practices to diminish the risks of detrimental effects from the intentional introduction and transfer of marine and brackish water organisms.
There are numerous regional multi-lateral treaties, conventions, and agreements in place that address the issues of aquatic bioinvasions, such as the Barcelona Convention (Mediterranean Sea), the Helsinki Commission (Baltic Sea), the OSPAR Commission (North-East Atlantic including the North Sea), the UNEP regional Seas programs, the South Pacific Regional Environmental Program, and the Asia-Pacific Economic Cooperation (Hewitt et al., 2009 and references therein). Also, several nations have established regulatory frameworks for the prevention and management of intentional and accidental bioinvasions, for example, the US Invasive Species Act, the Biosecurity Act of New Zealand (Hewitt et al., 2009 and references therein).
At the European level, the EU Regulation on the Prevention and Management of the Introduction and Spread of Invasive Alien Species (2014) was adopted, indicating, inter alia, “…Prevention is generally more environmentally desirable and cost-effective than reaction after the fact, and should be prioritized….” Here, the clear distinction is made between the primary introduction of an alien species, which should be prevented, and its secondary spread within a region, which, in the aquatic world, practically seems to be unmanageable.
All the above legal and administrative, global and regional instruments require a robust, scientifically sound indicator(s) to measure their effectiveness in terms of reducing unwanted invasions. For example, the European Environment Agency (EEA) proposed an indicator “…Cumulative numbers of alien species in Europe since 1900…” to measure progress toward achieving the CBD goal (EEA, 2007). Counts from different countries were assigned to decades, data were provided by national authorities and only established species with self-sustaining populations were considered (EEA, 2012). In addition to the EEA proposal, the Marine Strategy Framework Directive (European Commission, 2008) includes within the 11 qualitative descriptors the non-indigenous Species (NIS) as one of the elements to be assessed to determine if an ecoregion is in good environmental status or not. To assess it, the European Commission (2010) proposed a series of indicators which include “…Trends in abundance, temporal occurrence and spatial distribution in the wild of non-indigenous species…,” similar to the CBD indicator by EEA (2007). It was this indicator that was used by most Contracting Parties in their initial environment status assessments for the MSFD (ICES, 2016).
An elevated number of NIS generally indicates a greater level of exposure of a marine area to anthropogenic activity (Olenin et al., 2010). However, in contrast to most indicators of human impacts, the Cumulative number of NIS fails to show a direct correlation with environmental degradation gradients (MacDougall et al., 2006). Whether, or not, NIS become established is only partly related to the environmental status of an area; and it also depends on biological traits of the species (e.g., Cardeccia et al., in press), integrity of native ecosystems (Didham et al., 2005) and availability of resources (Davis, 2009). The “…Cumulative number of NIS…” as such, is of lesser importance for management than the “…Number of species transferred by a vector(s)…,” which aids any practical prioritization of preventive measures. This is because for many early introductions taxonomic knowledge was incomplete and records were seldom kept (Carlton, 2009), also the presence of a NIS often remained unnoticed until they will have become obvious and created some nuisance impact (Olenin and Minchin, 2011). As it was shown in a recent regional overview (Ojaveer et al., accepted) even in a marine region with a long history of biodiversity research, such as the Baltic Sea, where due to natural circumstances, and recent geological history, species richness is low and any new arrival is likely to be more visible than elsewhere, there is a weak availability of introduction event records from before the 1950s. It is unfortunate that uncertainty is an inherent component in bioinvasion studies and as a result, the “Cumulative number of NIS” is compromised by gaps of knowledge, especially during the early periods when introductions were not effectively recorded. It is for this reason that the value of this indicator in measuring the response of marine systems to human pressures (sensu Borja et al., 2016) is limited.
We present a new indicator “Arrival of new NIS” (nNIS), aimed to establish “windows” (or hotspots) of primary introductions entering regional seas and to reveal the main pathways/vectors involved. The indicator is suitable for all easily recognizable taxa arriving at different geographical scales from a country coast within a Large Marine Ecosystem (LME, sensu Sherman, 1991) to an entire LME or a larger biogeographical level, that could involve two, or more, neighboring LMEs. We present the calculation method, show some applications of the indicator to a set of study-cases at different geographical levels and discuss its advantages and possible limitations.
Materials and Methods
Information Support, Introduction Event, and Recipient Region
This study is based on data accumulated in the Information system on Aquatic Non-Indigenous and Cryptogenic Species–AquaNIS, where all geographic information is arranged in a hierarchical order ranging from oceans, ocean sub-regions, LMEs, sub-regions of LMEs to smaller entities, such as ports (Olenin et al., 2014; AquaNIS, 2016). All countries are linked to relevant LMEs or LME sub-regions. This provides database search combinations “country + LME” or “country + LME sub-region” for different coasts and for a country that borders different seas, e.g.,: “Germany within the LME 23 Baltic Sea,” “Italy within the Adriatic Sea, a sub-region of LME 26 Mediterranean.” Such data may also be aggregated at different geographical scales and in different combinations, e.g., “LME 22 North Sea + LME 23 Baltic Sea,” or “Germany within both the North Sea and Baltic Sea coasts,” which would be needed to define the level of primary introduction.
The basic data entry in AquaNIS is an introduction event record, documenting a species introduction into a recipient region, defined as a country or a country sub-area within an LME or LME sub-region. Registration of an introduction event includes the date of the first record when a species was noticed in a recipient region as well as pathways and vectors of introduction according to different levels of certainty. In addition, AquaNIS gathers and disseminates information on species biological traits, environmental tolerance limits, availability of molecular data for identification, habitats, etc. Moreover, the information system is equipped with a structured “search” function that allows for retrieving and organizing data by multiple and complex search criteria (for details see Olenin et al., 2014).
nNIS, Assessment Unit, Initial, and Periodic Assessments
nNIS is the number of new NIS in an assessment unit, which were recorded and compared with the initial or periodic assessment. In this study, the assessment unit is equal to a recipient region as it is in AquaNIS. To illustrate such a calculation we selected a range of assessment units from different marine environments as examples, where all entered data has been checked for quality. The areas selected were the Baltic Sea and coastal waters of Italy and the records may be examined on-line (AquaNIS, 2016).
In the Baltic Sea, there are 10 recipient regions: eight bordering countries and the two separate regions of the Russian Federation, the Sankt-Petersburg area in the Gulf of Finland (RU_S) and the Kaliningrad area in the south-eastern Baltic (RU_K). In Italy, there are three recipient regions: the Adriatic Sea, Western Mediterranean (the western coast of the Italian mainland and north coast of Sicily) and Eastern Mediterranean (the south coast of the Italian mainland and south coast of Sicily).
The initial assessment is the first inventory of all NIS present in a recipient region. For example, most EU Member States will have performed an initial environmental status assessments under the MSFD and reported the cumulative number of NIS in the waters under their jurisdiction recorded by 2010. In the present study, all new NIS, arriving after this date, were counted. A periodic assessment is a record of new NIS arrived to a recipient region since the first inventory. The periodicity of the assessment may be defined by the management needs, for example, it will be 6 years for MSFD and in maximum 5 years for granting ballast water management exemptions under BWMC (Olenin et al., 2016).
The Level of Primary Introduction and the Secondary Spread
A primary introduction is the first arrival of a NIS to a particular assessment unit, while the secondary spread is its further dispersal to other locations. The level of a primary introduction can be assessed at different geographical scales, from a recipient region to an LME or a larger biogeographical area. From the environmental policy point of view, more important are those primary introductions, which are new not only for a coast of a particular country (recipient region), but for an entire LME or, even for a larger biogeographical region, for example for two or more neighboring LMEs or LME sub-regions.
The levels of primary introduction should be defined for each case study separately, depending on the availability of data for larger geographical scales. In the Baltic case study, the lowest level of primary introduction (L1) is one of the 10 recipient regions, the next level (L2) is the entire LME (Baltic Sea), and the highest level (L3) is two neighboring LMEs (Baltic Sea and North Sea). Thus, nNISL1 shows how many new NIS were recorded in a particular country since the previous assessment, nNISL2 shows how many of them were new for the Baltic Sea, and nNISL3 indicates the number of NIS new for both the Baltic and the North seas. In the Italian case study, the lowest level (L1) is one of the three recipient regions, while the next level (L2) is all Italian marine areas together. The highest level here would be the entire Mediterranean Sea, the data for which currently is under development.
Data Extraction Method
AquaNIS offers an opportunity to extract the value of nNISL1 directly, using the built-in “Search” function for the recipient region and year, from which the new arrivals should be calculated. The system can retrieve the number of species (i.e., nNISL1) and the number of introduction events. Data extraction for nNISL2 and L3 values involves several steps, using a combination of “Search” and “Comparison of search results” functions (Table 1).
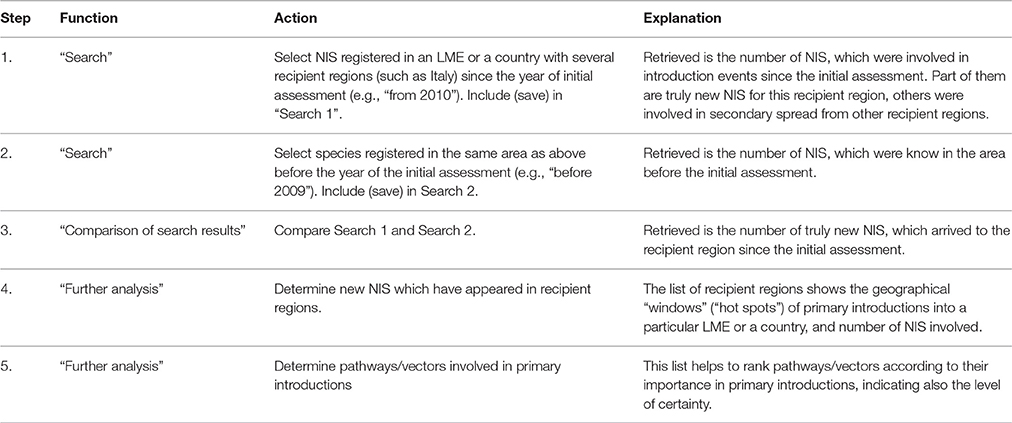
Table 1. Standard data extraction procedure for nNIS L2 and L3 based on the built-in AquaNIS functions.
The calculations of all nNIS values presented here are based on data that has accumulated in AquaNIS to July 28, 2016 (AquaNIS, 2016). All entries for cryptogenic species were not considered in our calculations.
Level of Certainty
According to the AquaNIS (2016) definition, an introduction event should be ascribed to a pathway/vector with the defined level of certainty (Table 2).
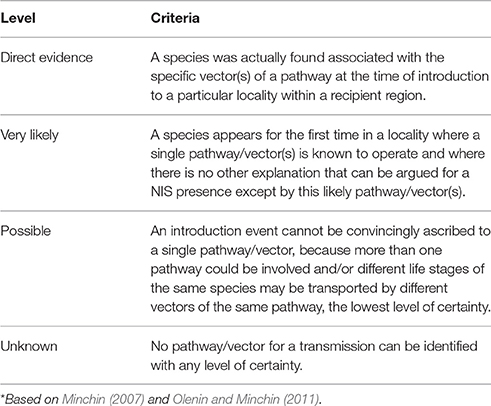
Table 2. Levels of certainty applied for pathways and vectors in AquaNIS*.
Results
The Baltic Sea Case Study
In total, 26 NIS involving 36 introduction events were recorded in 10 recipient regions within the Baltic Sea since 2010. Of these, 12 NIS are new to the Baltic (Table 3), while 14 were involved in secondary spread within the Baltic, i.e., previously were known from at least one of the 10 recipient regions. However, it is important to distinguish between the NIS, which were known in the Baltic Sea before and after the previous assessment. In this case, one species, the brackish water clam Rangia cuneata, first in the Baltic was recorded in 2010 in the Russian part of the south-eastern Baltic (RU_K) and during the assessment period have spread to three other recipient regions: Poland, Lithuania, and Estonia (Table 3). The sedentary polychaete Hypania invalida was found simultaneously in a water body shared between Germany and Poland (Szczecin Lagoon); therefore, the primary introduction is ascribed to 2 countries.
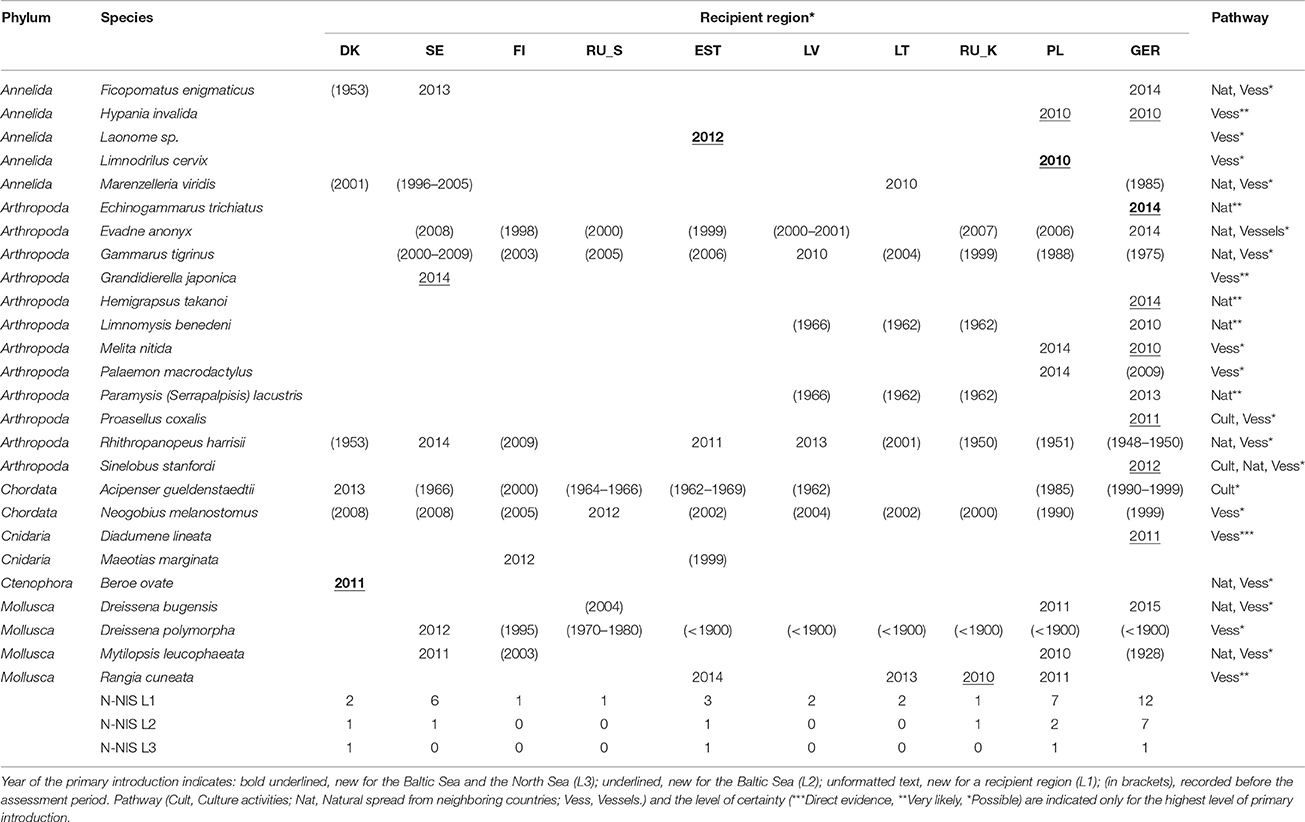
Table 3. New arrivals of non-indigenous species to the recipient regions of the Baltic Sea (DK, Denmark; SE, Sweden; FI, Finland; RU_S, Russia/Sankt-Petersburg area; EST, Estonia; LV, Latvia; LT, Lithuania; RU_K, Russia/Kaliningrad area; PL, Poland; GER, Germany) since 2010.
The difference between nNIS L1 and L2 for a recipient region indicates the number of species, which this particular region received during the assessment period due to secondary spread from other parts of the Sea. For example, since the initial assessment 12 NIS were recorded for Germany, i.e., nNIS L1_Germany = 12 (Table 3). Of these, seven were primary introductions to the Baltic Sea (nNIS L2_Germany = 7), and one of these six (the amphipod Echinogammarus trichiatus) is new at the level of the larger biogeographical region, comprising both the Baltic Sea and the North Sea LME (nNIS L3_Germany = 1). In Poland, seven new species were recorded (nNIS L1_Poland = 7). Two of them were new for the Baltic (nNIS L2_Poland = 2): H. invalida and the tubificid oligochaete Limnodrilus cervix, while R. rangia which first appeared in 2011 was not counted at L2 as it was earlier recorded in the neighboring region of Russia. Finally, L. cervix was new at the scale L3, i.e., this species entered the Baltic Sea and North Sea via the Polish coast. In Sweden six new NIS appeared, however only one of them was new at the LME level, i.e., nNIS L2_Sweden = 1.
The pathway analysis at the level of the Baltic Sea LME (L2) reveals that “Vessels” were responsible for 10 primary inoculations, involving ballast water, ballast tank sediments, hull fouling, etc. (AquaNIS, 2016; Table 3), with levels of certainty ranging from “Direct evidence” (the sea anemone Diadumene lineata found on ship hull) to “Very likely” for three and six “Possible” primary introductions. The pathway “Natural spread from neighboring regions,” indicating secondary spread of NIS was ascribed for four primary introductions. The pathway “Culture activities” involving the vectors aquaculture equipment, stock movements and releases and escapees, was ascribed for two primary introductions.
At the scale of a larger biogeographical region, covering two neighboring LMEs (L3), four species were found to be new for both seas, while 18 were known earlier from the North Sea and may have spread from there to the Baltic Sea.
The Italian Seas Case Study
A total of 33 NIS were registered in the three Italian recipient regions since 2010, including 24 species previously not registered in Italy, and a further 9 NIS, introduced before 2010, which have spread further to adjacent coastal regions (AquaNIS, 2016). New arrivals have been recorded in similar numbers in all three coastal regions: 12, 14, and 15 NIS for the Adriatic Sea, Italian Eastern and Italian Western Mediterranean, respectively (Table 4). Some of these nNIS appeared in multiple regions along the Italian coast, having spread rapidly.
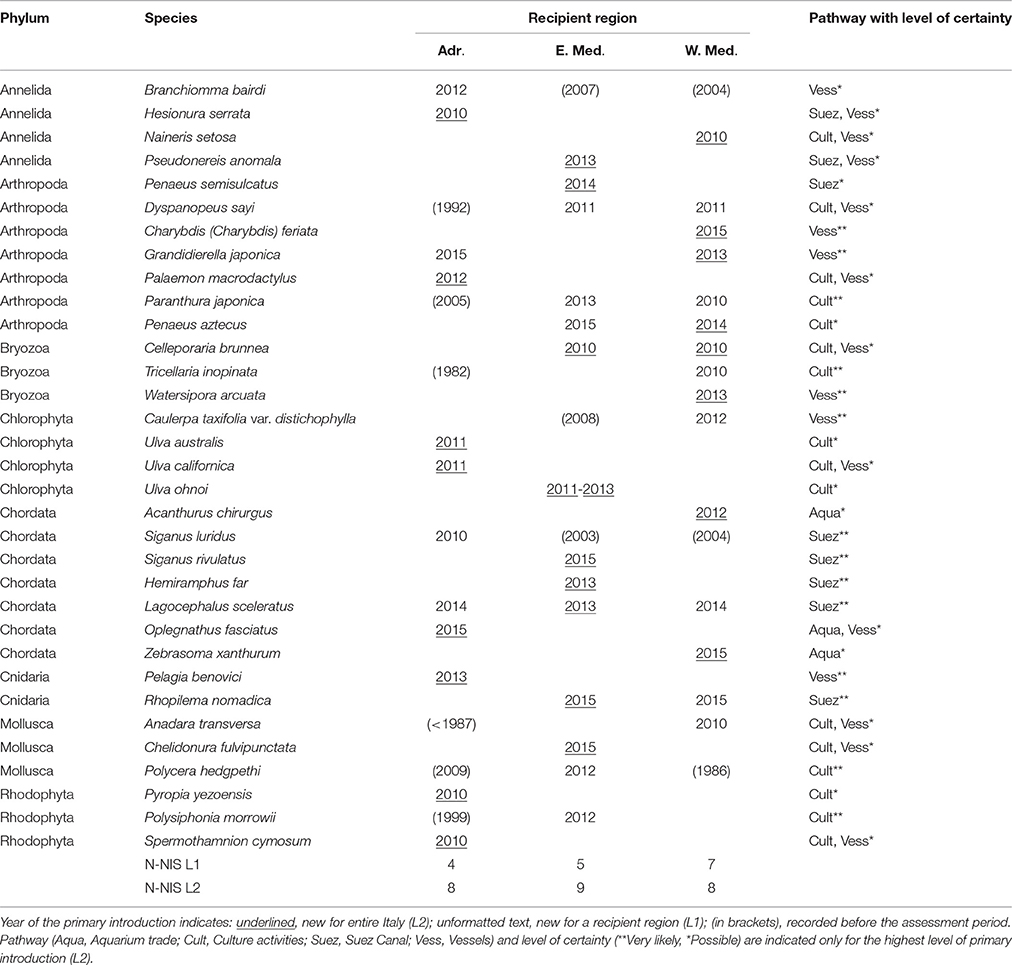
Table 4. New arrivals of non-indigenous species to Italian coastal seas (Adr., Adriatic Sea; E. Med., Eastern Mediterranean; W. Med., Western Mediterranean) since 2010.
The number of likely pathways responsible for the new introductions is higher in Italy than in the Baltic Sea region: besides vessels and culture activities, Italian coasts have been receiving a worrying high number of species that have likely entered the Mediterranean through the Suez Canal, including species of high concern for human health (e.g., the stinging jellyfish Rhopilema nomadica and the toxic pufferfish Lagocephalus sceleratus), as well as species possibly associated with aquarium trade.
Discussion
Defining the Environmental Target
In a recent review, Marchini et al. (2015), highlighted that inventories listing cumulative numbers of marine alien species in the Mediterranean Sea present several types of uncertainty, unfortunately resulting in a confused picture of the phenomenon. Problematic species identifications, doubtful records and unknown native origin affect large portions of such inventories, thus preventing a comprehensive assessment of marine bioinvasions (e.g., Katsanevakis et al., 2016). However, modern taxonomy and molecular tools (Zaiko et al., 2015; Bucklin et al., 2016; Raupach et al., 2016; Viard et al., 2016), combined with a growing scientific concern for marine bioinvasions, are contributing to improve the quality of the current species records. In other words, while it is extremely challenging to reliably reconstruct the past history of redistribution of species due to human intervention (Carlton, 2009; Clavero, 2014), we now have more effective and accurate tools to measure the changes currently occurring. Modern records of new arrivals are often delivered with more in-depth analysis of possible vectors and more detailed knowledge on the NIS ecology (e.g., Reusch et al., 2010), and can therefore provide higher-quality knowledge to support scientifically based advice on management decisions. Therefore, an indicator based on new arrivals (nNIS), despite its inherent time-limitation, could offer a more reliable picture of the problem of bioinvasions and supply information essential for early warning initiatives, horizon-scanning programs (sensu Roy et al., 2014) and identification of an environmental target for the MSFD Good Environmental Status (GES) descriptor 2 “Non-indigenous species” (European Commission, 2008). Further, such an indicator enables an assessment how effective implemented vector and pathway management measures are.
Defining the environmental target for the nNIS indicator, the following considerations should be taken into account:
(1) nNIS, as such, has little information value without further breakdown to pathways and vectors involved in transmission of new species, therefore an environmental target should be related to a particular pathway/vector;
(2) Different pathways/vectors are subject to different management options, e.g., vectors “Ballast water” and “Regional stock movement” are, in principle, manageable, while “Natural spread” is not. Consequently, the environmental target should be related to a manageable pathway/vector;
(3) An environmental target should be defined for the marine area under jurisdiction of a particular State. Regional agreements, may harmonize the environmental target at the level of the entire LME or LME sub-region;
(4) An environmental target should be defined for primary introduction at L2 or higher, because introductions at L1 may be a result of secondary spread;
(5) The frequency and extent of monitoring at L1 and L2 levels is important to be defined in the assessment period.
Thus, in general, the environmental target for nNIS may be formulated for a country as “No new primary introductions of NIS by a particular pathway/vector per assessment period via the territory of that country.” For example, it may sound like “No new primary introductions of NIS by ship's ballast water to the Baltic Sea via territory of Lithuania for the assessment period,” i.e., the environmental target is: “nNISL2_Lithuania (by ballast water) = 0.” In this case, the environmental target will be achieved if during the assessment period no NIS, new for the entire Baltic Sea, entered the marine area under jurisdiction of Lithuania by ships ballast water. Thus, only primary introductions at the level of entire LME (L2) are counted, i.e., secondary spread is excluded.
The environmental target should be harmonized at the level of LME or a larger region, including several neighboring LMEs, where secondary dispersal of NIS may take place with currents and other natural means. For example, the Baltic Sea Action Plan (HELCOM, 2007) sets the environmental management objective “No introductions of alien species from ships.” In fact, nNIS indicates the success or failure of the preventing measures and its highest target value could be set as “No new human-mediated primary introductions on the level of the European regional seas,” although this seems to be impossible with the management options we have today.
Defining the Size of Assessment Unit
The size of the assessment unit for the nNIS indicator may vary depending on the practical considerations, management needs, and, naturally, data availability. In this study, the assessment unit was equal to a country marine area within an LME or LME sub-region, i.e., to a recipient region as it is defined in AquaNIS (2016). Such subdivision is determined by practical needs, because the management decisions on preventive measures are taken at the level of national authorities.
The smallest possible level is a port and/or its vicinities, where it is practical to perform a NIS survey. Such biological surveys in ports are obligatory, for example, for taking decision on granting exemptions under BWMC (David et al., 2013; David and Gollasch, 2015; Olenin et al., 2016).
The largest level for the nNIS assessment is a marine region under a regional convention, e.g., North-East Atlantic (OSPAR) or Baltic Sea (HELCOM), where measures to prevent NIS introduction may be practically coordinated. The higher geographical scale to calculate nNIS including all regional seas of an entire continent so far is not achievable, because such datasets do not exist, or, at least are not publically available.
The Technical Precondition and Possible Limitations of the Indicator
The technical precondition for the calculation of nNIS is the availability of verified and continuously updated source of information on introduction events, e.g., a NIS database. Depending of the size of the assessment unit, the geographical coverage of such a database may range from national to regional or interregional. Ideally, such information source should be global or, at least, continent-wide. For example, AquaNIS, used in this study, is being regularly updated by the ICES Working Group on Introductions and Transfers of Marine Organisms and contains information from other world regions as well.
Our results show that the average number of new arrivals having occurred in the past few years in different European sea regions is high, and therefore a reliable database can be achieved only by a continuous and scrupulous work of data checking and update. However, a scientific community needs to achieve the long-term maintenance and reliability of such databases, because they require frequent updating and corrections (Costello et al., 2014). Without continuous maintenance, update and data quality control, the usefulness of the database diminishes over time and its users may be hampered by outdated and therefore misleading information (Olenin et al., 2014) as it was shown in the Mediterranean Sea case (Marchini et al., 2015).
Ideally, all newly published records of NIS introduction events in journals, such as Biological Invasions, Aquatic Invasions, BioInvasion Records, Marine Biodiversity Records, Mediterranean Marine Science, shall be standardized and immediately entered in a global online NIS information system. That would speed up the transfer of knowledge on biological invasions and aid the analysis of new arrivals in relation to all other relevant data stored in the database.
Another technical precondition is that nNIS are scored for recipient regions or LMEs, where regular NIS surveys or, at least, a well-established long-term biological monitoring is in place (Olenin et al., 2011; Lehtiniemi et al., 2015). Taking into account that there are several international instruments (BWMC, ICES Code of Practice, MSFD, etc.) which include NIS monitoring for management purposes and for measuring progress toward achieving their goals, it would be feasible to coordinate NIS surveys regionally. For example, rapid assessment surveys focused on target species (e.g., Minchin et al., 2009, 2016) may be arranged simultaneously by several countries within an LME, in the same way as it is done for fishery surveys (ICES, 2014).
It should be taken into account, also that in some cases our ability to distinguish between the primary introduction and secondary spread may be limited. This is because, multiple introductions of a NIS from outside an LME area also possible as in the case of the American comb jelly Mnemiopsis leidyi “very-likely” spread via ballast waters from two distinct source populations from the western Atlantic to the Black Sea and the North Sea (Reusch et al., 2010). Multiple introductions make distinctions between primary introduction and secondary spread within an LME or larger biogeographical region more difficult. Development of eDNA techniques could assist in determining origin in the future (Rius et al., 2015).
Risk Assessment, Management Implications, and Policy Relevance
It is difficult to predict those nNIS that may become invasive and cause problems to the environment, economy and/or human health in a recipient region. No control or eradication of invasive alien species without affecting other components of the ecosystem is feasible after an invasion process is underway and a species has become established within an ecosystem. Given the severity of problems that can be caused by biological invasions, it is mandatory for policy and management to focus on the pathways and vectors with the aim to prevent further introductions (e.g., European Commission, 2014).
The nNIS indicator evaluates the effectiveness of prevention measures where these can be employed, be it the ballast water management, precautionary approach in aquaculture or life food trade regulation. For example, strict ballast water management rules applied in recent decades in US and Canada resulted in no new fresh water introductions (i.e., nNIS L3 = 0) in the Laurentian Great Lakes Region since 2006 (Scriven et al., 2015). In contrast, the nNIS value for Italy, obtained in the present study, clearly shows a high exposure arising from a large geographical dispersion of introduction events and several pathways. For example, the relatively high number of newly arrived NIS that can be associated with aquarium releases (3 out of 24) indicates a requirement for a greater implementation of a code of practice in aquarium trade (Scalera et al., 2012), as well as a greater general public awareness. There is a need to review management for those NIS that might be prevented from becoming established where direct anthropogenic introductions can be regulated.
It is important to manage primary introductions at the scale L2 and L3, because the secondary spread, which can be inevitable, may seriously compromise the ability for any practical regulation. This is because a further spread may involve dispersal by the same pathway or by multiple pathways that might act in relay. What is not possible to manage are the natural processes involving tidal movements, alongshore drift, waterfowl, and other aquatic biota as a carrier of NIS either within an LME or from neighboring LME.
Conclusion
The proposed nNIS indicator is clearly associated with anthropogenic pressure in terms of specific pathways/vectors involved and this may help to prioritize management actions. Regional Sea Conventions have been working on developments to harmonize the MSFD indicators, considering new arrivals as potentially useful parameter for environmental status assessments (e.g., HELCOM, 2012). This indicator provides a clear measure of effectiveness of legal and administrative instruments aimed at prevention of NIS species introductions, such as the International Convention for the Control and Management of Ship's Ballast Water and Sediments, the EU Regulation 1143/2014 on Invasive Alien Species, the MSFD and the ICES Code of Practice on the Introductions and Transfers of Marine Organisms.
Author Contributions
SO, ML, SG, and DM conceived the paper. SO and DM wrote the first draft, DM checked the language. The following authors provided the case studies: AM (Mediterranean sea), SO, AN, ML, and SG (Baltic sea). AN, AM, and GS contributed to the assessment analyses and presentation of the results. All authors contributed largely to the multiple drafts of the manuscript and approved its last version for publication.
Conflict of Interest Statement
The authors declare that the research was conducted in the absence of any commercial or financial relationships that could be construed as a potential conflict of interest.
Acknowledgments
The study was supported by (1) the DEVOTES (DEVelopment Of innovative Tools for understanding marine biodiversity and assessing good Environmental Status, http://www.devotes-project.eu) project funded by the European Union under the 7th Framework Programme, The “Ocean of Tomorrow” theme (Grant Agreement No. 308392 (for SO and AN); (2) BIO-C3 (Biodiversity changes—causes, consequences and management implications, http://www.bio-c3.eu) project funded by BONUS, the joint Baltic Sea research and development programme (Art 185), funded jointly by the Academy of Finland (Grant Agreement No. BONUS-1/2014) and by the EU 7th Framework Programme for research, technological development and demonstration (for ML); and (3) the Taiwan–Latvia–Lithuania Cooperation Project BALMAN “Development of the ships' ballast water management system to reduce biological invasions,” project # TAPLLT-14-013 (for DM and GS). The authors are grateful to prof. Anna Occhipinti-Ambrogi for fruitful discussion on the bioinvasion indicators.
References
AquaNIS (2016). “Editorial board,” in Information System on Aquatic Non-Indigenous and Cryptogenic Species (World Wide Web electronic publication). Version 2.36+. Available online at: http://www.corpi.ku.lt/databases/aquanis. (Accessed June 20, 2016).
Borja, A., Elliott, M., Andersen, J. H., Berg, T., Carstensen, J., Halpern, S., et al. (2016). Overview of integrative assessment of marine systems: the ecosystem approach in practice. Front. Mar. Sci. 3:20. doi: 10.3389/fmars.2016.00020
Bucklin, A., Lindeque, P. K., Rodriguez-Ezpeleta, N., Albaina, A., and Lehtiniemi, M. (2016). Metabarcoding of marine zooplankton: prospects, progress and pitfalls. J. Plankton Res. 38, 393–400. doi: 10.1093/plankt/fbw023
Cardeccia, A., Marchini, A., Occhipinti-Ambrogi, A., Galil, B., Gollasch, S., Minchin, D., et al (in press). Assessing biological invasions in European Seas: biological traits of the most widespread non-indigenous species. Estuar. Coast. Shelf Sci. doi: 10.1016/j.ecss.2016.02.014
Carlton, J. T. (2009). “Deep invasion ecology and the assembly of communities in historical time,” in Biological Invasions in Marine Ecosystems, eds G. Rilov and J. A. Crooks (Berlin; Heidelberg: Springer-Verlag), 13–56.
CBD (1992). Convention on Biological Diversity. Secretariat of the Convention on Biological Diversity. United Nations environment program. Available online at: https://www.cbd.int/doc/legal/cbd-en.pdf
Clavero, M. (2014). Shifting baselines and the conservation of non-native species. Conserv. Biol. 28, 1434–1436. doi: 10.1111/cobi.12266
Costello, M. J., Appeltans, W., Bailly, N., Berendsohn, W., de Jong, Y., Edwards, M., et al. (2014). Strategies for the sustainability of online open-access biodiversity databases. Biol. Conserv. 173, 155–165. doi: 10.1016/j.biocon.2013.07.042
David, M., and Gollasch, S. (eds.). (2015). “Global maritime transport and ballast water management – issues and solutions,” in Invading Nature. Springer Series in Invasion Ecology, Vol. 8 (Dordrecht: Springer Science + Business Media), 306
David, M., Gollasch, S., and Leppäkoski, E. (2013). Risk assessment for exemptions from ballast water management–the Baltic Sea case study. Marine Poll. Bull. 75, 205–217. doi: 10.1016/j.marpolbul.2013.07.031
Didham, R. K., Tylianakis, J. M., Hutchison, M. A., Ewers, R. M., and Gemmell, N. J. (2005). Are invasive species the drivers of ecological change? Trends Ecol. Evol. 20, 470–474. doi: 10.1016/j.tree.2005.07.006
EEA (2007). Halting the Loss of Biodiversity by 2010: Proposal for a First Set of Indicators to Monitor Progress in Europe. Technical Report No. 11/2007, European Environment Agency.
EEA (2012). The Impacts of Invasive Alien Species in Europe. Technical Report No. 16/2012, European Environment Agency.
European Commission (2008). Directive 2008/56/EC of the European Parliament and of the Council of 17 June 2008 establishing a framework for community action in the field of marine environmental policy (Marine Strategy Framework Directive). Off. J. Eur. Union L 164, 19–40.
European Commission (2010). Commission Decision of 1 September 2010 on criteria and methodological standards on good environmental status of marine waters (notified under document C(2010) 5956)(2010/477/EU). Off. J. Eur. Union L 232, 12–24.
European Commission (2014). Regulation (EU) No 1143/2014 of the European Parliament and of the Council of 22 October 2014 on the prevention and management of the introduction and spread of invasive alien species. Off. J. Eur. Union 57, 35.
Gollasch, S. (2007). International collaboration on marine bioinvasions – the ICES response. Marine Poll. Bull. 55, 353–359. doi: 10.1016/j.marpolbul.2006.11.009
HELCOM (2012). “Development of a set of core indicators: Interim report of the HELCOM CORESET project. PART B: descriptions of the indicators,” in Balt Sea Environment Proceedings No. 129B (Helsinki).
Hewitt, C., Richard, L., Everett, A., and Parker, N. (2009). “Examples of current international, regional and national regulatory frameworks for preventing and managing marine bioinvasions,” in Biological Invasions in Marine Ecosystems, Vol. 335, Ecological Studies 204, eds G. Rilov and J. A. Crooks (Berlin; Heidelberg: Springer-Verlag), 335–352. doi: 10.1007/978-3-540-79236-9_19
ICES (2005). ICES Code of Practice on the Introductions and Transfers of Marine Organisms, Vol. 30. Copenhagen: ICES.
ICES (2014). Manual for the Mackerel and Horse Mackerel Egg Surveys (MEGS): Sampling at Sea. Series of ICES Survey Protocols. Copenhagen: ICES. SISP 6-MEGS V1.3. 62.
ICES (2016). Report of the Working Group on Introductions and Transfers of Marine Organisms (WGITMO). Olbia: ICES CM 2016/SSGEPI: 10. 201.
IMO (2004). International Convention for the Control and Management of Ships' Ballast Water and Sediments, Vol. 36. IMO. BWM/CONF/36 (London: IMO).
IMO (2016). International Convention for the Control and Management of Ships' Ballast Water and Sediments. Available online at: http://www.imo.org/en/About/Conventions/ListOfConventions/Pages/International-Convention-for-the-Control-and-Management-of-Ships'-Ballast-Water-and-Sediments-(BWM).aspx. (Accessed 21 September, 2016).
Katsanevakis, S., Tempera, F., and Teixeira, H. (2016). Mapping the impact of alien species on marine ecosystems: the Mediterranean Sea case study. Div. Distrib. 22, 694–707. doi: 10.1111/ddi.12429
Lehtiniemi, M., Ojaveer, H., David, M., Galil, B., Gollasch, S. McKenzie, et al. (2015). Dose of truth—Monitoring marine non-indigenous species to serve legislative requirements. Mar. Policy 54, 26–35. doi: 10.1016/j.marpol.2014.12.015
MacDougall, A. S., Boucher, J., Turkington, R., and Bradfield, G. E. (2006). Patterns of plant invasion along an environmental stress gradient. J. Veg. Sci. 17, 47–56. doi: 10.1111/j.1654-1103.2006.tb02422.x
Marchini, A., Galil, B. S., and Occhipinti-Ambrogi, A. (2015). Recommendations on standardizing lists of marine alien species: lessons from the Mediterranean Sea. Marine Poll. Bull. 101, 267–273. doi: 10.1016/j.marpolbul.2015.09.054
Minchin, D. (2007). Aquaculture and transport in a changing environment: overlap and links in the spread of alien biota. Marine Poll. Bull 55, 302–313. doi: 10.1016/j.marpolbul.2006.11.017
Minchin, D., Gollasch, S., Cohen, A. N., Hewitt, C., and Olenin, S. (2009). “Characterizing vectors of marine invasions,” in Biological Invaions in Marine Ecosystems: Ecological, Management and Geographic Perspectives, Ecological Studies 204, ed G. Rilov and J. Crooks (Heidelberg: Springer), 109–115.
Minchin, D., Olenin, S., Liu, T. K., Cheng, M., and Huang, S. C. (2016). Rapid assessment of target species: Byssate bivalves in a large tropical port. Mar. Poll. Bull. 112, 177–182. doi: 10.1016/j.marpolbul.2016.08.023
Olenin, S., Alemany, F., Cardoso, A. C., Gollasch, S., Goulletquer, P., Lehtiniemi, M., et al. (2010). Marine Strategy Framework Directive - Task Group 2 Report. Non-indigenous Species, Vol. 44. EUR 24342 EN. Luxembourg: Office for Official Publications of the European Communities.
Olenin, S., Elliott, M., Bysveen, I., Culverhouse, P. F., Daunys, D., Dubelaar, G. B., et al. (2011). Recommendations on methods for the detection and control of biological pollution in marine coastal waters. Mar. Poll. Bull. 62, 2598–2604. doi: 10.1016/j.marpolbul.2011.08.011
Olenin, S., and Minchin, D. (2011). “Biological introductions to the systems: macroorganisms,” in Treatise on Estuarine and Coastal Science, Vol. 8, eds E. Wolanski and D. S. McLusky (Amsterdam: Elsevier), 149–183.
Olenin, S., Narščius, A., Minchin, D., David, M., Galil, B., Gollasch, S., et al. (2014). Making non-indigenous species information systems practical for management and useful for research: an aquatic perspective. Biol. Conserv. 173, 98–107. doi: 10.1016/j.biocon.2013.07.040
Olenin, S., Ojaveer, H., Minchin, D., and Boelens, R. (2016). Assessing exemptions under the ballast water management convention: preclude the Trojan horse. Marine Poll. Bull. 103, 84–92. doi: 10.1016/j.marpolbul.2015.12.043
Raupach, M. J., Amann, R., Wheeler, Q. D., and Roos, C. (2016). The application of “-omics” technologies for the classification and identification of animals. Org. Divers. Evol. 16, 1–12. doi: 10.1007/s13127-015-0234-6
Reusch, T. B. H., Bolte, S., Sparwel, M., Moss, A. G., and Javidpour, J. (2010). Microsatellites reveal origin and genetic diversity of Eurasian invasions by one of the world's most notorious marine invader, Mnemiopsis leidyi (Ctenophora). Mol. Ecol. 19, 2690–2699. doi: 10.1111/j.1365-294X.2010.04701.x
Rius, M., Turon, X., Bernardi, G., Volckaert, F. A., and Viard, F. (2015). Marine invasion genetics: from spatio-temporal patterns to evolutionary outcomes. Biol. Inv. 17, 869–885. doi: 10.1007/s10530-014-0792-0
Roy, H. E., Peyton, J., Aldridge, D. C., Bantock, T., Blackburn, T. M., Britton, R., et al. (2014). Horizon scanning for invasive alien species with the potential to threaten biodiversity in Great Britain. Glob. Chang. Biol. 20, 3859–3871 doi: 10.1111/gcb.12603
Scalera, R., Genovesi, P., De Man, D., Klausen, B., and Dickie, L. (2012). “European code of conduct on zoological gardens and aquaria and invasive alien species,” in 32nd Meeting of the Standing Committee of the Convention on the Conservation of European Wildlife and Natural Habitats (Strasbourg), 27–30. Available online at: http://www.eaza.net/assets/Uploads/Position-statements/Code-of-Conduct-Zoos-Aquaria-Invasive-Allien-species-Oct2012.pdf
Scriven, D. R., DiBacco, C., Locke, A., and Therriault, T. W. (2015). Ballast water management in Canada: a historical perspective and implications for the future. Mar. Policy 59, 121–133. doi: 10.1016/j.marpol.2015.05.014
Sherman, K. (1991). The large marine ecosystem concept: research and management strategy for living marine resources. Ecol. Appl. 1, 349–360. doi: 10.2307/1941896
Viard, F., David, P., and Darling, J. (2016). Marine invasions enter the genomic era: three lessons from the past, and the way forward. Curr. Zool. zow053. doi: 10.1093/cz/zow053
Keywords: biological invasions, pathways and vectors, information system, large marine ecosystem
Citation: Olenin S, Narščius A, Gollasch S, Lehtiniemi M, Marchini A, Minchin D and Srėbalienė G (2016) New Arrivals: An Indicator for Non-indigenous Species Introductions at Different Geographical Scales. Front. Mar. Sci. 3:208. doi: 10.3389/fmars.2016.00208
Received: 21 June 2016; Accepted: 05 October 2016;
Published: 28 October 2016.
Edited by:
Michael Elliott, University of Hull, UKReviewed by:
Davide Francesco Tagliapietra, Istituto di Scienze Marine (ISMAR), ItalyAngel Borja, AZTI, Spain
Copyright © 2016 Olenin, Narščius, Gollasch, Lehtiniemi, Marchini, Minchin and Srėbalienė. This is an open-access article distributed under the terms of the Creative Commons Attribution License (CC BY). The use, distribution or reproduction in other forums is permitted, provided the original author(s) or licensor are credited and that the original publication in this journal is cited, in accordance with accepted academic practice. No use, distribution or reproduction is permitted which does not comply with these terms.
*Correspondence: Sergej Olenin, c2VyZ2VqLm9sZW5pbkBqbXRjLmt1Lmx0