 D. Whitney King
 Emma Berger
 Zachary Helm1
 Kenneth Mopper
- 1Department of Chemistry, Colby College, Waterville, ME, USA
- 2Department of Chemistry and Biochemistry, Old Dominion University, Norfolk, VA, USA
Antioxidants are a class of molecules that provide a protective function against reactive oxygen species (ROS) in biological systems by out competing physiologically important molecules for ROS oxidation. In natural waters, the reactivity of antioxidants gives an estimate of oxidative stress, and may determine the reactivity and distribution of reactive oxidants. We present an analytical method to measure antioxidant activity in natural waters through the competition between ascorbic acid, an antioxidant, and MCLA, a chemiluminescent probe for superoxide. A numerical kinetic model of the analytical method has been developed to optimize analytical performance. Measurements of antioxidant concentrations in pure and seawater are possible with detection limits below 0.1 nM. Surface seawater samples collected at solar noon contained over 0.4 nM of antioxidants and exhibited first-order decay with a half-life of 3–7 min, consistent with a reactive species capable of scavenging photochemically produced superoxide.
Introduction
Reactive oxygen species (ROS) are short lived, oxygen containing molecules including singlet oxygen (1O2), superoxide (), hydrogen peroxide (H2O2), hydroxyl radical (•OH), and the carbonate radical (). In natural systems, these species are capable of oxidizing a range of molecules including metal complexes, dissolved organic matter, and biomolecules. The reactivity of ROS species has prompted extensive analytical work in ROS analysis (Burns et al., 2012). Antioxidants are a class of molecules that provide a protective function against ROS species in biological systems by out competing physiologically important molecules for ROS oxidation (Schlesier et al., 2002). In natural waters the reactivity of antioxidants gives an estimate of oxidative stress and will determine the reactivity and distribution of ROS (Goldstone and Voelker, 2000; Heller and Croot, 2010; Roe et al., 2016). Methods for quantifying antioxidants include direct analysis using chromatography with UV-VIS (Cai et al., 2003) or MS detection (Lee et al., 2006) and the colorimetric analysis of derivatized analytes (Prior et al., 2005). Direct analysis is desirable, but limited in environmental systems due to poor detection limits and the unknown chemical structure of many natural antioxidants. Indirect antioxidant analysis relies on competitive kinetic reactions between antioxidants and known probe molecules with ROS—often superoxide or hydroxyl radicals (Hosaka et al., 2005; Besco et al., 2007; Giokas et al., 2007; Yu et al., 2008; Anifowose et al., 2015). Indirect measurements do not necessarily measure specific molecule concentrations, but rather weighted antioxidant reactivity defined as the sum of all antioxidant concentrations scaled by their reaction rate constants with specific ROS. In this indirect, competitive kinetics method, experimentally generated superoxide competes with the antioxidants of interest, and an analytically observable probe molecule (Figure 1).
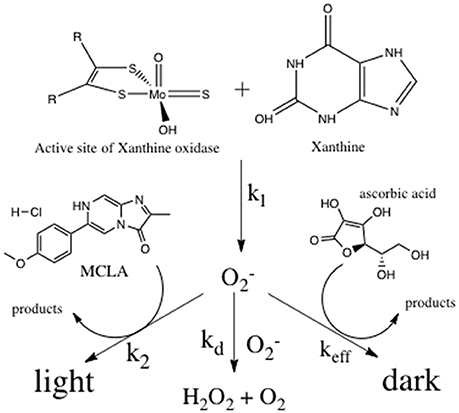
Figure 1. Competitive kinetics scheme for the analysis of antioxidants.
Superoxide was produced at a constant, known rate through the enzymatically catalyzed reaction of xanthine with xanthine oxidase (X/XO; Fridovich, 1970; Rose et al., 2008a). Superoxide decay will occur via three bimolecular pathways; reaction with the chemiluminescent probe molecule MCLA (Burns et al., 2012), disproportionation with another superoxide molecule (Bielski, 1978), or reaction with ascorbic acid (Nandi and Chatterjee, 1987)—the reference antioxidant. Antioxidant reactivity was determined by measuring the quenching of the superoxide-MCLA reaction with standard or unknown antioxidants. This method will only detect chemical species that react with superoxide at rates equal or greater than superoxide disproportionation (i.e., the dark pathway must be at least 1% of the superoxide sink). The method does not measure a specific chemical species, but rather the reaction rate-weighted sum of all antioxidants. In this way, the method is a measure of antioxidants capable of perturbing the steady state concentration of superoxide. The method will be insensitive to antioxidants that react with hydrogen peroxide or molecular oxygen since these ROS species do not react with the CL probe MCLA, and these reaction rates are much slower than the superoxide reactions shown in Figure 1.
There are four reactions describing the change in superoxide concentration in this indirect analytical method. First, the production rate of superoxide is given by
where k1 is the enzyme limited rate of reaction between xanthine and xanthine oxidase to produce superoxide (Rose et al., 2008a). Second, the loss of superoxide through the reaction with MCLA is given by
where k2 is the pH dependent rate constant for the reaction between superoxide and MCLA (Goto and Takagi, 1980; Fujimori et al., 1993). This reaction also describes the rate of light production from the chemiluminescence reaction, CL. Third, the loss of superoxide via disproportionation is
where kd is the pH dependent rate constant for the disproportionation reaction and [] represents the total [] and [HO2] in solution (Bielski, 1978; Burns et al., 2012). Finally, the loss of superoxide through the reaction with antioxidants (AO) is
where keff is the effective rate constant for the reaction between all antioxidants and superoxide (Bielski et al., 1985; Nandi and Chatterjee, 1987). The rate of change of superoxide concentration as a function of time is defined by Equation (5).
Under steady state conditions (d[]/dt = 0) with slow superoxide disproportionation, we can simplify Equations (5) to
with the relative rate of each superoxide loss pathway independent of superoxide (Equation 7). Since only the superoxide-MCLA reaction, top path, will result in chemiluminescence, the fraction of unquenched CL signal can be computed from mass balance.
The change in CL signal as a function of antioxidant concentration is the basis of this analytical method.
Modeled CL Reaction
We used National Instruments LabView to numerically model reactions 1–5 and evaluate the steady state assumptions that are the basis for Equation (7). The physical system is shown in Figure 2.
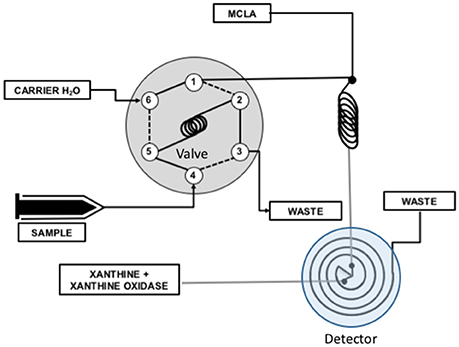
Figure 2. Flow injection analysis system used to measure antioxidants. An injection valve was used to inject a known volume of antioxidant sample into a carrier flow stream (valve ports 6 → 5 → 2 → 1). The carrier was merged with MCLA and mixed completely in a mixing coil. Superoxide produced by the X/XO reaction was combined with the MCLA/sample mixture in a spiral flow cell located below a detector where chemiluminescence was measured. The CL response of this system was modeled in terms of reactions 1–5 and the flow rates of the experimental system.
The reaction was modeled using initial concentrations of MCLA, antioxidant, and XO. It was assumed that the xanthine substrate saturated the XO active site and superoxide production was only a function of XO activity, 0.25 nM s−1unit−1 (Rose et al., 2008a). Reaction rates were corrected to pH 6 with kd = 5.4 × 10⁶ M−1s−1 (Bielski et al., 1985), k2 = 6.2 × 10⁵ M−1s−1 (Fujimori et al., 1993), and keff at 2.7 × 10⁵ M−1s−1 (Bielski et al., 1985) to 8.2 × 10⁷ M−1s−1 (Nandi and Chatterjee, 1987). Reaction progress was computed using a simple finite difference calculation with a simulation time step of 10 ms. The valve timing was simulated by turning on the antioxidant concentration 10 s into the simulation. Time was used to simulate the flow of reactants in the analytical system, Figure 2, and the CL flux was modeled as a function of flow cell position since only light produced in the flow cell will be detected by the PMT. Figure 3 shows a typical simulation run with 0, 100, and 1000 nM of antioxidant.
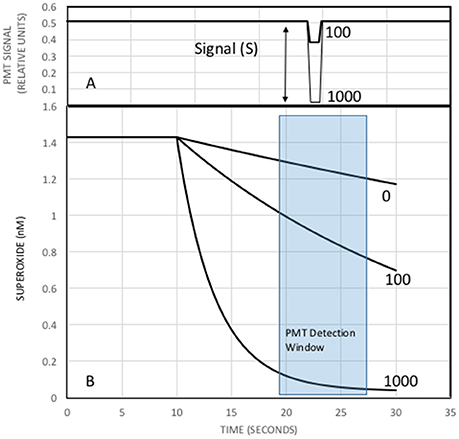
Figure 3. Simulation of the analytical system for three different antioxidant concentrations. (B) Superoxide from the X/XO reaction starts at a steady state of 1.4 nM. The MCLA-antioxidant solution is mixed with superoxide at time 10 s causing a decrease in superoxide concentrations and production of CL. Numbers next to each curve are [AO] in nM. Less superoxide will produce less light. (A) CL signal as a function of time. The zero AO addition would produce a flat line signal and is not shown. Since the sample loop is a finite size, CL signals begin high (carrier only), decrease when the sample passes through the detector, and returns to initial values as the sample bolus exits to waste. The PMT detection window (blue box) in (B) will change the CL response in (A). The optimal detection window will produce the largest differences in the integrated superoxide concentrations and thus the biggest changes in CL.
At low initial steady state levels of superoxide, the MCLA (1 uM) and AO concentrations are essentially constant over the entire analytical run. Therefore, the CL signal is a linear function of superoxide concentration and the curves in Figure 3B are proportional to PMT counts. When AO concentrations increase, superoxide concentrations decrease due to Equation (4) and we observe a decrease in the CL signal (Figure 3A). It is recognized that the maximum CL signal is observed when [AO] = zero and the minimum CL signal is observed when [AO]>>[MCLA]. Rewriting Equation (7) in terms of the decrease in CL intensity, S (Figure 3A), we obtain
where Smax is the maximum decrease in CL signal and Smin is the decrease in signal for a blank (typically zero). When simulations were run with varying AO concentrations a calibration curve was generated and depicted in Figure 4.
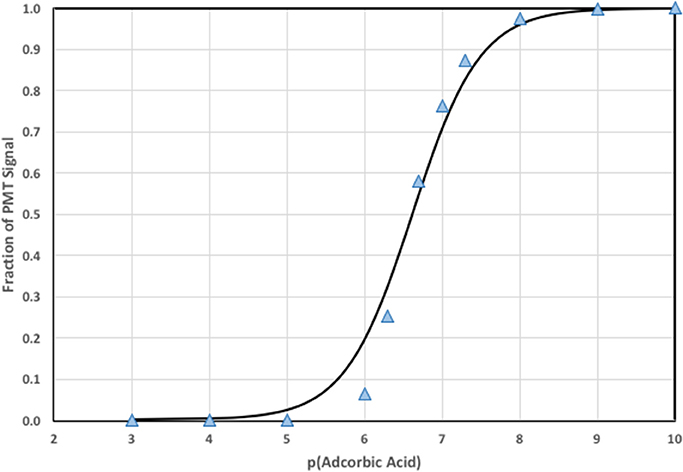
Figure 4. Calibration curve using the numerical model to estimate S and F (points) and the fit to the data using Equation (7) (line).
Notice that the fit to the calculated signal is not as perfect as expected for a numerical fit to simulated data. The discrepancy is due to limitations in the steady state assumptions used to derive Equation (7), and the real detection window that integrates a changing CL signal as analytical solution mixes and flows outward in the detector spiral. Nevertheless, Equation (8) provides a remarkably good description of CL quenching as a function of AO concentration, which will be shown for pure water and natural water systems below.
Calibration of this method requires measuring CL quenching, S, for a range of AO concentrations. Quenching measurements at [AO] = 0 and [AO]>>[MCLA] yields values for Smin and Smax respectively. F-values are computed using Equation (8) and a calibration curve is generated using Equation (7) with keff as the only fitting parameter. F-values for unknown samples yield effective AO concentrations through reorganization of Equation (7).
Ascorbic acid was selected as a model antioxidant because it is a commercially available solid that serves as a useful analytical reference standard. Ascorbic acid is not expected to be present in natural waters. Natural antioxidants will have faster and slower keff compared to ascorbic acid. Natural antioxidants with slow reaction rates for superoxide will have lower effective concentrations, while natural antioxidants with faster reaction rates for superoxide will appear to have higher effective concentrations. Since the goal of this work was to determine the ability of natural waters to respond to rapid oxidative stress, using a reactivity scaled measure of antioxidant concentration allows intercomparison of data from different water types where the chemical identity of specific antioxidants is currently not known.
Methods
The analytical system used was built by Waterville Analytical and is shown in Figure 2. Flow rates in the analytical lines were 1 ml/min. The PMT was operated at the default high voltage with an integration time of 800 ms. Sample load time was 125 s and analysis time was 60 s with an acquisition frequency of 1 Hz.
All solutions were prepared in high purity water. Diethylenetriaminepentaacetic acid (DTPA), xanthine, xanthine oxidase from bovine milk, disodium phosphate, sodium bicarbonate, and ascorbic acid were reagent grade and obtained from Sigma-Aldrich. 2-methyl-6-[p-methoxyphenyl]-3,7-dihydroimidazo[1,2-a]pyrazin-3-one (MCLA) was obtained from Thermo Fisher. Five milliliter vials of 0.4 mM MCLA solution were prepared by adding 15 mg of solid MCLA to 130 mL of high purity water. The MCLA vials were stored at −80°C until used to prepare fresh solutions.
MCLA solutions (1–4 μM) in 0.1 M phosphate buffer were made by adding MCLA to pH 6, 0.01 M phosphate buffer containing 1 μM DTPA. The xanthine solution was 1 μM in pH 6, 0.001 M phosphate buffer containing 1 μM DTPA. XO was added directly to the xanthine solution at 5 μL increments until nM levels of antioxidant resulted in a 30% quenching of the CL signal. Typical XO activities were 0.01 nM/s. Alternatively, XO solutions were prepared in 0.001 M phosphate buffer containing 1 μM DTPA and merged with xanthine in a reaction spiral for 1 min. Higher XO activities were used in this alternative configuration due to shorter reaction times. Separating the X and XO reagents results in improved baseline stability. The carrier for laboratory experiments was pH 7, 1 mM sodium bicarbonate. The carrier for ocean samples was oligotrophic seawater collected at 400 m and stored in the dark at room temperature.
Oligotrophic seawater samples were collected January 2011 during the Great Belt cruise in the South Atlantic (latitude W 47.976 and longitude S 39.250) from a flowing stream of surface seawater provided from the sea chest of the ship. Residence time from the surface ocean to a sample bottle was <1 min.
Results and Discussion
Figure 5 shows typical laboratory results for ascorbic acid standards added to 1 mM bicarbonate solutions with 1 μM DTPA. DTPA is a good ligand for metals and significantly reduces metal–superoxide reaction rates (Rose et al., 2008b). CL signals were significantly higher in the presence of DTPA, which suggested that metal contamination in our reagents provided an alternative sink for superoxide.
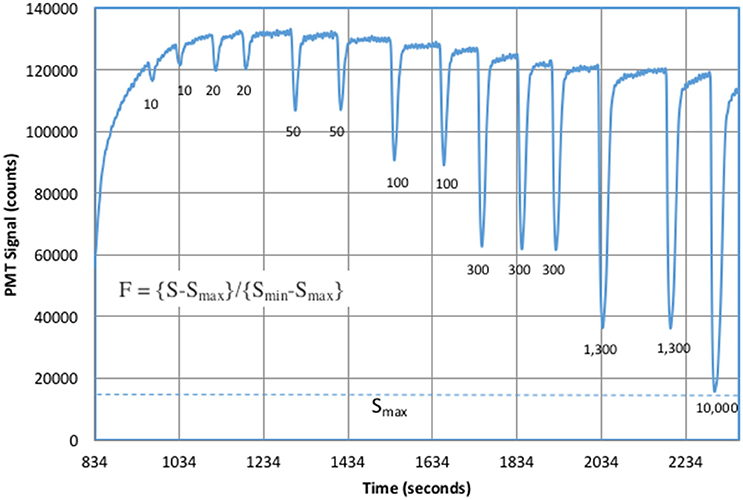
Figure 5. Antioxidant standards in 1 mM bicarbonate. The increasing signal at the start of the experiment was due to XO addition. The numbers under each peak were added ascorbic acid in nM. Baseline values were calculated from the average signal before and after each peak.
Increasing ascorbic acid additions cause a significant increase in CL quenching. The signal, S, was defined as the change in CL from the upper baseline to the bottom of each negative peak. Peak height was used instead of peak area because the analytical response was non-linear. The instrumental response half way down a peak shoulder does not correspond to half the sample concentration. The result of a simple integration was a complicated integral of an exponentially changing response over time. Using peak height avoids awkward integration problems. Figure 6 shows the fit to the computed F-values (Equation 8) for each sample.
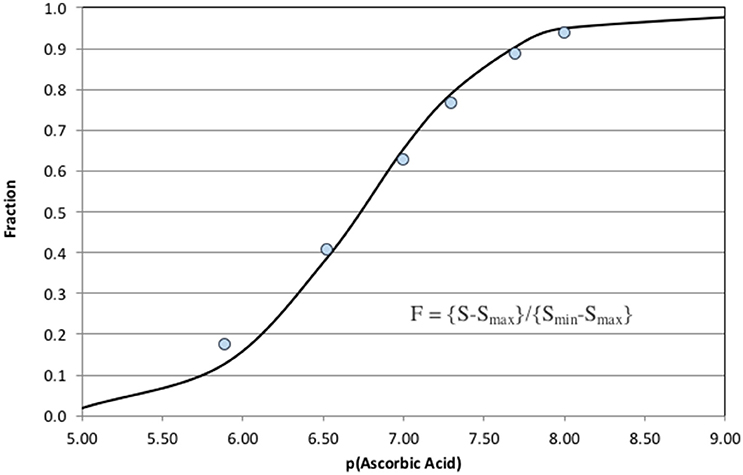
Figure 6. Fit of Equation (8) to the analytical results shown in Figure 5. The ascorbic acid concentrations are plotted as the negative base 10 logarithm.
The analytical response was exponential so a direct estimation of analytical detection limits is difficult. The system was clearly capable of detecting of 10 nM of ascorbic acid, AA, in 1 mM bicarbonate. Maximum sensitivity occurred when F = 0.5 or dF/d(pAA) was at a maximum. Good quantification of AO is possible at p[AO] ± two units of F = 0.5. This quantification range can be considered the analytical window of the method. It was possible to shift the analytical window to higher or lower concentrations of AO (shifting the point where F = 0.5) by decreasing or increasing the MCLA and XO concentrations (Equation 8). The numerical model was very helpful in defining initial analytical conditions for a specific analytical window that were then optimized by the analyst.
Figure 7 shows the instrumental response for ascorbic acid additions to oligotrophic seawater. Five-fold lower concentrations of MCLA and XO allowed a significant improvement in analytical sensitivity with a 0.5 nM ascorbic acid standard quenching 30% of the CL signal.
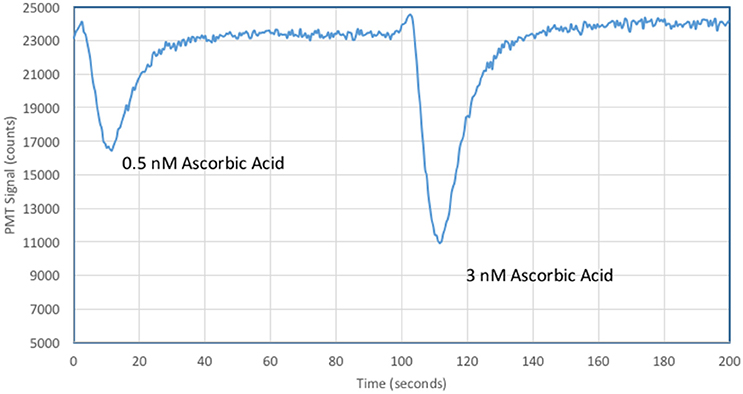
Figure 7. Typical analytical results for ascorbic acid additions to oligotrophic seawater.
The analytical response over a range of ascorbic acid concentrations is shown in Figure 8. The analytical window was 10−7 M > [AO] >10−11 M. The point at [AO] = 10−12 M represents the pure carrier solution (deep seawater) and is included in the fit to define the zero quenching condition. This calibration curve was used to measure antioxidant activity in oligotrophic seawater. The analysis does not imply that ascorbic acid is in seawater, but rather a natural antioxidant exists with the same effective reactivity (keff[ascorbic acid]).
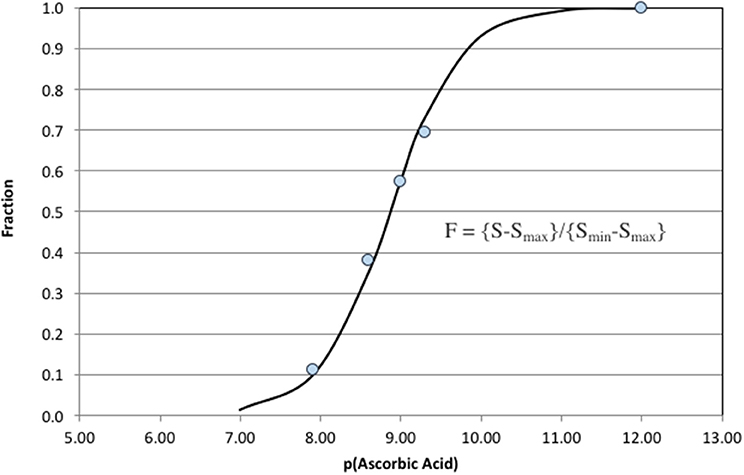
Figure 8. Ascorbic acid additions to oligotrophic seawater. The analytical window in these clean seawater samples was 100–0.01 nM.
Seawater samples collected at depths below 25 m showed no AO activity above the analytical blank. Additions of Fe(II) at nM levels also did not produce a measurable response (data not shown). However, fresh samples from the ship's uncontaminated seawater system consistently contained detectable levels of antioxidants at ~100–400 pM in ascorbic acid units. Antioxidant activity was only observed during daylight and decayed with a half-life of 3–7 min after being placed in the dark. A typical antioxidant decay curve is shown in Figure 9. The measured antioxidant decay of a few minutes was consistent with non-detectable antioxidant activity in deep samples because sample collection from depth took at least 15 min. It is therefore an open question of whether antioxidant species capable of reacting with superoxide exist below the surface euphotic zone.
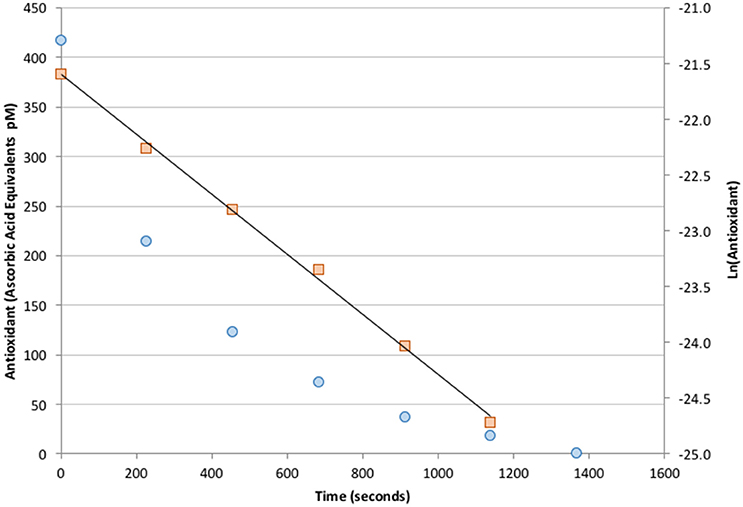
Figure 9. Measured decay of antioxidant concentration in freshly collected seawater placed in the dark (circles, left axis). The signal exhibits a well-defined, first-order decay with a half-life of 3 min (squares, right axis).
The identity of the antioxidant species in the seawater samples is also an open question. If it is assumed that observed antioxidant activity is due to molecules with a reactivity similar to ascorbic acid, then the calculated pseudo-first order rate for superoxide reduction is on the order of 10−2 s−1 [0.4 nM*keff where keff = 8.2 × 10⁷ M−1s−1 (Nandi and Chatterjee, 1987)]. Goldstone and Voelker (2000) have shown that copper complexes are capable of fast bimolecular (109 M−1 s−1) reactions with superoxide in seawater. Rose et al. (2008b) observed pseudo-first order decay of natural superoxide with a rate of 10−3 s−1 in samples collected off the Costa Rica Dome. Heller and Croot (2010) have measured the pseudo-first order decay rates for 10 nM superoxide additions to Cape Verde seawater on the order of 10−2 s−1, and suggested that this rate could be attributed to the catalytic reaction with quinones or other reactive organic species. However, in these measurements the rates of superoxide reduction were remarkably constant, suggesting catalysis, or a reductant with concentrations well above ambient superoxide to produce pseudo-first order decay. It is possible that photochemical activation of quinone-type species could produce the effective antioxidant activity described in this work. However, the different pH and lower steady state superoxide concentrations used in this work make direct comparisons to these previously published superoxide decay rates in pH 8 seawater difficult. Future work will probe the antioxidant activity in the surface waters of lakes and the coastal ocean to determine the range of antioxidant potential as a function of sunlight intensity, dissolved organic carbon, and salinity.
Author Contributions
DK: Primary Author, field measurements. EB: Significant contributions to the kinetic model, and AO literature. ZH: Preliminary investigation of the method. EI: Laboratory calibration of AO method and background literature reviews. KM: Significant collaborator during initial method development and insights on the role of pollutants as stressors to generate antioxidant response.
Conflict of Interest Statement
The authors declare that the research was conducted in the absence of any commercial or financial relationships that could be construed as a potential conflict of interest.
DK is the owner of Waterville Analytical, an instrument company based in Waterville Maine, that makes the apparatus used in this work.
Acknowledgments
DK thanks Frank and Theodora Miselis for financial support of his research program and travel expenses. NSF grant OCE-0961660 to William Balch and Ben Twining provided ship time as part of the Great Belt cruise.
References
Anifowose, A. J., Takeda, K., and Sakugawa, H. (2015). Novel Fluorometric method for the determination of production rate and steady-state concentration of photochemically generated superoxide radical in seawater using 3′,6′-(Diphenylphosphinyl)fluorescein. Anal. Chem. 87, 11998–12005. doi: 10.1021/acs.analchem.5b00917
Besco, E., Braccioli, E., Vertuani, S., Ziosi, P., Brazzo, F., Bruni, R., et al. (2007). The use of photochemiluminescence for the measurement of the integral antioxidant capacity of baobab products. Food Chem. 102, 1352–1356. doi: 10.1016/j.foodchem.2006.05.067
Bielski, B. H. J. (1978). Reevaluation of the spectral and kinetic properties of HO2 and O2-free radicals. Photochem. Photobiol. 28, 645–649. doi: 10.1111/j.1751-1097.1978.tb06986.x
Bielski, B. H. J., Cabelli, D. E., Arudi, R. L., and Ross, A. B. (1985). Reactivity of perhydroxyl/superoxide radicals in aqueous solution. J. Phys. Chem. Ref. Data 14, 1041–1100. doi: 10.1063/1.555739
Burns, J. M., Cooper, W. J., Ferry, J. L., King, D. W., DiMento, B. P., McNeill, K., et al. (2012). Methods for reactive oxygen species (ROS) detection in aqueous environments. Aquat. Sci. 74, 683–734. doi: 10.1007/s00027-012-0251-x
Cai, R., Hettiarachchy, N. S., and Jalaluddin, M. (2003). High-performance liquid chromatography determination of phenolic constituents in 17 varieties of cowpeas. J. Agric. Food Chem. 51, 1623–1627. doi: 10.1021/jf020867b
Fridovich, I. (1970). Quantitative aspects of the production of superoxide anion radical by milk xanthine oxidase. J. Biol. Chem. 245, 4053–4057.
Fujimori, K., Nakajima, H., Akutsu, K., Mitani, M., Sawada, H., and Nakayama, M. (1993). Chemiluminescence of Cypridina luciferin analogs. Part 1. Effect of pH on rates of spontaneous autoxidation of CLA in aqueous buffer solutions. J. Chem. Soc. Perkin Trans. 2, 2405–2409.
Giokas, D. L., Vlessidis, A. G., and Evmiridis, N. P. (2007). On-line selective detection of antioxidants free-radical scavenging activity based on Co(II)/EDTA-induced luminol chemiluminescence by flow injection analysis. Anal. Chim. Acta 589, 59–65. doi: 10.1016/j.aca.2007.02.041
Goldstone, J. V., and Voelker, B. M. (2000). Chemistry of superoxide radical in seawater: CDOM associated sink of superoxide in coastal waters. Environ. Sci. Technol. 34, 1043–1048. doi: 10.1021/es9905445
Goto, T., and Takagi, T. (1980). Cypridina bioluminescence. X. Chemiluminescence of a Cypridina luciferin analog, 2-methyl-6-phenyl-3,7-dihydroimidazo[1,2-a]pyrazin-3-one, in the presence of the xanthine-xanthine oxidase system. Bull. Chem. Soc. Jpn. 53, 833–834.
Heller, M. I., and Croot, P. L. (2010). Kinetics of superoxide reactions with dissolved organic matter in tropical Atlantic surface waters near Cape Verde (TENATSO). J. Geophys. Res. 115, C12038/1–C12038/13. doi: 10.1029/2009jc006021
Hosaka, S., Obuki, M., Nakajima, J., and Suzuki, M. (2005). Comparative study of antioxidants as quenchers or scavengers of reactive oxygen species based on quenching of MCLA-dependent chemiluminescence. Luminescence 20, 419–427. doi: 10.1002/bio.867
Lee, M.-R., Lin, C.-Y., Li, Z.-G., and Tsai, T.-F. (2006). Simultaneous analysis of antioxidants and preservatives in cosmetics by supercritical fluid extraction combined with liquid chromatography-mass spectrometry. J. Chromatogr. A 1120, 244–251. doi: 10.1016/j.chroma.2006.01.075
Nandi, A., and Chatterjee, I. B. (1987). Scavenging of superoxide radical by ascorbic acid. J. Biosci. 11, 435–441. doi: 10.1007/BF02704692
Prior, R. L., Wu, X., and Schaich, K. (2005). Standardized methods for the determination of antioxidant capacity and phenolics in foods and dietary supplements. J. Agric. Food Chem. 53, 4290–4302. doi: 10.1021/jf0502698
Roe, K. L., Schneider, R. J., Hansel, C. M., and Voelker, B. M. (2016). Measurement of dark, particle-generated superoxide and hydrogen peroxide production and decay in the subtropical and temperate North Pacific Ocean. Deep Sea Res. I 107, 59–69. doi: 10.1016/j.dsr.2015.10.012
Rose, A. L., Moffett, J. W., and Waite, T. D. (2008a). Determination of superoxide in seawater using 2-Methyl-6-(4-methoxyphenyl)-3,7- dihydroimidazo[1,2-a]pyrazin-3(7H)-one chemiluminescence. Anal. Chem. 80, 1215–1227. doi: 10.1021/ac7018975
Rose, A. L., Webb, E. A., Waite, T. D., and Moffett, J. W. (2008b). Measurement and implications of nonphotochemically generated superoxide in the Equatorial Pacific Ocean. Environ. Sci. Technol. 42, 2387–2393. doi: 10.1021/es7024609
Schlesier, K., Harwat, M., Böhm, V., and Bitsch, R. (2002). Assessment of antioxidant activity by using different in vitro methods. Free Radic. Res. 36, 177–187. doi: 10.1080/10715760290006411
Keywords: antioxidant, superoxide, xanthine, xanthine oxidase, detection in natural waters, MCLA
Citation: King DW, Berger E, Helm Z, Irish E and Mopper K (2016) Measurement of Antioxidant Activity toward Superoxide in Natural Waters. Front. Mar. Sci. 3:217. doi: 10.3389/fmars.2016.00217
Received: 16 June 2016; Accepted: 20 October 2016;
Published: 14 November 2016.
Edited by:
Julia M. Diaz, Skidaway Institute of Oceanography, USAReviewed by:
Hugh Daigle, University of Texas at Austin, USAKhan M. G. Mostofa, Tianjin University, China
Copyright © 2016 King, Berger, Helm, Irish and Mopper. This is an open-access article distributed under the terms of the Creative Commons Attribution License (CC BY). The use, distribution or reproduction in other forums is permitted, provided the original author(s) or licensor are credited and that the original publication in this journal is cited, in accordance with accepted academic practice. No use, distribution or reproduction is permitted which does not comply with these terms.
*Correspondence: D. Whitney King, ZHdraW5nQGNvbGJ5LmVkdQ==