 Telmo Morato1,2*
 Emile Lemey1
 Gui Menezes2,3
 Christopher K. Pham1,2
 Joana Brito2,4
 Ambre Soszynski2
 Tony J. Pitcher5
 Johanna J. Heymans6
- 1Departamento de Oceanografia e Pescas, Instituto do Mar, Universidade dos Açores, Horta, Portugal
- 2Marine and Environmental Sciences Centre, Universidade dos Açores, Horta, Portugal
- 3Departamento de Oceanografia e Pescas, Universidade dos Açores, Horta, Portugal
- 4Marine and Environmental Sciences Centre, Universidade de Coimbra, Coimbra, Portugal
- 5Aquatic Ecosystems Research Laboratory, Institute for the Oceans and Fisheries, University of British Columbia, Vancouver, BC, Canada
- 6Scottish Association for Marine Science, Scottish Marine Institute, Oban, UK
The Marine Strategy Framework Directive intends to adopt ecosystem-based management for resources, biodiversity and habitats that puts emphasis on maintaining the health of the ecosystem alongside appropriate human use of the marine environment, for the benefit of current and future generations. Within the overall framework of ecosystem-based management, ecosystem models are tools to evaluate and gain insights in ecosystem properties. The low data availability and complexity of modeling deep-water ecosystems has limited the application of ecosystem models to few deep-water ecosystems. Here, we aim to develop an ecosystem model for the deep-sea and open ocean in the Azores exclusive economic zone with the overarching objective of characterizing the food-web and structure of the ecosystem. An ecosystem model with 45 functional groups, including a detritus group, two primary producer groups, eight invertebrate groups, 29 fish groups, three marine mammal groups, a turtle and a seabird group was built. Overall data quality measured by the pedigree index was estimated to be higher than the mean value of all published models. Therefore, the model was built with source data of an overall reasonable quality, especially considering the normally low data availability for deep-sea ecosystems. The total biomass (excluding detritus) of the modeled ecosystem for the whole area was calculated as 24.7 t km−2. The mean trophic level for the total marine catch of the Azores was estimated to be 3.95, similar to the trophic level of the bathypelagic and medium-size pelagic fish. Trophic levels for the different functional groups were estimated to be similar to those obtained with stable isotopes and stomach contents analyses, with some exceptions on both ends of the trophic spectra. Omnivory indices were in general low, indicating prey speciation for the majority of the groups. Cephalopods, pelagic sharks and toothed whales were identified as groups with key ecological roles in the ecosystem. Due to concerns on the use of ecosystem models with low confidence in exploring management decisions and ecological theories, the current version of this model should only be use with caution until biomass estimates are validated with survey data or the model is fitted to time series.
Introduction
The European Union (EU) Marine Strategy Framework Directive (MSFD) defines the marine environment as “a precious heritage that must be protected, preserved and, where practicable, restored with the ultimate aim of maintaining biodiversity and providing oceans which are clean, healthy and productive (EU Directive 2008/56/EC).” The MSFD requires member states to adopt an ecosystem approach to management of human activities that puts emphasis on maintaining the health of the ecosystem alongside sustainable use of marine goods and services. MSFD encourages the implementation of an ecosystem-based approach to fisheries management that would take into account the environmental impacts of fishing. However, the EU's Common Fisheries Policy (CFP) still is a single-species based fisheries management policy, implementing total allowable catches for target species. It has been criticized for failing in delivering long-term sustainability of the fish stocks and reducing the adverse effects of fisheries on the whole ecosystem (Beddington et al., 2007; Khalilian et al., 2010; Villasante et al., 2012). Under the recent CFP reform (EU Regulation 1380/2013), ecosystem-based approaches are considered acceptable to address the specific problems of mixed fisheries but still seldom used.
Within the overall concept of ecosystem-based management, ecosystem models provide a holistic approach to address the various complexities and multiple drivers associated with marine ecosystems (Larkin, 1996; Espinoza-Tenorio et al., 2011; Link et al., 2012) and can be used to evaluate trade-offs between fisheries and conservation (Pikitch et al., 2004). However, modeling complex marine ecosystems with its associated human uses is very challenging and encompasses a degree of uncertainty (Fulton et al., 2003; Garcia et al., 2003; Plagányi and Butterworth, 2004; Pinnegar et al., 2005; Coll et al., 2009; Forrest et al., 2015). Nevertheless, the development of the Ecopath with Ecosim (EwE) modeling approach, based on Polovina (1984) and further developed by Christensen and Pauly (1992, 1993, 1995), opened the way toward holistic ecosystem modeling that describes the food-web structure and the functioning of marine ecosystems. EwE has proven to be a useful tool for quantifying a large array of ecosystem indicators (Christensen and Walters, 2004; Heymans et al., 2014; Shannon et al., 2014) necessary for assessing Good Environmental Status (GES) under the MFSD (Piroddi et al., 2015). A recent global overview of the applications of the EwE have demonstrated the use of this approach in a wide variety of ecosystems and to analyse wide range of research questions (Colléter et al., 2015).
Deep-water and open-ocean ecosystems are characterized by complex trophic links and are, with a few exceptions, data-limited. The low data availability and complexity of modeling deep-water ecosystems has limited the application of ecosystem models to few deep-water ecosystems (Heymans et al., 2011; Tecchio et al., 2013, 2015). Nevertheless, Heymans et al. (2011) concluded that in some ecosystems there are sufficient data available for developing ecosystem models for deep-sea ecosystem warning, however, for serious potential sources of uncertainties. Only if acknowledging such limitations, the ecosystem modeling approach can help our understanding of deep-water and open-ocean ecosystem functioning and exploring management scenarios and policy options.
The Azores is an oceanic archipelago in the mid North-Atlantic Ocean, between continental Europe and North America. The seafloor is mostly deep but a large number of seamounts, a fraction of the Mid Atlantic Ridge, and the slopes of the islands compose the shallowest parts (Perán et al., 2016). After the first expeditions to the open ocean and the deep-sea in the late nineteenth century, extensive scientific research based in the Azores has opened a window on the functioning of large oceanic, deep-sea and seamount ecosystems and the impacts of human activities in such ecosystems, making this region a good case study for ecosystem model of the deep-sea and open ocean. We therefore hypothesized that there is sufficient data to construct a deep-sea ecosystem model of the Azores. The overarching goal of this study was to develop an ecosystem model for the deep-sea and open ocean in the Azores exclusive economic zone (EEZ) to characterise the food-web and ecosystem structure of the open-ocean and deep-sea environments of the Azores.
Materials and Methods
The Study Area: the Azores Archipelago
The Azores is a Portuguese archipelago composed of nine islands situated on the Mid-Atlantic ridge (Figure 1) with an extensive EEZ of about 1 million km2. As a volcanic archipelago of recent origin, the islands have narrow shelves and steep slopes, and the surrounding waters have an average depth of 3000 m with only 0.8% of the EEZ being less than 500 m deep. The highly irregular submarine topography contains vast undersea mountain ranges, with around 100 large and 400 small seamounts-like features (Morato et al., 2008, 2013), deep-water coral gardens and reefs (Sampaio et al., 2012; Braga-Henriques et al., 2013; de Matos et al., 2014; Tempera et al., 2015), sponge grounds (Tempera et al., 2012, 2013), and hydrothermal vents (Cardigos et al., 2005; Cuvelier et al., 2009). In winter a deep mixed layer is present at 150 m and average sea surface temperature (SST) is about 15–16°C. During summer, a seasonal thermocline develops at 40–100 m and the average SST is typically 22–24°C (Amorim et al., in review).
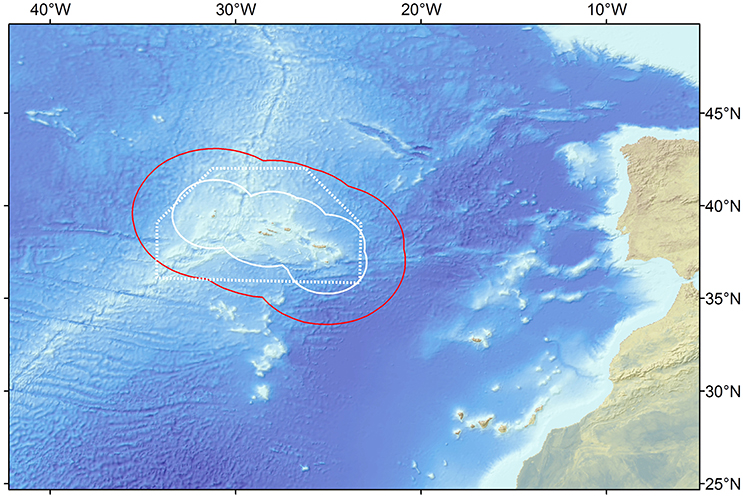
Figure 1. Location of the study area in the Northeast Atlantic showing the Azores archipelago region, its exclusive economic zone (red line), 100 nm limit (straight white line) and the trawl ban area (dotted white line).
The region is characterized by very complex ocean circulation patterns. Large scale circulation is dominated by the eastward-flowing Gulf Stream, which forms a current system with many unstable eddies and meanders, the cold North Atlantic Current in the north, and the warm Azores Current in the south (Santos et al., 1995; Alves and Verdière, 1999; Johnson and Stevens, 2000; Bashmachnikov et al., 2009). Various water masses are present around the Azores. North Atlantic Central Water occurs above a permanent thermocline, located at depths shallower than 700 m, North Atlantic Deep Water is the dominant water mass below 2000 m depths, and at intermediate depths, northern sub-polar waters and Antarctic Intermediate Water predominate, but Mediterranean Outflow Water can also occur (Santos et al., 1995; Johnson and Stevens, 2000; Mann and Lazier, 2006).
For this study, we confined the study area to the boundary of the EEZ, which covers an area of 954,563 km2. The area includes the deep-sea, open-ocean, some seamounts, parts of the Mid Atlantic Ridge and island slopes (Figure 1). The reference year of 1997 was chosen as most of the data used to construct the base model (diet and growth parameters) originated from that year.
Fisheries Description
Marine resources are central to the Azores' local economy, but bottom fishing grounds are limited and scattered on the island slopes and seamounts (da Silva and Pinho, 2007; Diogo et al., 2015). The Azores fleet is dominated by a small-scale artisanal fishing fleet (Carvalho et al., 2011) with only 10–20% of the fleet being a large-scale, semi-industrial fishing fleet. An overview of the main fisheries in the Azores, their gear types, target species, fishing vessels and regulations was taken from Gaspar (2011). A total of 11 Azorean fisheries were included in the model: the deep-water bottom longline and handline fisheries targeting mostly deep-water demersal fishes such as blackspot seabream (Pagellus bogaraveo), wreckfish (Polyprion americanus), alfonsinos (Beryx spp.) and the blackbelly rosefish (Helicolenus dactylopterus); the Azores pelagic longline, Portuguese mainland pelagic longline, and the foreign pelagic longline fisheries targeting swordfish (Xiphias gladius) and blue shark (Prionace glauca); the pole and line tuna fishery (including the live-bait); the small-size pelagic fisheries targeting mostly blue jack mackerel (Trachurus picturatus) and chub mackerel (Scomber colias); the drifting deep-water longline targeting black scabbardfish (Aphanopus carbo) which is a recent fishery in the Azores (Machete et al., 2011); the commercial coastal invertebrates; the recreational fishing; the experimental bottom trawling; and the squid (Loligo forbesii) fisheries.
Modeling Approach
Ecopath with Ecosim (EwE) is a food-web modeling facility that can be used to build trophic static mass-balanced snapshots (Ecopath) and to create temporal dynamics (Ecosim) of an ecosystem (Christensen and Pauly, 1992; Walters et al., 1997, 2000; Pauly et al., 2000; Christensen and Walters, 2004; Christensen et al., 2008). EwE has been widely adopted all over the world (Colléter et al., 2015) and has led to some ground-breaking science (Pauly and Christensen, 1994; Pauly et al., 1998; Watson and Pauly, 2001; Branch et al., 2010; Smith et al., 2011; Irigoien et al., 2014). However, it should be used with caution to avoid common mistakes and pitfalls (Ainsworth and Walters, 2015). EwE has been described in detail elsewhere (e.g., ecopath.org; Christensen and Pauly, 1992; Walters et al., 1997; Christensen and Walters, 2004), with the best practice in Ecopath described recently (Heymans et al., 2016).
Ecopath models parameterization is based in two master equations, one describing the production term and the other the energy balance for each functional group. The first master equation ensures a mass balance between groups and expresses production as a function of the catch, predation, net migration, biomass accumulation and other mortality (Equation 1). The second master equation is based on the principle of conservation of matter within each group (Equation 2; Christensen and Walters, 2004). Each group is parameterised with its biomass (B, t·km−2), production over biomass ratio or production rate (P/B, year−1), consumption over biomass ratio or consumption rate (Q/B, year−1), the prey-predator interaction in the form of a diet composition (DC) table, ecotrophic efficiency (EEi), the biomass accumulation rate (BAi, year−1) and the net migration rate (Ei, year−1).
Model Construction and Parametrization
The current version of the Azores model was built upon previous models developed for this region and associated seamounts (Guénette and Morato, 2001; Morato and Pitcher, 2002; Morato et al., 2009). The present model focused mostly on intermediate and deep-water species present in the Azores ecosystem and used, when possible, recent and local data for model parameterization. Species with biological and ecological similarities were grouped into functional groups or biomass pools. Fish species lists were compiled from previous models, and completed with more recent biodiversity studies of the Azores (Supplementary Data Sheet 1). The present model took into consideration 387 fish species representing about 66% of the known marine fish biodiversity (WoRMS Editorial Board, 2016). Non-fish functional groups were defined based on a previous Ecopath model of the Azores (Guénette and Morato, 2001) and an Ecopath model for a hypothetical seamount in the North Atlantic (Morato et al., 2009). With the exception of marine mammals (16 most common species, representing 66% of the known biodiversity; Mónica Silva, pers. comm.), seabirds (8 most common species, 73% of reported nesting species; Verónica Neves, pers. comm.), and sea turtles (3 most common species, 60% of the reported species; Marco Silva, pers. comm.), most of the non-fish groups were poorly represented in the model due to the limited amount of information available. In this model, energy related parameters are expressed in t·km−2 of wet weight and the temporal unit is year−1.
Input Parameters
Fish species present in the Azores EEZ were compiled based on a checklist of marine fishes of the Azores (Santos et al., 1997), an updated list of commercial species caught in the Azores for the period 1950–2010 (Pham et al., 2013), a list of fish species caught on fisheries research cruises (Menezes, unpublished data), a list of deep-pelagic fishes compiled during mesopelagic trawling surveys (Sutton et al., 2008), and a list of coastal species sighted during a sub-aquatic visual census program (Afonso, 2002). Of the 387 fish species complied, only 223 (representing 38% of the known fish biodiversity) were included in the model because of data limitations. All of the selected species were allocated stepwise to 29 functional groups after compiling a dataset with diet composition, asymptotic length and average habitat depth for each species, gathered from local studies and completed with Fishbase data (Froese and Pauly, 2015). In addition, some fish were separated into single species functional groups because of their commercial interest and/or to allow specific management simulations. These are: H. dactylopterus, Conger conger, Pontinus kuhlii, Raja clavata, Phycis phycis, Pagrus pagrus, Beryx splendens, Beryx decadactylus, P. bogaraveo, Mora moro, L. caudatus. The model presented here consisted of 45 functional groups: one detritus group, two primary producer groups, eight invertebrate groups, 29 fish groups, three marine mammal groups, one sea-turtle and one seabird group (Supplementary Data Sheet 1).
Model parameters, P/B, Q/B, and production of consumption ratio (P/Q, unitless) were estimated from the literature, with preference to studies within our area or from similar areas, or using empirical equations (Pauly, 1980; Palomares and Pauly, 1998). Habitat area fraction, which is the habitat area to total model area ratio, for each group was calculated using habitat depth ranges compiled from local studies (e.g., Menezes et al., 2006) and Fishbase, and converted into surface areas using bathymetric grid of the Azores. Details on the calculations or sources of these model parameters and the habitat area fraction are presented in Supplementary Data Sheet 1.
The model pedigree describing the origin and quality of each parameter was calculated and used to analyse our hypothesis that there is sufficient data to construct an ecosystem model of the Azores. This was done by comparing with the estimated pedigree values with the reported ranges in Colléter et al. (2015). The model pedigree is also used to assign confidence intervals to the data inputs (Pauly et al., 2000).
A diet matrix was assembled using preferentially local literature on stomach content analyses, completed with other literature and adapted using empirical knowledge (Supplementary Table 1). To constrain the model and due to a lack of direct biomass assessments, biomass expressed in tonnes of wet weight per square kilometer of species' habitat, was estimated empirically for the two primary producer groups, the detritus group, and four top predator groups. For the remaining groups, biomass was left to be estimated by the model, assigning different EE values to the different groups (Supplementary Table 1). To balance the model, diet compositions were modified, and for some fish groups, ratios of P/B were left to be estimated by the model, using empirical P/Q values as input.
Marine Catch Data
Total marine catch data was obtained from Pham et al. (2013). The dataset contains both official fishery statistics and estimated illegal, unreported, and unregulated catch (IUU) within the Azores EEZ. However, discards (fish returned to the sea), were not reported separately. Species catch data was assigned to the different fishing fleets and the functional groups. Catch data that could not be assigned to a specific functional group or fleet (e.g., unidentified marine species) were redistributed into the groups exploited by the various fleets. Catch data was constructed for the reference year 1997 (Figure 2; Supplementary Table 2) and then expressed in tonnes of wet weight per square kilometer of the model area. The tuna pole and line fishery is together with the deep-water bottom longline and handline fishery accountable for the majority of the catch of marine resources in the Azores during the studied period (Figure 3). Before the prohibition of bottom trawling in a large part of the EEZ, some trawling experiments were performed in 2001–2002 and were responsible for a significant amount of catch (Melo and Menezes, 2002). The total marine production in the Azores currently stands at over 20,000 tonnes, corresponding to about € 60 million in landed value (Pham et al., 2013).
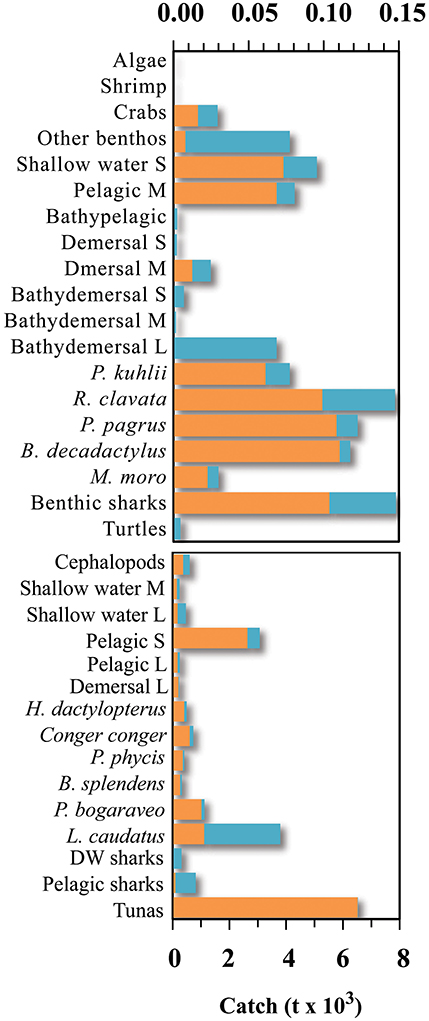
Figure 2. Fisheries catch for the different groups included in the Azores ecosystem model, for the reference year 1997 (adapted from Pham et al., 2013). S, small-size; M, medium-size; L, large-size.
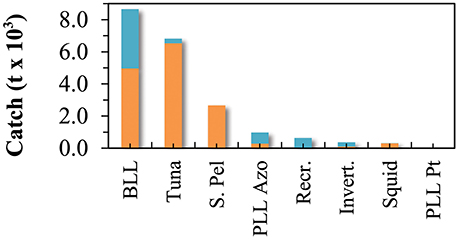
Figure 3. Marine fisheries catch for the different fleets included in the Azores ecosystem model, for the reference year 1997 (adapted from Pham et al., 2013). BLL is deep-water bottom longline and handline fisheries, Tuna refers to the pole and line tuna fishery (including the live-bait catch), S. Pel refers to the small-size pelagic fisheries, PLL Azo is the Azores pelagic longline fisheries, Recr. is the recreational fishing, Invert. is the commercial coastal invertebrates fisheries, Squid is the squid (L. forbesii) fisheries, and PLL Pt refers to the Portuguese mainland pelagic longline fisheries.
Network Analysis
After mass-balancing the model, a trophic network analysis was performed. For each functional group, a fractional trophic level (TL) was calculated based on the diet. An omnivory index, representing the trophic specialization of the predator (Christensen et al., 2008), was calculated for each consumer group. The “Keystoneness” index (KS), as defined by Libralato et al. (2006) was also calculated for each functional group. The KS allow the identification of the keystone species, i.e., relatively low biomass groups that have a structuring role in their food webs, in the given ecosystem. The mixed trophic impact (MTI) routine, developed by Ulanowicz and Puccia (1990), was applied to evaluate the impact of direct and indirect interactions on the static food web model. The routine was used to assess the theoretical impacts of increased biomass of a particular group on the biomass of the other groups, assuming that the trophic structure remains the same.
A selection of ecosystem indicators were calculated, allowing for a comparison of ecosystem properties with other models. Amongst others, the sum of all consumption, exports, respiratory flows, flows into detritus, and the ratio of total primary production/total respiration were calculated. The System Omnivory Index (OI), defined as the average OI of all consumers weighted by the logarithm of their consumption, was calculated. This index is a measure of the trophic specialization of the whole system. The Total System Throughput (TST) was calculated by totalling all biomass fluxes occurring in the system.
Results
Azores Ecopath Model
The various parameters for the balanced Ecopath model of the Azores ecosystem are presented in Table 1. Additional to those parameters, the Pedigree index was estimated to be 0.53 which although being similar to many other models (e.g., Corrales et al., 2015) showed that some input data should be improved. Due to the scarcity of biomass data, most of the ecotrophic efficiencies (EE's) had to be estimated based on expert knowledge. Nevertheless, EE of the top predator groups (group 40–43, Table 1) that were estimated by the balanced model were generally low, ranging from 0.13 (toothed whales) to 0.46 (baleen whales) and indicating that large fractions of the production of those groups is not being used in the modeled system. The EE's of phytoplankton and algae are 0.11 and 0.013, respectively; suggesting low utilization of primary production in the system.
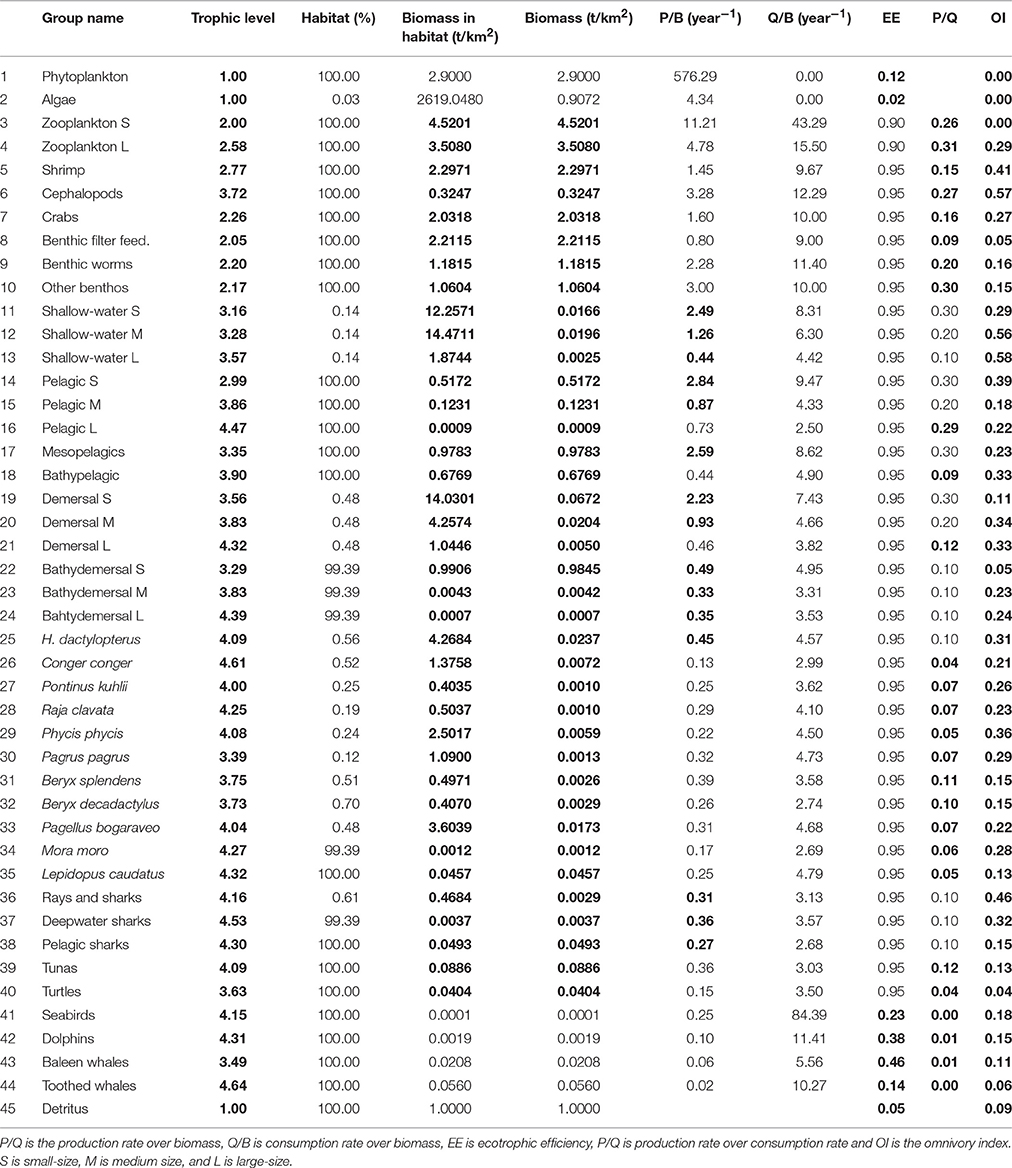
Table 1. Input parameters for Azores ecosystem model showing those estimated by the model in bold.
The total biomass (excluding detritus) of the modeled ecosystem for the whole area was calculated as 24.7 t km−2 (Table 1). Primary producers form 15.4% of the total biomass (3.8 t km−2) and fish biomass contributed to 14.8% (3.7 t km−2). The largest part of the total ecosystem biomass, 17.1 t km−2 (69.3%), was composed by the invertebrate and zooplankton groups, while the non-fish groups occupying the higher trophic levels (seabirds, dolphins, baleen whales and toothed whales) contributed only to 0.5% of the total biomass (0.12 t km−2). The trophic spectra of the ecosystem is shown in Figure 4.
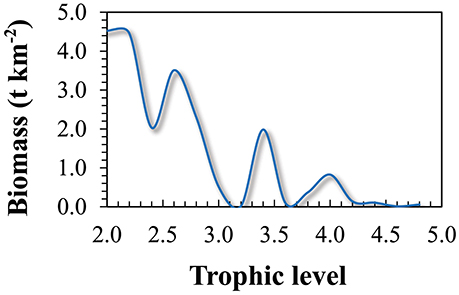
Figure 4. Trophic spectra of the Azores ecosystem model for the reference year 1997.
The Azores ecosystem model included five trophic levels with toothed whales and C. conger, presenting the top predators in the ecosystem with TL of 4.64 and 4.61, respectively. Other functional groups with a TL > 4 included the deepwater sharks, large-size pelagic fish, large-size bathydemersal fish, L. caudatus, large-size demersal fish, dolphins, pelagic sharks, M. moro, R. clavata, rays and other sharks, seabirds, tunas, H. dactylopterus, P. phycis, P. bogaraveo, and P. kuhlii. The remaining fish groups have a TL ranging from 2.99 (small-size pelagic fish) to 3.90 (bathypelagic fish). Invertebrate functional groups were estimated to have a TL between 2.05 (benthic filter feeders) and 2.77 (shrimps), with the exception of cephalopods who were estimated to have a TL of 3.72. Zooplankton functional groups have a TL of 2.00 (small-size) and 2.58 (large-size and gelatinous). The food web and flow diagram demonstrated the complex structure of the ecosystem (Figure 5).
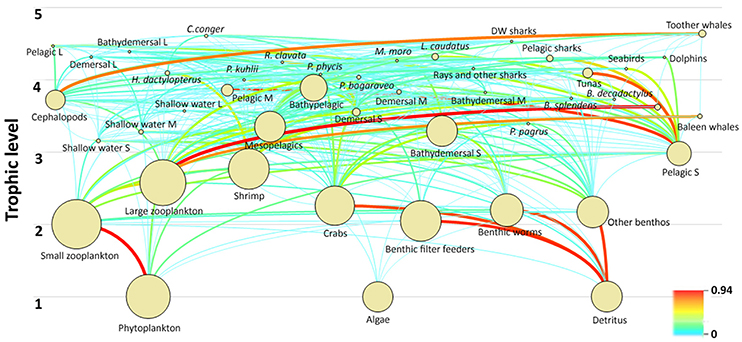
Figure 5. Diagram of the food web and trophic flows of the Azores ecosystem model for the reference year 1997. The circles are dimensional representations proportional to the logarithm of group biomasses and the lines indicate the trophic links among functional groups.
The mean trophic level for the total marine catch of the Azores (Figure 6) was estimated to be 3.95, matching the trophic level of the bathypelagic and medium-size pelagic fish groups, but situated below the trophic levels of most of the top predators in the system. Drifting deepwater longline and the pelagic longline showed the highest values of 4.40 and 4.34 respectively, approximating the trophic levels of some top predator groups. Bottom logline and handline fishery showed a trophic level of 4.19, while the small-size pelagic fisheries showed the lowest trophic level of 2.99.
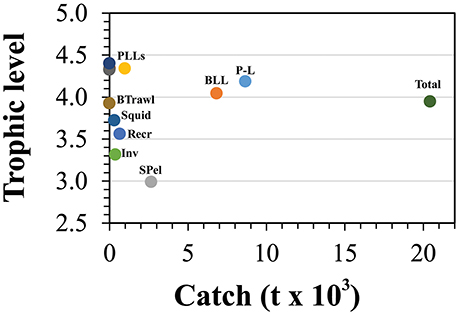
Figure 6. Mean trophic levels of the catch for all fishing fleets included in the Azores ecosystem model for the reference year 1997. BLL is deep-water bottom longline and handline fisheries, P-L refers to the pole and line tuna fishery (including the live-bait catch), SPel refers to the small-size pelagic fisheries, PLLs refers to all pelagic longline fisheries, Recr is the recreational fishing, Inv is the commercial coastal invertebrates fisheries, Squid is the squid (L. forbesii) fisheries, and BTrawl is the bottom trawling experimental fishing.
The Omnivory Index (Table 1) showed that most groups were feeding on few trophic levels. The OI ranged from 0.04 to 0.58, with shallow-water large-size fish, cephalopods, shallow-water medium-size fish, and rays and other sharks showing the highest index and sea turtles, benthic filter feeders, small-size bathydemersal fish and toothed whales showing the lowest values of OI.
The Mixed Trophic Impact (MTI) analysis (Figure 7) revealed the direct and indirect impact of an increase/decrease in biomass of an impacting group or fisheries catch on an impacted group or fishery. The MTI indices ranged from 1.8, representing a strong positive effect of cephalopods on toothed whales, to −2.0, revealing a strong negative effect of toothed whales on its main prey. The MTI analyses showed the influence of toothed whales, pelagic sharks, cephalopods and small-size pelagic fish in the ecosystem, having both strong positive and negative impacts in many components of the ecosystem. For example, toothed whales had a strong negative impact on their main prey (e.g., cephalopods) but also had a positive impact on other groups or species (e.g., large-size pelagic fish or Beryx spp.), through mixed trophic links such as removal of their predators (Figure 7). On the other hand, small-size pelagic fish had a strong positive impact on its predators (e.g., Seabirds or tuna) and a negative impact though complex trophic links (e.g., toothed whales). Most groups will have a positive impact of their fisheries while most fisheries showed a strong negative effect on its target species (Figure 7). However, some groups had a negative impact on some fisheries as for example, toothed whales and cephalopods were shown to have a negative impact on the pole and line and pelagic longline fisheries. Dolphins were found not to have a significant impact on any type of fisheries.
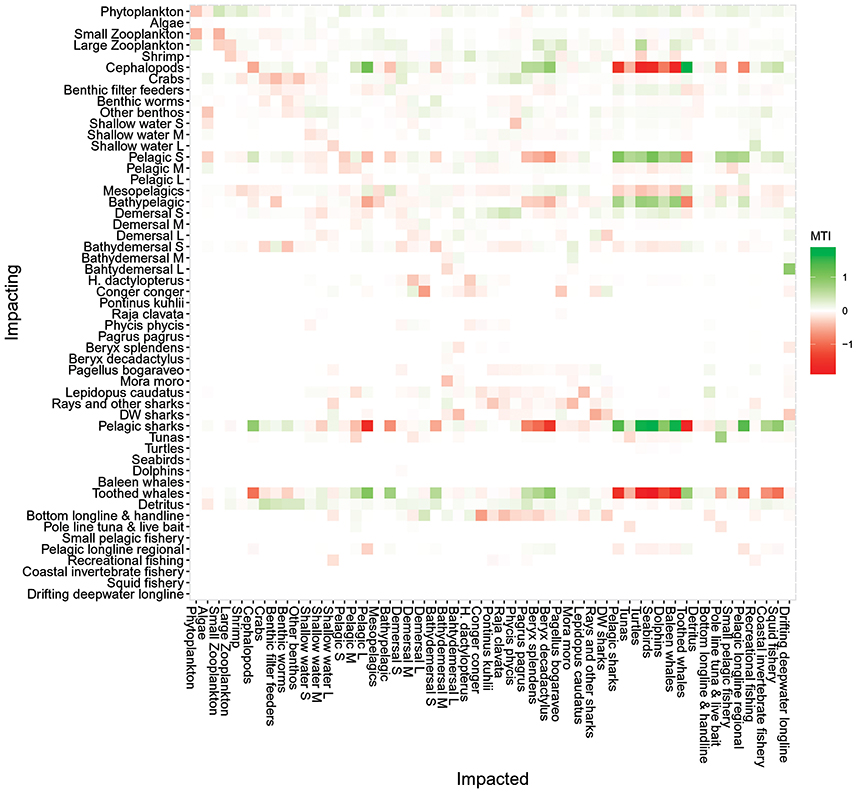
Figure 7. Mixed trophic impact analysis of the Azores ecosystem model for the reference year 1997. The figure shows positive (green), negative (red), or no (white) impacts. Impacting groups are shown on the vertical axis, and impacted groups on the horizontal axis. S, small-size; M, medium-size; L, large-size; DW, deep-water.
The Keystoneness index calculated according to Libralato et al. (2006) were highest for pelagic sharks (#38, KS = 0.66), toothed whales (#44, KS = 0.64) and cephalopods (#6, KS = 0.61; Figure 8). These groups also showed the highest relative total impact, highlighting their importance in the ecosystem structure. The groups of the small-size pelagic fish and bathypelagic fish (group #14 and #18) also showed high keystoneness (KS = 0.39 and 0.30, respectively) indicating an important role as prey in the food web.
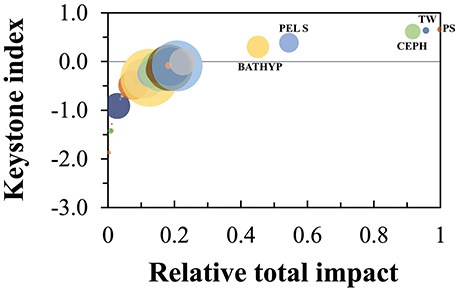
Figure 8. Keystoneness analysis for each functional group, according to Libralato et al. (2006), of the Azores ecosystem model for the reference year 1997. The keystoneness index is shown on the vertical axis, the relative total impact on the horizontal axis. BATHYP is bathypelagic fish, PEL S is small pelagic fish, CEPH is cephalopods, TW is toothed whales, and PS is pelagic sharks.
Ecological summary characteristics of the system are represented in Table 2, along with general ecosystem statistics for other deep-sea models. The ratio of total primary production/total respiration (Pp/R) was 8.2 while the total primary production/total biomass ratio (Pp/B) was 67.7. The total transfer efficiency of the system was estimated to be 18.8%.
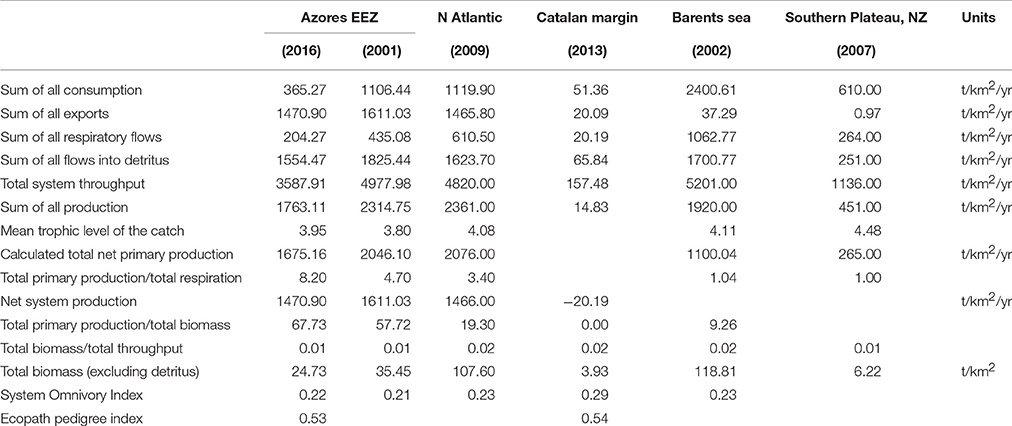
Table 2. Summary ecosystem statistics calculated for the present model of the Azores exclusive economic zone (Azores EEZ, 2016), with statistics reported for other deep-sea ecosystem dominated models: Azores EEZ (Guénette and Morato, 2001), North Atlantic sea theoretical seamount (Morato et al., 2009), Catalan margin (Tecchio et al., 2013), Barents Sea (Blanchard et al., 2002), New Zealand Southern Plateau (Bradford-Grieve et al., 2003).
Discussion
An ecosystem model for the Azores EEZ using 1997 as the reference year was built using various data sources. This reference year seemed appropriated for the purpose of the study since it will allow for model validation with data collected afterwards, but it represents a snap-shop of the ecosystem state. Ecological groups were chosen so that the model could address deep-water and open ocean related research questions, as compared to the Azores ecosystem model presented in Guénette and Morato, 2001, where coastal, shallow water fish groups were overrepresented. Total marine fishery catch data from Pham et al. (2013), including illegal, unreported and unregulated catch for the Azores EEZ, is assumed to be of high confidence. However, many input parameters such as biomass, diet composition, P/B and Q/B were often estimated from other regions, from other models or even guesstimated, leading to a decreased quality and higher uncertainty associated with the model, and inconsistencies in the estimation of the biomass, P/B, Q/B and P/Q ratios. Nevertheless, the model pedigree (0.53) was similar to the value reported for the deep-sea ecosystem (0.54) in the NW Mediterranean Sea (Tecchio et al., 2013) and higher than the overall mean (0.47; range between 0.14 and 0.74) of the pedigree index recorded for 34 models (Colléter et al., 2015). Therefore, the model was built with source data of an overall reasonable quality, especially considering the normally low data availability for deep-sea ecosystems (Heymans et al., 2011).
The model construction highlighted the lack of valued information for some of the groups of the ecosystem. Especially biomass estimates for the Azores EEZ were lacking and providing those biomass estimates from stock assessments seem to be the key to enhance the model quality and accuracy. Biomass was calculated empirically for the primary producer groups and some top predator groups to constrain the model within total biomass boundaries, and to deal with the issue of migrating species. Migration was accounted for by estimating the average annual biomass for these top predator migrating groups. The biomass of other species were estimated by the model and found comparable to the estimates presented in the previous ecosystem model for the Azores (Guénette and Morato, 2001). Estimated biomasses for three commercially important fish species, representing the only single-species groups in the previous model (H. dactylopterus, Pagellus bogaraveo and P. phycis), were similar between the two models. Other groups that showed large differences in estimated biomasses were the large-size pelagic (two orders of magnitude lower in the current model), small-size demersal fish (one order of magnitude higher), and large-size demersal fish and turtles groups (one order of magnitude lower). Biomass estimates presented by Guénette and Morato, 2001 were either estimated by the model, or derived empirically by the authors, so whether these inconsistencies are improvements or deteriorations in model quality remains unclear.
Trophic level estimates for the single species fish groups were found similar to those TL estimated by stable isotope analyses at the Condor seamount in the Azores EEZ (Colaço et al., 2013) and a stomach content analysis of demersal fish in the Azores (Morato-Gomes et al., 1998); i.e., trophic levels within the range of ±0.2 TL from reported values. The only exceptions were C. conger and R. clavata where the model estimated a TL of 0.4 and 0.3 higher, respectively. Also some non-single species groups (deepwater sharks, shrimps and crabs) was compared and showed similar TL between the model the stable isotopes estimates (Colaço et al., 2013). This could indicate that the diet composition data of those groups is of reasonable quality, and that only the diet input for C. conger and R. clavata should be reassessed, even though the diet composition information for these last species was taken from stomach content analyses from within the Azores EEZ (Morato et al., 1999, 2003). The surprisingly high TL of the cephalopod group may be related to findings that some deep-sea cephalopod are top predators (Cherel et al., 2009; Fanelli et al., 2012). On the other hand, the trophic levels of low TL groups such as small- and large- size zooplankton, and benthic worms may be underestimated compared to published estimates from stable isotopes (Fanelli et al., 2011a,b, 2013), revealing once again the limited information available for these groups in the Azores. Adjusting the diet composition of low trophic level groups to increase their TL didn't have an impact in the model estimated parameters, rather than producing an overall overestimation of the TLs of all other groups in the model.
Omnivory indices were overall low, indicating prey speciation for the majority of the groups. This is contrary to the perception that deep-sea species are opportunistic feeders, feeding on a wide range of prey species (Gage and Tyler, 1991; Anastasopoulou et al., 2013; Gale et al., 2013; Mueller et al., 2014; Bernal et al., 2015; Hoving and Robison, 2016). Recent studies, however, have shown specialized feeding strategies in some deep-sea organisms (e.g., Romeu et al., 2016). Nevertheless, in the Azores there is still limited knowledge concerning the diet composition of most deep-sea species, highlighting the difficulty to quantify opportunistic feeding (e.g., scavenger behavior) in deep-sea environments.
The functional groups identified as keystone, were also those that had the highest impact in the mixed trophic impact analysis. A keystone group has a disproportionally large impact on other groups in the system, in spite of having a relatively low abundance (Paine, 1995). Cephalopods are one of these keystone groups that play a major role in the marine ecosystem (Rodhouse and Nigmatullin, 1996; Fanelli et al., 2012), however their exact trophic relationships in the Azores deep-sea environment remains unclear. They are proven to be important prey species for large-size predators (e.g., sperm whales), but far less is known about their diets (Clarke, 1996). The top predators pelagic sharks and toothed whales also showed a high keystoneness, in accordance to what has been found in other regions (Libralato et al., 2006).
Future versions of this model should focus on finding an improved ecological grouping that better differentiates between deep, intermediate and shallow water species, and by including feeding guilds (e.g., according to feeding type). This will be paramount mainly for lower trophic levels where the available information is most limited. Additionally, future models should also consider grouping animals according to their larval dispersal distances, since this has been demonstrated of paramount importance for marine conservation (Baco et al., 2016). The use of multistanza (size-age structured species groups) for certain commercial species could also increase the later policy simulation options. Dealing with migrating species is another important issue for improving the model quality, but is complicated due to EwE's inherent limitation for dealing with migration (Christensen and Walters, 2004). And finally providing biomass estimates for a number of groups will greatly improve the model quality.
Heymans et al. (2016) raised serious concerns on the use of ecosystem models with low confidence in exploring management decisions and ecological theories. Therefore, the current version of the ecosystem model should be used with caution until biomass estimates are validated with survey data or the model is fitted to time series. Since the Azores fishing industry is dominated by hook and line gears (Carvalho et al., 2011), and since hook and lines have been demonstrated not suitable for total biomass estimates, fitting the model to relative abundances from survey data might be a way forward toward model validation. In addition, comparing the estimated biomasses across taxa and trophic levels as suggested by Link (2010) and re-iterated in Heymans et al. (2016) will point to areas where better biomass estimates are needed.
However, this model is an important step toward the ecosystem-based management that is needed under the MSFD and CFP to address ecosystem-based related management questions. To assess GES of marine waters, criteria for 11 descriptors of the MSFD have been adopted but there is still a substantial need to develop additional scientific understanding to determine appropriated ecosystem metrics. Food-web models such as the one developed here, have been shown to be useful in obtaining appropriated indicators of GES (Shannon et al., 2014; Kleisner et al., 2015; Coll et al., 2016; Reed et al., 2016).
Author Contributions
TM and TP designed the study. TM, EL, GM, CP, JB, and AS collected and processed most of the data. TM, EL, TP, and JH preformed most of the analyses. All authors contributed to writing the paper.
Funding
This research received funding from Fundo Regional da Ciência, Tecnologia (FRCT), through the research project 2020-M2.1.2/I/026/2011 (Pro-Convergência), and from the European Union's Horizon 2020 research and innovation programme under grant agreement No. 633680, DiscardLess project. The authors also acknowledge funds provided by the Fundação para a Ciência e a Tecnologia (FCT) through the strategic project (FCT/UID/MAR/04292/2013) granted to MARE. TM is supported by Program Investigador FCT (IF/01194/2013).
Conflict of Interest Statement
The authors declare that the research was conducted in the absence of any commercial or financial relationships that could be construed as a potential conflict of interest.
Acknowledgments
Building an Ecopath model is a very data intensive and time consuming task, involving many colleagues and collaborators. With a high probability of not mentioning all collaborators, the authors would like to acknowledge the important contributions from Ricardo Santos, Miguel Machete, João Gil Pereira, Pedro Afonso, Fernando Tempera, Filipe Porteiro, Ana Colaço, Mónica Silva, Verónica Neves, Maria Magalhães, Jorge Fontes, Natacha Carvalho, Rui Prieto, Helena Krug, João Gonçalves, Gilberto Carreira, Marina Carreiro-Silva, Ricardo Medeiros, Hugo Diogo, Frederic Vandeperre, Alexandra Rosa, Eva Giacomello, Dália Reis, ngela Canha, Carla Dâmaso.
Supplementary Material
The Supplementary Material for this article can be found online at: http://journal.frontiersin.org/article/10.3389/fmars.2016.00245/full#supplementary-material
References
Afonso, P. (2002). Spatial Patterns in the Littoral Fish Community of the Azores. MS thesis, University of Coimbra.
Ainsworth, C. H., and Walters, C. J. (2015). Ten common mistakes made in Ecopath with Ecosim modelling. Ecol. Model. 308, 4–17. doi: 10.1016/j.ecolmodel.2015.03.019
Alves, M., and Verdière, A. C. (1999). Instability dynamics of subtropical jet and applications to the Azores front systems: eddy-driven mean flow. J. Phys. Oceanogr. 29, 83–863. doi: 10.1175/1520-0485(1999)029<0837:IDOASJ>2.0.CO;2
Anastasopoulou, A., Mytilineou, C., Smith, C. J., and Papadopoulou, K. N. (2013). Plastic debris ingested by deep-water fish of the Ionian Sea (Eastern Mediterranean). Deep Sea Res. I Oceanogr. Res. Pap. 74, 1–13. doi: 10.1016/j.dsr.2012.12.008
Baco, A. R., Etter, R. J., Ribeiro, P. A., von der Heyden, S., Beerli, P., and Kinlan, B. P. (2016). A synthesis of genetic connectivity in deep-sea fauna and implications for marine reserve design. Mol. Ecol. 25, 3276–3298. doi: 10.1111/mec.13689
Bashmachnikov, I., Mohn, C., Pelegrí, J. L., Martins, A., Jose, F., Machín, F., et al. (2009). Interaction of Mediterranean water eddies with Sedlo and Seine seamounts, subtropical Northeast Atlantic. Deep Sea Res. II Top. Stud. Oceanogr. 56, 2593–2605. doi: 10.1016/j.dsr2.2008.12.036
Beddington, J. R., Agnew, D. J., and Clark, C. W. (2007). Current problems in the management of marine fisheries. Science 316, 1713–1716. doi: 10.1126/science.1137362
Bernal, A., Olivar, M. P., Maynou, F., and de Puelles, M. L. F. (2015). Diet and feeding strategies of mesopelagic fishes in the western Mediterranean. Prog. Oceanogr. 135, 1–17. doi: 10.1016/j.pocean.2015.03.005
Blanchard, J. L., Pinnegar, J. K., and Mackinson, S. (2002). Exploring marine mammal-fishery interactions using ‘Ecopath with Ecosim’: modelling the barents Sea ecosystem. Lowestoft: CEFAS Science Series Technical Report 117.
Bradford-Grieve, J. M., Probert, P. K., Nodder, S. D., Thompson, D., Hall, J., Hanchet, S., et al. (2003). Pilot trophic model for subantarctic water over the Southern Plateau, New Zealand: a low biomass, high transfer efficiency system. J. Exp. Mar. Biol. Ecol. 289, 223–262. doi: 10.1016/S0022-0981(03)00045-5
Braga-Henriques, A., Porteiro, F. M., Ribeiro, P. A., Matos, V. D., Sampaio, Í., Oca-a, O., et al. (2013). Diversity, distribution and spatial structure of the cold-water coral fauna of the Azores (NE Atlantic). Biogeosciences 10, 4009–4036. doi: 10.5194/bg-10-4009-2013
Branch, T. A., Watson, R., Fulton, E. A., Jennings, S., McGilliard, C. R., Pablico, G. T., et al. (2010). The trophic fingerprint of marine fisheries. Nature 468, 431–435. doi: 10.1038/nature09528
Cardigos, F., Colaço, A., Dando, P. R., Ávila, S. P., Sarradin, P. M., Tempera, F., et al. (2005). Shallow water hydrothermal vent field fluids and communities of the D. João de Castro Seamount (Azores). Chem. Geol. 224, 53–168. doi: 10.1016/j.chemgeo.2005.07.019
Carvalho, N., Edwards-Jones, G., and Isidro, E. (2011). Defining scale in fisheries: small-size versus large-scale fishing operations in the Azores. Fish. Res. 109, 360–369. doi: 10.1016/j.fishres.2011.03.006
Cherel, Y., Ridoux, V., Spitz, J., and Richard, P. (2009). Stable isotopes document the trophic structure of a deep-sea cephalopod assemblage including giant octopod and giant squid. Biol. Lett. 5, 364–367. doi: 10.1098/rsbl.2009.0024
Christensen, V., and Pauly, D. (1992). ECOPATH II-a software for balancing steady-state ecosystem models and calculating network characteristics. Ecol. Model. 61, 169–185. doi: 10.1016/0304-3800(92)90016-8
Christensen, V., and Pauly, D. (1993). “Trophic models of aquatic ecosystems,” in ICLARM Conference Proceedings (Manila), 26.
Christensen, V., and Pauly, D. (1995). Fish production, catches and the carrying capacity of the world oceans. ICLARM Q. 18, 34–40.
Christensen, V., and Walters, C. J. (2004). Ecopath with Ecosim: methods, capabilities and limitations. Ecol. Model. 172, 109–139. doi: 10.1016/j.ecolmodel.2003.09.003
Christensen, V., Walters, C. J., Pauly, D., and Forrest, R. (2008). Ecopath with Ecosim Version 6. User Guide-November 2008. Lenfest Ocean Futures Project.
Clarke, M. R. (1996). Cephalopods as prey. III. Cetaceans. Philos. Trans. R. Soc. B. 351, 1053–1065. doi: 10.1098/rstb.1996.0093
Colaço, A., Giacomello, E., Porteiro, F., and Menezes, G. M. (2013). Trophodynamic studies on the Condor seamount (Azores, Portugal, North Atlantic). Deep Sea Res. II Top. Stud. Oceanogr. 98, 178–189. doi: 10.1016/j.dsr2.2013.01.010
Coll, M., Bundy, A., and Shannon, L. J. (2009). “Ecosystem modelling using the ecopath with ecosim approach,” in Computers in Fisheries Research (Dordrecht: Springer), 37–49.
Coll, M., Shannon, L. J., Kleisner, K. M., Juan-Jordá, M. J., Bundy, A., Akoglu, A. G., et al. (2016). Ecological indicators to capture the effects of fishing on biodiversity and conservation status of marine ecosystems. Ecol. Indic. 60, 947–962. doi: 10.1016/j.ecolind.2015.08.048
Colléter, M., Valls, A., Guitton, J., Gascuel, D., Pauly, D., and Christensen, V. (2015). Global overview of the applications of the Ecopath with Ecosim modeling approach using the EcoBase models repository. Ecol. Model. 302, 42–53. doi: 10.1016/j.ecolmodel.2015.01.025
Corrales, X., Coll, M., Tecchio, S., Bellido, J. M., Fernández, Á. M., and Palomera, I. (2015). Ecosystem structure and fishing impacts in the northwestern Mediterranean Sea using a food web model within a comparative approach. J. Mar. Syst. 148, 183–199. doi: 10.1016/j.jmarsys.2015.03.006
Cuvelier, D., Sarrazin, J., Colaço, A., Copley, J., Desbruyères, D., Glover, A. G., et al. (2009). Distribution and spatial variation of hydrothermal faunal assemblages at Lucky Strike (Mid-Atlantic Ridge) revealed by high-resolution video image analysis. Deep Sea Res. I Oceanogr. Res. Pap. 56, 2026–2040. doi: 10.1016/j.dsr.2009.06.006
da Silva, P. M., and Pinho, M. R. (2007). “Small-size-scale fishing on seamounts,” in Seamounts: Ecology Fisheries and Conservation, eds T. J. Pitcher, T. Morato, P. J. B. Hart, M. R. Clark, N. Haggan, and R. S. Santos (Oxford: Fisheries and Aquatic Resource Series; Blackwell Scientific), 335–360.
de Matos, V., Braga-Henriques, A., Santos, R. S., and Ribeiro, P. A. (2014). New species of Heteropathes (Anthozoa: Antipatharia) expands genus distribution to the NE Atlantic. Zootaxa 3827, 293–300. doi: 10.11646/zootaxa.3827.2.10
Diogo, H., Pereira, J. G., Higgins, R. M., Canha, Â., and Reis, D. (2015). History, effort distribution and landings in an artisanal bottom longline fishery: an empirical study from the North Atlantic Ocean. Mar. Policy 51, 75–85. doi: 10.1016/j.marpol.2014.07.022
Espinoza-Tenorio, A., Wolff, M., Taylor, M. H., and Espejel, I. (2011). What model suits ecosystem-based fisheries management? A plea for a structured modeling process. Rev. Fish Biol. Fish. 22, 81–94. doi: 10.1007/s11160-011-9224-8
Fanelli, E., Cartes, J. E., and Papiol, V. (2011a). Food web structure of deep-sea macrozooplankton and micronekton off the Catalan slope: insight from stable isotopes. J. Mar. Syst. 87, 79–89. doi: 10.1016/j.jmarsys.2011.03.003
Fanelli, E., Cartes, J. E., and Papiol, V. (2012). Assemblage structure and trophic ecology of deep-sea demersal cephalopods in the Balearic basin (NW Mediterranean). Mar. Freshw. Res. 63, 264–274. doi: 10.1071/MF11157
Fanelli, E., Papiol, V., Cartes, J. E., Rumolo, P., Brunet, C., and Sprovieri, M. (2011b). Food web structure of the epibenthic and infaunal invertebrates on the Catalan slope (NW Mediterranean): evidence from δ 13 C and δ 15 N analysis. Deep Sea Res. I Oceanogr. Res. Pap. 58, 98–109. doi: 10.1016/j.dsr.2010.12.005
Fanelli, E., Papiol, V., Cartes, J. E., Rumolo, P., and López-Pérez, C. (2013). Trophic webs of deep-sea megafauna on mainland and insular slopes of the NW Mediterranean: a comparison by stable isotope analysis. Mar. Ecol. Prog. Ser. 490, 199–221. doi: 10.3354/meps10430
Forrest, R. E., Savina, M., Fulton, E. A., and Pitcher, T. J. (2015). Do marine ecosystem models give consistent policy evaluations? A comparison of Atlantis and Ecosim. Fish. Res. 167, 293–312. doi: 10.1016/j.fishres.2015.03.010
Froese, R., and Pauly, D. (2015). FishBase. World Wide Web Electronic Publication. Available online at: www.fishbase.org, version (Accessed September 10, 2015).
Fulton, E. A., Smith, A. D. M., and Johnson, C. R. (2003). Effect of complexity on marine ecosystem models. Mar. Ecol. Prog. Ser. 253, 1–16. doi: 10.3354/meps253001
Gage, J. D., Tyler, P. A. (1991). Deep-Sea Biology: A Natural History of Organisms at the Deep-Sea Floor. Cambridge: Cambridge University Press.
Gale, K. S., Hamel, J. F., Mercier, A. (2013). Trophic ecology of deep-sea Asteroidea (Echinodermata) from eastern Canada. Deep Sea Res. I Oceanogr. Res. Pap. 80, 25–36. doi: 10.1016/j.dsr.2013.05.016
Garcia, S. M., Zerbi, A., Aliaume, C., Do Chi, T., and Lasserre, G. (2003). The Ecosystem Approach to Fisheries. Issues, Terminology, Principles, Institutional Foundations, Implementation and Outlook. FAO Fisheries Technical Paper, Rome, 443.
Gaspar, N. D. C. (2011). Sea to Shore: An Economic Evaluation of the Azorean Commercial Fisheries. PhD thesis, University of the Azores.
Guénette, S., and Morato, T. (2001). “The Azores Archipelago, 1997,” in Fisheries Impacts on North Atlantic Ecosystems: Models and Analyses, eds S. Guénette, V. Christensen, and D. Pauly (Vancouver, BC: Fisheries Centre Research Reports, University of British Columbia), 241–270.
Heymans, J. J., Coll, M., Libralato, S., Morissette, L., and Christensen, V. (2014). Global patterns in ecological indicators of marine food webs: a modelling approach. PLoS ONE 9:e95845. doi: 10.1371/journal.pone.0095845
Heymans, J. J., Coll, M., Link, J. S., Mackinson, S., Steenbeek, J., Walters, C., et al. (2016). Best practice in Ecopath with Ecosim food-web models for ecosystem-based management. Ecol. Model. 331, 173–184. doi: 10.1016/j.ecolmodel.2015.12.007
Heymans, J. J., Howell, K. L., Ayers, M., Burrows, M. T., Gordon, J. D., Jones, E. G., et al. (2011). Do we have enough information to apply the ecosystem approach to management of deep-sea fisheries? An example from the West of Scotland. ICES J. Mar. Sci. 68, 265–280. doi: 10.1093/icesjms/fsq065
Hoving, H. J. T., Robison, B. H. (2016). Deep-sea in situ observations of gonatid squid and their prey reveal high occurrence of cannibalism. Deep Sea Res. I Oceanogr. Res. Pap. 116, 94–98. doi: 10.1016/j.dsr.2016.08.001
Irigoien, X., Klevjer, T. A., Røstad, A., Martinez, U., Boyra, G., Acuña, J. L., et al. (2014). Large mesopelagic fishes biomass and trophic efficiency in the open ocean. Nat. Commun. 5:3271. doi: 10.1038/ncomms4271
Johnson, J., and Stevens, I. (2000). A fine resolution model of the eastern North Atlantic between the Azores, the Canary Islands and the Gibraltar Strait. Deep Sea Res. I Oceanogr. Res. Pap. 47, 875–899. doi: 10.1016/S0967-0637(99)00073-4
Khalilian, S., Froese, R., Proelss, A., and Requate, T. (2010). Designed for failure: a critique of the common fisheries policy of the European Union. Mar. Policy 34, 1178–1182. doi: 10.1016/j.marpol.2010.04.001
Kleisner, K. M., Coll, M., Lynam, C. P., Bundy, A., Shannon, L., Shin, Y.-J., et al. (2015). Evaluating changes in marine communities that provide ecosystem services through comparative assessments of community indicators. Ecosyst. Serv. 16, 413–429. doi: 10.1016/j.ecoser.2015.02.002
Larkin, P. A. (1996). Concepts and issues in marine ecosystem management. Rev. Fish Biol. Fish. 6, 139–164. doi: 10.1007/bf00182341
Libralato, S., Christensen, V., and Pauly, D. (2006). A method for identifying keystone species in food web models. Ecol. Model. 195, 153–171. doi: 10.1016/j.ecolmodel.2005.11.029
Link, J. S. (2010). Adding rigor to ecological network models by evaluating a set of pre-balance diagnostics: a plea for PREBAL. Ecol. Model. 221, 1582–1593. doi: 10.1016/j.ecolmodel.2010.03.012
Link, J. S., Ihde, T. F., Harvey, C. J., Gaichas, S. K., Field, J. C., Brodziak, J. K. T., et al. (2012). Dealing with uncertainty in ecosystem models: the paradox of use for living marine resource management. Prog. Oceanogr. 102, 102–114. doi: 10.1016/j.pocean.2012.03.008
Machete, M., Morato, T., and Menezes, G. (2011). Experimental fisheries for black scabbardfish (Aphanopus carbo) in the Azores, Northeast Atlantic. ICES J. Mar. Sci. 68, 302–308. doi: 10.1093/icesjms/fsq087
Mann, K. H., and Lazier, J. R. N. (2006). Dynamics of Marine Ecosystems-Biological-Physical Interactions in the Oceans, 3rd Edition. Malden, MA: Blackwell Publishing.
Melo, O., and Menezes, G. (2002). Projecto de acompanhamento da experiência de pesca dirigida ao peixe-relógio (Hoplostethus atlanticus)-FISHOR. Horta: Arquivos do DOP. Série Estudos 4, 38.
Menezes, G. M., Sigler, M. F., Silva, H. M., and Pinho, M. R. (2006). Structure and zonation of demersal fish assemblages off the Azores Archipelago (mid-Atlantic). Mar. Ecol. Prog. Ser. 324, 241–260. doi: 10.3354/meps324241
Morato, T., Bulman, C., and Pitcher, T. J. (2009). Modelled effects of primary and secondary production enhancement by seamounts on local fish stocks. Deep Sea Res. II Top. Stud. Oceanogr. 56, 2713–2719. doi: 10.1016/j.dsr2.2008.12.029
Morato, T., Kvile, K. Ø., Taranto, G. H., Tempera, F., Narayanaswamy, B. E., Hebbeln, D., et al. (2013). Seamount physiography and biology in the north-east Atlantic and Mediterranean Sea. Biogeoscience 10, 3039–3054. doi: 10.5194/bg-10-3039-2013
Morato, T., Machete, M., Kitchingman, A., Tempera, F., Lai, S., Menezes, G., et al. (2008). Abundance and distribution of seamounts in the Azores. Mar. Ecol. Prog. Series 357, 23–32. doi: 10.3354/meps07269
Morato, T., and Pitcher, T. (2002). “Challenges and problems in modeling seamount ecosystems and their fisheries,” in ICES 2002/M:8 (Copenhagen), 28.
Morato, T., Solà, E., Grós, M. P., and Menezes, G. (1999). Diets of forkbeard (Phycis phycis) and conger eel (Conger conger) off the Azores during spring of 1996 and 1997. Arquipélago 17A, 51–64.
Morato, T., Solà, E., Grós, M. P., and Menezes, G. (2003). Diet of the two most common elasmobranchs in the bottom longline fishery of the Azores, northeastern Atlantic: thornback ray Raja cf. clavata and tope shark, Galeorhinus galeus. Fish. Bull. 101, 590–602.
Morato-Gomes, T., Sola, E., Grós, M. P., Menezes, G., Pinho, M. R. (1998). “Trophic relationships and feeding habits of demersal fishes from the Azores: importance to multispecies assessment,” in ICES CM 1998/O:7 (Copenhagen), 21.
Mueller, C. E., Larsson, A. I., Veuger, B., Middelburg, J. J., van Oevelen, D. (2014). Opportunistic feeding on various organic food sources by the cold-water coral Lophelia pertusa. Biogeosciences 11, 23–133. doi: 10.5194/bg-11-123-2014
Paine, R. T. (1995). A Conversation on refining the concept of keystone species. Conserv. Biol. 9, 962–964. doi: 10.1046/j.1523-1739.1995.09040962.x
Palomares, M. L. D., and Pauly, D. (1998). Predicting food consumption of fish populations as functions of mortality, food type, morphometrics, temperature and salinity. Mar. Freshw. Res. 49, 447–453. doi: 10.1071/MF98015
Pauly, D. (1980). On the interrelationships between natural mortality, growth parameters, and mean environmental temperature in 175 fish stocks. ICES J. Mar. Sci. 39, 175–192. doi: 10.1093/icesjms/39.2.175
Pauly, D., and Christensen, V. (1994). Primary production required to sustain global fisheries. Nature 374, 255–257. doi: 10.1038/374255a0
Pauly, D., Christensen, V., Dalsgaard, J., Froese, R., and Torres, F. (1998). Fishing down marine food webs. Science 279, 860–863. doi: 10.1126/science.279.5352.860
Pauly, D., Christensen, V., and Walters, C. (2000). Ecopath, Ecosim, and Ecospace as tools for evaluating ecosystem impact of fisheries. ICES J. Mar. Sci. 57, 697–706. doi: 10.1006/jmsc.2000.0726
Perán, A. D., Pham, C. K., Amorim, P., Cardigos, F., Tempera, F., and Morato, T. (2016) Seafloor characteristics in the Azores region (North Atlantic). Front. Mar. Sci. 3:204. doi: 10.3389/fmars.2016.00204
Pham, C. K., Canha, A., Diogo, H., Pereira, J. G., Prieto, R., and Morato, T. (2013). Total marine fishery catch for the Azores (1950–2010). ICES J. Mar. Sci. 70, 564–577. doi: 10.1093/icesjms/fst024
Pikitch, E. K., Santora, C., Babcock, E. A., Bakun, A., Bonfil, R., Conover, D. O., et al. (2004). Ecosystem-based fishery management. Science 305, 346–347. doi: 10.1126/science.1098222
Pinnegar, J. K., Blanchard, J. L., Mackinson, S., Scott, R. D., and Duplisea, D. E. (2005). Aggregation and removal of weak-links in food-web models: system stability and recovery from disturbance. Ecol. Model. 184, 229–248. doi: 10.1016/j.ecolmodel.2004.09.003
Piroddi, C., Teixeira, H., Lynam, C. P., Smith, C., Alvarez, M. C., Mazik, K., et al. (2015). Using ecological models to assess ecosystem status in support of the European Marine Strategy Framework Directive. Ecol. Indic. 58, 175–191. doi: 10.1016/j.ecolind.2015.05.037
Plagányi, E. E., and Butterworth, D. S. (2004). A critical look at the potential of Ecopath with Ecosim to assist in practical fisheries management. Afr. J. Mar. Sci. 26, 261–287. doi: 10.2989/18142320409504061
Polovina, J. J. (1984). Model of a coral reef ecosystem I. The ECOPATH model and its application to French Frigate Shoals. Coral Reefs 3, 1–11. doi: 10.1007/BF00306135
Reed, J., Shannon, L., Velez, L., Akoglu, E., Bundy, A., Coll, M., et al. (2016). Ecosystem indicators — accounting for variability in species' trophic levels. ICES J. Mar. Sci. doi: 10.1093/icesjms/fsw150. [Epub ahead of print].
Rodhouse, P. G., and Nigmatullin, C. M. (1996). Role as consumers. Phil. Trans. R. Soc. B. 351, 1003–1022. doi: 10.1098/rstb.1996.0090
Romeu, O. R., Cartes, J. E., Solé, M., and Carrassón, M. (2016). To what extent can specialized species succeed in the deep sea? The biology and trophic ecology of deep-sea spiny eels (Notacanthidae) in the Mediterranean Sea. Deep Sea Res. I 115, 74–90. doi: 10.1016/j.dsr.2016.05.006
Sampaio, I., Braga-Henriques, A., Pham, C., Oca-a, O., De Matos, V., Morato, T., et al. (2012). Cold-water corals landed by bottom longline fisheries in the Azores (north-eastern Atlantic). J. Mar. Biol. Assoc. U.K. 92, 1547–1555. doi: 10.1017/S0025315412000045
Santos, R., Hawkins, S., Monteiro, L. R., Alves, M., and Isidro, E. J. (1995). Marine research, resources and conservation in the Azores. Aquat. Conserv. 5, 311–354. doi: 10.1002/aqc.3270050406
Santos, R. S., Porteiro, F. M., and Barreiros, J. P. (1997). Marine fishes of the Azores: an annotated checklist and bibliography. Arquipélago Life Mar. Sci. 1, 1–244.
Shannon, L., Coll, M., Bundy, A., Gascuel, D., Heymans, J. J., Kleisner, K., et al. (2014). Trophic level-based indicators to track fishing impacts across marine ecosystems. Mar. Ecol. Progr. Ser. 512, 115–140. doi: 10.3354/meps10821
Smith, A. D., Brown, C. J., Bulman, C. M., Fulton, E. A., Johnson, P., Kaplan, I. C., et al. (2011). Impacts of fishing low–trophic level species on marine ecosystems. Science 333, 1147–1150. doi: 10.1126/science.1209395
Sutton, T. T., Porteiro, F. M., Heino, M., Byrkjedal, I., Langhelle, G., Anderson, C. I. H., et al. (2008). Vertical structure, biomass and topographic association of deep-pelagic fishes in relation to a mid-ocean ridge system. Deep Sea Res. II 55, 161–184. doi: 10.1016/j.dsr2.2007.09.013
Tecchio, S., Coll, M., Christensen, V., Company, J. B., Ramirez-Llodra, E., and Sarda, F. (2013). Food web structure and vulnerability of a deep-sea ecosystem in the NW Mediterranean Sea. Deep Sea Res. I. 75, 1–15. doi: 10.1016/j.dsr.2013.01.003
Tecchio, S., Coll, M., and Sardà, F. (2015). Structure, functioning, and cumulative stressors of Mediterranean deep-sea ecosystems. Progr. Oceanogr. 135, 156–167. doi: 10.1016/j.pocean.2015.05.018
Tempera, F., Atchoi, E., Amorim, P., Gomes-Pereira, J. N., and Gonçalves, J. (2013). Atlantic Area Marine Habitats. Adding new Macaronesian Habitat Types from the Azores to the EUNIS Habitat Classification. Horta: MeshAtlantic Technical Report No. 4/2013.
Tempera, F., Carreiro-Silva, M., Jakobsen, K., Porteiro, F. M., Braga-Henriques, A., and Jakobsen, J. (2015). An Eguchipsammia (Dendrophylliidae) topping on the cone. Mar. Biodiv. 45, 3–4. doi: 10.1007/s12526-014-0220-9
Tempera, F., Pereira, J. N., Braga Henriques, A., Porteiro, F., Morato, T., Matos, V., et al. (2012). Cataloguing deep-sea biological facies of the Azores. Revista Invest. Mar. AZTI-Tecnalia 19, 21–70.
Villasante, S., Morato, T., Rodriguez-Gonzalez, D., Antelo, M., Österblom, H., Watling, L., et al. (2012). Sustainability of deep-sea fish species under the European Union Common Fisheries Policy. Ocean Coast. Manag. 70, 31–37. doi: 10.1016/j.ocecoaman.2012.07.033
Walters, C., Christensen, V., and Pauly, D. (1997). Structuring dynamic models of exploited ecosystems from trophic mass-balance assessments. Rev. Fish Biol. Fish. 7, 139–172. doi: 10.1023/A:1018479526149
Walters, C., Pauly, D., Christensen, V., and Kitchell, J. F. (2000). Representing density dependent consequences of life history strategies in aquatic ecosystems: EcoSim II. Ecosystems 3, 70–83. doi: 10.1007/s100210000011
Watson, R., and Pauly, D. (2001). Systematic distortions in world fisheries catch trends. Nature 414, 534–536. doi: 10.1038/35107050
WoRMS Editorial Board (2016). World Register of Marine Species. Available from http://www.marinespecies.org at VLIZ (Accessed September 23, 2016)
Keywords: ecopath, ecosystem model, fisheries, Azores, trophic links
Citation: Morato T, Lemey E, Menezes G, Pham CK, Brito J, Soszynski A, Pitcher TJ and Heymans JJ (2016) Food-Web and Ecosystem Structure of the Open-Ocean and Deep-Sea Environments of the Azores, NE Atlantic. Front. Mar. Sci. 3:245. doi: 10.3389/fmars.2016.00245
Received: 01 July 2016; Accepted: 11 November 2016;
Published: 12 December 2016.
Edited by:
Cinzia Corinaldesi, Marche Polytechnic University, ItalyReviewed by:
Americo Montiel, University of Magallanes, ChileEmanuela Fanelli, Marine Environment Research Center (ENEA), Italy
Copyright © 2016 Morato, Lemey, Menezes, Pham, Brito, Soszynski, Pitcher and Heymans. This is an open-access article distributed under the terms of the Creative Commons Attribution License (CC BY). The use, distribution or reproduction in other forums is permitted, provided the original author(s) or licensor are credited and that the original publication in this journal is cited, in accordance with accepted academic practice. No use, distribution or reproduction is permitted which does not comply with these terms.
*Correspondence: Telmo Morato, dC5tb3JhdG9AbWFyZS1jZW50cmUucHQ=