 Alexandra Marki
 Markus Pahlow
- GEOMAR Helmholtz Centre for Ocean Research Kiel, Biogeochemical Modelling, Kiel, Germany
Oxygen minimum zones (OMZs) are often characterized by nitrogen-to-phosphorus (N:P) ratios far lower than the canonical Redfield ratio. Whereas, the importance of variable stoichiometry in phytoplankton has long been recognized, variations in zooplankton stoichiometry have received much less attention. Here we combine observations from two shipboard mesocosm nutrient enrichment experiments with an optimality-based plankton ecosystem model, designed to elucidate the roles of different trophic levels and elemental stoichiometry. Pre-calibrated microzooplankton parameter sets represent foraging strategies of dinoflagellates and ciliates in our model. Our results suggest that remineralization is largely driven by omnivorous ciliates and dinoflagellates, and highlight the importance of intraguild predation. We hypothesize that microzooplankton respond to changes in food quality in terms of nitrogen-to-carbon (N:C) ratios, rather than nitrogen-to-phosphorus (N:P) ratios, by allowing variations in their phosphorus-to-carbon (P:C) ratio. Our results point toward an important biogeochemical role of flexible microzooplankton stoichiometry.
Introduction
Cell quotas (N:C and P:C ratios) in phytoplankton are flexible and vary in response to the availability and stoichiometry of ambient inorganic nutrients (Quigg et al., 2003; Klausmeier et al., 2008; Finkel et al., 2010). Variable phytoplankton elemental composition is often presumed to propagate across trophic levels in the food chain (Mitra and Flynn, 2007; Malzahn et al., 2010; Iwabuchi and Urabe, 2012b; Meunier et al., 2012a). Stoichiometric plasticity in (meso-) zooplankton seems to be both narrower and more complex than in phytoplankton (Sterner and Elser, 2002; Urabe et al., 2002a,b; Iwabuchi and Urabe, 2012a,b; Suzuki-Ohno et al., 2012; Hessen et al., 2013). However, most evidence is from marine zooplankton laboratory cultures and field data on stoichiometric variations in freshwater zooplankton, e.g., Daphnia phosphorus content and its variation in response to resource phosphorus-to-carbon (P:C) ratios (DeMott and Pape, 2005). Contrary to an earlier study by Andersen and Hessen (1991), DeMott and Pape (2005) show substantial declines in zooplankton P-content when feeding on low P:C resources. Very little is known about the stoichiometric plasticity of marine microzooplankton, but Meunier et al. (2012a) reported variable stoichiometry in a marine dinoflagellate when feeding on algal cultures of different concentration and elemental composition.
Physical and biogeochemical processes shape the environment of marine ecosystems. In particular, ambient inorganic nutrient stoichiometry can vary substantially. In the vicinity of upwelling regions oxygen can become exhausted as a result of poorly ventilated intermediate-depth waters, elevated primary production due to nutrient-rich upwelled coastal waters, and subsequent remineralization of the sinking organic matter. These areas are known as oxygen minimum zones (OMZs), defined by oxygen concentrations less than 20 μmol L−1 at depths between ~100 and 900 m (Stramma et al., 2008). OMZs strongly influence the marine biogeochemical cycles of carbon (C), nitrogen (N), and phosphorus (P) and therefore primary production (Deutsch et al., 2007; Landolfi et al., 2013). OMZs are sites of denitrification and anaerobic ammonium oxidation (anammox), the major fixed-nitrogen-loss processes in the global ocean (Helly and Levin, 2004; Galán et al., 2009). Under anoxic conditions, phosphate can disassociate from iron hydroxides at the seafloor (Ingall and Jahnke, 1994) and P released from microorganisms in the sediment and overlying water may cause elevated P levels in the water column (Goldhammer et al., 2010; Brock and Schulz-Vogt, 2011; Noffke et al., 2012).
All of these physical and biological processes shift the dissolved inorganic N:P ratio below the canonical Redfield ratio of 16 (Redfield, 1934). In the coastal upwelling region off Peru, nutrient-rich water masses with N:P ratios much lower than 16 are upwelled to the surface, which may affect plankton community composition (Herrera and Escribano, 2006). Franz et al. (2012b) observed a shift in phytoplankton communities off the Peruvian coast from large diatoms in upwelled waters with N:P ratios much lower than 16, to small picoplankton groups further offshore where dissolved inorganic N:P ratios are close to 16.
It is difficult, if not impossible, to follow simultaneously the development of natural plankton communities and associated biogeochemical processes in the field. A means to overcome this problem is the use of mesocosms to observe natural plankton communities under defined conditions in enclosed or semi-enclosed environments (Riebesell et al., 2008; Wohlers et al., 2009). The ability to control conditions and obtain observations with a high temporal resolution makes mesocosm experiments an attractive tool for monitoring plankton community structure over time and for developing and testing plankton ecosystem models (Vallino, 2000; Schartau et al., 2007; Lewandowska and Sommer, 2010).
We develop an optimality-based nutrient-phytoplankton-zooplankton (NPZ) ecosystem model and analyse time-series observations of two shipboard mesocosm experiments in the Peruvian Upwelling (PU) region (PU1 and PU2; Franz et al., 2012b, 2013a,b; Hauss et al., 2012). Franz et al. (2012a) suggested that nitrogen supply is primarily driving the production and accumulation of organic matter in the Peruvian upwelling region, with no clear relation to the ambient N:P ratio. Moreover, Hauss et al. (2012) found that PU1 and PU2 were characterized by different microzooplankton communities: PU1 was dominated by dinoflagellates and PU2 by ciliates. However, the mesocosm data alone cannot explain the effects of different inorganic N:P supply ratios on the composition of and processes in the plankton ecosystem. Thus, we set out to analyse the mesocosm observations with our optimality-based NPZ model in order to elucidate the response of different ecosystem components to the stoichiometry of the inorganic nutrient supply.
We simulate physiological processes, e.g., nutrient uptake and remineralization, in marine plankton by combining the optimality-based chain model (OCM) for phytoplankton (Pahlow et al., 2013) with the optimal current feeding model (OCF) for zooplankton (Pahlow and Prowe, 2010). These optimality-based physiological regulatory models describe nutrient, phytoplankton, and zooplankton community dynamics in terms of generic trade-offs. The trade-offs among resource acquisition (nutrient uptake, CO2 fixation, or ingestion), excretion and respiration are derived from the condition that each resource unit (nutrient or energy) can be used only for one task at any given point in time. This constrains the maximum achievable rates of resource acquisition and growth of the organisms. Thus, the model describes physiological regulation at the whole-organism level (Smith et al., 2011), rather than the underlying biochemistry. The additional constraints obtained from the generic trade-offs reduce the number of parameters to be determined for model calibration (Pahlow et al., 2013). These approaches, together with the use of pre-calibrated parameter sets for the OCF, allow us to keep the number of tuning-parameters low (Anderson, 2005).
Our initial hypothesis was that the different nutrient enrichments of the mesocosms might have caused changes in the food quality in terms of elemental composition of phytoplankton. These variations in elemental composition could have been passed on directly to higher trophic levels of the food web, potentially affecting both zooplankton growth and stoichiometry. In our model, the OCM simulates dynamic phytoplankton stoichiometry and the OCF represents different feeding strategies in higher trophic levels (zooplankton). We thus address this hypothesis with our model, in an attempt to capture the differences in elemental composition and community structure of the food web in both (PU1 and PU2) mesocosm experiments.
Phytoplankton and microzooplankton compartments in our model can each be seen as a guild (Root, 1967). Our microzooplankton guild mainly consists of two taxonomic groups, dinoflagellates and ciliates. Both groups can potentially utilize the same food resources, including members of their own group. Polis et al. (1989) introduced this concept as intraguild predation (Polis and Holt, 1992; Pitchford, 1998; Mitra, 2009). We investigate the role of trophic complexity by using model configurations with either one generic microzooplankton compartment, representing the whole microzooplankton community, or two compartments representing ciliates and dinoflagellates separately. We consider microzooplankton as either specialists (strict herbivores/carnivores) or omnivores, with or without intraguild predation, in order to elucidate effects of different foraging strategies and food preferences.
Our model analysis addresses the following questions arising from the mesocosm studies of Franz et al. (2012b) and Hauss et al. (2012): (1) How were the different nutrient treatments associated with bottom-up and top-down processes among the mesocosm treatments? (2) Could patterns of food preferences or foraging strategies explain the observed differences in the two mesocosm experiments between and within the mesocosm treatments? (3) How many trophic levels does the model require to match observed patterns in the mesocosms? (4) How important was food quality for microzooplankton? (5) Were the effects of nutrient stoichiometry related to the observed ecological vicariance (niche substitution) of microzooplankton in the two mesocosm experiments in the Peruvian Upwelling region?
Observations and Model
Mesocosm Experiments
Two short-term mesocosm experiments (PU1 and PU2, Figure 1) with in situ plankton communities from the Peruvian coastal upwelling region were monitored in 12 shipboard mesocosms during the M77/3 cruise off Peru (Franz et al., 2012b, 2013a,b; Hauss et al., 2012). The objectives of the PU1 and PU2 mesocosm studies were to identify the influence of inorganic nutrient concentrations and ratios on the development of plankton biomass and community composition across trophic levels in the Peruvian Upwelling region (Franz et al., 2012a,b, 2013a,b; Hauss et al., 2012). PU1 consisted of three nutrient treatments: An unenriched control with ambient nutrient concentrations (N:P = 3.4), an enrichment with high (N:P = 20) and an enrichment with low (N:P = 2.8) dissolved inorganic N:P ratios (Figure 1). PU2 had four nutrient treatments: Two high-N:P treatments (N:P = 16 and 8) and two low-N:P treatments (N:P = 5 in the unamended control and 2.5) (Figure 1). All mesocosms were covered with a shading net to achieve ≈30% of the ambient light intensity (Figure 1). The initial water samples obtained from Niskin bottles mounted on a CTD were filtered (pre-screened) through a 200 μm mesh to remove mesozooplankton from all mesocosms of PU2 and from two mesocosms per treatment of PU1. As in Hauss et al. (2012), we do not distinguish between mesocosms with and without mesozooplankton. However, the microzooplankton community was dominated by dinoflagellates in PU1 and by ciliates in PU2. All mesocosms were restocked with 5 μm-filtered ambient surface seawater on days 3 and 5 of the experiments, due to the large amounts of water required for sampling (Figure 1; Franz et al., 2012a,b, 2013a,b). Trace metal and silicate compounds were added to avoid trace metal and silicate limitation at the start of each experiment, and also on day 5 in PU2 only.
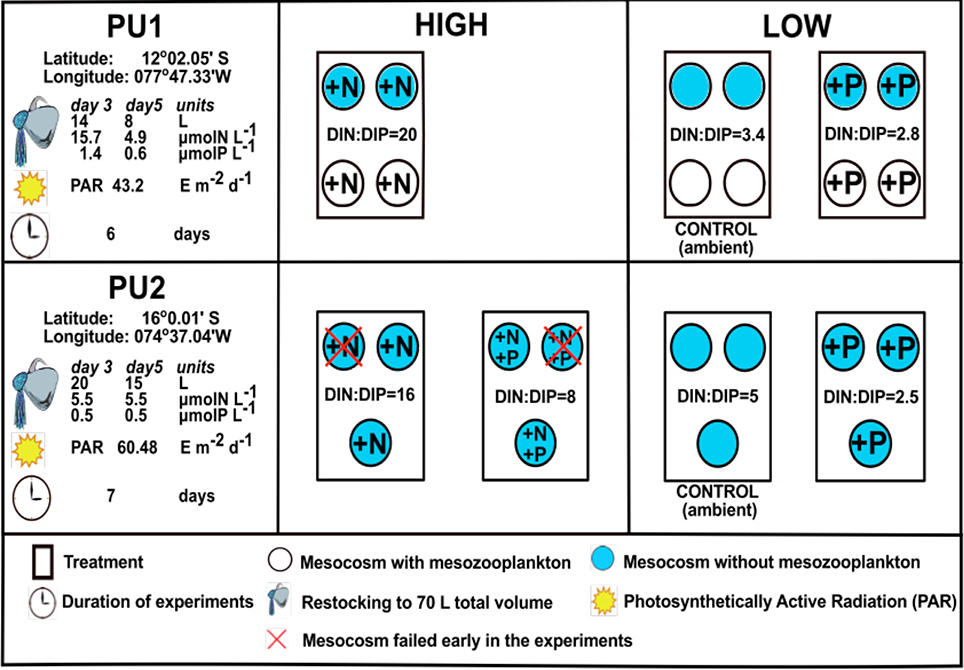
Figure 1. Experimental set-up of the PU1 and PU2 experiments during the M77/3 cruise. The PU1 mesocosms were pooled into 3 treatments with 4 replicates each since only insignificant differences in nutrient drawdown were observed between mesocosms with and without mesozooplankton (Franz et al., 2012b, 2013a,b; Hauss et al., 2012). HIGH represents treatments with DIN:DIP ratios above 6, while LOW represents treatments with DIN:DIP ratios below 6.
Model Setup
Our optimality-based food-chain model defines up to three trophic levels, representing dissolved inorganic nutrients (NN), phytoplankton (P), and one or two zooplankton compartments (Z) (Figure 2 and Figure S1). The phytoplankton compartment is represented by 4 state variables allowing for dynamic C:N:P:Chlorophyll (Chl) ratios (see Appendix in Supplementary Material, Equations 3–10), whereas the zooplankton compartments have constant C:N:P ratios (see Appendix in Supplementary Material, Equations 11–13, and Table 1).
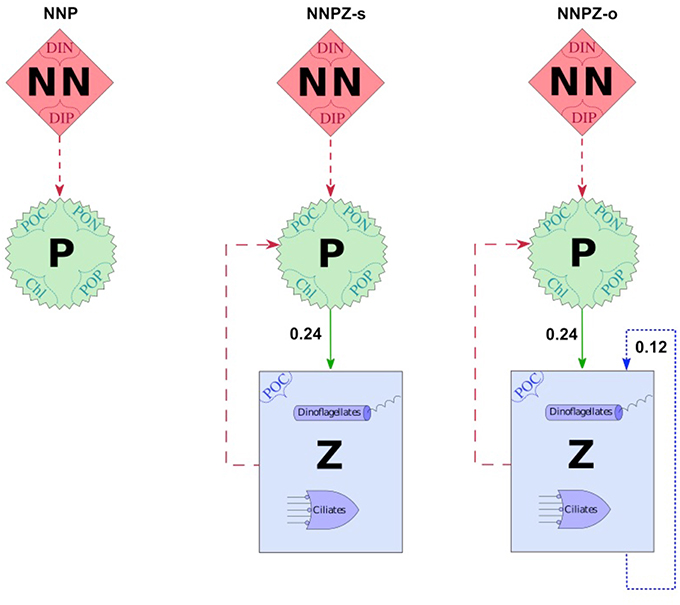
Figure 2. Model configurations with prey capture coefficients and showing the main compartments NN = Nutrients, P = Phytoplankton and Z = Zooplankton; the suffixes “-s” and “-o” indicate specialists (herbivores) and omnivores, respectively; numbers are prey capture coefficients in m3mmolC−1; dashed arrows represent the uptake of inorganic nutrients by the phytoplankton compartment; solid arrows represent prey capture coefficients of ciliates for phytoplankton—set to 100%, either representing the preferential food source or food of equal quality for the predator; dotted arrows represent intraguild prey capture coefficients - set to 50% assuming that the microzooplankton community is split into 50% intraguild prey and 50% intraguild predators; names enclosed in dotted braces [dissolved inorganic nitrogen (DIN), dissolved inorganic phosphorus (DIP), particulate organic carbon (POC), nitrogen (PON) and phosphorus (POP), and chlorophyll (Chl)] represent the state variables of the corresponding compartment; solid arrows indicate the preferred food-source of Z.
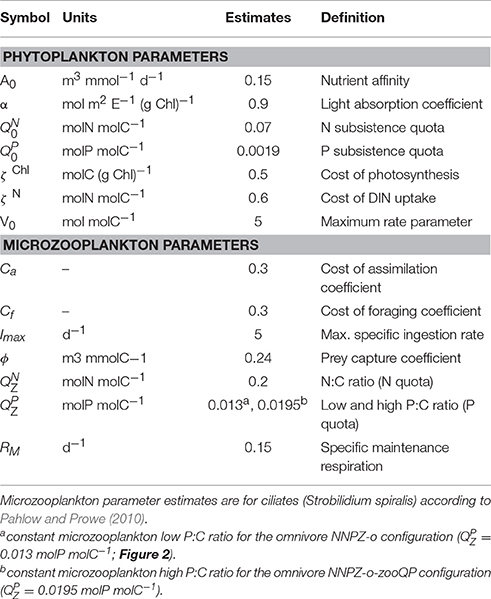
Table 1. Symbol definitions, units, and parameter estimates of the optimality-based chain model (OCM) for phytoplankton and the optimal current feeding model (OCF) for (micro)zooplankton.
For the phytoplankton compartment, we employ the OCM (Pahlow et al., 2008, 2013; Pahlow and Oschlies, 2013). In the OCM, the phytoplankton phosphorus quota (, defined as the P:C ratio) is limiting nitrogen assimilation and the nitrogen quota (, the N:C ratio) controls nutrient uptake and carbon-fixation. Thus, both N and P always colimit growth in the OCM. The OCM explicitly represents light and dark respiration by light-dependent and light-independent respiration terms. For simplicity, we do not simulate a diurnal light cycle, but multiply daytime photosynthesis and light-dependent (but not dark) respiration with the day-length (0.5).
The OCM is coupled to the optimal current-feeding model for zooplankton (OCF, Pahlow and Prowe, 2010). The OCF is built on trade-offs among foraging activity, assimilation efficiency and respiration. We employ unaltered pre-calibrated parameter sets by Pahlow and Prowe (2010) to represent ciliate and dinoflagellate behavior. The only exception is the prey capture coefficient (ϕ), which is reduced for non-preferred prey in order to mimic preferential feeding (see below). We assume temporally constant (homeostatic) microzooplankton elemental stoichiometry. Thus, the excess C, N, or P, which cannot be assimilated, is excreted in dissolved form (Kiørboe et al., 1996). To reduce model complexity we do not differentiate between excretion and egestion of particulate matter. The excretion terms for C, N, and P are given by the difference between ingestion and assimilation, corresponding to the difference between the variable elemental C:N:P ratio of the prey and the predefined constant elemental C:N:P ratio of the microzooplankton compartments (see Appendix in Supplementary Material, Equations 11–13, and Table 1).
We use observations from the PU1 and PU2 shipboard mesocosm experiments of the M77/3 cruise (Franz et al., 2012b, 2013a,b; Hauss et al., 2012) to determine the initial conditions for the model-setup and to assess model performance for the duration of the experiments. Dissolved inorganic nitrogen and phosphorus (DIN and DIP, respectively) represent all dissolved nitrogen and phosphorus compounds available to phytoplankton. For simplicity we do not address the dissolved organic matter (DOM) pool, since there are no clear trends in DOM concentrations throughout the experiments (Franz et al., 2012b, 2013b). Initial phytoplankton C, N, P are calculated from (averaged) observed POC, PON, POP concentrations (Franz et al., 2012b, 2013a,b; Hauss et al., 2012), from which we subtract the (averaged) observed dinoflagellate, ciliate, and bacterial biomasses multiplied with assumed zooplankton and bacterial N:C and P:C ratios, , , , and , respectively. Assumed and are given in Table 1. We apply the same N:C and P:C ratios to bacteria (Chrzanowski and Grover, 2008; Pahlow et al., 2008; Zimmerman et al., 2014), which are only used for the calculation of the initial phytoplankton C, N, P in this study. Thus, our initial phytoplankton PON and POP concentrations vary slightly between the different simulations of the same mesocosms, depending on the assumed zooplankton and bacterial N:C and P:C ratios.
We initialize our model with observations for the first day (day 0) for PU1 and data for the second day (day 1) for PU2, due to the lack of initial POC, PON, and POP measurements for PU2. We account for initial (day 1) differences between individual mesocosms within each treatment of PU2 (Hauss et al., 2012) with three ensemble simulations for each treatment. Our PU1 and PU2 model simulations are all run for 7 days.
We simulate the restocking of the mesocosms of both experiments by adding DIN and DIP, according to the concentrations and mixing ratios of the restocking medium indicated in Figure 1 on days 3 and 5 of both experiments (Franz et al., 2012b, 2013a,b; Hauss et al., 2012). All remaining model compartments are multiplied with dilution factors, i.e., the ratio of the actual mesocosm water volume before restocking over the total (restocked) mesocosm water volume (fdil = AV:IV). We assume that the restocking medium (5 μm-filtered ambient surface seawater) contained only water and inorganic nutrients, since no zooplankton or phytoplankton counts were performed.
Model Configurations and Calibration
Different assumptions represented by the model structure about the trophic interactions and stoichiometry might result in different interpretations of the observations of both mesocosm experiments. To test our assumptions we therefore set up several model configurations (Figure 2) to simulate conceptually possible food web interactions in the two mesocosm experiments. The different model configurations differ in model complexity in terms of the number of trophic levels resolved and/or the trophic strategies of the microzooplankton community, as well as zooplankton stoichiometry.
At first we apply the (OCM) for phytoplankton (Pahlow et al., 2013) and two nutrients (NN), DIN and DIP. This model configuration with only one trophic level helps us to find out whether bottom-up control alone could explain the development of nutrients and phytoplankton.
We investigate the effects of top-down control with the (OCF) for zooplankton (Pahlow and Prowe, 2010) where we progressively increase the number of trophic levels by representing nutrients, (NN), phytoplankton (P) and up to two microzooplankton types, Z1 and Z2 (Figure 2, Figure S1). Since the microzooplankton community in the mesocosms was identified as comprising ciliate and dinoflagellate species (Hauss et al., 2012), the foraging strategies in our model are defined by the dinoflagellate and ciliate parameter sets (Pahlow and Prowe, 2010; Table 1 and Table S1). In all simulations of each of the different model configurations we use the same pre-calibrated parameter set for all treatments and vary only the initial conditions of our state variables (see Appendix in Supplementary Material, Equations 1–7), according to the corresponding mesocosm observations as described above. In this study we analyse both specialist (strictly herbivorous or carnivorous) and omnivorous feeding of microzooplankton (Figure 2 and Figure S2), to find out whether patterns of food preferences or foraging strategies could explain the observed differences in the two mesocosm experiments between and within the mesocosm treatments.
Furthermore, we consider stoichiometric plasticity of the microzooplankton community as a possible physiological response to changes in food quality. Therefore, we imitate the N and P requirements of higher trophic levels by applying a wide range of elemental microzooplankton N and P quotas (N:C and P:C ratios, respectively). The suffix “-zooQP” in the configuration name indicates that we applied a higher microzooplankton P quota.
These different model configurations are designed (1) to determine the minimum trophic levels of the model structure required to match observed patterns in the mesocosms, and (2) to investigate the effects of nutrient stoichiometry, related to the observed niche substitution of microzooplankton between PU1 and PU2.
Model Complexity
The simplest (NNP) configuration contains only the nutrient (NN) and phytoplankton (P) compartments and has 6 state variables (see Appendix in Supplementary Material, Equations 1–6 and Figure 2). The intermediate (NNPZ) configuration contains a second trophic level (one additional state variable), the zooplankton guild (Equation 7 and Figure 2). Additional information on the sensitivity configurations with dinoflagellates, specialists and omnivores, and the three trophic level configurations can be found in the electronic supplement (e.g., Figure S1).
Process Representations
Bottom-Up Control
In the NNP configuration, primary production of the phytoplankton compartment is the only process responsible for “bottom up” control. The NNP configuration lacks phytoplankton mortality, because we do not employ a zooplankton grazing function representing top-down control. We modify the phytoplankton parameters within the ranges given by Pahlow et al. (2013) and include dynamic photo-acclimation to match the onset of the phytoplankton bloom in the mesocosms during the first 3 days. We employ faster Chl dynamics (see Appendix in Supplementary Material, Equations 8–10) than in Pahlow (2005), which compares better with the observed initial time-course of Chl and the Chl:C ratio in the mesocosms.
Top-Down Control: Specialists (Strict Herbivores or Carnivores) vs. Omnivores
We simulate top-down control in the specialist, strictly herbivorous, NNPZ-s configuration by microzooplankton grazing only on phytoplankton. In the omnivore NNPZ-o configurations we also allow top-down control, hereafter called intraguild predation, within the microzooplankton compartment (Figure 2). Intraguild predation is seen in our model as controphic species predation rather than cannibalism, since we assume that each microzooplankton compartment represents many species encompassing a range of sizes (Stav et al., 2005). We differentiate between the NNPZ-s (specialist) and NNPZ-o (omnivore) configurations by means of different microzooplankton feeding behavior represented by different prey capture coefficients (ϕ) to simulate variations in food preferences. The preferred food source is associated with the highest ϕ, i.e., the ϕ according to Pahlow and Prowe (2010) (Figure 2). We apply lower prey capture coefficients for predation within the microzooplankton guild. Owing to a lack of observations, we pragmatically set ϕ for intraguild predation to one-half of the ϕ for the next lower trophic level. In this way, we implicitly split each zooplankton compartment into equal contributions of intraguild predators and prey.
We focus here on three configurations, the NNP and the two omnivore NNPZ-o with a low P quota and NNPZ-o-zooQP with a higher P quota (see below). Please consult the electronic supplement for the description and set-up of the specialist (herbivore) NNPZ-s and NNPZ-s-zooQP configurations (Figures S2, S3).
Model Results
Separation of Bottom-Up and Top-Down Processes
Bottom-up processes appear to have dominated ecosystem dynamics during the first 3 days of the mesocosm experiments, providing constraints for our phytoplankton parameters. For the NNP configuration, it proved impossible to match the first 3 days of the mesocosm behavior without dramatically overestimating phytoplankton biomass toward the end of PU1 and PU2, when the model mesocosms entered the stationary phase (Figures 3, 4, respectively). Most likely this results from the lack of top-down control (grazing mortality) of phytoplankton. Thus, predation losses and nutrient remineralization had a significant impact on the development of the mesocosm ecosystems. Surprisingly, phytoplankton N:P nevertheless matches the observations quite well. Moreover, observed phytoplankton N:P variations of both PU experiments between treatments are rather minor compared to variations within treatments (Figures 3C, 4C).
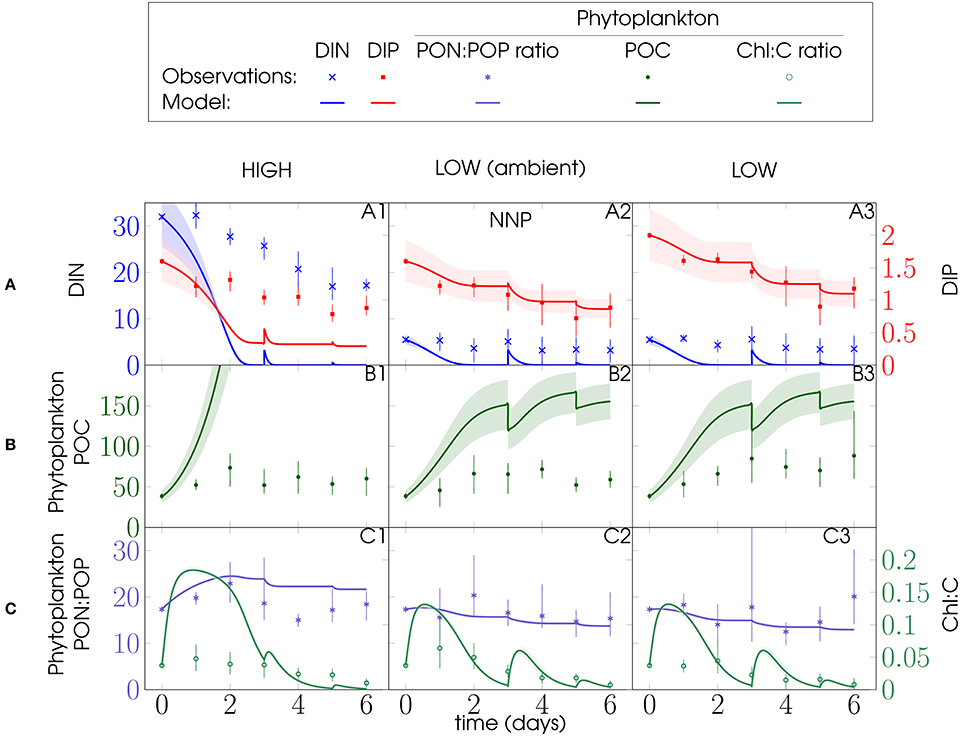
Figure 3. PU1 experiment and NNP model configuration (Figure 2): Left y-axes: (A) DIN, (B) phytoplankton POC, and (C) phytoplankton PON:POP ratio; right y-axes: (A) DIP and (C) phytoplankton Chl:C ratio; units of DIN, DIP, phytoplankton POC are mmol m−3; phytoplankton PON:POP ratio is given in mol mol−1, Chl:C ratio in g mol−1 and time in days (d); model discontinuities are due to dilutions; observations (marks) are daily averages, where vertical bars indicate the range between the lowest and the highest measurement of all mesocosms within one treatment.
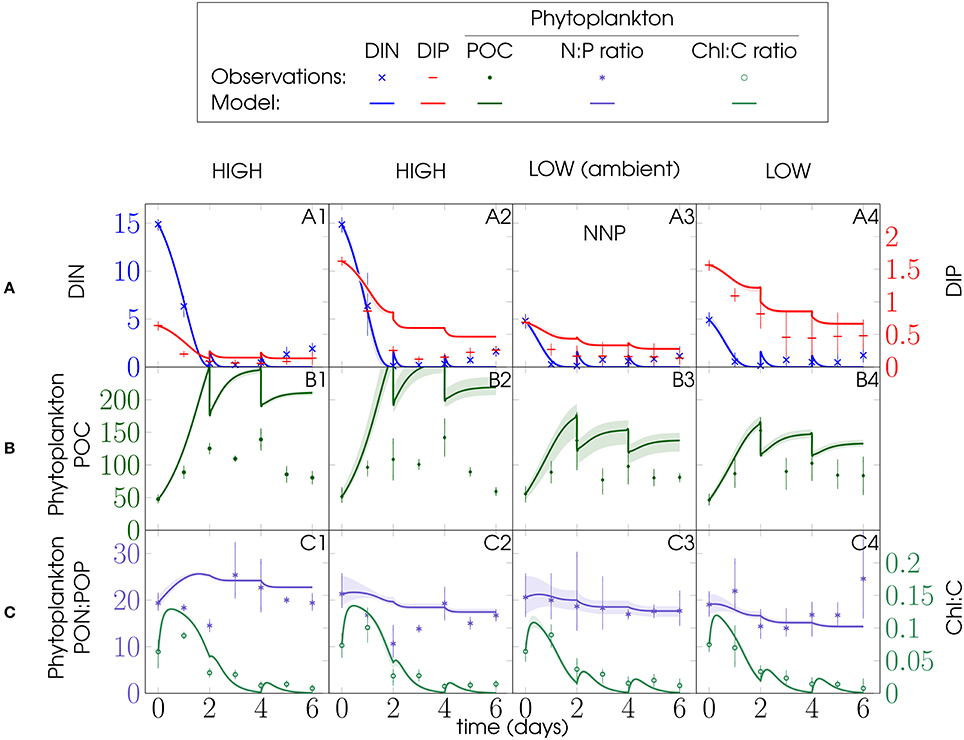
Figure 4. Same as Figure 3, but showing data and ensemble model simulations for PU2 for the NNP configuration (Figure 2).
The specialist (herbivore) model configuration (NNPZ-s) represents the simplest food-web structure to include top-down control (Figure 2). In the NNPZ-s configuration, phytoplankton declines too rapidly and nutrients rise too high toward the end of the experiments in all PU1 (Figures S2A1–A3,B1–B3) and the low-N:P (DIN:DIP < 6) treatments of PU2 (Figures S3A3,A4,B3,B4). Phytoplankton declines to sufficiently low concentrations to cause food limitation in the microzooplankton compartment and microzooplankton biomass is overestimated toward the end of the low-N:P treatments of PU2 (Figures S2B2,B3). Microzooplankton is not food limited in the other simulations (ingestion saturation ≈ 1) (Figures S2B3,B4). Although the microzooplankton biomass in the PU1 experiment was dominated by dinoflagellates, ciliate parameters according to Pahlow and Prowe (2010) give the best fit of the model to the data in both experiments (Table 1, Figures 5, 6 and Figures S2, S3).
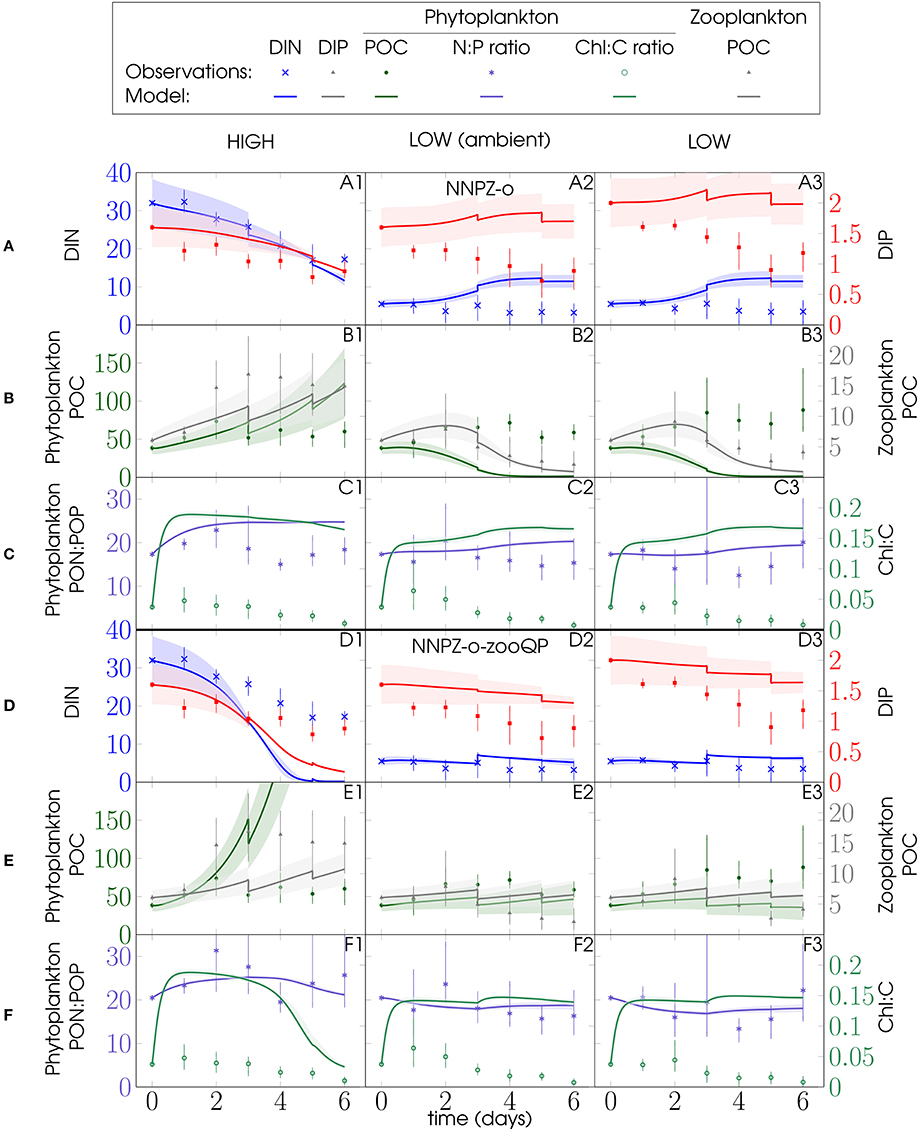
Figure 5. Effect of different microzooplankton elemental phosphorus quotas. (A–C) Omnivore PU1-NNPZ-o configuration with lower microzooplankton P:C quota ( = 0.013 molP molC−1); (D–E) omnivore NNPZ—o–zooQP configuration with higher microzooplankton P:C quota ( = 0.0195 molP molC−1) (Table 1 and Figure 2); Microzooplankton biomass was initialized with the total initial microzooplankton biomass (BMtot) of ciliates and dinoflagellates (Figure 2). The microzooplankton compartment is parameterized as ciliates (Strobilidium spiralis). Left y-axes: (A,D) DIN, (B,E) phytoplankton POC and (C,F) phytoplankton PON:POP ratio; right y-axes: (A,D) DIP, (B,E) (micro)zooplankton POC and (C,F) phytoplankton Chl:C ratio; units as in Figure 3; model discontinuities are due to dilutions; observations (marks) are daily averages, where vertical bars indicate the range between the lowest and the highest measurement of all mesocosms within one treatment.
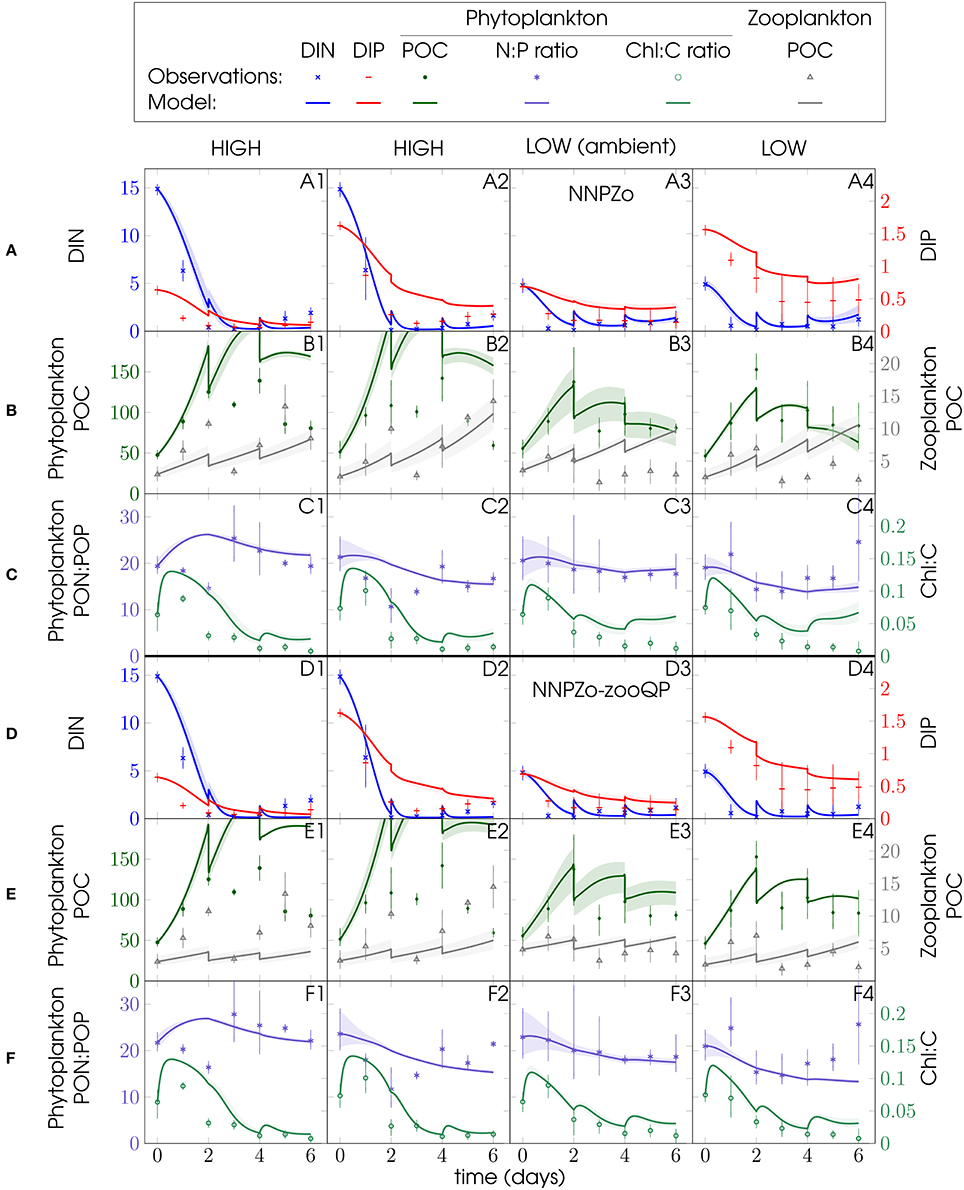
Figure 6. Same as Figure 5, but showing data and ensemble model simulations for PU2 for the omnivore NNPZ o and NNPZ-o-zooQP configurations.
The omnivore (NNPZ-o) configuration yields a fair reproduction of the phytoplankton biomass (Figures 5B1, 6B) and also matches microzooplankton biomass in all PU1 simulations (Figure 5B) and in those for the high-N:P (DIN:DIP > 6) treatments of PU2 (Figures 6B1,B2). Compared with the NNPZ-s configuration (Figures S2, S3), model phytoplankton represents the observations better for the high-N:P treatments of PU1 (Figure 5B1), while it agrees better for the low-N:P treatments for PU2 (Figures 6B3,B4). Remineralization and microzooplankton biomass are overestimated in the low-N:P treatments of PU2 (Figures 6A3,A4,B3,B4). The NNPZ-o simulation largely reproduces the observations for inorganic nutrients, and phytoplankton and zooplankton biomass in the high-N:P treatments in both experiments (Figures 5A1–B1, 6A1,A2,B1,B2). The model overestimates the Chl:C ratios for PU1 but those for PU2 appear to be captured quite well (Figures 5C, 6C). In summary, the NNPZ-o configuration appears capable of reproducing the high-N:P but not the low-N:P treatments of both experiments (Figure 7).
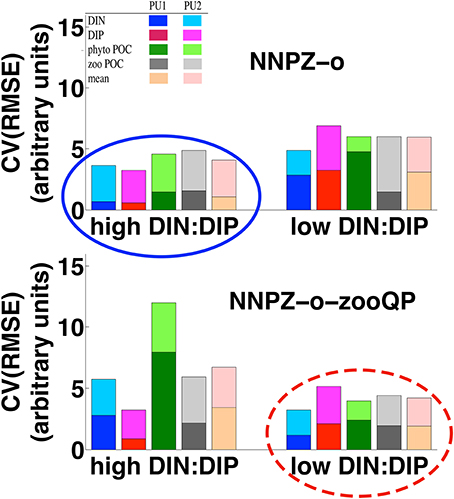
Figure 7. Coefficient of variation of the root mean square error [CV(RMSE); see Appendix in Supplementary Material, Equations 14, 15] of the PU1 and PU2 model simulations, showing the high and low DIN:DIP treatments for the omnivore NNPZ-o configuration with lower P:C quota (Table 1) and omnivore NNPZ-o-zooQP configuration with higher microzooplankton P:C quota (Table 1); the CV(RMSE) is calculated for DIN, DIP, phytoplankton POC (phyto POC), zooplankton POC (zoo POC), as well as for the mean of the calculated CV(RMSE), respectively; the high DIN:DIP treatments are better reproduced by the omnivore NNPZ-o configuration (solid ellipse), whereas the low DIN:DIP treatments agree best with the omnivore NNPZ-o-zooQP configuration (dashed ellipse); high DIN:DIP represent treatments with DIN:DIP ratios above 6, while low DIN:DIP represents treatments with DIN:DIP ratios below 6.
We analyse the sensitivity of our simulations with respect to variations in the parameters describing N and P subsistence quotas for phytoplankton and zooplankton N:C and P:C ratios in an attempt to unravel the causes of the poor fit of the NNPZ-o simulations to the low N:P treatments. These parameters determine the stoichiometry of our plankton compartments. No significant improvement in model performance is achieved by varying the phytoplankton subsistence quotas or the microzooplankton N:C ratio. However, when we apply a higher microzooplankton P:C ratio ( set to 0.0195 molP molC−1, Table 1) in the NNPZ-o-zooQP configuration, which is otherwise the same as the NNPZ-o configuration, we obtain the best results for the low-N:P treatments for both PU1 and PU2. Nevertheless, the NNPZ-o-zooQP configuration fails to reproduce the high-N:P treatments (Figures 5–7). Thus, a high works for low-N:P but not high-N:P treatments. We also conduct simulations with more complex model configurations, where we employ two zooplankton compartments to simulate the ciliate and dinoflagellate communities separately (NNPZZ configuration, Figure S1). However, these do not perform better than the NNPZ-o and NNPZ-o-zooQP configurations.
Considering all observations, model configurations, and processes together, the NNPZ-o configuration with the low microzooplankton P:C quota best reproduces the high-N:P treatments, whereas the NNPZ-o-zooQP best reproduces the low-N:P treatments in both experiments (Figure 7).
Discussion
The shipboard mesocosm experiments analyzed here comprise twelve mesocosms with three and four treatment levels in PU1 and PU2, respectively, of which two were initialized with ambient dissolved inorganic nutrient concentrations (Hauss et al., 2012). To all other treatments, nitrogen and phosphorus compounds were added to simulate higher or lower than ambient DIN:DIP ratios. The microzooplankton community was dominated by dinoflagellates in PU1 and by ciliates in PU2. While the PU2 mesocosms were “mesozooplankton-free,” two mesocosms per treatment in PU1 were not (Hauss et al., 2012; Figure 1). We use several configurations of an optimality-based food-chain model to analyse the influence of the functional composition of the plankton communities in the mesocosms of both PU experiments (Hauss et al., 2012). The use of pre-calibrated parameters representing the phytoplankton and microzooplankton communities allows us to keep the number of tuning parameters low and facilitates the comparison of different model configurations (Hood et al., 2006).
In the pre-calibrated parameter-sets of Pahlow and Prowe (2010), the prey capture coefficients (ϕ) differ strongly between ciliates and dinoflagellates (Table 1 and Table S1). However, this difference has little effect in our simulations as ingestion is always saturated, except when phytoplankton is greatly underestimated toward the end of the simulations. Thus, it turns out that, among the zooplankton parameters, our model is most sensitive to the maximum ingestion rate (Imax). Hence the main reason for the better performance of the ciliate parameter sets for the simulation of the dinoflagellate-dominated PU1 experiments is owing to its higher Imax. A range of different Imax was found for different ciliate species by Pahlow and Prowe (2010), but for parameter calibration the data for only one dinoflagellate species were available to Pahlow and Prowe (2010). Taking the range in Imax for ciliate species as an indication for the variability of this parameter between species within microzooplankton groups, it would not appear unrealistic to apply the same Imax for dinoflagellates as for ciliates. Consequently, the high food concentrations in these mesocosm experiments might have obscured differences in foraging strategies between ciliates (low ϕ) and dinoflagellates (high ϕ) and therefore allowed both groups to strive similarly. This could point toward ecological vicariance, where similar ecological niches can be occupied by different species at different locations.
Minimum Requirements to Model the PU1 and PU2 Experiments
The NNP configuration does not describe phytoplankton mortality. Addition of the microzooplankton compartment in NNPZ-s and NNPZ-o introduces top-down control and thus balances phytoplankton growth (bottom-up control). The suppression of phytoplankton and overestimation of remineralization in the specialist (NNPZ-s) simulations of the low-N:P (DIN:DIP < 6) treatments prompted us to investigate further possible top-down controls within the microzooplankton community. Intraguild predation in the omnivore (NNPZ-o) configuration does indeed control microzooplankton growth. We conclude that at least two trophic levels and omnivory are needed in our model to reproduce the observed behavior of the mesocosm plankton communities.
Question 1: Does Phytoplankton Food Quality Shape the Microzooplankton Community Structure?
We expected initially that the variable phytoplankton stoichiometry would generate variations in food quality in terms of phytoplankton N:P ratio which could explain the differences of e.g., nutrient drawdown, remineralization, and microzooplankton growth between the high- and low-N:P treatments in the PU1 and PU2 experiments. This expectation was founded on the assumption that differences between phytoplankton and zooplankton C:N:P stoichiometry affect the assimilation efficiency, and hence growth, of the grazers (Kiørboe, 1989). The model achieves a relatively good agreement between simulated and observed N:P ratios of phytoplankton in all configurations. Thus, optimal acclimation might at least partly explain the phytoplankton N:P variations in both experiments (Figures 3–6). However, differences in phytoplankton N:P ratios between treatments are smaller than variations within treatments and too weak to explain the differential development of the different treatments. The observed phytoplankton N:P also does not simply follow the initial ambient DIN:DIP of the PU1 and PU2 experiments. Next, we consider the hypothesis that phytoplankton stoichiometry varied also due to the presence of different phytoplankton species (with different N and P subsistence quotas, and , respectively) in the different treatments, because, in addition to physiological acclimation, phytoplankton N:P also depends on and . Increasing does reduce the overestimation of final phytoplankton biomass but at the expense of slowing down initial phytoplankton growth (not shown).
Apparently, variations in phytoplankton elemental stoichiometry are insufficient to explain the differential behavior of the high- and low-N:P treatments. We thus examine the hypothesis that zooplankton stoichiometry could have varied between treatments and might have had major effects on community composition, as well as nutrient remineralization, which lead us to the question:
Question 2: How Plastic is Zooplankton Elemental Stoichiometry?
Variations C:N:P stoichiometry have been reported for microzooplankton (e.g., Meunier et al., 2012a; Grover and Chrzanowski, 2006) and for mesozooplankton (Urabe et al., 2002b; DeMott and Pape, 2005; Ferrao et al., 2007; Iwabuchi and Urabe, 2012b). Differences in elemental stoichiometry within or between the different trophic levels might help elucidate ecological interactions during food-web successions (Plath and Boersma, 2001; Sterner and Elser, 2002; Grover and Chrzanowski, 2006; Sterner et al., 2008; Meunier et al., 2012a,b; Litchman et al., 2013). We therefore examine our second hypothesis by varying the microzooplankton N:C and P:C ratios (), representing the nitrogen and phosphorus requirements of the higher trophic levels (Table 1). The P:C ratios applied in these simulations are higher than those observed by Meunier et al. (2012a), but within the range reported by Grover and Chrzanowski (2006). In these experiments, we keep the microzooplankton C:N:P ratios temporally constant over the whole time course of the experiments. While variations in microzooplankton N:C lead to no improvement in model performance, raising their P:C ratio succeeds in reducing the discrepancies between model and observations in the low-N:P treatments for both PU1 and PU2. One explanation might be that P was always abundant in the low-N:P mesocosm treatments, contrary to N, yet the model tends to underestimate the decline in DIP in the low-N:P treatments. A higher phytoplankton P:C via a higher cannot resolve this problem, as it also intensifies P regeneration via P excretion from the zooplankton. A higher also reduces phytoplankton N:P, contrary to the observations in the low-N:P treatments. Thus, a higher essentially increases the amount of P stored in the zooplankton compartment and thus helps explain the DIP decline in the low-N:P treatments.
Variable Nutrient Stoichiometry and Its Effects on Microzooplankton
For both PU1 and PU2 it proves impossible to reproduce with just one microzooplankton P:C ratio ( the high- and low-N:P treatments at the same time (Figure 7 and Appendix in Supplementary Material, Equations 14, 15). The high-N:P treatments agree better with a lower microzooplankton (NNPZ-o configuration), whereas the low-N:P treatments agree better with a higher microzooplankton (NNPZ-o-zooQP configuration) (Figure 7). Thus, we hypothesize a flexible elemental composition of the microzooplankton.
Flexible microzooplankton stoichiometry might compensate partly for low food quality in terms of C:N:P composition of the prey. At first sight, our results seem to indicate a relationship between external nutrient stoichiometry and microzooplankton internal elemental composition. If the initial inorganic DIN:DIP ratio is high, microzooplankton with a lower P:C ratio likely grow better, although phytoplankton N:P and P:C do not differ strongly (Figure 8). In all (NNPZ-o and NNPZ-o-zooQP) simulations for both PU1 and PU2, phytoplankton N:C showed a much clearer relation than N:P or P:C to the low- and high-N:P treatments (Figure 8): In the first 2 days of our model simulations, phytoplankton N:C ratios develop in groups according to the initial DIN:DIP ratio (Figure 8), implying a distinction in phytoplankton food quality in terms of N:C, rather than N:P, between the high- and low-N:P treatments. While the observed phytoplankton N:C ratios shown in Figure 8 do not reveal such a clear separation according to the initial DIN:DIP ratio, they mostly agree with our model simulations, except during the second half of the PU2 experiments (Figure 8). Neglecting detritus, which was not quantified in the original mesocosm experiments, might have caused some of this discrepancy. Part of this discrepancy might also be due to the fact that in our model the microzooplankton C:N:P stoichiometry was temporally constant, and thus cannot adjust in response to changes in phytoplankton food quality during the model simulations.
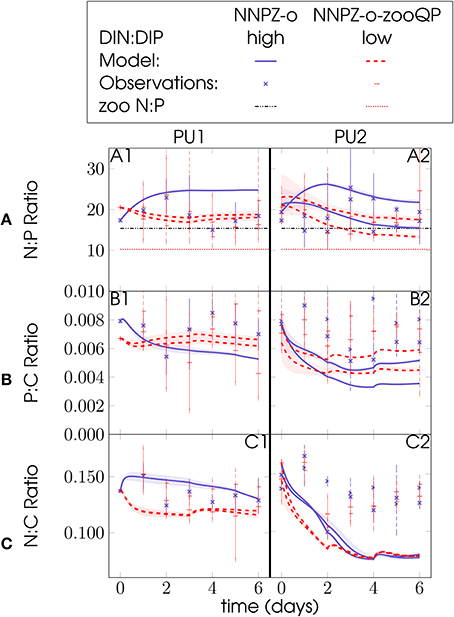
Figure 8. Food quality in terms of N:P, P:C, or N:C ratios for the PU1 (A1–C1) and PU2 (A2–C2) omnivore NNPZ-o and NNPZ-o-zooQP model configurations: (A) phytoplankton PON:POP ratio, (B) phytoplankton POP:POC ratio and (C) phytoplankton PON:POC ratio; solid and dashed lines represent model results, circles are observations; units are mol mol−1 for N:P, P:C and N:C ratios; high represent treatments with DIN:DIP ratios above 6, while low represents treatments with N:P ratios below 6; (A1–A2): horizontal dashed-dotted lines show zooplankton N:P ~16, whereas horizontal dotted lines show zooplankton N:P ~10; observations (marks) are daily averages, where vertical dashed and solid bars indicate the range between the lowest and the highest measurement of all mesocosms within one treatment.
In Meunier et al. (2012b) selection experiments, the microzooplankton P:C ratio was also higher when the phytoplankton N:C ratio was lower and vice versa (their Table 4). We thus hypothesize that microzooplankton adjust their internal P:C ratio in response to food quality in terms of prey N:C ratio. Thus, differences in phytoplankton N:C ratios during the first days of the experiments could have served as the signal to which the microzooplankton P:C ratio responded (Figure 8C).
Question 3: Variable Microzooplankton Community Composition or Physiological Plasticity?
Our hypothesized variability of the microzooplankton P:C ratio may have been caused by either (a) different dominant species in the (multi-species) microzooplankton compartment or (b) physiological acclimation and regulation within individual microzooplankton species.
Within each of PU1 and PU2, all mesocosms were initialized identically, except that mesozooplankton was not removed from half of the PU1 mesocosms. Hence we expected similar initial nutrient conditions and plankton assemblages in all mesocosms prior to the nutrient enrichments. Hauss et al. (2012) did not distinguish between mesocosms with and without mesozooplankton in PU1, because they observed no significant differences in the nutrient drawdown. However, the individual plankton taxa in PU1 were affected by the different nutrient treatments and the presence or absence of mesozooplankton (Hauss et al., 2012). Dinoflagellate biomass dominated the microzooplankton community in PU1 and was approximately 10 fold higher than in PU2. In PU2, ciliate biomass was dominant and approximately five times higher than in PU1. Diatom biomass in PU2 exceeded that in PU1 approximately five fold as well (Hauss et al., 2012). In the high-N:P treatment of PU1, only two of the diatom species responded positively to P addition, whereas no significant shift in community composition between individual mesocosms was found in PU2 (Hauss et al., 2012). Hence, it appears unlikely, albeit not impossible, that different microzooplankton communities developed in the different treatments. Although changes in the PU2 microzooplankton community composition cannot be ruled out, the most likely explanation thus appears to be a physiological regulation of the P:C ratio within individuals. Our study thus emphasizes the importance of microzooplankton stoichiometric plasticity in response to changes in elemental composition of food. In other words, “If you live in a nutrient-rich environment and feed on high quality food (P-enriched), you can set your general living standard (here P-quota) to a higher level.”
Author Contributions
MP developed the model. AM and MP performed the modeling experiments. AM processed and analyzed the data. AM and MP wrote the manuscript. All authors have given approval for the submission of this manuscript.
Conflict of Interest Statement
The authors declare that the research was conducted in the absence of any commercial or financial relationships that could be construed as a potential conflict of interest.
Acknowledgments
This work is a contribution of the DFG-supported project SFB754 (Sonderforschungsbereich 754 “Climate-Biogeochemistry Interactions in the Tropical Ocean,” http://www.sfb754.de). We thank H. Hauss and J. Franz for providing unpublished data and helpful comments and discussions. We thank M. Schartau, A. Oschlies, M. Köllner for helpful comments on an earlier version of this manuscript. The authors thank C. Somes and M. Gledhill for language improvements and fruitful discussions. Furthermore, we thank R. Condon and 3 reviewers for helpful and critical revision and feedback on a previous presentation of this manuscript. We thank two reviewers and the editor S. Vallina for critical revision and feedback to improve this manuscript. AM would like to thank the U.S. Ocean Carbon and Biogeochemistry Program at the Woods Hole Oceanographic Institution, the Integrated Marine Biogeochemistry and Ecosystem Research and the National Aeronautics and Space Administration for awarded workshop- and travel-funding grants.
Supplementary Material
The Supplementary Material for this article can be found online at: http://journal.frontiersin.org/article/10.3389/fmars.2016.00258/full#supplementary-material
References
Andersen, T., and Hessen, D. O. (1991). Carbon, nitrogen, and phosphorus content of freshwater zooplankton, Limnol. Oceanogr. 36, 807–814. doi: 10.4319/lo.1991.36.4.0807
Anderson, T. R. (2005). Plankton functional type modelling: running before we can walk? J. Plankton Res. 27, 1073–1081. doi: 10.1093/plankt/fbi076
Brock, J., and Schulz-Vogt, H. N. (2011). Sulfide induces phosphate release from polyphosphate in cultures of a marine Beggiatoa strain. ISME J. 5, 497–506. doi: 10.1038/ismej.2010.135
Chrzanowski, T. H., and Grover, J. P. (2008). Element content of Pseudomonas fluorescens varies with growth rate and temperature: a replicated chemostat study addressing ecological stoichiometry. Limnol. Oceanogr. 53, 1242–1251. doi: 10.4319/lo.2008.53.4.1242
DeMott, W. R., and Pape, B. J. (2005). Stoichiometry in an ecological context: testing for links between Daphnia P-content, growth rate and habitat preference. Oecologia 142, 20–27. doi: 10.1007/s00442-004-1716-y
Deutsch, C., Sarmiento, J. L., Sigman, D. M., Gruber, N., and Dunne, J. P. (2007). Spatial coupling of nitrogen inputs and losses in the ocean. Nature 445, 163–167. doi: 10.1038/nature05392
Ferrao, A. D., Tessier, A. J., and DeMott, W. R. (2007). Sensitivity of herbivorous zooplankton to phosphorus-deficient diets: testing stoichiometric theory and the growth rate hypothesis. Limnol. Oceanogr. 52, 407–415. doi: 10.4319/lo.2007.52.1.0407
Finkel, Z. V., Beardall, J., Flynn, K. J., Quigg, A., Rees, T. A. V., and Raven, J. A. (2010). Phytoplankton in a changing world: cell size and elemental stoichiometry. J. Plankton Res. 32, 119–137. doi: 10.1093/plankt/fbp098
Franz, J., Hauss, H., Sommer, U., Dittmar, T., and Riebesell, U. (2013a). Biogeochemistry of mesocosm experiments in the tropical Pacific and Atlantic Ocean. doi: 10.1594/PANGAEA.821892
Franz, J., Hauss, H., Sommer, U., Dittmar, T., and Riebesell, U. (2013b). Biogeochemistry of Mesocosms during METEOR cruise M77/3. doi: 10.1594/PANGAEA.821880
Franz, J., Krahmann, G., Lavik, G., Grasse, P., Dittmar, T., and Riebesell, U. (2012a). Dynamics and stoichiometry of nutrients and phytoplankton in waters influenced by the oxygen minimum zone in the eastern tropical Pacific. Deep Sea Res. Part I Oceanogr. Res. Pap. 62, 20–31. doi: 10.1016/j.dsr.2011.12.004
Franz, J. M. S., Hauss, H., Sommer, U., Dittmar, T., and Riebesell, U. (2012b). Production, partitioning and stoichiometry of organic matter under variable nutrient supply during mesocosm experiments in the tropical Pacific and Atlantic Ocean. Biogeosciences 9, 4629–4643. doi: 10.5194/bg-9-4629-2012
Galán, A., Molina, V., Thamdrup, B., Woebken, D., Lavik, G., Kuypers, M. M. M., et al. (2009). Anammox bacteria and the anaerobic oxidation of ammonium in the oxygen minimum zone off northern Chile. Deep Sea Res. Part II Top. Stud. Oceanogr. 56, 1021–1031. doi: 10.1016/j.dsr2.2008.09.016
Goldhammer, T., Brüchert, V., Ferdelman, T. G., and Zabel, M. (2010). Microbial sequestration of phosphorus in anoxic upwelling sediments. Nat. Geosci. 3, 557–561. doi: 10.1038/ngeo913
Grover, J. P., and Chrzanowski, T. H. (2006). Stoichiometry and growth kinetics in the “smallest zooplankton” – phagotrophic flagellates. Arch. Hydrobiol. 167, 467–487. doi: 10.1127/0003-9136/2006/0167-0467
Hauss, H., Franz, J. M. S., and Sommer, U. (2012). Changes in N:P stoichiometry influence taxonomic composition and nutritional quality of phytoplankton in the Peruvian upwelling. J. Sea Res. 73, 74–85. doi: 10.1016/j.seares.2012.06.010
Helly, J. J., and Levin, L. A. (2004). Global distribution of naturally occurring marine hypoxia on continental margins. Deep Sea Res. Part I Oceanogr. Res. Pap. 51, 1159–1168. doi: 10.1016/j.dsr.2004.03.009
Herrera, L., and Escribano, R. (2006). Factors structuring the phytoplankton community in the upwelling site off El Loa River in northern Chile. J. Mar. Syst. 61, 13–38. doi: 10.1016/j.jmarsys.2005.11.010
Hessen, D. O., Elser, J. J., Sterner, R. W., and Urabe, J. (2013). Ecological stoichiometry: an elementary approach using basic principles. Limnol. Oceanogr. 58, 2219–2236. doi: 10.4319/lo.2013.58.6.2219
Hood, R. R., Laws, E. A., Armstrong, R. A., Bates, N. R., Brown, C. W., Carlson, C. A., et al. (2006). Pelagic functional group modeling: progress, challenges and prospects. Deep Sea Res. Part II Top. Stud. Oceanogr. 53, 459–512. doi: 10.1016/j.dsr2.2006.01.025
Ingall, E., and Jahnke, R. (1994). Evidence for enhanced phosphorus regeneration from marine sediments overlain by oxygen depleted waters. Geochim. Cosmochim. Acta 58, 2571–2575. doi: 10.1016/0016-7037(94)90033-7
Iwabuchi, T., and Urabe, J. (2012a). Competitive outcomes between herbivorous consumers can be predicted from their stoichiometric demands. Ecosphere 3, 1–16. doi: 10.1890/es11-00253.1
Iwabuchi, T., and Urabe, J. (2012b). Food quality and food threshold: implications of food stoichiometry to competitive ability of herbivore plankton. Ecosphere 3, 1–17. doi: 10.1890/es12-00098.1
Kiørboe, T. (1989). Phytoplankton growth rate and nitrogen content: implications for feeding and fecundity in a herbivorous copepod. Mar. Ecol. Prog. Ser. 55, 229–234. doi: 10.3354/meps055229
Kiørboe, T., Saiz, E., and Viitasalo, M. (1996). Prey switching behaviour in the planktonic copepod Acartia tonsa. Mar. Ecol. Prog. Ser. 143, 65–75. doi: 10.3354/meps143065
Klausmeier, C. A., Litchman, E., Daufresne, T., and Levin, S. A. (2008). Phytoplankton stoichiometry. Ecol. Res. 23, 479–485. doi: 10.1007/s11284-008-0470-8
Landolfi, A., Dietze, H., Koeve, W., and Oschlies, A. (2013). Overlooked runaway feedback in the marine nitrogen cycle: the vicious cycle. Biogeosciences 10, 1351–1363. doi: 10.5194/bg-10-1351-2013
Lewandowska, A., and Sommer, U. (2010). Climate change and the spring bloom: a mesocosm study on the influence of light and temperature on phytoplankton and mesozooplankton. Mar. Ecol. Prog. Ser. 405, 101–111. doi: 10.3354/meps08520
Litchman, E., Ohman, M. D., and Kiorboe, T. (2013). Trait-based approaches to zooplankton communities. J. Plankton Res. 35, 473–484. doi: 10.1093/plankt/fbt019
Malzahn, A. M., Hantzsche, F., Schoo, K. L., Boersma, M., and Aberle, N. (2010). Differential effects of nutrient-limited primary production on primary, secondary or tertiary consumers. Oecologia 162, 35–48. doi: 10.1007/s00442-009-1458-y
Meunier, C. L., Haafke, J., Oppermann, B., Boersma, M., and Malzahn, A. M. (2012a). Dynamic stoichiometric response to food quality fluctuations in the heterotrophic dinoflagellate Oxyrrhis marina. Mar. Biol. 159, 2241–2248. doi: 10.1007/s00227-012-2009-3
Meunier, C. L., Hantzsche, F. M., Cunha-Dupont, A. Ö., Haafke, J., Oppermann, B., Malzahn, A. M., et al. (2012b). Intraspecific selectivity, compensatory feeding and flexible homeostasis in the phagotrophic flagellate Oxyrrhis marina: three ways to handle food quality fluctuations. Hydrobiologia 680, 53–62. doi: 10.1007/s10750-011-0900-4
Mitra, A. (2009). Are closure terms appropriate or necessary descriptors of zooplankton loss in nutrient–phytoplankton–zooplankton type models? Ecol. Modell. 220, 611–620. doi: 10.1016/j.ecolmodel.2008.12.008
Mitra, A., and Flynn, K. J. (2007). Importance of interactions between food quality, quantity, and gut transit time on consumer feeding, growth, and trophic dynamics. Am. Nat. 169, 632–646. doi: 10.1086/513187
Noffke, A., Hensen, C., Sommer, S., Scholz, F., Bohlen, L., Mosch, T., et al. (2012). Benthic iron and phosphorus fluxes across the Peruvian oxygen minimum zone. Limnol. Oceanogr. 57, 851–867. doi: 10.4319/Lo.2012.57.3.0851
Pahlow, M. (2005). Linking chlorophyll-nutrient dynamics to the Redpeld N:C ratio with a model of optimal phytoplankton growth. Mar. Ecol. Prog. Ser. 287, 33–43. doi: 10.3354/meps287033
Pahlow, M., Dietze, H., and Oschlies, A. (2013). Optimality-based model of phytoplankton growth and diazotrophy. Mar. Ecol. Prog. Ser. 489, 1–16. doi: 10.3354/meps10449
Pahlow, M., and Oschlies, A. (2013). Optimal allocation backs Droop's cell-quota model. Mar. Ecol. Prog. Ser. 473, 1–5. doi: 10.3354/meps10181
Pahlow, M., and Prowe, A. E. F. (2010). Model of optimal current feeding in zooplankton. Mar. Ecol. Prog. Ser. 403, 129–144. doi: 10.3354/meps08466
Pahlow, M., Vézina, A. F., Casault, B., Maass, H., Malloch, L., Wright, D. G., et al. (2008). Adaptive model of plankton dynamics for the North Atlantic. Prog. Oceanogr. 76, 151–191. doi: 10.1016/j.pocean.2007.11.001
Pitchford, J. (1998). Intratrophic predation in simple predator–prey models. Bull. Math. Biol. 60, 937–953. doi: 10.1006/bulm.1998.0053
Plath, K., and Boersma, M. (2001). Mineral limitation of zooplankton: stoichiometric constraints and optimal foraging. Ecology 82, 1260–1269. doi: 10.1890/0012-9658(2001)082[1260:mlozsc]2.0.co;2
Polis, G. A., and Holt, R. D. (1992). Intraguild predation: the dynamics of complex trophic interactions. Trends Ecol. Evol. 7, 151–154. doi: 10.1016/0169-5347(92)90208-S
Polis, G. A., Myers, C. A., and Holt, R. D. (1989). The ecology and evolution of intraguild predation - potential competitors that eat each other. Annu. Rev. Ecol. Syst. 20, 297–330.
Quigg, A., Finkel, Z. V., Irwin, A. J., Rosenthal, Y., Ho, T. Y., Reinfelder, J. R., et al. (2003). The evolutionary inheritance of elemental stoichiometry in marine phytoplankton. Nature 425, 291–294. doi: 10.1038/nature01953
Redfield, A. C. (1934). “On the proportions of organic derivatives in sea water and their relation to the composition of plankton,” in James Johnstone Memorial Volume, ed R. J. Daniel (Liverpool: L.S.-F. Laboratory; University of Liverpool), 176–192.
Riebesell, U., Bellerby, R. G. J., Grossart, H. P., and Thingstad, F. (2008). Mesocosm CO2 perturbation studies: from organism to community level. Biogeosciences 5, 1157–1164. doi: 10.5194/bg-5-1157-2008
Root, R. B. (1967). The niche exploitation pattern of the blue-gray gnatcatcher. Ecol. Monogr. 37, 317. doi: 10.2307/1942327
Schartau, M., Engel, A., Schroter, J., Thoms, S., Volker, C., and Wolf-Gladrow, D. (2007). Modelling carbon overconsumption and the formation of extracellular particulate organic carbon. Biogeosciences 4, 433–454. doi: 10.5194/bg-4-433-2007
Smith, S. L., Pahlow, M., Merico, A., and Wirtz, K. W. (2011). Optimality-based modeling of planktonic organisms. Limnol. Oceanogr. 56, 2080–2094. doi: 10.4319/lo.2011.56.6.2080
Stav, G., Blaustein, L., and Margalit, Y. (2005). Individual and interactive effects of a predator and controphic species on mosquito populations. Ecol. Appl. 15, 587–598. doi: 10.1890/03-5191
Sterner, R. W., Andersen, T., Elser, J. J., Hessen, D. O., Hood, J. M., McCauley, E., et al. (2008). Scale-dependent carbon: nitrogen: phosphorus seston stoichiometry in marine and freshwaters. Limnol. Oceanogr. 53, 1169–1180. doi: 10.4319/lo.2008.53.3.1169
Sterner, R. W., and Elser, J. J. (2002). Ecological Stoichiometry: The Biology of Elements from Molecules to the Biosphere. Princeton, NJ: Princeton University Press.
Stramma, L., Johnson, G. C., Sprintall, J., and Mohrholz, V. (2008). Expanding oxygen-minimum zones in the tropical oceans. Science 320, 655–658. doi: 10.1126/science.1153847
Suzuki-Ohno, Y., Kawata, M., and Urabe, J. (2012). Optimal feeding under stoichiometric constraints: a model of compensatory feeding with functional response. Oikos 121, 569–578. doi: 10.1111/j.1600-0706.2011.19320.x
Urabe, J., Elser, J. J., Kyle, M., Yoshida, T., Sekino, T., and Kawabata, Z. (2002a). Herbivorous animals can mitigate unfavourable ratios of energy and material supplies by enhancing nutrient recycling. Ecol. Lett. 5, 177–185. doi: 10.1046/j.1461-0248.2002.00303.x
Urabe, J., Kyle, M., Makino, W., Yoshida, T., Andersen, T., and Elser, J. J. (2002b). Reduced light increases herbivore production due to stoichiometric effects of light/nutrient balance. Ecology 83, 619. doi: 10.1890/0012-9658(2002)083[0619:rlihpd]2.0.co;2
Vallino, J. J. (2000). Improving marine ecosystem models: use of data assimilation and mesocosm experiments. J. Mar. Res. 58, 117–164. doi: 10.1357/002224000321511223
Wohlers, J., Engel, A., Zöllner, E., Breithaupt, P., Jürgens, K., Hoppe, H. G., et al. (2009). Changes in biogenic carbon flow in response to sea surface warming. Proc. Natl. Acad. Sci. U.S.A. 106, 7067–7072. doi: 10.1073/pnas.0812743106
Keywords: microzooplankton stoichiometric plasticity, optimality-based plankton ecosystem model, trait-based modeling, intraguild predation, trophic structure, Peruvian Upwelling
Citation: Marki A and Pahlow M (2016) Microzooplankton Stoichiometric Plasticity Inferred from Modeling Mesocosm Experiments in the Peruvian Upwelling Region. Front. Mar. Sci. 3:258. doi: 10.3389/fmars.2016.00258
Received: 28 June 2016; Accepted: 25 November 2016;
Published: 20 December 2016.
Edited by:
Sergio M. Vallina, Spanish National Research Council (CSIS), SpainReviewed by:
Ulisses Miranda Azeiteiro, University of Aveiro, PortugalAkkur Vasudevan Raman, Andhra University, India
Copyright © 2016 Marki and Pahlow. This is an open-access article distributed under the terms of the Creative Commons Attribution License (CC BY). The use, distribution or reproduction in other forums is permitted, provided the original author(s) or licensor are credited and that the original publication in this journal is cited, in accordance with accepted academic practice. No use, distribution or reproduction is permitted which does not comply with these terms.
*Correspondence: Alexandra Marki, YW1hcmtpQGdlb21hci5kZQ==