 Katherine Richardson
 Jørgen Bendtsen
 Theis Kragh
 Erik A. Mousing
- 1Center for Macroecology, Evolution and Climate, Natural History Museum of Denmark, University of Copenhagen, Copenhagen, Denmark
- 2ClimateLab, Copenhagen, Denmark
- 3Department of Biology, University of Copenhagen, Copenhagen, Denmark
Global and regional ocean primary production estimates are highly dependent on assumptions concerning the photosynthetic potential of the resident phytoplankton communities. Little is known, however, about global patterns in the distribution of photosynthetic potential and their causes. Here, we review existing literature reporting photosynthetic characteristics of natural populations. From this, we formulate hypotheses regarding abiotic and biotic factors of potential importance in determining photosynthetic performance. These hypotheses are then tested using data we have compiled from nearly all major ocean basins on the maximum rate of photosynthesis, , and the slope of the photosynthesis vs. light curve, αB (both parameters normalized to chlorophyll) as well as standard environmental variables, size fractioned chlorophyll, taxonomic data (to group), size, and biovolume data for pico-, nano-, and micro-phytoplankton. In terms of abiotic variables, depth of sampling, temperature, and nutrient availability all can be related to photosynthetic parameters. The most important biotic variable influencing photosynthetic performance was found to be community size distribution and the small component (i.e., the proportion of the phytoplankton community passing through a 10 μm filter) is shown to have both higher and αB than the larger phytoplankton component. A simple model was used to derive best fit values for (1.53/2.50 μgC l−1 h−1) and αB (0.025/0.040) for the large/small groups in the subset of the data where taxonomic data were available (both surface and sub-surface samples) using fractioned chlorophyll data and bulk community photosynthetic parameters. Non-metric multidimensional scaling (NMDS) was used to relate the distribution of photosynthetic parameters and dominant (by biovolume) phytoplankton groups. High was recorded in communities dominated by dinoflagellates, small flagellates and in warmer waters, picoeukaryotes, and Synecococcus. Diatom dominated communities exhibited lower and were associated with high inorganic nutrients and colder temperatures. That photosynthetic parameters appear closely related to community size distributions and taxonomic group provides some hope for improving the parameterization of photosynthetic performance in global ocean primary production estimates as both of these parameters can be made from remotely sensed optical characteristics of surface waters.
Introduction
Focus has in recent years increasingly been moving toward developing a more complete understanding of the functioning of the Earth System (ES) and how it may be changing in response to human activities. Although there are numerous processes within the ES where anthropogenic influence can be detected at the global level (Steffen et al., 2015), climate change is an obvious driver in the search for a better understanding of ES function. As changes induced by human activities on the global carbon cycle lie at the root of human-caused climate change, much scientific focus is levied toward describing this cycle.
Processes occurring in the ocean are critical in the global carbon cycle. Consequently, a better quantification of the fluxes and transformations of carbon in the ocean currently lies at the frontier of marine science. Both physically and biologically mediated processes contribute to ocean carbon cycling. Although the magnitudes of the contributions from physical processes are better quantified than the biological, it is nevertheless believed that changes in rates of biological processes can have profound effects on ocean-atmosphere carbon flux (e.g., Sigman and Boyle, 2000; Segschneider and Bendtsen, 2013) and, thereby, global climate conditions.
Photosynthesis, i.e., the biological transformation of dissolved inorganic carbon (DIC) to particulate (POC) and dissolved (DOC) organic carbon is arguably the most important biological process contributing to the ocean carbon cycle. In order to constrain the global ocean carbon cycle, it therefore becomes necessary to obtain precise estimates of photosynthetic rates in the global ocean. Estimates of global ocean photosynthesis, i.e., primary production (PP), are often generated from remotely sensed optical characteristics of the surface ocean determined with the help of satellite-mounted sensors. A number of different algorithms have been developed to convert this surface ocean data to estimates of PP. (Note, however, that all of these algorithms address only the production of POC thus ignoring the not insignificant production of DOC by phytoplankton).
Comparisons (Campbell et al., 2002; Carr et al., 2006) examining how PP estimates generated by these different algorithms compare to particulate PP estimates generated in situ using the 14CO2 method originally described by Steemann Nielsen (1951), as well as how the algorithms compare to one another, demonstrate considerable variability between model estimates, and that agreement between estimates from the “best performing” (Campbell et al., 2002) algorithms and in situ estimates is normally only within ±100%. Clearly, this level of accuracy is not sufficient to detect subtle changes in ocean PP that may occur (or be occurring) in response to changing ocean conditions. There is, thus, a need to better constrain estimates of global PP.
All of the algorithms used to estimate global ocean PP today from data collected by remote sensing include a component describing the photosynthetic potential of the community (Behrenfeld and Falkowski, 1997a and several studies e.g., Behrenfeld and Falkowski, 1997b; Carr et al., 2006) have identified this model component as being particularly important in driving model results. Thus, they have argued that improvement in the estimation of ocean PP will require a better understanding and parameterization of the factors influencing photosynthetic potential.
The purpose of this study, therefore, was to examine empirical physiological data (photosynthetic parameters) collected from natural phytoplankton communities in relation to abiotic and biotic variables in an effort to identify patterns in the distribution of photosynthetic potential in the global ocean. The analyses presented are carried out on a single dataset (see Materials and Methods) comprised of data from all major ocean basins and where sampling was carried out by a single research group consisting of a small group of operators using the same equipment and protocols. This is important as relatively large variations between results obtained using different applications of the 14CO2 method of estimating PP on the same water sample have earlier been documented (Richardson, 1991).
In what is probably the most commonly applied algorithm for estimating ocean PP from remotely sensed surface optical characteristics, the Vertically Generalized Production Model (Behrenfeld and Falkowski, 1997b), phytoplankton photosynthetic potential, i.e., the maximum rate of photosynthesis normalized to chlorophyll, 1, is described as a function of temperature, where the relationship to temperature is derived from empirical data collected in two different geographic regions. Two observations regarding the -temperature relationship employed in the VGPM are worth noting: Firstly, there is considerable variability in this relationship, i.e., temperature alone does not well describe and secondly, the fact that varies as a function of temperature does not necessarily imply a direct temperature effect on as temperature co-varies with a number of other ocean parameters, including nutrient availability and phytoplankton community size distribution (Mousing et al., 2014).
We, therefore, wanted to examine in more detail the relationship between photosynthetic characteristics of naturally occurring phytoplankton populations and environmental conditions. Candidate abiotic and biotic variables for controlling photosynthetic parameters were identified on the basis of a literature survey of studies in which values have been reported for naturally occurring phytoplankton communities (Table 1). As this survey identified community size distribution and taxonomic characteristics as being potentially important biotic factors in controlling photosynthetic characteristics of a given community, a particular focus of this study is on the elaboration of the potential influence of these two parameters on community photosynthetic characteristics.
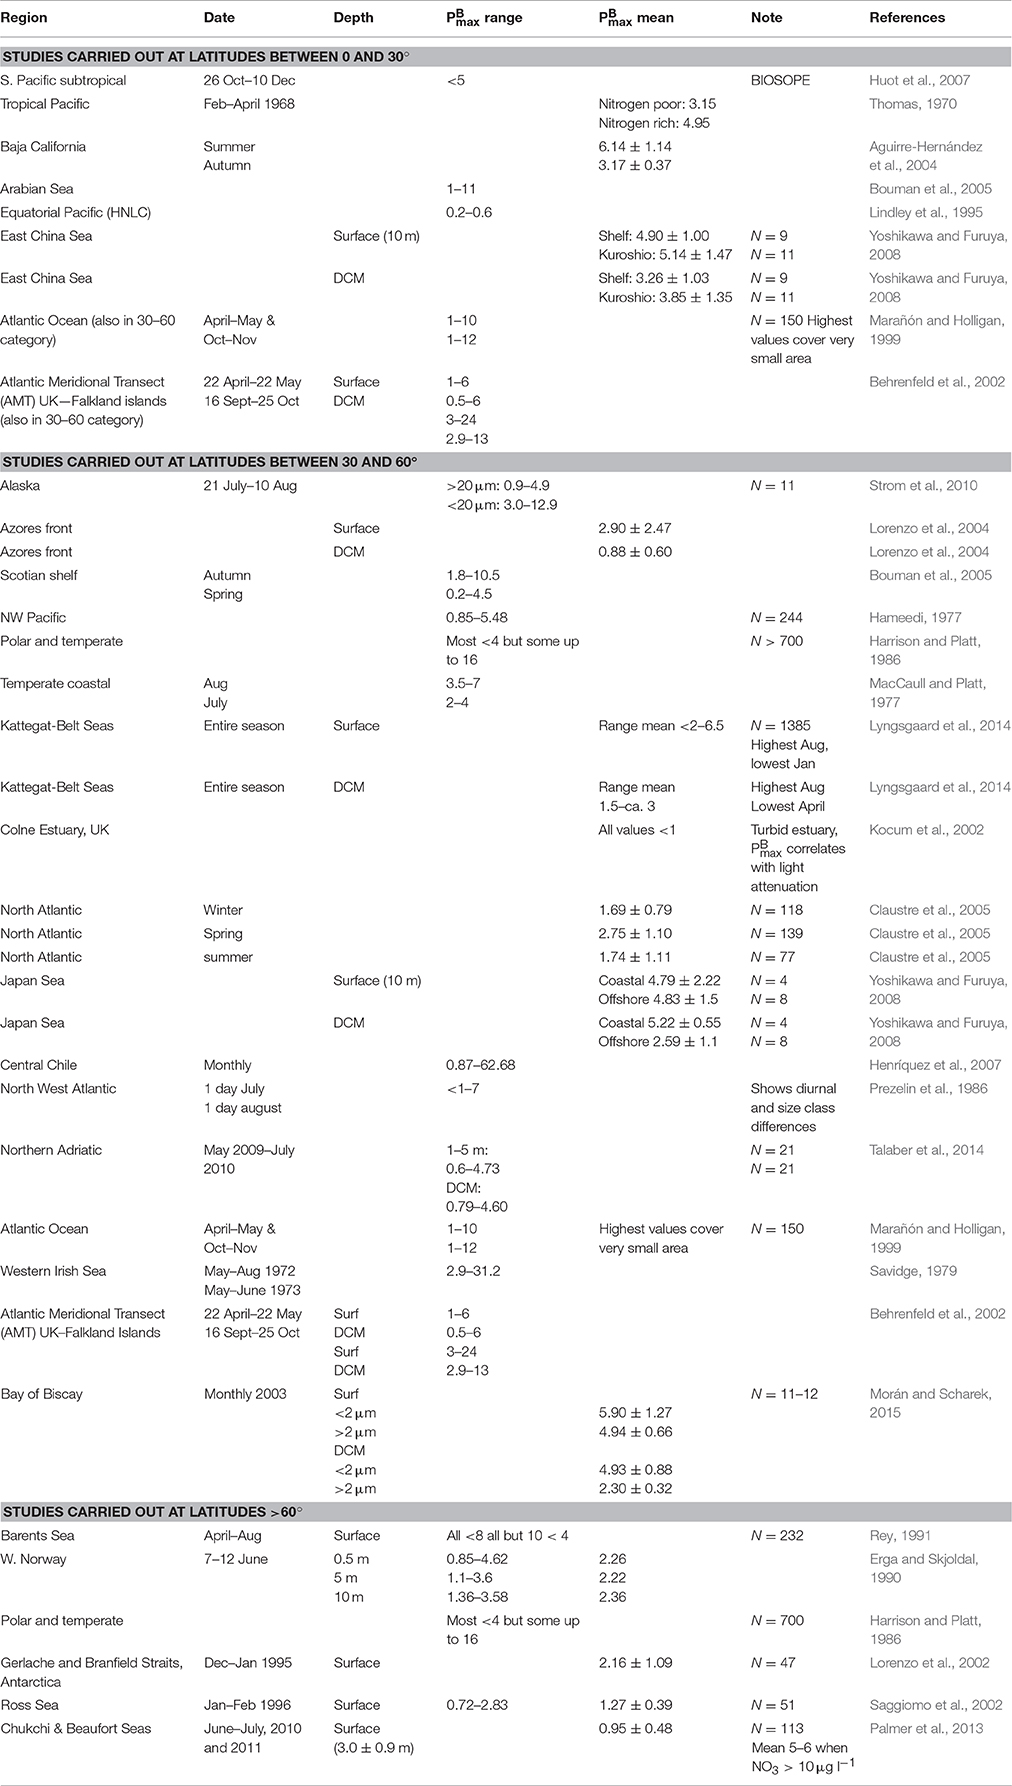
Table 1. Literature survey of reported for natural phytoplankton populations.
Materials and Methods
Dataset
The major part of the dataset used for this study is comprised of samples taken on the globally circumventing Galathea 3 Expedition (www.galathea3.dk) in August 2006–April 2007. These data have been supplemented with data from two cruises in the northern North Atlantic aboard the RV Dana (Technical University of Denmark) in August, 2008 and September, 2012. Sampling positions are shown in Figure 1. Identical methods and instrumentation were employed on all three cruises. Standard hydrographic profiles were made with a CTD (Seabird Instruments 911) mounted in a rosette with 5 or 30 l Niskin bottles. A profiling fluorometer (SCUFA or Dr. Hardt) and a light meter (Biospherical Instruments) were mounted on the rosette. Surface light was recorded (Biospherical Instruments) at the top of the ship. Water for inorganic nutrient determinations was tapped from the Niskin bottles and frozen until later determination at the National Environmental Research Institute, University of Aarhus, Denmark. Further detail on nutrient and all other sampling procedures is given in Hilligsøe et al. (2011).
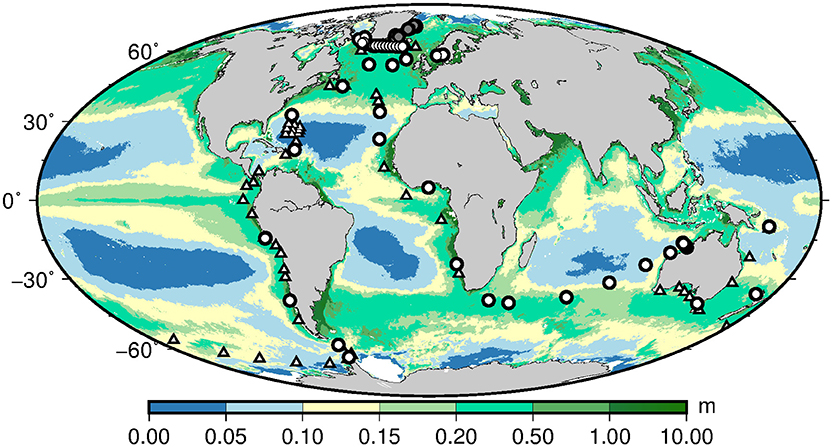
Figure 1. Stations from the Galathea 3 Expedition and the Dana cruises in 2008 (stations between Greenland and the Faeroe Islands along ~62.5° N) and 2012 (gray bullets along eastern Greenland) where photosynthetic parameters (, αB) were determined at surface and DCM. Triangles denote stations where phytoplankton size distribution and taxonomy were also determined. Background field of chlorophyll (μg l−1) was based on annual averaged MODIS satellite fields in 2003. Units of and αB are given by (μg C (μg Chl)−1 h−1) and (μg C (μg Chl)−1 h−1 μE−1 m2 s).
Primary Production
Samples from the surface layer (5 m at latitude >50°; 10 m at latitude <50°) and the depth of the deep chlorophyll maximum (DCM) were incubated (2 h in artificial light incubators mimicking the spectral distribution of daylight and adjusted to ambient temperature for the two depths) following the addition of 14CO2 at 12 different light intensities (~5–750 μmol photons m−2s−1). Two samples were incubated in darkness. When no DCM was present, a second depth was arbitrarily chosen for incubation (usually 20 m). 14C incorporation in POC was determined following filtration on a GFF filter and converted to total DIC incorporation on the basis of alkalinity and pH determinations or direct determination of pCO2 made at each station. Curves were fitted to the photosynthesis vs. light (P vs. E) relationships resulting from the incubations in order for find Pmax (maxiumum hourly rate of photosynthesis) and the slope of the P vs. E relationship when P < Pmax, i.e., alpha (α) (μg C (μg Chl a h)−1 μmol−1 photons m2 s) Both Pmax and α were normalized to the chlorophyll a content of the sample. Thus, and αB in the text refer to the chlorophyll normalized values of Pmax (μg C fixed l−1 h−1) and α, respectively.
The complete primary production dataset (in all 209 samples taken at 121 stations) comprises results obtained in the period ± ~100 days from the summer solstice with determinations being more or less evenly distributed in this period. No seasonal signal was found in the data. Sampling was also carried out throughout the day, although most sampling took place in daylight. All of the highest values of and αB were recorded between 0800 and 1600 (Figure 2). However, a full range (low to high) of values was recorded in this time interval and the lowest values for these photosynthetic parameters were also recorded within this time frame. Even in the surface data, where the signal is most pronounced, only ~20 data points for , and many fewer for αB, are found to be higher than those found in the remainder of the dataset. Thus, while the apparent diurnal signal in photosynthetic parameters should be acknowledged, we argue that it does not drive the relationships we discern between these parameters and abiotic/biotic variables in the following analyses.
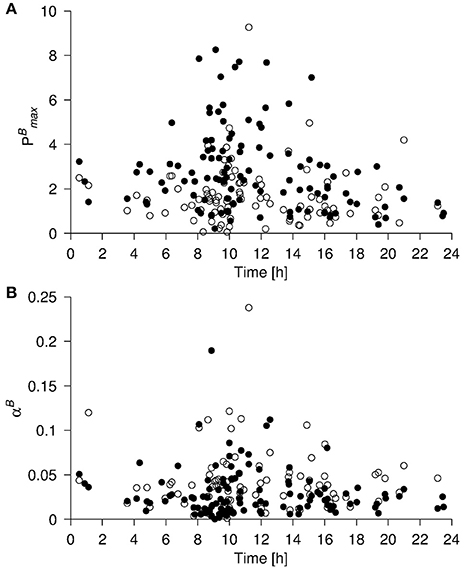
Figure 2. (A) and (B) αB from the upper 10 m (bullets) and the DCM (open circles) vs. the local time of the day. Data points originate from Galathea 3 and both Dana cruises. Units of (, αB) as in Figure 1.
Chlorophyll Determination
Samples from selected depths and filtered onto GFF to determine total sample chlorophyll (which could be used both in the analysis of fractionated chlorophyll and to calibrate the profiling fluorometer mounted on the rosette) and 10 μm filters, respectively. These were extracted in 96% ethanol and chlorophyll a fluorescence determined using a Turner fluorometer following the US EPA method 445.0 as suggested by Turner Designs.
Abundance and Biovolume—Micro and Nano-Phytoplankon
At 59 stations on the Galathea 3 cruise, samples (90 in all) for phytoplankton analysis were taken from Niskin bottles closed at the surface (5 or 10 m) and/or in the DCM. These were preserved in acidified Lugol's solution (approximately 2% final concentration) and stored in darkness at ~5°C until later analysis. Identification of organisms (> ~3 μm) was made using quantitative light microscopy following the protocol used in the Danish National Water and Nature Monitoring Program (Henriksen and Kaas, 2004) according to Utermöhl (1958). Axial dimensions were measured from a subset of each taxon and used to calculate cell biovolumes using appropriate geometric volume formulas. Analyses were carried out by Orbicon A/S (Århus Denmark).
Abundance and Biovolume—Pico-Phytoplankton
At the same stations where micro and nano-phytoplankton were determined on the Galathea cruise, pico-phytoplankton were also quantified. Water from the CTD was stored in darkness and cool until sampling could be performed (within 30 min after collection). Samples of 4 ml were preserved in filter-sterilized glutaraldehyde to a final concentration of 2% and stored darkness at 4°C. Pico-phytoplankton abundance was determined by flow cytometry (FACS Calibur, Becton Dickinson) within 2 days of sampling. The flow rate of samples through the FACS Calibur was determined using BD Biosciences TruecountTM tubes. The gatings for Prochlorococcus and Synechococcus, and pico-phytoplankton were defined using cultures of Prochlorococcus, Synechococcus and picophytoplankton (Phaeocystis spp., Rhodomonas spp., Emiliana huxleyi, Pycnococcus spp., Pelagococcus subviridis, Pelagococcus spp.), and were verified onboard by comparison with microscopy counts. XY plots were used with data from forward scatter, side scatter and fluorescence signals. Several plots in different combination were used for Prochlorococcus, Synechococcus, and pico-phytoplankton, to ensure that there was no overlapping gating for any of the gating groups.
The sizes of the pico-phytoplankton (Prochlorococcus, Synechococcus and eukaryotic pico-phytoplankton) were estimated in all samples from forward scatter and calibrated against 8 cultures of Prochlorococcus, Synechococcus and eukaryotic picophytoplankton (Micromonas pusilla strains K-0024 and K-0023, Nannochloropsis oculata, Thalassiosira pseudonana) representing a cell diameter range from 0.6 to 3.1 μm.
Chlorophyll a Content of Dominant Phytoplankton Groups
The combined datasets on biovolume of nano + micro- and pico-phytoplankton were assumed to represent the majority of the phytoplankton community in each sample. Different taxa were then grouped together based on their taxonomy and size and their greatest axial linear dimension (GALD). Thus, in the nano + micro-phytoplankton data set, taxa were grouped as ciliates, diatoms <50 μm, diatoms > 50 μm, dinoflagellates <50 μm, dinoflagellates > 50 μm and green nanoflagellates. In the picophytoplankton data, set all taxa were small and we only differentiated between taxa; i.e., the cyanobacteria, Prochlorococcus and Synecococcus, and the pico-eukaryotes. Assuming that cell volume is linearly related to chlorophyll a content (see Marañón et al., 2007), we calculated the chlorophyll content of each group in each sample by multiplying the chlorophyll a concentration by the relative contribution that each group contributed to the total biovolume.
Size Dependence of Photosynthetic Parameters
A simple model was developed on the basis of 142 samples taken at the 86 stations where fractionated chlorophyll had been determined to test for size-dependence of the photosynthetic parameters, αB and . The model considered two discrete size classes representing small (i.e., chlorophyll containing organisms passing through a 10 μm filter) and large cells, respectively. Their respective fractions, i.e., f(small) and f(large), were defined from the observed concentration of chlorophyll a associated with the two size classes: [0.7–10 μm] and [> 10 μm]. Thus, the two fractions were related as:
Each size class was assumed to be characterized by a photosynthetic parameter given by φ(small) or φ(large) where φ represented the photosynthetic parameter, i.e., αB or . The bulk photosynthetic parameter of the sample was then determined from:
Best fit values of the two free parameters φ(small) and φ(large) were then found by minimizing the residual defined by:
where φ(obs) represented the photosynthetic parameters obtained from the incubations described above and the summation included all observations. Finally, a normalized residual (Rnorm) was calculated by scaling R with the residual from the best fit solution (Rmin):
Best fit values for αB and were searched for in the intervals [0:0.15] and [0:5], respectively.
Statistics
All statistical analyses were performed in the open source statistical software, R (R Core Team, 2016). In addition to the core software, we used the R-package “vegan” (Oksanen et al., 2016).
Patterns in the distribution of the dominant phytoplankton groups in relation to , αB and the environmental variables (temperature, depth, nitrate, phosphate and silicate) were investigated by performing a non-metric multidimensional scaling analysis (Legendre and Legendre, 2012) on the distribution of the group specific chlorophyll a content. The underlying dissimilarity matrix was calculated using the Bray-Curtis dissimilarity index and the analysis was run multiple times to avoid getting trapped in a local optimum. When the global optimum had been estimated, we projected the distribution of and αB into the ordination space using thin plate regression splines (Wood, 2003). In addition, the environmental variables were fitted as linear vectors indicating the direction of the association between the community composition and changes in the environment.
As our data suggested an effect of both temperature and depth of sampling, we split the data set into four groups: Group 1: depth > 10 m and temperatures ≥ 15°C; Group 2: depth <10 m and temperatures ≥ 15°C; Group 3: depth > 10 m and temperatures ≤ 15°C and; Group 3: depth ≤ 10 m and temperatures ≤ 15°C. We then calculated the median values of all the variables measured and assessed if the values in each group could be considered to come from the same distribution using a Kruskal-Wallis rank sum test.
Results
Relationship between Photosynthetic Parameters and Environmental Variables
Both and αB are seen in the dataset to vary in relation to temperature, the depth of sample collection (possibly a proxy for light availability), ambient inorganic nutrient (nitrate and phosphate) concentrations, and the size distribution of the phytoplankton community (fractionated chlorophyll) (Figures 3, 4A). Not all of the relationships appear to be linear and all of these variables correlate to some degree with one another. Thus, it is not possible to ascertain cause and effect in these relationships or to rank these variables in order of their potential importance in terms of controlling photosynthetic performance. Nevertheless, some generalizations can be made about the global distribution of when these relationships are considered together. From Figure 4B, the generalization can be made that the highest values of will be found in warm (>~15°C) surface waters. Although communities dominated by both large and small organisms can exhibit high , communities dominated by small organisms appear particularly likely in this data set to be associated with high . Relatively high can be recorded down to ~100 m. Furthermore, exhibits a negative relationship with the inorganic nutrient concentrations (Figure 3C), where all of the highest values of were recorded in waters where the ambient concentration of nitrate was <5 μmol kg−1.
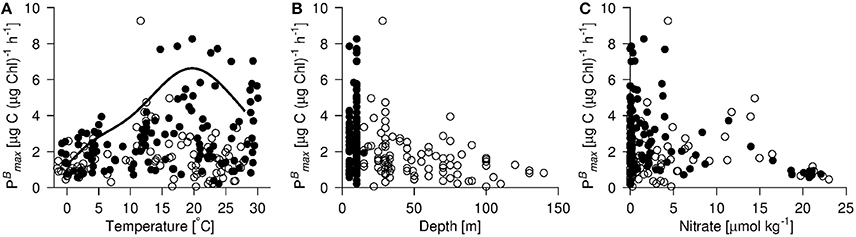
Figure 3. (A) vs. sea surface temperature, (B) in situ depth of sampling and (C) in situ nitrate concentration at sampling depth. varied qualitatively similarly to phosphate as to nitrate (data not shown). The parameterisation of (= when photosynthesis is light saturated) as applied in the VGPM-model (Behrenfeld and Falkowski, 1997b) is shown in (A) (solid line). Values are shown from the upper 10 m (bullets) and the DCM (open circles). Data points originate from Galathea 3 and both Dana cruises. Units of as in Figure 1.
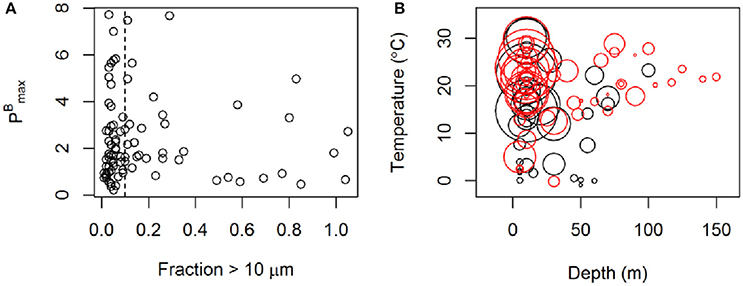
Figure 4. (A) vs. the fraction of small phytoplankton (i.e., proportion of total chlorophyll passing through a 10 μm filter). (B) vs. depth of the sample and temperature. The size of the rings represents the value of and the color represents the size distribution. Red color shows samples where more than 90% of the chlorophyll originated from phytoplankton smaller than 10 μm. Data originate from Galathea 3 and the Dana cruise in 2008. Units of as in Figure 1.
Patterns associated with the distribution of αB (Figures 5, 6) are less clear. Also this photosynthetic parameter can be related to temperature (bell-shaped curve), the depth of sample collection and nutrient availability. Although the highest values of αB were recorded in surface waters, the relationship between depth of sampling and value of αB is not as strong as is the case for . Alpha was most clearly related to the size structure of the community with the highest values recorded being associated with communities dominated by small phytoplankton. Thus, the overall patterns in the distribution of αB are less clear (Figure 6B) than those found for
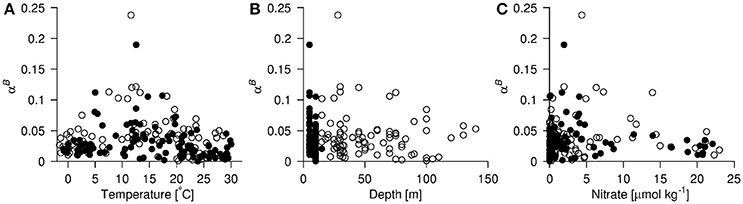
Figure 5. (A) αB vs. sea surface temperature, (B) in situ depth, and (C) in situ nitrate concentration. Values are shown from the upper 10 m (bullets) and the DCM (open circles). Data points originate from Galathea 3 and both Dana cruises. Units of αB as in Figure 1.
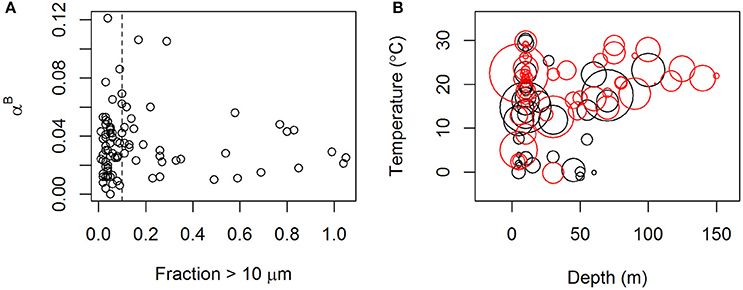
Figure 6. (A) αB vs. the fraction of small phytoplankton (i.e., proportion of total chlorophyll passing through a 10 μm filter). (B) αB vs. depth of the sample and temperature. The size of the rings represents the value of αB and the color represents the size distribution. Red color shows samples where more than 90% of the chlorophyll originated from phytoplankton smaller than 10 μm. Data originate from Galathea 3 and the Dana cruise in 2008. Units of αB as in Figure 1.
That the association with αB and the variables examined is weaker than for is confirmed when the median values for the two photosynthetic parameters and the variables shown to be associated with them are compared (Table 2). The median values of each of the parameters and variables at the depths of the DCM and in surface samples in warm (≥15°C) and cold (<15°C) waters are examined individually. In all cases, there is a significant difference between the values when the four environment types, i.e., warm and cold waters in surface and DCM, respectively, are compared. However, the level of significance when αB is compared in the four different environments is less (p = 0.016) than is the case for (p = 0.006).
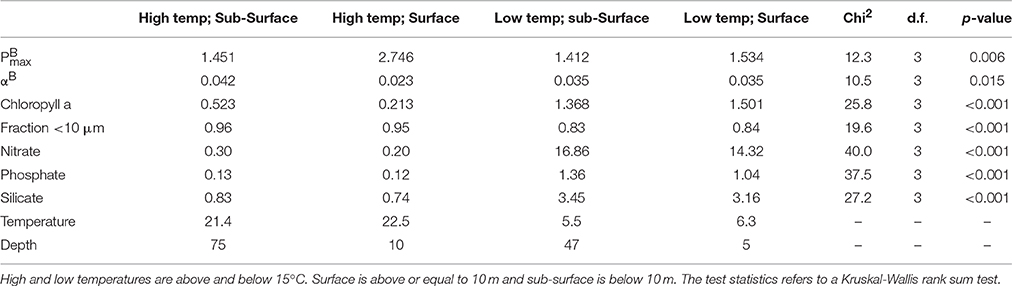
Table 2. Median values of all variables at different temperatures and depths.
Photosynthetic Parameters—Large and Small Cells
When the entire dataset was considered, best fit solutions were found for [αB(small) = 0.040, αB(large) = 0.025] and [(small) = 2.56, (large) = 1.53]. The resulting best fit solutions of the bulk photosynthetic parameters were then calculated to αB = 0.038 μg C (μg Chl a h)−1 (μmol photons)−1 m2 s and 2.38 μg C (μg Chl a h)−1, respectively (Figure 7). When data collected from surface and DCM samples were considered separately, the differences between photosynthetic performance of the large and small cells were even more pronounced (Table 3). In the depth separated analysis, (small) was calculated to be nearly twice as high in surface (≤ 10 m) waters than in deeper waters while (large) was lower in surface than in deeper waters. For both size groups, αB increased with depth, as would be expected in response to adaptation of the photosynthetic apparatus to low light (Richardson et al., 1983).
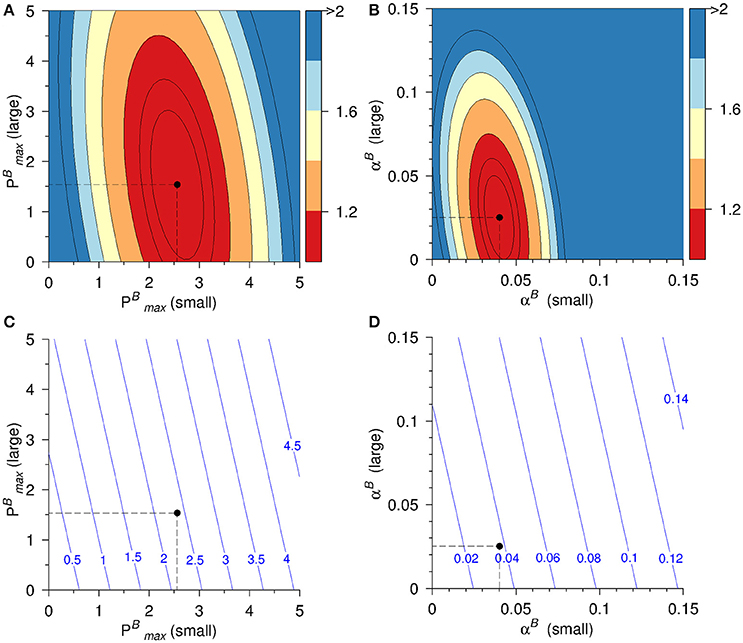
Figure 7. Residual (Rnorm) of model solution for (A) and (B) αB and the corresponding model derived bulk photosynthetic parameters of (C) and (D) αB. Best fit solutions are indicated by dashed lines and bullets. The models have been fitted using data from Galathea 3 and the Dana cruise in 2008. Units of (, αB) as in Figure 1.
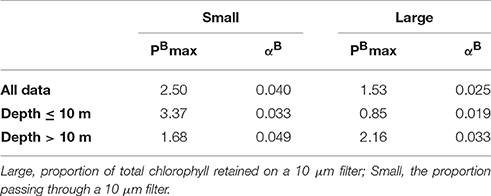
Table 3. Modeled best fit values for photosynthetic parameters for the large and small components of the phytoplankton community.
Community Taxonomic Structure and Photosynthetic Parameters
Results of the NMDS ordinations relating the dominant (by biovolume) phytoplankton group in the community to the measured photosynthetic parameters of the total community are shown in Figure 8 () and 9 (αB). The highest determinations were associated with communities dominated by dinoflagellates, small (<10 μm) unidentified flagellates, Synecococcus and pico-eucaryotes. Of the large phytoplankton, only dinoflagellate dominated communities in warm water are associated with high . The large dinoflagellate dominated communities also are associated with the highest values of αB recorded (Figure 9).
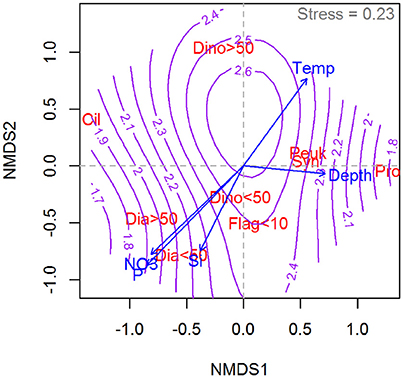
Figure 8. Non-parametric multidimensional scaling (NMDS) ordination plot showing the relative distribution of the chlorophyll of dominant phytoplankton groups in relation to the distribution of (purple contour lines) as well as temperature, depth, and macronutrients (blue arrows). Phytoplantkon group abbreviations: Cil, Mixotrophic ciliates; Dia <50, Diatoms <50 μm; Dia > 50, Diatoms > 50 μm; Dino <50, Dinoflagellates <50 μm; Dino > 50, Dinoflagellates > 50 μm; Flag <10, Green nanoflagellates <10 μm; Peuk, Picoeukariots; Pro, Prochlorococcus; Syn, Synecococcus. Units of as in Figure 1. The NMDS is based on a subset of 90 samples from the Galathea 3 Expedition, i.e., where both taxonomic data and photosynthetic parameters were collected.
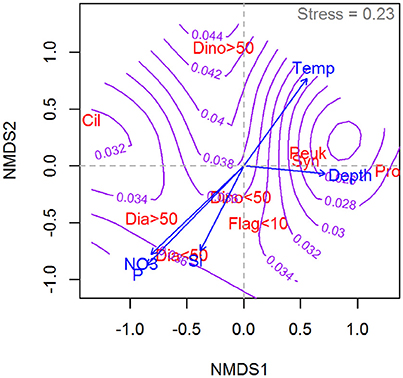
Figure 9. Non-parametric multidimensional scaling (NMDS) ordination plot showing the relative distribution of the chlorophyll of dominant phytoplankton groups in relation to the distribution of αB (purple contour lines) as well as temperature, depth and macronutrients (blue arrows). Phytoplantkon group abbreviations: Cil, Mixotrophic ciliates; Dia <50, Diatoms <50 μm; Dia > 50, Diatoms > 50 μm; Dino <50, Dinoflagellates <50 μm; Dino > 50, Dinoflagellates > 50 μm; Flag <10, Green nanoflagellates <10 μm; Peuk, Picoeukariots; Pro, Prochlorococcus; Syn, Synecococcus. Units of αB as in Figure 1. The NMDS is based on a subset of 90 samples from the Galathea 3 Expedition where both taxonomic data and photosynthetic parameters were collected.
Large and small diatom dominated communities occupy similar positions (intermediate both with respect to and αB) in the NMDS ordinations of both photosynthetic parameters. Diatom dominated communities are associated with colder waters and high inorganic nutrient concentrations. The “ciliates” recorded in the NMDS ordinations are primarily comprised by Mesodinium rubrum. These are associated in this dataset with relatively warm waters and again, exhibit intermediate values for both of the photosynthetic parameters examined. Prochlorococcus is associated with deep waters and with low values for both photosynthetic parameters. This genus dominated in samples taken in the Sargasso Sea where the DCM is found at depths >100 m and this likely explains the placement of this genus in the ordinations.
Discussion
As background for this study, we surveyed the literature for reports of determined on natural phytoplankton communities (Table 1). All of the studies found in the survey described conditions in a limited geographic region. A number of the studies found had identified specific abiotic and/or biotic variables as being correlated with photosynthetic performance and we examine here all of the variables identified in these studies as potentially being related to photosynthetic characteristics (i.e., light, temperature, ambient nutrient concentration, size structure of the phytoplankton community and taxonomic group) in relation to characteristics of the P vs. E curves constructed from incubations of samples from the surface and the deep chlorophyll maximum in samples collected from nearly all major ocean basins. Although the northern Pacific is not represented in our dataset, the literature survey includes reports of many studies carried out in the Pacific. On the basis of those reports, we see no reason to suspect that the general patterns in the distribution of photosynthetic characteristics demonstrated here would not also be applicable to phytoplankton in the Pacific.
While it would have been possible, for some of the environmental variables examined, to combine our observations with data for reported in the literature in an attempt to better constrain the relationship between and these variables, we refrained from doing so because comparisons (Richardson, 1991) of results obtained by different workers/protocols on similar samples have demonstrated considerable variability. By limiting our analysis to photosynthetic data we had collected ourselves using the same equipment and protocols, we could minimize the error introduced into the analyses from operator differences.
The range (up to ~8) we found in our determinations agrees well with reported for natural populations in the literature (Table 1). However, some studies report (usually a small number of) values that are considerably higher (up to >60). Further study is needed to ascertain whether these outliers actually represent regions of extreme efficiency in photosynthetic performance or data artifacts.
As noted in the introduction, one of the most commonly employed algorithms used to estimate water column primary production from remotely sensed surface ocean data is the VGPM model (Behrenfeld and Falkowski, 1997b). This model parameterizes photosynthetic performance as a function of sea surface temperature. We note that, while the VGMP estimates of the maximum rate of photosynthesis lie within the range of estimates reported in the literature, they lie at the upper end of the range of the values that we find (Figure 3A) and of the averages reported by other workers (Table 1). We have no basis upon which to argue which estimates of are the most “correct” but note simply the fact that the estimates used in VGPM appear to be on the high end of the range most often reported. Thus, there is the possibility that VGPM may be overestimating global ocean POC production.
Photosynthetic Performance in Relation to Abiotic Variables
Sea surface temperature (SST) is readily estimated from remotely sensed surface ocean characteristics. Therefore, photosynthetic performance is often parameterized in relation to SST. The analysis presented here indeed demonstrates a relationship between temperature and both and αB (Figures 3, 5). In the case of both parameters, vs. temperature, the relationships appear to be non-linear.
As noted earlier, the fact that photosynthetic parameters appear to relate to temperature does not necessarily imply a direct temperature effect on these parameters. and αB are also shown here to vary as a function of ambient nutrient concentration and depth of sampling. Both of these environmental variables can be predicted to vary as a function of temperature. Thus, all of these environmental variables are correlated, making cause, and effect in the relationships identified difficult to identify. It is interesting, however, to note that both photosynthetic parameters are, in our dataset negatively correlated with ambient nutrient concentration (Figures 3C, 5C), i.e., all of the highest values were recorded when nitrate concentrations were <5 μmol kg−1. This result contrasts with the findings of Palmer et al. (2013) who found the highest values of in environments with nitrate concentrations over 10 μmol kg−1 in a study of Arctic waters, thus raising the interesting question of a possible influence of an interaction between temperature and nutrient availability on photosynthetic parameters.
Photosynthetic Performance in Relation to Size Structure of the Phytoplankton Community
Size structure of the phytoplankton community also correlates with both temperature and ambient nutrient concentrations (Hilligsøe et al., 2011; Mousing et al., 2014) and both and αB are here shown to be clearly correlated with phytoplankton size structure, i.e., the relative proportion of total chlorophyll retained on a 10 μm filter (Figures 4, 6). Model fits describing median values of best fit values for photosynthetic parameters (Figure 7, Table 3) indicate that smaller organisms exhibit higher values of both and αB. Recent field studies (Strom et al., 2010; Morán and Scharek, 2015) have also reported higher for small than for large cells.
When the surface and DCM data are considered separately, the best fit model suggests a lower for large cells in the surface layer than at the DCM. While this result was not expected, earlier studies (From et al., 2014) suggest that photoinhibition may be more common in the surface layer than normally assumed. For both the large and small components of the phytoplankton community, αB increases with depth (Table 3). This result would be expected as a universal adaptation to low light is believed to be an increase in alpha (Richardson et al., 1983).
The model results show that the residuals are narrower in the direction of smaller cells than in the direction of large cells (Figures 7A,B) and this implies that both and αB are better constrained for small cell sizes. We can suggest two reasons for why this might be the case. Firstly, the size range of the “small” phytoplankton in this study is well defined as being those organisms not retained on a 10 μm filter. This, presumably, would mean organisms with an axial length of <10 μm. Within this size range, the morphological shape of organisms is usually relatively simple (round or oblong). The “large” organisms in this study would be all those retained on a 10 μm filter, i.e., no maximum size. The variety of morphological forms found in these larger organisms is, everything being equal, greater than for the smaller organisms. One possibility is that that this greater variety of cell forms in the larger phytoplankton might result in a greater variability in light absorption capability and thereby, photosynthetic parameters in the larger phytoplankton than in the smaller.
Photosynthetic Performance in Relation to Dominate Taxonomic Group
Phytoplankton size is also, at least to some degree, related to taxonomy. For the stations where we had taxonomic data, we, therefore, attempted to relate the dominant (by biovolume) taxonomic group to photosynthetic characteristics. Here, it should be noted that we have a relatively limited number of samples (90) with taxonomic data. Furthermore, the preservation method we used for phytoplankton samples (acidified Lugol fixation) would not preserve all phytoplankton groups (coccolithophorids are, for example, missing). Therefore, we cannot use the relationships we find here as being universal and diagnostic for the global ocean. Nevertheless, the NMDS ordinations (Figures 8, 9) relating dominant phytoplankton group and the two photosynthetic parameters reveal some interesting patterns that can be used to develop a more nuanced understanding of the general pattern of higher and αB being associated with the smaller phytoplankton.
With respect to (Figure 8), the ordination identifies high values to be associated with dinoflagellates of all sizes, flagellates, and in warmer waters, pico-eukaryotes and Synecococcus. We were surprised to find the dinoflagellates here, i.e., associated with a higher than diatoms, as earlier studies (e.g., Chan, 1980) have suggested that the two groups may perform similarly when their photosynthesis is compared on a per chlorophyll basis. A possible explanation for this finding is that dinoflagellates in our dataset often occur in communities with a relatively large proportion of pico-plankton. In such cases, the biovolume of a small number of large dinoflagellates could provide the dominate biovolume in the community, while the photosynthetic profile of the community is determined by the smaller organisms. Another possibility, of course, is that dinoflagellates under natural conditions may be more efficient photosynthesizers than usually assumed.
Prochlorococcus dominated communities show a relatively low in our dataset and are associated here with deep, warm waters. This fits well with the fact that we found them primarily in the DCM samples in the Sargasso Sea, where the DCM is located at >100 m. Diatom dominated communities were associated with cold waters and high nutrient concentrations and exhibited an intermediate .
The patterns emerging from the NMDS ordination for αB, are less clear than for (Figure 9). This, however, is not surprising given that the relationships between αB and environmental variables are shown here to be less clear than for . Also here, the highest values for αB were found to be associated with communities where large dinoflagellates dominated the biovolume. In the case of αB, diatom dominated communities appear to be characterized by relatively high values. Thus, a picture emerges of diatom dominated communities being well adapted to utilize low light levels but not among the most efficient in terms of . Such a photosynthetic strategy would make diatoms well adapted to the kinds of conditions where they are known to dominate (i.e., spring bloom in temperate waters).
As noted above, we do not mean to imply that the taxonomic patterns we find in relation to the data on photosynthetic parameters that we present here are diagnostic for the global ocean under all conditions. However, we do believe that the strong relationship we find in this study between phytoplankton community size structure and photosynthetic performance of the community, as well as the fact that nuances in this relationship can be discerned from study of the taxonomic composition of the community, to be of great potential interest in terms of improving the parameterization of photosynthetic potential when collection of physiological data is not possible, i.e., when estimating ocean primary production from remotely sensed surface data.
Estimation of both the size distribution of phytoplankton and to some extent, the taxonomic groupings represented in surface waters is possible using remote sensing techniques to quantify surface optical characteristics (e.g., Le Quere et al., 2005; Chust et al., 2013; Boyce et al., 2015; Cetinić et al., 2015). Thus, a prospective avenue to follow in the pursuit of a better parameterization of the photosynthetic potential of natural phytoplankton population could be to further explore the relationship between community size (and taxonomic) structure and photosynthetic performance.
Author Contributions
KR was responsible for all data collection except for picoplankton. KR, EM, and JB conceived the study. EM and JB carried out the analyses. KR wrote the manuscript with input from JB and EM. TK provided data on the picoplankton abundance and sizes.
Conflict of Interest Statement
The authors declare that the research was conducted in the absence of any commercial or financial relationships that could be construed as a potential conflict of interest.
Acknowledgments
The data collection for this study was carried out as part of the Galathea3 Expedition under the auspices of the Danish Expedition Foundation and was supported by the Villum Kann Rasmussen Foundation, the Nordea Foundation and the Danish Research Council for Nature and Universe. Analyses were supported by Danish National Science Foundation via its support of the Center for Macroecology, Evolution, and Climate (grant no. DNRF96). This is Galathea3 contribution No. P121.
Footnotes
1. ^In fact, Behrenfeld and Falkowski (1997b) use at photosynthesis parameter, which will be the equivalent of when sufficient light is available to support maximal rates of photosynthesis.
References
Aguirre-Hernández, E., Gaxiola-Castro, G., Nájera-Martínez, S., Baumgartner, T., Kahru, M., and Greg Mitchell, B. (2004). Phytoplankton absorption, photosynthetic parameters, and primary production off Baja California: summer and autumn 1998. Deep Sea Res. Part II 51, 799–816. doi: 10.1016/j.dsr2.2004.05.015
Behrenfeld, M. J., and Falkowski, P. G. (1997a). A consumer's guide to phytoplankton primary productivity models. Limnol. Oceanogr. 42, 1479–1491. doi: 10.4319/lo.1997.42.7.1479guirre
Behrenfeld, M. J., and Falkowski, P. G. (1997b). Photosynthetic rates derived from satellite-based chlorophyll concentration. Limnol. Oceanogr. 42, 1–20. doi: 10.4319/lo.1997.42.1.0001
Behrenfeld, M., Marañón, E., Siegel, D., and Hooker, S. (2002). Photoacclimation and nutrient-based model of light-saturated photosynthesis for quantifying oceanic primary production. Mar. Ecol. Prog. Ser. 228, 103–117. doi: 10.3354/meps228103
Bouman, H., Platt, T., Sathyendranath, S., and Stuart, V. (2005). Dependence of light-saturated photosynthesis on temperature and community structure. Deep Sea Research Part I 52, 1284–1299. doi: 10.1016/j.dsr.2005.01.008
Boyce, D. G., Frank, K. T., and Leggett, W. C. (2015). From mice to elephants: overturning the “one size fits all” paradigm in marine plankton food chains. Ecol. Lett. 18, 504–515. doi: 10.1111/ele.12434
Campbell, J., Antoine, D., Armstrong, R., Arrigo, K., Balch, W., Barber, R., et al. (2002). Comparison of algorithms for estimating ocean primary production from surface chlorophyll, temperature, and irradiance. Glob. Biogeochem. Cycles 16, 9–1–9–15. doi: 10.1029/2001GB001444
Carr, M., Friedrichs, M. A. M., Schmeltz, M., Aita, M. N., Antoine, D., Arrigo, K. R., et al. (2006). A comparison of global estimates of marine primary production from ocean color. Deep Sea Research Part II, 53, 741–770. doi: 10.1016/j.dsr2.2006.01.028
Cetinić, I., Perry, M. J., D'Asaro, E., Briggs, N., Poulton, N., Sieracki, M. E., et al. (2015). A simple optical index shows spatial and temporal heterogeneity in phytoplankton community composition during the 2008 North Atlantic Bloom Experiment. Biogeosciences 12, 2179–2194. doi: 10.5194/bg-12-2179-2015
Chan, A. T. (1980). Comparative physiological study of marine diatoms and dinoflagellates in relation to irradiance and cell size. II. Relationship between photosynthesis, growth and carbon/chlorophyll a ratio. J. Phycol. 16, 428–432. doi: 10.1111/j.1529-8817.1980.tb03056.x
Chust, G., Irigoien, X., Chave, J., and Harris, R. P. (2013). Latitudinal phytoplankton distribution and the neutral theory of biodiversity. Glob. Ecol. Biogeogr. 22, 531–543. doi: 10.1111/geb.12016
Claustre, H., Babin, M., Merien, D., Ras, J., Prieur, L., Dallot, S., et al. (2005). Toward a taxon-specific parameterization of bio-optical models of primary production: a case study in the North Atlantic. J. Geophys. Res. 110:C07S12. doi: 10.1029/2004JC002634
Erga, S., and Skjoldal, H. (1990). Diel variations in photosynthetic activity of summer phytoplankton in Lindaspollene, western Norway. Mar. Ecol. Prog. Ser. 65, 73–85. doi: 10.3354/meps065073
From, N., Richardson, K., Mousing, E. A., and Jensen, P. E. (2014). Removing the light history signal from normalized variable fluorescence (Fv/Fm) measurements on marine phytoplankton. Limnol. Oceanogr. 12, 776–783. doi: 10.4319/lom.2014.12.776
Hameedi, M. (1977). Changes in specific photosynthetic rate of oceanic phytoplankton from the northeast Pacific Ocean. Helgoländer Wissenschaftliche Meeresuntersuchungen 30, 62–75. doi: 10.1007/BF02207825
Harrison, W., and Platt, T. (1986). Photosynthesis-irradiance relationships in polar and temperate phytoplankton populations. Polar Biol. 5, 153–164. doi: 10.1007/BF00441695
Henriksen, P., and Kaas, H. (2004). “Fytoplankton artssammensætning, antal, biovolumen og kulstofbiomass,” in Tekniske Anvisninger for Marin Overvågning, eds J. Andersen, S. Markager, and G. Ærtebjerg, (Danmarks: Miljøundersøgelser), 1–37.
Henríquez, L., Daneri, G., Mu-oz, C., Montero, P., Veas, R., and Palma, A. (2007). Primary production and phytoplanktonic biomass in shallow marine environments of central Chile: effect of coastal geomorphology. Estuar. Coast. Shelf Sci. 73, 137–147. doi: 10.1016/j.ecss.2006.12.013
Hilligsøe, K. M., Richardson, K., Bendtsen, J., Sørensen, L.-L., Nielsen, T. G., and Lyngsgaard, M. M. (2011). Linking phytoplankton community size composition with temperature, plankton food web structure and Sea–air CO2 Flux. Deep Sea Research Part I, 58, 826–838. doi: 10.1016/j.dsr.2011.06.004
Huot, Y., Babin, M., Bruyant, F., Grob, C., Twardowski, M., and Claustre, H. (2007). Relationship between photosynthetic parameters and different proxies of phytoplankton biomass in the subtropical ocean. Biogeosciences 4, 853–868. doi: 10.5194/bg-4-853-2007
Kocum, E., Underwood, G., and Nedwell, D. (2002). Simultaneous measurement of phytoplanktonic primary production, nutrient and light availability along a turbid, eutrophic UK east coast estuary (the Colne Estuary). Mar. Ecol. Prog. Ser. 231, 1–12. doi: 10.3354/meps231001
Le Quere, C., Harrison, S., Colin Prentice, I., Buitenhuis, E., Aumont, O., Bopp, L., et al. (2005). Ecosystem dynamics based on plankton functional types for global ocean biogeochemistry models. Glob. Chang. Biol. 11, 2016–2040. doi: 10.1111/j.1365-2486.2005.1004.x
Lindley, S., Bidigare, R., and Barber, R. (1995). Phytoplankton photosynthesis parameters along 140°W in the equatorial Pacific. Deep Sea Res. Part II 42, 441–463. doi: 10.1016/0967-0645(95)00029-P
Lorenzo, L., Arbones, B., Figueiras, F., Tilstone, G., and Figueroa, F. (2002). Photosynthesis, primary production and phytoplankton growth rates in Gerlache and Bransfield Straits during Austral summer: cruise FRUELA 95. Deep Sea Res. Part II 49, 707–721. doi: 10.1016/S0967-0645(01)00120-5
Lorenzo, L., Figueiras, F., Tilstone, G., Arbones, B., and Mirón, I. (2004). Photosynthesis and light regime in the Azores Front region during summer: are light-saturated computations of primary production sufficient? Deep Sea Res. Part I 51, 1229–1244. doi: 10.1016/j.dsr.2004.01.010
Lyngsgaard, M., Richardson, K., Markager, S., Nielsen, M., Olesen, M., and Christensen, J. (2014). Deep primary production in coastal pelagic systems: importance for ecosystem functioning. Mar. Ecol. Prog. Ser. 517, 15–33. doi: 10.3354/meps11015
MacCaull, W., and Platt, T. (1977). Diel variations in the photosynthetic parameters of coastal marine phytoplankton. Limnol. Oceanogr. 22, 723–731. doi: 10.4319/lo.1977.22.4.0723
Marañón, E., Cermeño, P., Rodríguez, J., Zubkov, M. V., and Harris, R. P. (2007). Scaling of phytoplankton photosynthesis and cell size in the ocean. Limnol. Oceanogr. 52, 2190–2198. doi: 10.4319/lo.2007.52.5.2190
Marañón, E., and Holligan, P. M. (1999). Photosynthetic parameters of phytoplankton from 50°N to 50°S in the Atlantic Ocean. Mar. Ecol. Prog. Ser. 176, 191–203. doi: 10.3354/meps176191
Morán, X. A. G., and Scharek, R. (2015). Photosynthetic parameters and primary production, with focus on large phytoplankton, in a temperate mid-shelf ecosystem. Estuaries Coast. Shelf Sci. 154, 255–263. doi: 10.1016/j.ecss.2014.12.047
Mousing, E. A., Ellegaard, M., and Richardson, K. (2014). Global patterns in phytoplankton community size structure—evidence for a direct temperature effect. Mar. Ecol. Prog. Ser. 497, 25–38. doi: 10.3354/meps10583
Oksanen, J., Blanchet, F. G., Kindt, R., Legendre, P., Minchin, P. R., O'Hara, R. B., et al. (2016). Vegan: Community Ecology Package. Avaliable online at: http://CRAN.R-project.org/package=vegan
Palmer, M., van Dijken, G., Mitchell, B., Seegers, B., Lowry, K., Mills, M., et al. (2013). Light and nutrient control of photosynthesis in natural phytoplankton populations from the Chukchi and Beaufort seas, Arctic Ocean. Limnol. Oceanogr. 58, 2185–2205. doi: 10.4319/lo.2013.58.6.2185
Prezelin, B., Putt, M., and Glover, H. (1986). Diurnal patterns in photosynthetic capacity and depth-dependent photosynthesis-irradiance relationships in Synechococcus spp. and larger phytoplankton in three water masses in the Northwest Atlantic Ocean. Mar. Biol. 91, 205–217. doi: 10.1007/BF00569436
R Core Team (2016). R: A Language and Environment for Statistical Computing. Vienna: R Foundation for Statistical Computing. Avaliable online: http://www.R-project.org/
Rey, F. (1991). Photosynthesis-irradiance relationships in natural phytoplankton populations of the Barents Sea. Polar Res. 10, 105–116. doi: 10.1111/j.1751-8369.1991.tb00638.x
Richardson, K. (1991). Comparison of 14C primary production determinations made by different laboratories. Mar. Ecol. Prog. Ser. 72, 189–201. doi: 10.3354/meps072189
Richardson, K., Beardall, J., and Raven, J. A. (1983). Adaptation of unicellular algae to irradiance: an analysis of strategies. New Phytol. 93, 157–191. doi: 10.1111/j.1469-8137.1983.tb03422.x
Saggiomo, V., Catalano, G., Mangoni, O., Budillon, G., and Carrada, G. (2002). Primary production processes in ice-free waters of the Ross Sea (Antarctica) during the austral summer 1996. Deep Sea Res. Part II 49, 1787–1801. doi: 10.1016/S0967-0645(02)00012-7
Savidge, G. (1979). Photosynthetic characteristics of marine phytoplankton from contrasting physical environments. Mar. Biol. 53, 1–12. doi: 10.1007/BF00386523
Segschneider, J., and Bendtsen, J. (2013). Temperature.dependent remineralization in a warming ocean increases surface pCO2 through changes in marine ecosystem composition. Glob. Biogeochem. Cycles 27, 1–12. doi: 10.1002/2013GB004684
Sigman, D. M., and Boyle, E. A. (2000). Glacial/Interglacial variations in atmospheric carbon dioxide. Nature 407, 859–869. doi: 10.1038/35038000
Steemann Nielsen, E. (1951). Measurement of the production of organic matter in the sea by means of carbon-14. Nature 167, 684–685. doi: 10.1038/167684b0
Steffen, W., Richardson, K., Rockström, J., Cornell, S. E., Fetzer, I., Bennett, E. M., et al. (2015). Planetary boundaries: guiding human development on a changing planet. Science, 347, 1259855–1259855. doi: 10.1126/science.1259855
Strom, S., Macri, E., and Fredrickson, K. (2010). Light limitation of summer primary production in the coastal Gulf of Alaska: physiological and environmental causes. Mar. Ecol. Prog. Ser. 402, 45–57. doi: 10.3354/meps08456
Talaber, I., Francé, J., and Mozetič, P. (2014). How phytoplankton physiology and community structure adjust to physical forcing in a coastal ecosystem (northern Adriatic Sea). Phycologia 53, 74–85. doi: 10.2216/13-196.1
Thomas, W. (1970). On nitrogen deficiency in tropical pacific oceanic phytoplankton: photosynthetic parameters in poor and rich water. Limnol. Oceanogr. 15, 380–385. doi: 10.4319/lo.1970.15.3.0380
Utermöhl, H. (1958). Zur Vervollkommnung der quantitativen Phytoplanktonmethodik. Mitt. Int. Ver. Theor. Angew. Limnol. 9, 1–38.
Wood, S. N. (2003). Thin plate regression splines. J. R. Stat. Soc. B Stat. Method. 65, 95–114. doi: 10.1111/1467-9868.00374
Keywords: photosynthesis, photosynthetic parameters, global ocean, pico-phytoplankton, Pmax, alpha
Citation: Richardson K, Bendtsen J, Kragh T and Mousing EA (2016) Constraining the Distribution of Photosynthetic Parameters in the Global Ocean. Front. Mar. Sci. 3:269. doi: 10.3389/fmars.2016.00269
Received: 02 August 2016; Accepted: 05 December 2016;
Published: 22 December 2016.
Edited by:
Xabier Irigoien, King Abdullah University of Science and Technology, Saudi ArabiaReviewed by:
Kyle Edwards, University of Hawaii at Manoa, USAChristian Lindemann, University of Bergen, Norway
Copyright © 2016 Richardson, Bendtsen, Kragh and Mousing. This is an open-access article distributed under the terms of the Creative Commons Attribution License (CC BY). The use, distribution or reproduction in other forums is permitted, provided the original author(s) or licensor are credited and that the original publication in this journal is cited, in accordance with accepted academic practice. No use, distribution or reproduction is permitted which does not comply with these terms.
*Correspondence: Katherine Richardson, a2FyaUBzY2llbmNlLmt1LmRr