 Anastasia Tsiola1*
 Tatiana M. Tsagaraki1†
 Antonia Giannakourou2
 Nikolaos Nikolioudakis3†
 Nebil Yücel4
 Barak Herut5
 Paraskevi Pitta1
- 1Institute of Oceanography, Hellenic Centre for Marine Research, Heraklion, Greece
- 2Institute of Oceanography, Hellenic Centre for Marine Research, Anavyssos, Greece
- 3Institute of Marine Biological Resources and Inland Waters, Hellenic Centre for Marine Research, Heraklion, Greece
- 4Faculty of Marine Sciences and Technology, Iskenderun Technical University, Iskenderun, Hatay, Turkey
- 5Israel Oceanographic and Limnological Research Tel Shikmona, Haifa, Israel
The impact of viral lysis and grazing by flagellates on bacterioplankton production was assessed during a mesocosm experiment in the Eastern Mediterranean Sea, in response to Saharan dust (SD) vs. mixed aerosols (A) addition. The results highlight a positive effect on bacterial abundance, production and growth rate (~1.2, ~2.4, and ~1.9 –fold higher than the controls) in both SD and A, which was also confirmed by the increased portion of high DNA content bacteria (up to 48% of the bacterial community). Lytic viral production and the portion of bacterial production lost due to viral lysis were lower in SD and A after dust addition than in the controls (0.33 ± 0.17 × 10⁶ virus-like particles mL−1 h−1 and 6 ± 4%, respectively). Potential ingestion rate of bacteria by flagellates increased upon dust enrichment, but did not differ between mesocosms. Larger predators possibly down regulated flagellate abundance, and the calculated portion of bacterial production lost due to flagellate grazing was probably an artifact. Higher frequency of lysogenic cells in A compared to SD and the controls four days after dust addition may reflect faster phosphorus limitation in A, due to receiving less dissolved inorganic phosphorus and more dissolved inorganic nitrogen than SD.
Introduction
The Eastern Mediterranean Sea (EMS) is characterized by ultra—oligotrophic conditions, with low nutrient concentrations in surface layers (Krom et al., 1991) and low primary productivity and phytoplankton biomass (Siokou-Frangou et al., 2010). During the stratified period, EMS surface waters become nutrient-depleted. The high fluxes of atmospheric deposition during that period introduce material of Saharan desert and southern European origin into the marine system (Volpe et al., 2009). Aeolian dust events blow from the Saharan desert, frequently in the form of storms in spring and autumn, and as a consequence nutrients are leached from the dust particles (Carbo et al., 2005; Herut et al., 2005). The EMS is also constantly exposed to more polluted aerosols that are influenced by domestic and industrial activities (Lelieveld et al., 2016) and usually leach higher amounts of nitrate relative to phosphorus when compared to desert dust (Herut et al., 2002; Bonnet et al., 2005). Atmospheric chemical processes, such as acidification, are mainly driven by human processes and air pollution (Seinfeld and Pandis, 1998) and significantly affect the final amount and chemical properties of the leaching procedure (Shi et al., 2015).
Research up to now has showed that bacteria are expected to quickly respond and grow during dust events (Herut et al., 2005; Guieu et al., 2014). A trigger of primary productivity was found across the Mediterranean in naturally occurring Saharan dust events and microcosm dust-addition experiments (Ternon et al., 2011). Heterotrophic metabolic rates also increased during a dust-addition mesocosm experiment in the northwestern basin (Pulido-Villena et al., 2014). In the same region, phosphorus released by dust was found to be one of the drivers of the bacterial community after dust addition (Laghdass et al., 2011). The response of the planktonic community to dust events largely depends on the solubility and elemental composition of aerosols and the degree of oligotrophy of the system at the time of deposition (Marañón et al., 2010), but is not necessarily linearly related to the intensity of the dust depositions.
Bacterioplankton standing stock is controlled by nutrient supply and the constant action of protists (mainly heterotrophic flagellates) and viruses (Thingstad, 2000) that leads to large biomass losses on a daily basis (Fuhrman and Noble, 1995). Acting simultaneously, grazers and viruses control the proportion of active and non-active bacteria, and, theoretically, the total bacterial abundance is mainly controlled by grazing, while the abundance of specific groups by viral lysis (Thingstad, 2000). Under certain circumstances one loss factor dominates over the other, but there is no general trend in this relationship, and it is difficult to separate them, both experimentally and conceptually. The proportion of viral lysis and grazing may vary even within hours (Winter et al., 2004), while grazing may have a negative effect on viral production due to preferential ingestion of lytically infected cells (Weinbauer and Peduzzi, 1994) or a positive effect on viral abundance due to induction of prophages or stimulation of new infections (Bonilla-Findji et al., 2009).
There is evidence that viruses-mediated bacterial mortality increases with the productivity of the environment (Weinbauer et al., 2003b) and it has been proposed that protistan grazing is the principal cause of bacterial mortality in highly oligotrophic systems (Pernthaler, 2005 and references therein). This proposition has been recently confirmed in the Northeastern Atlantic Ocean (Vaqué et al., 2014), and specific findings for the Northwestern Mediterranean Sea revealed that indeed grazing by heterotrophic flagellates dominated bacterial losses whereas losses due to viral lysis were more variable (Bettarel et al., 2002). The trophic status of a system was also found to drive the occurrence of lysogeny, which was prevalent under low inorganic nitrogen and phosphorus concentrations (Williamson et al., 2002) and under low bacterial abundance and productivity (Weinbauer et al., 2003a).
Bacterial abundance seems to be critical when trying to predict mortality by grazers and viruses. Based on a Lotka-Volterra type of mathematical model, Thingstad (2000) proposed that at high bacterial densities the contact probabilities between viruses and bacteria are increased, thus viral infection and lysis is more frequent. The same result is expected for the contact rates between protists and bacteria (Vaqué et al., 1994).
When dust events occur in the oligotrophic EMS, the proportion of bacterial losses due to grazing and viral lysis could be an indication of organic matter and nutrient cycling in the food web (channeled up or remineralized, respectively) with implications on total system's productivity. In this study we aimed to assess how bacterioplankton growth is affected by (1) dust of different origins and (2) the simultaneous impact of grazing by heterotrophic flagellates and viral lysis. For this reason, we performed viral production experiments and we applied a grazing model to predict ingestion rate of bacteria by flagellates, in order to estimate bacterial production losses after Saharan dust vs. mixed aerosols addition, simulating realistic storm events, during a mesocosm experiment in the EMS (Cretan Sea). We hypothesized that dust of either origin will have a positive effect on bacterial production and biomass. Based on this hypothesis, we tested whether bacterial losses would increase upon dust enrichment, as a consequence of their increased productivity.
Materials and Methods
Experimental Setup
Seawater was collected from a site 5 nautical miles north of Heraklion port in the Cretan Sea (35° 24.975N, 25° 14.441E), transported to the CRETACOSMOS mesocosm facilities of the Hellenic Centre for Marine Research (HCMR) and then used to fill 9 food grade polyethylene mesocosm bags to a final volume of 3 m3. The seawater was pumped on the 8 and 9th May 2012 from 10 m depth into 1 m3 high density polypropylene containers which had been washed with acid (10% HCl) and rinsed with deionized water three times prior to filling. Within 2 h from collection, the seawater had been transported to HCMR and distributed evenly to the mesocosm bags by gravity siphoning with acid cleaned and deionized water rinsed plastic tubes. The bags were deployed in a large concrete tank (350 m3) and incubated at in situ temperature, which was kept constant by a continuous flow system and was measured with HOBO data loggers (ONSET Corporation). An airlift system ensured a gentle mixing of the water column within the mesocosms to avoid stratification. A Plexiglas lid was used to protect mesocosms from atmospheric deposition and a mesh screen was also used to mimic the light conditions at the sampling depth.
Prior to any addition, a sampling was carried out on 10th May 2012 (T-1) in order to determine the initial conditions of several biotic and abiotic parameters (Herut et al., 2016, this SI; Tsagaraki et al., 2016). Immediately after T-1, three mesocosms were enriched with Saharan dust collected in Crete and Israel at a final concentration of 1.6 mg L−1 (treatment abbreviation hereafter: SD). Another three mesocosms were enriched with aerosol consisting of a mixture of Saharan desert dust and particles of European origin, also collected in Crete and Israel, at a final concentration of 1.0 mg L−1 (treatment abbreviation hereafter: A). The remaining three mesocosms served as control (abbreviation hereafter: C). The second sampling was performed 3 h after additions (T0), and then sampling was carried out daily for 8 days (T1–T8). Samples for the assessment of viral production rates (including lytic and lysogenic) were taken at T-1, T1, T4, and T8 from two control mesocosms (C1 and C2), two mesocosms enriched with Saharan dust (SD1 and SD2) and two mesocosms enriched with aerosol (A1 and A2). Samples from SD1 and SD2 at T-1 were lost during filtration.
Nutrients Released with Dust Addition
Leaching experiments were performed to estimate the amount of nutrients and trace metals released upon dust deposition. Results of these experiments are presented in Herut et al. (2016, this SI). Table 1 summarizes the concentration of dust added in A and SD mesocosms and the amount of phosphate, nitrate and nitrite leached after deposition. Briefly, a mixture of aerosol of Saharan desert and European origin was added in A at 1 mg L−1 final concentration, leading to the release of 3.0 nM phosphate and 54 nM NOx per mg of dust, representing a relatively intense dust storm event (Herut et al., 2005). In SD, aerosols of pure Saharan desert origin were added at 1.6 mg L−1 final concentration, leading to the release of 2.4 nM phosphate and 23 nM NOx per mg of dust that represented an intense dust storm event (Herut et al., 2005).
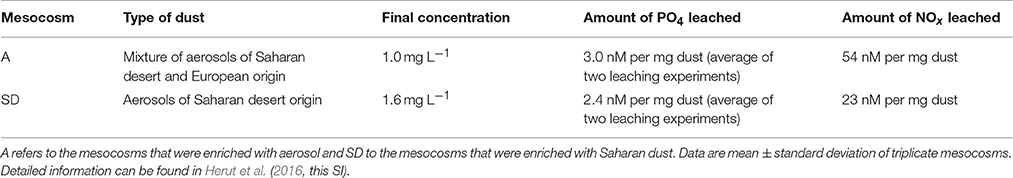
Table 1. Information regarding the dust added in the mesocosms; origin of dust, final concentration in the mesocosms, and the amounts of leached phosphate (PO4) and nitrogen forms (NOx) per mg of dust.
Dissolved Nutrients and Dissolved Organic Carbon
The concentrations of dissolved nutrients and organic carbon are presented in details in Tsagaraki et al. (2016, this SI). Samples were collected daily for the estimation of dissolved phosphate concentration, with the use of the MAGIC method (Rimmelin and Moutin, 2005). The concentrations of dissolved silicate, nitrate and nitrite were also estimated daily, according to Strickland and Parsons (1972). The concentration of dissolved ammonium was assessed according to Ivančič and Deggobis (1984). The detection limits for phosphate, nitrate and ammonium were 0.8 nM, 0.017 and 0.019 μM, respectively.
Dissolved organic carbon was measured according to Sohrin and Sempéré (2005). Samples were transferred into dark glass bottles (pre-combusted at 330°C for 6 h) and then filtered through GF/F filters (pre-combusted at 450°C for 6 h). The filtrate was collected in 15-mL glass vials (pre-combusted at 450°C for 6 h) and acidified with 20 μL H3PO4 (85%). Samples were stored in the dark at 4°C pending laboratory analysis by high-temperature combustion on a Shimadzu TOC 5000 analyzer. A four-point calibration curve was constructed daily using standards, which were prepared by diluting a stock solution of potassium hydrogen phthalate in Milli-Q water. To avoid random errors associated with day-to-day instrument variability, all samples from a given day were analyzed in a single day. The procedural blanks (i.e., runs with Milli-Q water) ranged from 1–2 μM C whereas the analytical precision of the analysis was within 2%. Operational blanks related to transfer and storage of samples, filtration, and handling were 8.4 ± 2.5 μMC (n = 7).
Chlorophyll a
Chlorophyll a concentration was determined fluorometrically, according to Yentsch and Menzel (1963), using a Turner TD-700 fluorometer. Samples were collected daily and sequentially filtered through 2, 0.6 and 0.2 μm polycarbonate filters in low vacuum pressure.
Abundance of Bacteria and Viruses
Samples for the determination of bacterial and virus-like particles (VLP) abundance were collected every day. Samples were fixed with 25% 0.2 μm-filtered glutaraldehyde (0.5% final concentration), incubated at 4°C for approximately 45 min, flash frozen in liquid nitrogen and then transferred to −80°C until analysis. Frozen samples were thawed at room temperature and sub-samples were stained for viral and bacterial enumeration, according to Brussaard (2004) and Marie et al. (1997), respectively. Heterotrophic bacteria were stained with SYBR Green I (final dilution 4 × 10⁻⁴ of the stock solution in Tris-EDTA buffer, pH = 8) and incubated for 10 min in the dark. Heterotrophic bacteria were distinguished based on their fluorescence signal. According to that, bacterial DNA content was pooled in two categories: high DNA content (HDNA) and low DNA content (LDNA) bacterial cells. Samples for autotrophic bacterial abundance were not fixed and analyzed without prior staining, based on their auto-fluorescence signals. VLP were stained with SYBR Green I (final dilution 5 × 10⁻⁵ of the stock solution in Tris-EDTA buffer, pH = 8) and incubated at 80°C for 10 min. Viral samples were diluted in Tris-EDTA buffer solution (1:80 or 1:100) prior to staining, in order to not exceed 1000 events second −1 during counting. A FACSCalibur™ (Becton Dickinson) instrument was used, equipped with an air-cooled laser at 488 nm and standard filter set-up. Flow cytometry data were acquired and processed with the Cell Quest Pro software (Becton Dickinson). For the high-speed performance of the machine an estimated average flow rate was used (58 μL min−1). Abundance of bacteria (cells mL−1) was converted to carbon biomass using the conversion factor 20 fg C cell−1 (Lee and Fuhrman, 1987).
Abundance of Heterotrophic Flagellates
Samples for heterotrophic flagellate (HF) counting were collected at T-1, T1, T4, and T8, fixed with glutaraldehyde (1% final concentration) and kept in the dark at 4°C. Flagellate cells were concentrated to approximately 10 mL, stained with 4′6-diamidino-2-phenylindole (DAPI at a final concentration of 1 μg mL−1) for 10 min, and finally collected on a 25-mm diameter, 0.8 μm pore-sized black polycarbonate filter (Porter and Feig, 1980). The filters were mounted on slides and stored at −20°C. Flagellates were counted at 1000x magnification, using UV excitation under an Olympus BX60 epifluorescence microscope. All cells were measured and divided into four categories (1–3, 3–5, 5–10, and >10 μm) using an ocular micrometer.
Bacterial Production and Bacterial Growth Rate
Bacterial production (BP) was measured using the [3H] leucine method, according to Kirchman et al. (1985) and modifications by Smith and Azam (1992). Two replicated seawater samples (1.5 mL) and one trichloracetic acid (TCA)-killed control were incubated in 2 mL-tubes with a mixture of [4,5-3H] leucine (Perkin Elmer, specific activity 115 Ci mmol−1) and nonradioactive leucine at final concentrations of 16 and 7 nM, respectively. All samples, including controls, were incubated for 2 h in the dark at in situ temperature, based on daily temperature measurements. Incubation was terminated with the addition of 90 μL of 100% TCA. Samples were then stored at 4°C in the dark until further processing. Centrifugation was carried out at 16000 g for 10 min. After discarding the supernatant, 1.5 mL of 5% TCA was added, samples were vigorously shaken using a vortex and then centrifuged again at the same speed. After discarding the supernatant, 1.5 mL of 80% ethanol was added, samples were shaken and centrifuged again. The supernatant was then discarded and 1.5 mL of scintillation liquid was added. The radioactivity incorporated into the pellet was counted using a Packard LS 1600 Liquid Scintillation Counter. BP was calculated according to Kirchman (1993) in ng L−1 h−1, from the 3H-leucine incorporation rates, according to the following formula:
where Leu = rate of leucine incorporation (mol L−1 h−1), 131.2 = formula weight of leucine, % leu = fraction of leucine in protein (0.073), C/protein = ratio of cellular carbon to protein (0.86), “hot” and “cold” = respective concentrations of labeled and unlabelled leucine and ID = the isotope dilution. A time-series experiment was carried out in order to show that the incorporation of leucine was linear with time. Two concentration kinetic experiments were also performed in order to verify that the concentration of leucine added (20 nM) was sufficient to saturate incorporation (range of concentrations 3 to 50 nM). The results of the concentration kinetics showed that the degree of participation of 20 nM used for the BP production measurements was always >90%, thus the isotopic dilution was negligible.
Bacterial growth rate was calculated by dividing the bacterial carbon production to bacterial biomass.
Methods to Estimate BP Losses Due to Viral Lysis
For the estimation of BP losses due to viral lysis, the viral reduction approach was used, as described in Weinbauer et al. (2003a) and modified by Winter et al. (2004) and Winget et al. (2005). Details can be found in Appendix 1.
The frequency of lytically infected cells (FLIC) was estimated from the incubations that did not receive mitomycin C, based on the formula:
where BS is the burst size, B0 is the bacterial abundance at the beginning of the incubations and VPlytic (expressed as VLP mL−1 h−1) refers to the lytic viral production and is calculated for the time intervals characterized by a net increase in viral abundance. Incubation lasted 24 h and sub-samples were taken at the beginning of the incubations and then after 1, 3, 6, 12, and 24 h. Hence,
where Boriginal is the bacterial abundance measured in the original mesocosm sample. The correction factor (Boriginal/B0) was applied in order to correct for bacterial losses during filtration (Winget et al., 2005).
The frequency of lysogenic cells (FLC) was estimated from the difference in viral direct counts (VDCs) between mitomycin C-treated and control incubations, according to the formula:
where BS is the burst size, B0 is the bacterial abundance at the beginning of the incubations and VPlysogenic refers to the lysogenic viral production, (expressed as VLP mL−1 h−1) and is calculated as follows:
Mean values of triplicate incubations were used for all estimations. A switch from the lysogenic to the lytic cycle (i.e., prophage induction) was assumed when we observed significantly higher viral abundance in the mitomycin C treatments relative to the controls (Cochran et al., 1998; Tapper and Hicks, 1998). Regarding burst size, we used the minimum published value (26) acquired from studies in surface waters of the Mediterranean Sea (Weinbauer et al., 2003a).
The % of bacterial production lost due to viral lysis (%BP-VIR) was then estimated, using the formula:
where BP is the bacterial production measured in the original sample and lysis rate of bacteria is calculated in cells mL−1 h−1 using the formula:
Method to Estimate Ingestion Rate of Bacteria by Flagellates
A grazing model was applied in order to estimate the ingestion rate of bacteria by flagellates, and the subsequent grazing impact that flagellates had on bacteria (Peters, 1994). Equation 4 in Peters (1994) considers the weighted measured flagellate size in μm3, bacterial and flagellate abundances in cells mL−1 and temperature, in order to estimate the ingestion rate (IR) according to the following formula:
where VPD refers to the volume of the predators, CPY refers to the concentration of the prey, CPD refers to the concentration of the predator and TEMP refers to the temperature. The obtained estimates of IR are given in number of prey cells per predator per hour.
For the calculation of average biovolume per cell in each size class we considered flagellate cells as spheroids and we used the average length and width in each size class. Cell volumes were calculated as W2*L*π/6, where L and W are the measured length and width of the cells.
Statistical Analysis
Virus numbers in untreated and treated with mitomycin C samples were tested at each time point in the sampling sequence to test for prophage induction (considered to occur when virus numbers in treated samples were significantly higher than in untreated). Repeated measures analysis of variance (RM ANOVA) was used to test for differences in a given variable between different treatments (C, SD and A) throughout the experimental period, after checking the assumption of sphericity (Mauchly's test). One-way ANOVA was applied to test for differences of each variable between treatments at each time point (T-1, T1, T4, and T8). Significant differences between treatments at each time point were assessed by post-hoc Tukey tests (Tukey HSD). Homogeneity of variance for all one-way ANOVAs was checked using Levene's test. All statistical analyses were performed in IBM SPSS 24 software. All data presented here are the mean ± standard deviation (s) of triplicate measurements. When no s is given no replicated measurements were done.
Results
Initial Water Conditions and Nutrients Released with Dust Addition
The seawater characteristics of the sampling site and of the mesocosm bags prior to additions are presented in details in Herut et al. (2016, this SI) and of the following days in Tsagaraki et al. (2016, this SI). In Herut et al. (2016, this SI) additional information on the amount of nutrients and trace metals that were released with dust deposition is given. In the present manuscript, data concern the concentrations of dissolved nutrients, dissolved organic carbon and chlorophyll a (1) at the sampling site, (2) at initial conditions (T-1, as the mean ± s of all mesocosm bags before dust addition) and (3) during the experimental days relevant to the current study (T1, T4, and T8, as the mean ± s of triplicate C, A, and SD mesocosms), and are summarized in Table 2.
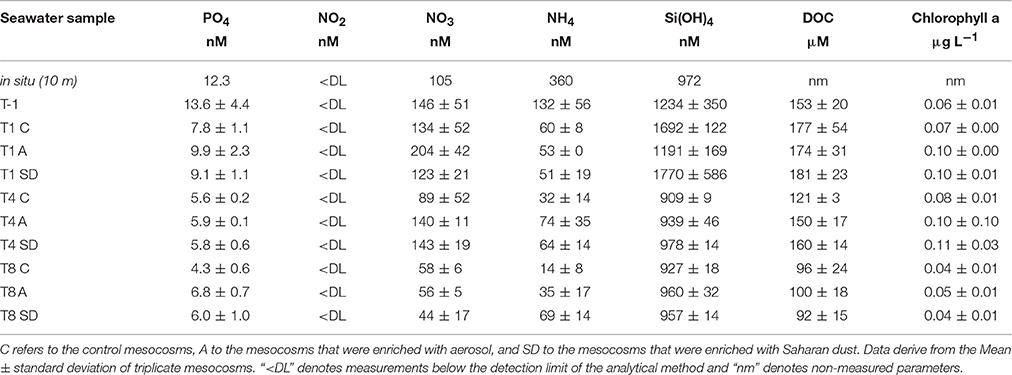
Table 2. Concentration of dissolved phosphate (PO4), nitrite (NO2), nitrate (NO3), ammonium (NH4), silicate [Si(OH)4], organic carbon (DOC), and chlorophyll a at the ambient water collected between 7 and 8th May 2012 (in situ, 10 m depth), before dust deposition (T-1), and then at the experimental days when the viral reduction approach was performed (T1, T4, and T8).
Seawater temperature ranged between 19 and 20°C during the experiment and no stratification developed in the water column of the bags. The concentrations of dissolved phosphate and silicate at the sampling station were 12 and 972 nM, respectively. Significantly higher concentration of phosphate was found in A compared to the rest of the mesocosms at T-1 [one-way ANOVA, F(2) = 11.05, p < 0.05], as well as at T1 and T4. Phosphate concentration decreased upon aerosol addition in both A and SD, while it remained stable in the controls. The concentration of dissolved nitrogen (as the sum of ammonium, nitrite and nitrate) was significantly higher in the controls and A than SD mesocosms before dust addition [one-way ANOVA, F(2) = 11.05, p < 0.05]. Silicate concentration was not different between controls and treatments, except for T-1 that it was significantly higher in A [one-way ANOVA, F(2) = 19.08, p < 0.05].
Dissolved organic carbon (DOC) was 153 (± 20) μM C before dust amendment. DOC concentration increased in all mesocosms toward T1 and then decreased until the end of the experiment.
Total chlorophyll a (calculated as the sum of 2, 0.6 and 0.2 μm size fractions) was 0.06 (±0.01) mg L−1 at T-1. Chlorophyll a concentration was higher at T1 in A and SD than the controls [one-way ANOVA, F(2) = 153.00, p < 0.05], while at T8 it was in levels lower than the initial ones in all mesocosms.
Abundance of Bacteria, Viruses and Flagellates
Before enrichment (T-1), the abundance of total bacterial cells averaged 4.5 × 10⁵ ± 6.9 × 10³ cells mL−1 (Mean ± s). A significant difference in bacterial abundance was observed between the dust-added and control treatments [RM ANOVA, F(2, 3) = 151.56, p < 0.05], with bacterial abundance being higher in A and SD (Tukey HSD test, p < 0.05). Total bacterial abundance increased 1.2–fold in the A and SD mesocosms from T-1 to T1, in contrast to the controls that did not fluctuate during that period (Figure 1A). Bacterial abundance dropped to almost initial values at T4 and remained stable until T8 in the A and SD mesocosms. In the controls, bacteria dropped from T1 until the end of the experiment. The contribution of HDNA bacteria in the different treatments at the experimental days is shown in Figure 1B. Similarly to total bacterial abundance, significant differences between C and A, and C and SD mesocosms were observed [RM ANOVA, F(2, 3) = 465.94, p < 0.05]; HDNA bacteria peaked at T1 (representing 46–48% of total bacteria) and then at T8 (representing 44–46% of total bacteria) in both A and SD treatments, contrary to the controls where HDNA bacterial abundance did not change throughout the experiment.
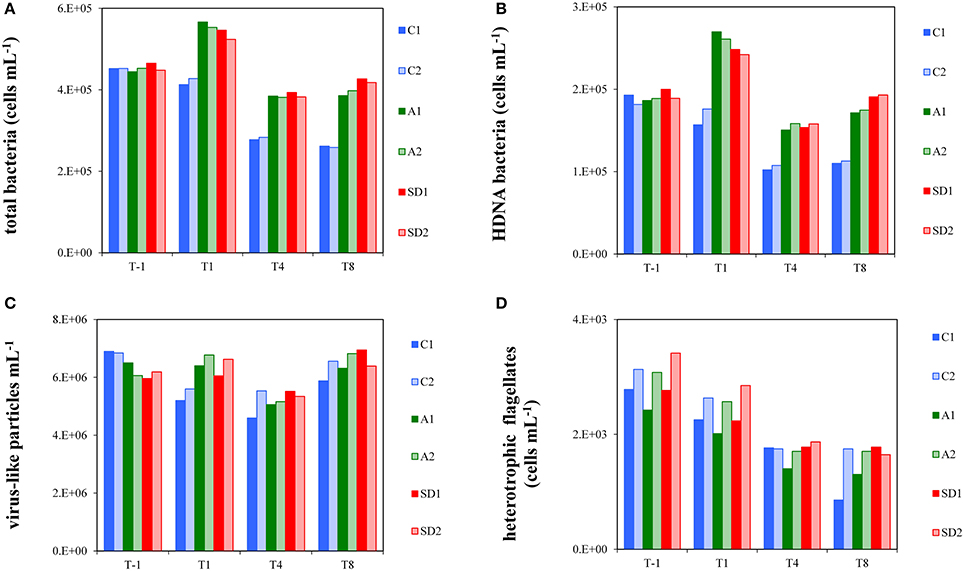
Figure 1. Abundance of total bacteria (A), High DNA nucleic acid bacteria (B), virus-like particles (C) and heterotrophic flagellates (D) in the different treatments at T-1, T1, T4, and T8. C1 and C2 refer to the control mesocosms, A1 and A2 to the mesocosms that were enriched with aerosol, and SD1 and SD2 to the mesocosms that were enriched with Saharan dust.
Initially, total virus-like particle abundances (VLP) ranged between 5.9 and 6.9 × 10⁶ VLP mL−1. VLP abundance showed a similar pattern between all tanks when considering all experimental days, characterized by a ~1.2-fold decrease from T1 to T4, followed by an equivalent increase from T4 to T8 (Figure 1C). VLP abundance was significantly higher in A and SD than the controls at T1 [one-way ANOVA, F(2) = 7.60, p < 0.05].
Heterotrophic flagellate abundance did not show a significantly different pattern between the controls and treatments over time and at any individual time point. Flagellate abundance continuously decreased in all mesocosms from T1 to T8 (Figure 1D) by 30–64% of their initial abundance (2933 ± 347 cells mL−1, Mean ± s). The whole dataset of bacterial, viral and flagellate abundance of the experiment is presented in Appendix 2.
Bacterial Production and Bacterial Growth Rate
Bacterial production measurements for this study are shown in Figure 2A. At T-1, BP was 13.6 ± 1.8 ng C L−1 h−1 (Mean ± s). BP displayed a significantly different trend over time between controls and treatments [RM ANOVA, F(2, 3) = 94.23, p < 0.05]. BP was significantly higher in A and SD than the controls at T1 [one-way ANOVA, F(2) = 42.88, p < 0.05] and significantly higher in SD than the controls at T8 [one-way ANOVA, F(2) = 71.67, p < 0.05]. The highest BP was measured at T1 in A (44.7 ± 1.9 ng C L−1 h−1) and SD (38.2 ± 5.0 ng C L−1 h−1).
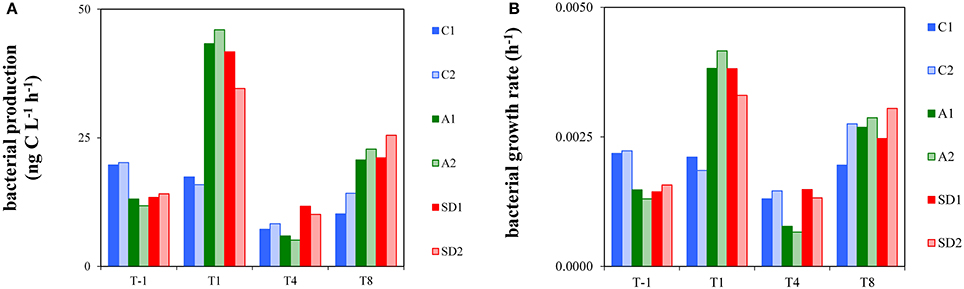
Figure 2. Heterotrophic bacterial production (A) and bacterial growth rate (B) in the different treatments at T-1, T1, T4, and T8. C1 and C2 refer to the control mesocosms, A1 and A2 to the mesocosms that were enriched with aerosol, and SD1 and SD2 to the mesocosms that were enriched with Saharan dust.
Bacterial growth rate is presented in Figure 2B. At initial conditions bacterial growth rate was 0.0017 h−1 (± 0.0004) and it was significantly higher in A and SD than the controls at T1 [one-way ANOVA, F(2) = 30.40, p < 0.05]. Bacterial growth rate reached minimum levels in A at T4 (0.0007–0.0008 h−1), which were significantly different from the respective ones in the controls and SD [one-way ANOVA, F(2) = 29.73, p < 0.05]. The whole dataset of bacterial production rates of the experiment is presented in Appendix 2.
Lytic and Lysogenic Viral Production Rates
Lytic viral production rate (VPlytic) is shown in Figure 3 and lysis rate of bacteria in Table 3. Before dust addition, VPlytic was 0.33 ± 0.02 × 10⁶ cells mL−1 h−1 and lysis rate of bacteria was 0.01 ± 0.0008 × 10⁶ cells mL−1 h−1 (Mean ± s). Significant differences were detected in VPlytic and the lysis rate of bacteria between controls and treatments over time [RM ANOVA, F(2, 15) = 4.35, p < 0.05]. At T1, both VPlytic and the lysis rate of bacteria were significantly higher in the controls than A and SD [one-way ANOVA, F(2) = 27.14, p < 0.05], while at T8 significantly higher levels of both rates were found in SD compared to the controls [one-way ANOVA, F(2) = 14.92, p < 0.001]. At T1 the highest values were measured for VPlytic and the lysis rate of bacteria in the controls (0.92 ± 0.34 × 10⁶ cells mL−1 h−1 and 0.04 ± 0.001 cells mL−1 h−1, respectively).
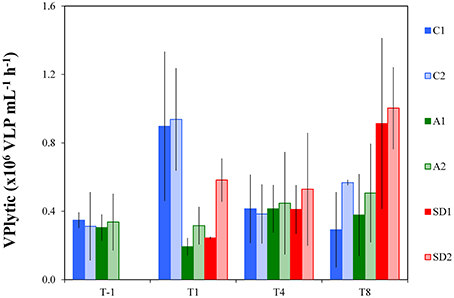
Figure 3. Lytic viral production rate in the different treatments at T-1, T1, T4, and T8. C1 and C2 refer to the control mesocosms, A1 and A2 to the mesocosms that were enriched with aerosol, and SD1 and SD2 to the mesocosms that were enriched with Saharan dust. Values are Mean ± s of triplicate incubation experiments.
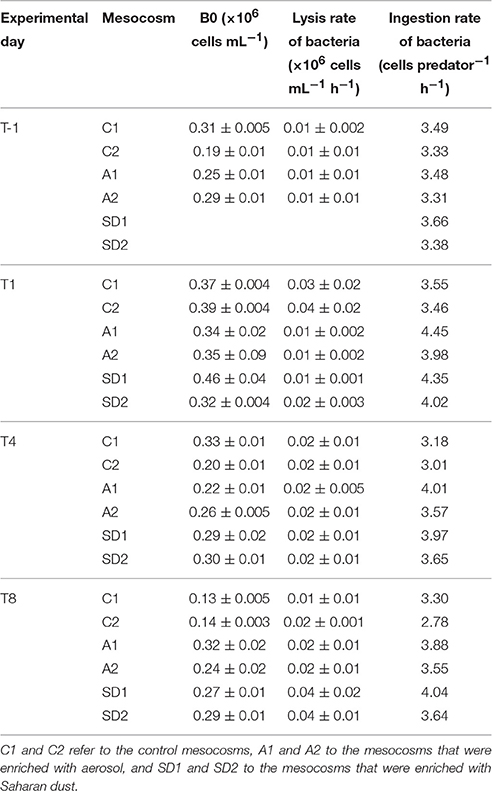
Table 3. Viral reduction approach associated measurements [including B0 that refers to the bacterial abundance at the beginning of the incubation (Mean ± standard deviation of 6 replicates) and the lysis rate of bacteria (Mean ± standard deviation of triplicates)] and the potential ingestion rate of bacteria by flagellates, based on an empirical model described in Peters (1994), in the different treatments at T-1, T1, T4, and T8.
The frequency of lytically infected cells (FLIC) did not display significant differences between the controls and A and SD mesocosms throughout the experimental period. Only at T1, significantly lower FLIC levels were measured in A and SD than the controls [one-way ANOVA, F(2) = 26.36, p < 0.05]. At T-1, FLIC was 5 ± 1% and ranged between 2 and 15% in the following days (Figure 4A).
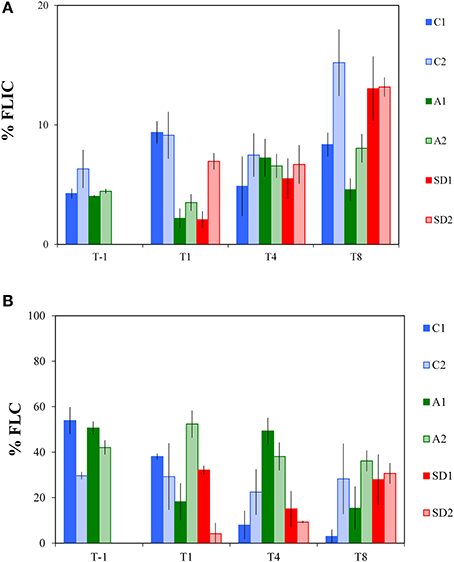
Figure 4. Frequency of lytically infected cells (% FLIC, A) and lysogenic cells (% FLC, B) in the different treatments at T-1, T1, T4 and T8. C1 and C2 refer to the control mesocosms, A1 and A2 to the mesocosms that were enriched with aerosol, and SD1 and SD2 to the mesocosms that were enriched with Saharan dust. Values are Mean ± standard deviation of triplicate incubation experiments.
Lysogenic viral production rates (expressed here as the frequency of lysogenic cells; FLC) represent the proportion of lysogenic bacterial cells in a community, thus the bacterial cells that produce lysogenic viruses and are shown in Figure 4B. FLC levels displayed significant differences between controls and treatments [RM ANOVA, F(2, 15) = 6.72, p < 0.05]. Compared to the controls (15 ± 11%), significantly higher FLC levels were found at T4 in the A mesocosms (44 ± 8%) [one-way ANOVA, F(2) = 24.70, p < 0.01], while SD was significantly different from A at T4 too (12 ± 6%) [one-way ANOVA, F(2) = 24.70, p < 0.05].
Bacterial Production Losses Due to Viral Lysis
The %BP-VIR fraction at initial conditions was 16 ± 4% (Figure 5). A significantly smaller fraction of %BP-VIRwas found at T1 in A and SD mesocosms compared to the controls [one-way ANOVA, F(2) = 26.82, p < 0.05]. Between T-1 and T1%BP-VIR decreased to very low levels in A and SD (6 ± 4%), while it increased in the controls (maximum 45%) and remained in similar levels until T4. %BP-VIR in A mesocosms exceeded the levels of the controls at T4, but the difference was not significant.
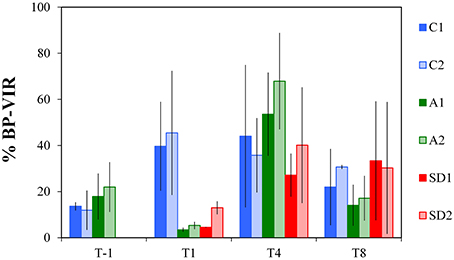
Figure 5. Bacterial mortality expressed as the percentage of bacterial production (BP) lost due to viral lysis (%BP-VIR) in the different treatments at T-1, T1, T4, and T8. C1 and C2 refer to the control mesocosms, A1 and A2 to the mesocosms that were enriched with aerosol, and SD1 and SD2 to the mesocosms that were enriched with Saharan dust. Values are Mean ± standard deviation of triplicate incubation experiments.
Ingestion Rate of Bacteria by Flagellates
The potential ingestion rates of bacteria by heterotrophic flagellates at initial conditions were 3.4 (± 0.1) cells per predator per hour (Table 3). Ingestion rates peaked at T1 in A and SD (4.2 ± 0.2 cells per predator per hour) and were higher than in the controls also at T4 and T8, but the difference was not significant.
Discussion
During the present study, we assessed bacterial growth after a sudden deposition of Saharan desert dust vs. mixed aerosols in the Eastern Mediterranean Sea, and the potential impact of lysis by viruses and grazing by flagellates on bacterial mortality. The EMS surface water used to fill the mesocosms was characterized by typically oligotrophic features; phosphate and chlorophyll a concentrations were 12.3 nM and 0.06 μg L−1, and biological indexes, such as bacterial and primary production rates and phosphate turnover time, fell within the range of published levels for oligotrophic systems and particularly the EMS (reviewed by Herut et al., 2016, this SI). The sudden dust addition represented an intense (SD) and a relatively intense (A) dust event that caused the release of phosphorus (25–50% additional amount compared to the ambient levels) and nitrogen (higher amount in A than in SD) and had an immediate impact on bacterial growth.
Rapidly after deposition of both aerosol types, increased bacterioplankton production, growth rate and standing stock were measured. A positive effect on total and HDNA bacterial abundance was seen, suggesting that a community of more active cells (Lebaron et al., 2001) was dominant in the treated mesocosms compared to the controls. Morán et al. (2007) proposed that the HDNA fraction can be used as an index of bacterial activity if bacterial biomass is controlled by bottom-up factors. Increased bacterial growth rate was measured in experiments in other oceanic regions, also frequently affected by Saharan dust (Pulido-Villena et al., 2008, 2014; Marañón et al., 2010). In the current experiment, changes in bacterial diversity in the dust-treated mesocosms were also determined compared to the controls (Guo et al., 2016, this SI).
During the time of increased bacterial growth, low levels of %BP-VIR were measured in A and SD. Initial levels for VPlytic and %BP-VIR were in agreement with published data for the Mediterranean Sea (Bettarel et al., 2002; Boras et al., 2009) and other coastal systems (Winget and Wommack, 2009). At T1, VPlytic was particularly low in A and SD, and, while it still fell within the published range for the oligotrophic Northwestern Mediterranean (Boras et al., 2009), it was lower than anticipated and lower than in the controls. In support of the notion that viral production depends on host productivity and host-virus contact rates, we hypothesized that increased bacterial growth in A and SD would be followed by increased viral production (Motegi et al., 2009). The same hypothesis was drawn by Pulido-Villena et al. (2014) who proposed a shift from bottom up to moderate top down control of the bacterial biomass by viruses after dust addition, although they did not measure the viral production rates. In our study, the fact that VPlytic was lower in A and SD than in the controls prompted us to hypothesize the following scenarios for the dust-treated mesocosms after enrichment: (1) phage-bacteria dynamics were characterized by a time lag, (2) extensive and continuous lysis events obscured the detection of lytically infected bacterial cells and (3) lytically infected bacterial cells were preferentially grazed by predators due to their beneficial size and nutritional levels.
According to the first scenario, short-term dynamics in the dust-treated mesocosms (Needham et al., 2013) may have resulted in a time-lagged association of bacteria and viruses. Phages may have not been adequate (abundance) or in the appropriate range (composition) to affect bacteria that benefited from the sudden dust pulse in A and SD (Guo et al., 2016), leading to the low measurements of VPlytic. Bacterial resistance to viral infection was developed in experimental (Middelboe et al., 2001) as well as natural systems (Boras et al., 2009), ultimately leading to unaffected bacterial population size.
However, it is frequently seen that bacteria with high productivity support high viral infection and lysis rates, and elevated nutrient concentration favors the lytic cycle (Williamson et al., 2002). Moreover, lysis in nature is a temporally variable process and particularly variable in highly dynamic communities (Bettarel et al., 2002; Winter et al., 2004). Based on these observations, our second hypothesis was that continuous lysis events obscured the detection of lytically infected bacterial cells. In this scenario, the low levels of VPlytic are attributed to the viral reduction approach itself, which may have led to an “artifact” measurement. Zhang et al. (2014) proposed that lysis is constantly occurring in cultures, thus lytically infected cells cannot be measured, while Kimmance et al. (2007) and Winter et al. (2004) proposed that lysis cannot always be detected due to incubation drawbacks. For instance, the duration and time intervals of the incubation may conclude to misleading estimations. Viruses do not all have the same latent period and the possibility that lysis did not occur during the incubation or occurred during a long time interval (e.g., between 12 and 24 h) cannot be excluded. Winget and Wommack (2009) found that maximum VLP abundance was recorded at different times between spring and winter in coastal-system incubations. Cell death or inactivation due to intense light conditions at the sampling time and area may have also contributed to low VPlytic. We exclude the possibility to have induced viral inactivation during the viral reduction approach, as all incubations were done in the dark.
The significantly higher abundance of free viruses in A and SD than the controls at T1 may be a hint that lysis occurred prior to sampling. Similarly to this result, Bonilla-Findji et al. (2009) also measured higher abundance of low DNA content viruses in ambient waters and suggested that these viruses were responsible for lysing active bacterial cells. It is also important to notice that the highest VPlytic could have occurred even earlier in the experiment period, for instance, a few hours after dust enrichment, as planktonic microbes were P-starved and responded extremely fast to the added phosphorus (Herut et al., 2016, this SI). The lack of viral production measurements in between T-1 and T1 does not allow us to test if VPlytic was higher immediately after dust enrichment. The approach we have used is the most commonly applied method for the estimation of viral production as it is assumed to be the most efficient and the least expensive and time-consuming one compared to others methods. A correction factor was applied in order to balance the bacterial losses due to filtration and manipulation during the experiment (Winget et al., 2005), but, still, activity parameters are highly dynamic (Winter et al., 2004) and make the study of viral production a challenging subject.
The high bacterial production in A and SD further led to the estimation of exceptionally low %BP-VIR, which is among the lowest published levels for coastal systems (Winget and Wommack, 2009). For the calculation of %BP-VIR we used an average burst size value for the Mediterranean Sea (Weinbauer et al., 2003a). However, the burst size may change when the trophic conditions and the activity of the host fluctuate (Parada et al., 2006).
The last scenario for explaining low VPlytic is that heterotrophic flagellates and larger predators preferentially grazed on lytically infected bacterial cells. Specific findings with natural assemblages support that viral infection and lysis depend on the host nutritional and activity characteristics; del Giorgio et al. (1996); Vaqué et al. (2001), and Corzo et al. (2005) found selective elimination of active bacteria by protists. Size and activity—dependent grazing have been also observed in a recent mesocosm experiment where a phytoplankton bloom developed (Baltar et al., 2016). In our study, the abundance of the most efficient bacteria in assimilating the released nutrients increased in response to dust deposition. These cells may have been preferentially infected by viruses and further grazed by bacterial predators. This proposition is supported by the fast increase in dinoflagellate abundance soon after the addition of dust (Tsagaraki et al., 2016, this SI). Dinoflagellates are known to be efficient removers of large amounts of bacterial biomass (Jeong et al., 2008; Dagenais-Bellefeuille and Morse, 2013).
Along with increased BP and decreased %BP-VIR at T1 in A and SD, higher ingestion rates, although not significant, were calculated compared to the controls, which persisted until T8. Ingestion rates were in comparable levels to the ones reported for the open oligotrophic Mediterranean Sea (reviewed by Siokou-Frangou et al., 2010). However, flagellates did not seem to benefit from grazing upon bacteria, as flagellate abundance decreased after dust deposition. The fast development of grazers of flagellates may have caused this, as in Herut et al. (2005) and Lekunberri et al. (2010) who indicated that flagellate grazing controlled bacterial biomass and that further grazing of flagellates by larger predators contributed to the subsequent decrease of the former cells.
Based on the ingestion rate, we tried to estimate the percentage of bacterial biomass removed by flagellates. The resulting percentage always exceeded 100%, indicating that the model was not applicable to our experimental system. The empirical model of Peters (1994) is based on a large dataset covering various ecosystems and it takes into account the size and concentration of predators and prey and temperature. A drawback of the use of this model in the current study may derive from the fact that mesocosms are a highly dynamic system; bacteria are grazed by flagellates, dinoflagellates and ciliates, and at the same time flagellates are consumed by dinoflagellates and ciliates. As a result, not all flagellates graze on bacteria at a given time and not all flagellate size fractions graze on bacteria with the same efficiency (Sato et al., 2007).
In this dynamic system, bacterial size and density change, thus the preference of predators also change, leading to predator-prey relationships, which may not be applicable for the grazing model (André et al., 1999; Böttjer and Morales, 2007). As a result, we assume that the calculated percentage of bacterial production removed by flagellate grazing was notional, and most probably bacteria were lysed before being grazed, while flagellates were also grazed themselves before grazing on bacteria. Even when applying other models (e.g., Vaqué et al., 1994) and when considering only flagellates <5 μm as bacterivorous (Jürgnes and Massana, 2008), which comprised approximately 70% of total flagellates, we obtained similar results.
The stoichiometry of added nutrients may have resulted in a more efficient and faster assimilation of the sudden pulse of nutrients by pico- and nano- sized cells, which led to larger prey availability for larger predators in SD. Apparently greater development of ciliates (including tintinnids) and dinoflagellates in SD took place (Tsagaraki et al., 2016, this SI). As shown before, addition of dust with high nitrogen content leads to faster phosphorus limitation of microbial growth (Christodoulaki et al., 2013; Ridame et al., 2014), and this was probably the case in A that received larger amount of nitrogen compared to SD. An indirect confirmation that at T4 bacteria in A were more P-limited compared to SD could be the higher frequency of lysogenic cells, along with the particularly low bacterial production and growth rate. A negative relationship between bacterial production and the fraction of lysogenic cells has been found in natural and experimental conditions (Jiang and Paul, 1996; Long et al., 2008); it has been suggested that lysogeny is a prevalent viral life cycle under conditions that do not favor the growth of the hosts (Williamson et al., 2002; Weinbauer et al., 2003a). In our experiment, more lysogenic cells were measured in A compared to SD and the controls 4 days after deposition, suggesting that conditions were less favorable for the growth of the hosts at that time. Lysogeny may have been underestimated to some extent, as mitomycin C may not induce nutrient-limited cells (Williamson et al., 2002). Thomas et al. (2011) pointed out that bacteria are differentially affected by mitomycin C and this inducing agent may also be toxic. Nevertheless, it is the most commonly used chemical agent for inducing lysis and it allows comparison with other studies.
Conclusions
Aeolian dust from the Saharan desert and southern Europe is deposited in the EMS, supplying the surface waters with nutrients, trace metals and organic matter and influencing the structure and function of the planktonic food web. The results of our study confirm that bacteria were positively affected by dust in terms of biomass, production and growth rate (Pulido-Villena et al., 2008, 2014; Lekunberri et al., 2010; Marañón et al., 2010; Guieu et al., 2014). When bacterial growth rate peaked, bacterial losses due to viral lysis were low. Preferential ingestion of lytically infected cells by bacterivorous predators or continuous lysis events that were not synchronized to the sampling time and incubation intervals may have contributed to the low measurements of lytic viral production. The fast and continuous increase in the abundance of larger predators that grazed on flagellates may have down-regulated their abundance, possibly causing the calculation of misleading bacterial production losses with the use of a grazing model. Stoichiometric differences in the added nutrients through dust between A and SD may have resulted in faster phosphorus limitation in A than SD, which was also indirectly indicated by the higher frequency of lysogenic cells in A than SD. Aerosol deposition drives rapid community responses and the balance between remineralization processes and channeling of biomass further up in the food web is affected by this rapid response. Future research should be directed toward disentangling bacterial mortality due to viral lysis and grazing in order to be able to track the biomass transfer in the food web.
Author Contributions
AT designed and conducted viral production experiments, performed flow cytometric and data analysis and wrote the paper. AG performed bacterial production analysis and edited the paper. NN determined flagellate abundance, performed data analysis and edited the paper. NY conducted viral production experiments and edited the paper. BH, TT, and PP obtained funding, designed the mesocosm experiment and edited the paper
Conflict of Interest Statement
The authors declare that the research was conducted in the absence of any commercial or financial relationships that could be construed as a potential conflict of interest.
Acknowledgments
This study was funded by the European Union 7th Framework Program (FP7/2007-2013) under grant agreement no. 228224, “MESOAQUA: Network of leading MESOcosm facilities to advance the studies of future AQUAtic ecosystems from the Arctic to the Mediterranean” and by the project ADAMANT: Atmospheric deposition and Mediterranean sea water productivity (number code/MIS: 383551), co-financed by the European Union (European Social Fund–ESF) and Greek national funds through the Operational Program “Education and Lifelong Learning” of the National Strategic Reference Framework (NSRF) (Research Funding Program: THALES). The authors wish to thank the Captain and the crew of the R/V Philia for their assistance in transporting the water from the sea to the mesocosms. Thanks are also due to George Piperakis for his technical assistance throughout the experiment, Nafsika Papageorgiou for measuring chlorophyll a concentration, Manolis Tsapakis for measuring dissolved nutrient concentration, Christos Panagiotopoulos and Kalliopi Violaki for measuring dissolved organic carbon concentration, and Elisabet Laia Sá Lago for her valuable recommendations regarding the viral reduction approach. Nutrient leaching experiments were conducted in the Israel Oceanographic and Limnological Research (Haifa) and at the University of Leeds, and results are published in Herut et al. (2016). Finally, three reviewers are gratefully acknowledged for their valuable comments that largely improved the quality of the manuscript.
Supplementary Material
The Supplementary Material for this article can be found online at: http://journal.frontiersin.org/article/10.3389/fmars.2016.00281/full#supplementary-material
References
André, J.-M., Navarette, C., Blanchot, J., and Radenac, M.-H. (1999). Picophytoplankton dynamics in the equatorial Pacific: growth and grazing rates from cytometic counts. J. Geophys. Res. 104, 3369–3380. doi: 10.1029/1998JC900005
Baltar, F., Palovaara, J., Unrein, F., Catala, P., Hornák, K., Simek, K., et al. (2016). Marine bacterial community structure resilience to changes in protist predation under phytoplankton bloom conditions. ISME J. 10, 568–581. doi: 10.1038/ismej.2015.135
Bettarel, Y., Dolan, J. R., Lemée, R., Masin, M., Pedrotti, M., Rochelle-newall, E., et al. (2002). Strong, weak, and missing links in a microbial community of. FEMS Microbiol. Ecol. 42, 451–462. doi: 10.1111/j.1574-6941.2002.tb01034.x
Bonilla-Findji, O., Herndl, G. J., Gattuso, J.-P., and Weinbauer, M. G. (2009). Viral and flagellate control of prokaryotic production and community structure in offshore Mediterranean waters. Appl. Environ. Microb. 75, 4801–4812. doi: 10.1128/AEM.01376-08
Bonnet, S., Chiaverini, J., Ras, J., and Stock, A. (2005). Effect of atmospheric nutrients on the autotrophic communities in a low nutrient, low chlorophyll system. Limnol. Oceanogr. 50, 1810–1819. doi: 10.4319/lo.2005.50.6.1810
Boras, J. A., Sala, M. M., Vázquez-Domínguez, E., Weinbauer, M. G., and Vaqué, D. (2009). Annual changes of bacterial mortality due to viruses and protists in an oligotrophic coastal environment (NW Mediterranean). Environ. Microbiol. 11, 1181–1193. doi: 10.1111/j.1462-2920.2008.01849.x
Böttjer, D., and Morales, C. E. (2007). Nanoplanktonic assemblages in the upwelling area off Concepción (36oS), central Chile: abundance, biomass, and grazing potential during the annual cycle. Progr. Oceanogr. 75, 415–434. doi: 10.1016/j.pocean.2007.08.024
Brussaard, C. P. (2004). Optimization of procedures for counting viruses by flow cytometry. Appl. Environ. Microbiol. 70, 1506–1513. doi: 10.1128/AEM.70.3.1506-1513.2004
Carbo, P., Krom, M. D., Homoky, W. B., Benning, L. G., and Herut, B. (2005). Impact of atmospheric deposition on N and P geochemistry in the southeastern Levantine basin. Deep. Res. II Top. Stud. Oceanogr. 52, 3041–3053. doi: 10.1016/j.dsr2.2005.08.014
Christodoulaki, S., Petihakis, G., Kanakidou, M., Mihalopoulos, N., Tsiaras, K., and Triantafyllou, G. (2013). Atmospheric deposition in the eastern mediterranean. A driving force for ecosystem dynamics. J. Mar. Syst. 109–110, 78–93. doi: 10.1016/j.jmarsys.2012.07.007
Cochran, P. K., Kellogg, C. A., and Paul, J. H. (1998). Prophage induction of indigenous marine lysogenic bacteria by environmental pollutants. Mar. Ecol. Prog. Ser. 164, 125–133. doi: 10.3354/meps164125
Corzo, A., Rodrıguez-Galvez, S., Lubian, L., Sobrino, C., Sangra, P., and Martinez, A. (2005). Antarctic marine bacterioplankton subpopulations discriminated by their apparent content of nucleic acids differ in their response to ecological factors. Polar Biol. 29, 27–39. doi: 10.1007/s00300-005-0032-2
Dagenais-Bellefeuille, S., and Morse, D. (2013). Putting the N in dinoflagellates. Front. Microbiol. 4:369. doi: 10.3389/fmicb.2013.00369
del Giorgio, P. A., Gasol, J. M., Vaqub, D., Mura, P., Agustl, S., and Duarte, C. M. (1996). Bacterioplankton community structure: protists control net production and the proportion of active bacteria in a coastal marine community. Limnol. Oceanogr. 41, 1169–1179. doi: 10.4319/lo.1996.41.6.1169
Fuhrman, J. A., and Noble, R. T. (1995). Viruses and protists cause similar bacterial mortality in coastal seawater. Limnol. Oceanogr. 40, 1236–1242. doi: 10.4319/lo.1995.40.7.1236
Guieu, C., Ridame, C., Pulido-Villena, E., Bressac, M., Desboeufs, K., and Dulac, F. (2014). Impact of dust deposition on carbon budget: a tentative assessment from a mesocosm approach. Biogeosciences 11, 5621–5635. doi: 10.5194/bg-11-5621-2014
Guo, C., Xia, X., Pitta, P., Herut, B., Rahav, E., Berman-Frank, I., et al. (2016). Shifts in microbial community structure and activity in the ultra-oligotrophic eastern mediterranean sea driven by the deposition of saharan dust and European aerosols. Front. Mar. Sci. 3:170. doi: 10.3389/fmars.2016.00170
Herut, B., Collier, R., and Krom, M. D. (2002). The role of dust in supplying nitrogen and phosphorus to the South East Mediterranean. Limnol. Oceanogr. 47, 870–878. doi: 10.4319/lo.2002.47.3.0870
Herut, B., Rahav, E., Tsagaraki, T. M., Giannakourou, A., Tsiola, A., Psarra, S., et al. (2016). The potential impact of Saharan dust and polluted aerosols on microbial populations in the East Mediterranean Sea, an overview of a mesocosm experimental approach. Front. Mar. Sci. 3:226 doi: 10.3389/fmars.2016.00226
Herut, B., Zohary, T., Krom, M. D., and Mantoura, R. F. C. (2005). Response of East Mediterranean surface water to Saharan dust: on-board microcosm experiment and field observations. Deep Sea Res. II Top. Stud. Oceanogr. 52, 3024–3040. doi: 10.1016/j.dsr2.2005.09.003
Ivančič, I., and Deggobis, D. (1984). An optimal manual procedure for ammonia analysis in natural waters by the indophenol blue method. Water Res. 18, 1143–1147. doi: 10.1016/0043-1354(84)90230-6
Jeong, H. J., Seong, K. A., Yoo, Y. D., Kim, T. H., Kang, N. S., Kim, S., et al. (2008). Feeding and grazing impact by small marine heterotrophic dinoflagellates on heterotrophic bacteria. J. Eukaryot. Microbiol. 55, 271–288. doi: 10.1111/j.1550-7408.2008.00336.x
Jiang, S. C., and Paul, J. H. (1996). Occurrence of lysogenic bacteria in marine microbial communities as determined by prophage induction occurrence of lysogenic bacteria in marine microbial communities as determined by prophage induction. Mar. Ecol. Prog. Ser. 142, 27–38. doi: 10.3354/meps142027
Jürgnes, K., and Massana, R. (2008). “Protistan grazing on marine bacterioplankton,” in Microbial Ecology of the Oceans, ed D. L. Kirchman (Hoboken, NJ: John Wiley and Sons, Inc), 383–441.
Kimmance, S. A., Wilson, W. H., and Archer, S. D. (2007). Modified dilution technique to estimate viral versus grazing mortality of phytoplankton: limitations associated with method sensitivity in natural waters. Aquat. Microb. Ecol. 49, 207–222. doi: 10.3354/ame01136
Kirchman, D. (1993). Measuring bacterial biomass production and growth rates from leucine incorporation in natural aquatic environments. Methods Microbiol. 30, 227–237. doi: 10.1016/S0580-9517(01)30047-8
Kirchman, D., K'nees, E., and Hodson, R. (1985). Leucine incorporation and its potential as a measure of protein synthesis by bacteria in natural aquatic systems. Appl. Environ. Microbiol. 49, 599–607.
Krom, M. D., Kress, N., Brenner, S., and Gordon, L. I. (1991). Phosphorus limitation of primary productivity in the eastern Mediterranean Sea. Limnol. Oceanogr. 36, 424–432. doi: 10.4319/lo.1991.36.3.0424
Laghdass, M., Blain, S., Besseling, M., Catala, P., Guieu, C., and Obernosterer, I. (2011). Effects of Saharan dust on the microbial community during a large in situ mesocosm experiment in the NW Mediterranean Sea. Aquat. Microb. Ecol. 62, 201–213. doi: 10.3354/ame01466
Lebaron, P., Servais, P., Agogué, H., Courties, C., and Joux, F. (2001). Does the high nucleic acid content of individual bacterial cells allow us to discriminate between active cells and inactive cells in aquatic systems? Appl. Environ. Microbiol. 67, 1775–1782. doi: 10.1128/AEM.67.4.1775-1782.2001
Lee, S., and Fuhrman, J. E. D. A. (1987). Relationships between biovolume and biomass of naturally derived marine bacterioplanktont. Appl. Environ. Microbiol. 53, 1298–1303.
Lekunberri, I., Lefort, T., Romero, E., Vazquez-Dominguez, E., Romera-Castillo, C., Marrase, C., et al. (2010). Effects of a dust deposition event on coastal marine microbial abundance and activity, bacterial community structure and ecosystem function. J. Plankton Res. 32, 381–396. doi: 10.1093/plankt/fbp137
Lelieveld, J., Proestos, Y., Hadjinicolaou, P., Tanarhte, M., Tyrlis, E., and Zittis, G. (2016). Strongly increasing heat extremes in the Middle East and North Africa (MENA) in the 21st century. Clim. Change 137, 245–260. doi: 10.1007/s10584-016-1665-6
Long, A., McDaniel, L. D., Mobberley, J., and Paul, J. H. (2008). Comparison of lysogeny (prophage induction) in heterotrophic bacterial and Synechococcus populations in the Gulf of Mexico and Mississippi River plume. ISME J. 2, 132–144. doi: 10.1038/ismej.2007.102
Marañón, E., Fernández, A., Mouriño-Carballido, B., Martínez-García, S., Teira, E., Cermeño, P., et al. (2010). Degree of oligotrophy controls the response of microbial plankton to Saharan dust. Limnol. Oceanogr. 55, 2339–2352. doi: 10.4319/lo.2010.55.6.2339
Marie, D., Partensky, F., Jacquet, S., and Vaulot, D. (1997). Enumeration and cell cycle analysis of natural populations of marine picoplankton by flow cytometry using the nucleic acid stain SYBR Green I. Appl. Environ. Microbiol. 63, 186–193.
Middelboe, M., Hagström, A., Blackburn, N., Sinn, B., Fischer, U., Borch, N. H., et al. (2001). Effects of bacteriophages on the population dynamics of four strains of pelagic marine bacteria. Microb. Ecol. 42, 395–406. doi: 10.1007/s00248-001-0012-1
Morán, X. A. G., Bode, A., Suárez, L. Á., and Nogueira, E. (2007). Assessing the relevance of nucleic acid content as an indicator of marine bacterial activity. Aquat. Microb. Ecol. 46, 141–152. doi: 10.3354/ame046141
Motegi, C., Nagata, T., Miki, T., Weinbauer, M. G., and Legendre, L. (2009). Viral control of bacterial growth efficiency in marine pelagic environments. Limnol. Oceanogr. 54, 1901–1910. doi: 10.4319/lo.2009.54.6.1901
Needham, D. M., Chow, C.-E., Cram, J. A., Sachdeva, R., Parada, A., and Fuhrman, J. A. (2013). Short-term observations of marine bacterial and viral communities: patterns, connections and resilience. ISME J. 7, 1274–1285. doi: 10.1038/ismej.2013.19
Parada, V., Herndl, G. J., and Weinbauer, M. G. (2006). Viral burst size of heterotrophic prokaryotes in aquatic systems. J. Mar. Biol. Assoc. U.K. 86, 613–621. doi: 10.1017/S002531540601352X
Pernthaler, J. (2005). Predation on prokaryotes in the water column and its ecological implications. Nat. Rev. Microbiol. 3, 537–546. doi: 10.1038/nrmicro1180
Peters, F. (1994). Prediction of planktonic protistan grazing rates. Limnol. Oceanogr. 39, 195–206. doi: 10.4319/lo.1994.39.1.0195
Porter, K. G., and Feig, Y. S. (1980). The use of DAPI for identifying aquatic microfloral. Limnol. Oceanogr. 25, 943–948. doi: 10.4319/lo.1980.25.5.0943
Pulido-Villena, E., Baudoux, A.-C., Obernosterer, I., Landa, M., Caparros, J., Catala, P., et al. (2014). Microbial food web dynamics in response to a Saharan dust event: results from a mesocosm study in the oligotrophic Mediterranean Sea. Biogeosciences 11, 5607–5619. doi: 10.5194/bg-11-5607-2014
Pulido-Villena, E., Wagener, T., and Guieu, C. (2008). Bacterial response to dust pulses in the western Mediterranean: implications for carbon cycling in the oligotropic ocean. Glob. Biogeochem. Cycles 22, 1–12. doi: 10.1029/2007GB003091
Ridame, C., Dekaezemacker, J., Guieu, C., Bonnet, S., L'Helguen, S., and Malien, F. (2014). Phytoplanktonic response to contrasted Saharan dust deposition events during mesocosm experiments in LNLC environment. Biogeosciences 11, 4783–4800. doi: 10.5194/bg-11-4783-2014
Rimmelin, P., and Moutin, T. (2005). Re-examination of the MAGIC method to determine low orthophosphate concentration in seawater. Anal. Chim. Acta 548, 174–182. doi: 10.1016/j.aca.2005.05.071
Sato, M., Yoshikawa, T., Takeda, S., and Furuya, K. (2007). Application of the size-franctionation method to simultaneous estimation of clearance rates by heterotrophic flagellates and ciliates of pico- and nanophytoplankton. J. Exp. Mar. Ecol. Biol. 349, 334–343. doi: 10.1016/j.jembe.2007.05.027
Shi, Z., Krom, M. D., Bonneville, S., and Benning, L. G. (2015). Atmospheric processing outside clouds increases soluble iron in Mineral Dust. Environ. Sci. Technol. 49, 1472–1477. doi: 10.1021/es504623x
Siokou-Frangou, I., Christaki, U., Mazzocchi, M. G., Montresor, M., Ribera d' Alcalá, M., Vaqué, D., et al. (2010). Plankton in the open Mediterranean Sea: a review. Biogeosciences 7, 1543–1586. doi: 10.5194/bg-7-1543-2010
Smith, D. C., and Azam, F. (1992). A simple, economical method for measuring bacterial protein synthesis rates in seawater using 3H-leucine. Mar. Microb. Food Webs 6, 107–114.
Sohrin, R., and Sempéré, R. (2005). Seasonal variation in total organic carbon in the northeast Atlantic in 2000-2001. J. Geophys. Res. 110:C10S90, doi: 10.1029/2004jc002731
Strickland, J. D. H., and Parsons, T. R. (1972). “Determination of phosphorus,” in A Practical Handbook of Sea-Water Analysis, 2nd Edn., Bulletin No 167, eds J. D. H. Strickland and T. R. Parsons (Ottawa: Fisheries Research Board of Canada), 123–124.
Tapper, M., and Hicks, R. (1998). Temperate viruses and lysogeny in lake superior bacterioplankton. Limnol. Oceanogr. 43, 95–103. doi: 10.4319/lo.1998.43.1.0095
Ternon, E., Guieu, C., Ridame, C., L'Helguen, S., and Catala, P. (2011). Longitudinal variability of the biogeochemical role of Mediterranean aerosols in the Mediterranean Sea. Biogeosciences 8, 1067–1080. doi: 10.5194/bg-8-1067-2011
Thingstad, T. F. (2000). Elements of a theory for the mechanisms controlling abundance, diversity, and biogeochemical role of lytic bacterial viruses in aquatic systems. Limnol. Oceanogr. 45, 1320–1328. doi: 10.4319/lo.2000.45.6.1320
Thomas, R., Berdjeb, L., Sime-Ngando, T., and Jacquet, S. (2011). Viral abundance, produciton, decay rates and life strategies (lysogeny versus lysis) in Lake Bourget (France). Environ. Microbiol. 13, 616–630. doi: 10.1111/j.1462-2920.2010.02364.x
Tsagaraki, M. T., Pitta, P., Herut, B., Rahav, E., Berman Frank, I., Tsiola, A., et al. (2016). Atmospheric deposition effects on plankton communities in the Eastern Mediterranean, a mesocosm experimental approach. Front. Mar. Sci. 3:226. doi: 10.3389/fmars.2016.00226
Vaqué, D., Alonso-Sáez, L., Arístegui, J., Agustí, S., Duarte, G. M., Sala, M. M., et al. (2014). Bacterial production and losses to predators along an open ocean productivity gradient in the subtropical North East Atlantic Ocean. J. Plankton Res. 36, 198–213. doi: 10.1093/plankt/fbt085
Vaqué, D., Casamayor, E. O., and Gasol, J. M. (2001). Dynamics of whole community bacterial production and grazing losses in seawater incubations as related to the changes in the proportions of bacteria with different DNA content. Aquat. Microb. Ecol. 25, 163–177. doi: 10.3354/ame025163
Vaqué, D., Gas, J. M., and Marrase, C. (1994). Grazing rates on bacteria: the significance of methodology and ecological factors. Mar. Ecol. Prog. Ser. 109, 263–274. doi: 10.3354/meps109263
Volpe, G., Banzon, V. F., Evans, R. H., Santoleri, R., Mariano, A. J., and Sciarra, R. (2009). Satellite observations of the impact of dust in a low-nutrient, low- chlorophyll region: fertilization or artifact? Glob. Biochem. Cycles 23, 1–14. doi: 10.1029/2008gb003216
Weinbauer, M. G., Brettar, I., and Höfle, M. G. (2003a). Lysogeny and virus-induced mortality of bacterioplankton in surface, deep, and anoxic marine waters. Limnol. Oceanogr. 48, 1457–1465. doi: 10.4319/lo.2003.48.4.1457
Weinbauer, M. G., Christaki, U., Nedoma, J., and Šimek, K. (2003b). Comparing the effects of resource enrichment and grazing on viral production in a meso-eutrophic reservoir. Aquat. Microb. Ecol. 31, 137–144. doi: 10.3354/ame031137
Weinbauer, M. G., and Peduzzi, P. (1994). Frequency, size and distribution of bacteriophages in different marine bacterial morphotypes. Mar. Ecol. Prog. Ser. 108, 11–20. doi: 10.3354/meps108011
Winget, D. M., Williamson, K. E., Helton, and Wommack, K. E. (2005). Tangential flow diafiltration: an improved technique for estimation of virioplankton production. Aquat. Microb. Ecol. 41, 221–232. doi: 10.3354/ame041221
Williamson, S. J., Houchin, L. A., Mcdaniel, L., and Paul, J. H. (2002). Seasonal variation in lysogeny as depicted by prophage induction in tampa bay, Florida. Appl. Environ. Microbiol. 68, 4307–4314. doi: 10.1128/AEM.68.9.4307
Winget, D. M., and Wommack, K. E. (2009). Diel and daily fluctuations in virioplankton production in coastal ecosystems. Environ. Microbiol. 11, 2904–2914. doi: 10.1111/j.1462-2920.2009.02038.x
Winter, C., Herndl, G. J., and Weinbauer, M. G. (2004). Diel cycles in viral infection of bacterioplankton in the North Sea. Aquat. Microb. Ecol. 35, 207–216. doi: 10.3354/ame035207
Yentsch, C. S., and Menzel, D. W. (1963). A method for the determination of phytoplankton chlorophyll and phaeophytin by fluorescence. Deep Sea Res. 10, 221–231. doi: 10.1016/0011-7471(63)90358-9
Keywords: mesocosm experiment, East Mediterranean, dust, aerosols, lysis, lysogeny
Citation: Tsiola A, Tsagaraki TM, Giannakourou A, Nikolioudakis N, Yücel N, Herut B and Pitta P (2017) Bacterial Growth and Mortality after Deposition of Saharan Dust and Mixed Aerosols in the Eastern Mediterranean Sea: A Mesocosm Experiment. Front. Mar. Sci. 3:281. doi: 10.3389/fmars.2016.00281
Received: 22 September 2016; Accepted: 13 December 2016;
Published: 04 January 2017.
Edited by:
Tilmann Harder, University of Bremen, GermanyReviewed by:
Dolors Vaque, Spanish National Research Council, SpainToshi Nagata, University of Tokyo, Japan
Copyright © 2017 Tsiola, Tsagaraki, Giannakourou, Nikolioudakis, Yücel, Herut and Pitta. This is an open-access article distributed under the terms of the Creative Commons Attribution License (CC BY). The use, distribution or reproduction in other forums is permitted, provided the original author(s) or licensor are credited and that the original publication in this journal is cited, in accordance with accepted academic practice. No use, distribution or reproduction is permitted which does not comply with these terms.
*Correspondence: Anastasia Tsiola, YXRzaW9sYUBoY21yLmdy
†Present Address: Tatiana M. Tsagaraki, Department of Biology, University of Bergen, Bergen, Norway
Nikolaos Nikolioudakis, Institute of Marine Research, Bergen, Norway