 Jessica L. Williams
 Simon J. Pierce
 Chris A. Rohner
 Mariana M. P. B. Fuentes
 Mark Hamann
- 1College of Marine and Environmental Science, James Cook University, Townsville, QLD, Australia
- 2Marine Megafauna Foundation, Inhambane, Mozambique
- 3All Out Africa Research Unit, Marine Research Centre, Inhambane, Mozambique
- 4Department of Earth, Ocean and Atmospheric Science, Florida State University, Tallahassee, FL, USA
Sea turtles spend the majority of their immature and adult lives in foraging grounds, yet few studies have examined their abundance and condition in these areas when compared to more accessible nesting beach habitats. Here, a 5-year dive log, photo-identification (photo-ID) and surface encounter datasets were used to investigate the abundance, individual movements and distribution of sea turtles along 40 km of coastal reefs in southern Mozambique. A generalized linear model (GLM) was constructed with turtle sightings as the response variable. Habitat type, year and day of the year, as well as underwater visibility, were significant predictors of turtle sightings. However, only 8% of the total variance was explained by the model, indicating that other variables have a significant influence on turtle movement and distribution. Photo-ID differentiated 22 individual green turtles Chelonia mydas and 42 loggerhead turtles Caretta caretta from 323 photo-ID encounters. A majority (64%) of the photos could be used to identify the individual. Although residency times of up to 1152 days were calculated for juvenile green turtles, a low overall resighting rate indicates that individual turtles either had large home ranges or were transient to the area. Surface encounter data revealed a preference for nearshore shallow waters and an increased abundance close to reef systems. Sea turtles' preferences for shallow, nearshore habitats are likely to increase the encounter risk with opportunistic and targeted artisanal fishers who catch sea turtles.
Introduction
Understanding ontogenetic development of space use in marine megafauna species is a key aspect of marine megafauna movement ecology (Hays et al., 2016). Burgeoning questions in this field include how megafauna movements vary over space and time, essential knowledge for spatial planning and conservation management (Block et al., 2011; Hays et al., 2016). Sea turtles are one such megafauna group which move ontogenetically, spending part of their life in a juvenile nursery habitat and then migrating to an adult foraging habitat.
Juvenile sea turtles actively recruit to demersal neritic development habitats in tropical or temperate zones following several years of passive pelagic migration (Musick and Limpus, 1997; Luschi et al., 2003), although evidence of juveniles recruiting to oceanic foraging areas has also been demonstrated (e.g., Hawkes et al., 2006; Dalleau et al., 2014). Cheloniidae (hard-shelled) species exhibit two strategies within their developmental habitat; (1) the area is shared with adults and will constitute the adult residential foraging grounds where juveniles will later spend their inter-reproductive period (Limpus and Limpus, 2001; Bolten and Witherington, 2003) or (2) the area will be frequented only by juveniles that will subsequently shift to a different feeding area when they reach maturity (Musick and Limpus, 1997; Luschi et al., 2003). To date, the spatial and temporal variability of ontogenetic or developmental migrations in late stage juvenile sea turtles is the least known stage in the life cycle of sea turtles (Luschi et al., 2003; Godley et al., 2008; Hamann et al., 2010; Varo-Cruz et al., 2016).
Local variation in life history occurs both regionally and between different genetic stocks or regional management units (RMU) for each sea turtle species. A synthesis on satellite tracking revealed greater behavioral and ecological plasticity in Cheloniidae than previously thought (Godley et al., 2008; Casale et al., 2012). Migration routes of post-breeding adults revealed four general migration strategies: (1); oceanic and coastal movements to fixed neritic grounds, (2); coastal shuttling between fixed or seasonal neritic sites (3); local residence, and (4); pelagic foraging (Godley et al., 2008). For the south west Indian Ocean (SWIO) loggerhead (Caretta caretta) populations, oceanic and neritic foraging behaviors have been shown in late stage juveniles (Dalleau et al., 2014). Migrations of these late stage juveniles can be broadly categorized into three groups; northern migration toward neritic waters of Kenya, Somalia, Yemen and Oman (which hosts the largest nesting rookery in the region), a southern migration toward the smaller South African rookery but remaining in productive pelagic waters and a third group where behavior could not be clearly defined but animals remained offshore from Reunion Island, or the eastern coast of Madagascar (Dalleau et al., 2014). The pelagic migration of late stage juvenile loggerheads traveling south is distinct and different from neritic shuttling migrations (between nesting and foraging areas) as revealed in satellite tagged post-nesting turtles from South Africa (Schroeder et al., 2003; Luschi et al., 2006; Dalleau et al., 2014). Throughout their global ranges, adult loggerhead turtles display strong site fidelity to residential areas and establish feeding home ranges at these sites (Hughes, 1974; Limpus and Limpus, 2001; Godley et al., 2003). Within the SWIO, post-nesting loggerhead females migrate north, actively hugging the coast from the Maputaland rookery into Mozambican coastal waters (southern and central provinces) (Luschi et al., 2006). The end point of these migrations is thought to be individually-specific neritic feeding areas which are discrete foraging grounds for mature adult loggerheads (Luschi et al., 2006).
Contrasting this, green turtles (Chelonia mydas) within the SWIO adopt an alternative strategy, whereby mixed age/size aggregations at foraging grounds are common (although niche partitioning between size/aged animals occurs within a foraging area (Ballorain et al., 2010). Foraging habitats across the SWIO are shared by different breeding populations (stocks) of the SWIO and beyond (Dalleau, 2013; Hays et al., 2014; Bourjea et al., 2015). Typically, post-nesting green turtles migrate to neritic resident foraging areas (Broderick et al., 2007; Garnier et al., 2012) such as those tracked migrating from Vamizi Island in northern Mozambique using primarily neritic (but also some evidence of pelagic) migratory routes to foraging grounds in Kenya, Tanzania and north-west Madagascar (Garnier et al., 2012). Genetic analysis (mtDNA) at these foraging sites have allowed an evaluation of the stock and the natal origin of animals (Bowen and Karl, 2007) can be inferred which ultimately provides insight into ontogenetic migration (displacement distances) (Hays and Scott, 2013). However, along the east African and Malagasy coast significant data gaps exist regarding the genetic composition of animals within mixed foraging grounds resulting in uncertainty about natal origins and ontogenetic migrations undertaken to reach the foraging area are lacking (Bourjea et al., 2015).
Immature turtles, having survived the higher mortality rates associated with hatchling and post-hatchling life stages generally have the highest stage-specific demographic sensitivity within a population (Heppell et al., 2003), so anthropogenic threats that disproportionately impact on immature turtles or are prevalent in developmental habitats are likely to result in overall population decline (Heppell et al., 2003; Gerber and Heppell, 2004; Wallace et al., 2008). Yet for many of the world's sea turtle populations we lack empirical data on the distribution and condition of important foraging areas, or the behavior and ecology of foraging turtles (Hamann et al., 2010). Describing sea turtle foraging areas with details of which animals (species, individuals, and age classes) occupy an area, their use of the area (purpose of occupancy, residency patterns, habitat preferences, area/space occupied) and temporal patterns of their use (daily, seasonally, and annually), is critical for effective conservation planning and targeted management (Luschi et al., 2006; Hamann et al., 2010; Casale et al., 2012).
Contributing to these fundamental gaps in sea turtle foraging ecology, the environmental and behavioral mechanisms (or combination of) which influence the timing of ontogenetic migration and destination are poorly understood. In adult foraging areas it has been proposed that the selection of these sites is influenced by the drift pattern undertaken as hatchlings (Hays et al., 2010; Scott et al., 2014). As such, the prevailing oceanography around nesting rookeries may be crucial to the selection of foraging areas used by adults (Luschi et al., 2003; Hays et al., 2010). Regional evidence of this theory exists from a green turtle rookery at Vamizi Island, northern Mozambique where prevailing oceanography influences the diversity of residential foraging grounds used by adults (Garnier et al., 2012). Given the seasonal characteristics (seasonal monsoon systems) and complexity of oceanic circulation (cyclonic and anticyclonic eddies and lack of an ocean-scale annual gyre) in the Indian Ocean it is possible that a greater variability of ontogenetic migration patterns occur than in sea turtle populations in other ocean basins (Dalleau et al., 2014). This suggests that predicting and identifying migratory corridors and the final destination (foraging grounds) of ontogenetic migrations (for spatial planning or threat assessment) is likely to be more challenging sea turtles species in the SWIO.
The east African coast is presumed to host extensive foraging areas (Bourjea et al., 2015) and the coastal waters of southern Mozambique are no exception. Five sea turtle species inhabit southern Mozambique, but their spatial distribution, habitat use and population structure has not been studied (Louro et al., 2006). Coastal foraging areas generally contain a mixture of age/size classes and species, but a size structure bias can occur (Hatase et al., 2002; Ballorain et al., 2010). Most knowledge on sea turtle population ecology in Mozambique relates to loggerhead turtles which are represented by a single genetic stock: SWIO genetic stock (Hamann et al., 2013; Fernandes, 2015). The species nests along much of the country's southern coastline, and their most studied rookery within the SWIO occurs across the boundaries of Mozambique and South Africa (Nel et al., 2013). Beyond the southern Mozambican nesting grounds, loggerheads also spend extended periods of time in what are thought to be coastal foraging grounds in the Inhambane Province, southern Mozambique (Hughes, 1974; Papi et al., 1997; Luschi et al., 2006; Pereira et al., 2014). Their foraging and migration areas are not well known, although tagged juveniles have demonstrated neritic and oceanic foraging behaviors (Dalleau et al., 2014). Based on population trends from the South African coast, the SWIO loggerhead population, is listed as “Near Threatened” on the IUCN Red List (Nel and Casale, 2015), with the population thought to be stable and showing signs of increase (Nel et al., 2013).
Information on green turtles in Mozambique has been derived from nesting census work on Vamizi Island in the country's north, thought to be the most significant nesting rookery in Mozambique (Garnier et al., 2012; Louro and Fernandes, 2012). Within the Inhambane region, mixed-size green turtles (40–110 cm curved carapace length) utilize nearshore reefs (Williams et al., 2015), but it remains unclear whether these reefs represent foraging habitat and/or migratory corridors for the species. Green turtles occur extensively throughout the Mozambique Channel (Bourjea et al., 2007). Unlike loggerhead turtles, foraging and nesting green turtles in the WIO comprise of several genetic stocks (Bourjea et al., 2015). Turtles from two of these stocks exist in Mozambican waters: the Northern (NMC) and Southern Mozambican Channel (SMC) stocks (Bourjea et al., 2015). The NMC stock consists of multiple breeding populations (e.g., Seychelles, Northern Madagascar, Kenya, Mayotte, Tromelin) however the SMC Stock is through to primarily consist of turtles from the Europa rookery (Bourjea et al., 2007; Lauret-Stepler et al., 2007). Anthropogenic exploitation of sea turtles from their mixed-stock foraging grounds can reduce breeding populations across a region (Bowen and Karl, 2007). Theoretical modeled scenarios of anthropogenic perturbations affecting foraging grounds of the SMC show increased pressures to the NMC stock and could cause regional implications however limited empirical data exist to validate this prediction (Dalleau, 2013). It is clear that detailed investigation into foraging areas within the region, particularly along the east African mainland coast is required.
The absence of regional knowledge on the ecology of foraging sea turtles in the region makes it difficult to assess and quantify the impact from various threats, such as incidental and directed take from small scale fisheries (SSF). SSF often comprise the majority of the fisheries sector in developing countries (Béné, 2006; Alfaro-Shigueto et al., 2010). SSF are widespread globally throughout nearshore habitats and easily-accessible coastal waters (Francis et al., 2001) and high bycatch rates of sea turtle, cetacean and elasmobranchs occur (Koch et al., 2006; Soykan et al., 2008; Mancini et al., 2011). Coastal net fisheries may be the largest single threat to sea turtle populations globally (Gilman et al., 2009) and within Mozambique, artisanal gill net and beach seine fishing are thought to have the greatest impact to sea turtles, marine mammals and elasmobranchs (Kiszka, 2012). In Mozambique, SSF contributes to 91% of the total marine fisheries catch (IFAD, 2011), and the 2006 national census for artisanal marine fisheries found that over 280 000 people depend directly on artisanal fishing with another 90,000 dependent on obtaining resources from diving or shore line collection (Menezes et al., 2011). The abundance of turtles caught by artisanal fisheries throughout the Mozambique Channel is thought to overshadow commercial fisheries catches (Rakotonirina and Cooke, 1994; Humber et al., 2011; Nel et al., 2013; Bourjea et al., 2015). Specifically in Mozambique, the number of people and boats engaged in SSF is increasing, even though productivity is declining (IFAD, 2011). Gill netting and other artisanal fisheries (spearfishing, beach seining, purse seining) occurs extensively throughout Inhambane Province, where our study was undertaken.
Advances in the understanding of foraging turtle ecology and ontogenetic migrations are likely to require a diverse approach using information revealed from tracking, tagging, genetic stock and remotely sensed environmental data collected collaboratively across the region (Dalleau, 2013; Bourjea et al., 2015). An additional technique which could yield valuable information in foraging grounds is photographic identification of individuals. The low cost, low-tech, and non-invasive nature of Photo-ID in contrast to other techniques (Fastloc, Argos or acoustic tagging), has propelled its adoption as a tool for in-water monitoring of animals (Schofield et al., 2008; Jean et al., 2010; Dunbar et al., 2014; Carpentier et al., 2016), particularly in developing countries where application of alternative technologies was hindered by resource limitations. Photo-ID can potentially provide insight into use of neritic coastal areas by sea turtles as foraging grounds or migratory corridors and may further enhance understanding on late stage juveniles and ontogenetic space use. Our study uses three complementary datasets (dive logs, photo-ID, and a surface encounter dataset) to investigate the size structure, residency, environmental, spatial and temporal trends of sea turtles in coastal habitats around the Inhambane peninsula in southern Mozambique. We attempt to clarify the spatial use of this area by green and loggerhead turtles. We consider our findings within the context of known SSF risk to sea turtles in this region, along with the practicalities of applying photo-ID from citizen science.
Methods
Study Area
Our study was conducted in the coastal waters adjacent to the small village of Praia do Tofo on the Inhambane peninsula of Inhambane Province, southern Mozambique (−23.51°S, 35.23°E) (Figure S1). A detailed study site description was provided by Williams et al. (2015). Fifteen different reef areas all routinely visited by scuba dive tour operators, were selected for inclusion in this study. These reefs were located from 500 m to 15 km offshore along a 40 km stretch of coast. All are primarily rocky, with low hard coral diversity and range in mean depth from 11 to 33 m. Using prominent coral taxa the sites could be distinguished into four habitat types: (1) plate corals, (2) soft corals, (3) rocky reefs with branching tree corals (Dendrophilliae), and (4) mixed (coral and macroalage). These four habitat types were separated into distinct spatial groupings, with plate coral habitats found in the northern offshore reefs, rocky reefs with branching corals found in deeper waters directly offshore from Tofo Bay, and soft coral reefs found in deeper waters in the south. All other sites were classified as mixed macroalgae and coral habitat type, and were found in nearshore shallow areas (Figure S1). Ocean conditions were dynamic and swell sizes (0.1–3 m) and underwater horizontal visibility (5–30 m) varied day to day. Horizontal visibility was estimated and reported by experienced divers.
In-Water Data Collection and Analysis
Citizen scientists and researchers contributed toward both dive logs and turtle photo-ID collection in Praia do Tofo. Data from 1, 403 dives undertaken between Aug 2011–Sept 2015, a total of 1, 055 diving hours, were available for analysis. To avoid possible data duplication within a day, or between dive groups, only one record per species per day at each specific dive site was used, except where photo-ID records were available to confirm that multiple individuals were present. Dive logs were completed by long term and highly experienced divers (research assistants or project leaders of local marine conservation organization or dive instructors). Divers were trained in species identification (sea turtles, elasmobranches and cetacean), size and carapace estimation techniques (Williams et al., 2015). Diver training included estimating distances underwater (e.g., visibility) by using the known size of the dive boat as a size guide. Most carapace length data were collected by trained marine research assistants using a laser photogrammetric system set up for sizing megafauna species underwater (whale sharks, manta rays, and turtles) (Rohner et al., 2011). While too few photogrammetric measurements were obtained for inclusion in this study, the equipment enabled two laser dots, set at 50 cm apart, to be projected onto the animal or nearby surface (i.e., benthos, cave wall), which the diver then used as a scale bar to estimate turtle size in the field. A number of these divers also assisted with sea turtle mortality studies, where they were trained to measure and report curved carapace length and curved carapace width of carapaces discarded from illegal take/use (on land).
Additionally to the dive logs, detailed turtle sighting sheets for the same study period were completed for each record (described in Williams et al., 2015). The turtle sighting sheets facilitated the collection of more detailed turtle behavior information and were designed to be submitted in coordination with the dive log, however duplicate records from different reporters, and positive bias issues occurred because each record was clearly identified to a particular dive log entry. Turtle sighting sheets were not used to evaluate sightings trends, however they did provide an additional subset of estimated curved carapace length (CL) (n total = 679) from the same study period for green, hawksbill (Eretmochelys imbricata), leatherback (Dermochelys coriacea), and loggerhead turtles, and for additional encounters not identified to species level. Where possible, dive log records were validated for species identification using photo-ID records submitted.
The mean turtle sighting rate per minute of diving was calculated from the dive log dataset. A Kruskal-Wallis chi-squared test was used to compare sighting rate among sites. Additional pairwise comparisons were made using Wilcoxon rank sum test to compare sightings rates among the four habitats.
Dive Log Analysis
Dive log data were used to construct a negative binomial generalized linear model (GLM) with natural splines using R (R Core Development Team, 2016), with turtle abundance set as the response variable. Due to limitations with sample sizes of loggerhead, green and unidentified turtles, species were pooled for this analysis and records of hawksbill (n = 11) and leatherback (n = 2) were removed from the dataset. Fifteen variables were investigated as possible predictors of turtle abundance (Table S1). To improve the model's predictive ability, the data range of some predictors were capped with minimum and maximum values (distance from shore ≥8 km; visibility ≥5 m, ≤25 m; max depth ≤29 m; average depth ≤22 m; and bottom surface temperature (BST) ≤18°C ≤27°C). The best-fitting model was conservatively assessed using a stepwise Akaike's Information Criterion (AIC) function with the default penalty per parameter set at k = 2, and a dropterm chi-squared function performed on the AIC-supported model. The significance of each predictor and their suitability for inclusion in the final model was selected using a chi-squared test (Venables and Ripley, 2002). In the model output figures, the y-axis is a relative scale, so that a y-value of zero is the mean effect of the adjusted predictor on the response; a positive y- value indicates a positive effect on the response; and a negative y-value indicates a negative effect on the response. If a horizontal line can be placed between the 95% confidence limits (dotted lines), this implies that the relationship between the response and the predictor is not significant. These lines tend to diverge near the extremes of the range for continuous predictors as a consequence of fewer observations. Kruskal-Wallis chi-squared and Wilcoxon rank sum test tests were used to perform multiple comparisons among levels of categorical predictors.
Photo-Identification Analysis
Detailed dive logs were coupled with photo submissions (April 2010–September 2015) of each turtle encounter if available, allowing confirmation of species. We used photo-ID to detect individual site preferences, residency patterns and movements. Photo-ID is based on the premise that each individual turtle can be reliably distinguished and recognized in subsequent encounters (Schofield et al., 2008; Jean et al., 2010; Dunbar et al., 2014). We adopted the TORSOOI system (TORtues marines du Sud-Ouest de l'Ocean Indien—Marine Turtles of the South West Indian Ocean: www.torsooi.com)1 to identify individual turtles by their facial scute patterns. This database system uses recognition software (described in detail by Jean et al., 2010) to compare and sort the photographs, presenting the top matched images in descending order of similarity. If the photograph showed clearly visible facial scutes, and the angle of the camera was within 20° of the side of the turtle's head, an encounter number was assigned to each record, and each encounter identified as a specific individual. Left and right facial profiles of each animal were visually inspected and classified using a three-digit code to describe each scute on the turtle's head, posterior from the eye to the neck, and from the line of the upper jaw to the top of the turtle's head, following Jean et al. (2010) (this process required < 2 min per profile). To our knowledge, the recognition software used in TORSOOI has only been tested within green and hawksbill turtles (Jean et al., 2010; Carpentier et al., 2016). Suitability for loggerheads, was tested by comparing manual visual identification against TORSOOI matching. Each encounter was visually coded and assigned individual identifications for the entire loggerhead dataset (approx. 10 min each). After this, we repeated the process using semi-automatic profile coding tool built into TORSOOI. Results between manual matching and TORSOOI were not significantly different, hence we report results based from the TORSOOI.
Sighting data for individual green and loggerhead turtles were used to assess the lagged identification rate (RLi), the probability of re-identifying known individual turtles over increasing time periods, here measured in days (Whitehead, 2001). While encounters of hawksbill turtles were reported, the photo-ID dataset was insufficient (n < 10) for population modeling. Using the movement module in SOCPROG 2.6 software (Whitehead, 2009), empirical data were compared to eight model scenarios representing both closed and open populations with various combinations of emigration, re-immigration and mortality, including permanent emigration (see Table S2 for model descriptions). Data were bootstrapped 100 times to generate standard errors for RLi and parameter estimates for the fitted models. Either the AIC (loggerhead turtles) or quasi-AIC (QAIC; green turtles) were used to select the best-fitting model/s for each species, with QAIC used due to over-dispersion of data (Whitehead, 2007).
Surface Encounters
GPS tracks of survey effort covered by dive boats (n = 2) of one dive operator were available from February 2012 to September 2015 for a subset of the total dive trips, with additional commercial snorkeling trip (ocean safari) records added to the dataset (n = 656 total tracks with a combined length of 28, 232 km and n = 138 turtle surface encounters). An active visual search for megafauna animals occurs on these trips to maximize the snorkel encounter opportunities with charismatic megafauna species. A comprehensive description on search pattern and vessel characteristics used for diving and ocean safaris can be found in Pierce et al. (2010). The dive operator frequently combined a double dive trip with an ocean safari which meant that animals were spotted on transit to dives and actively searched for in transects between dives. As noted in Pierce et al. (2010) searches were aided on the majority of trips by the use of a removable spotting chair, which raised a single observer to ~3 m above sea level to broaden the search corridor. The GPS track dataset was biased toward early morning (dive effort bias) and midday (ocean safari trips) rather than afternoon, however the bias dataset included search effort from all working hours (6 a.m.–5 p.m.). The study area was gridded into 500 × 500 m cells, and the total length of boat tracks within each cell were converted into area measurements by multiplying by the estimated effective search area, 30 m (we estimated this by proposing that 15 m on either side of the boat could be considered an appropriate yet conservative spotting distance to spot animals at the surface, which was successfully applied in field settings). Surface encounters were only reported when an animal was spotted, from the boat, on the surface. Turtle surface encounters were converted to daily presence/absence within each 500 × 500 m cell, and multiplied by daily search effort (area) to calculate sightings per unit effort (SPUE). Given that SPUE is not standardized for search time, or variability in boat speeds (dive boats used were not fitted with speedometer), this may lead to an overestimation of these sightings (Braun-McNeill and Epperly, 2002). As the search area and effort was consistent across years (Figure 1), SPUE is presented for the entire study period. All spatial analyses were conducted using Quantum GIS (v 2.14 Essen) (Quantum GIS Development Team, 2016).
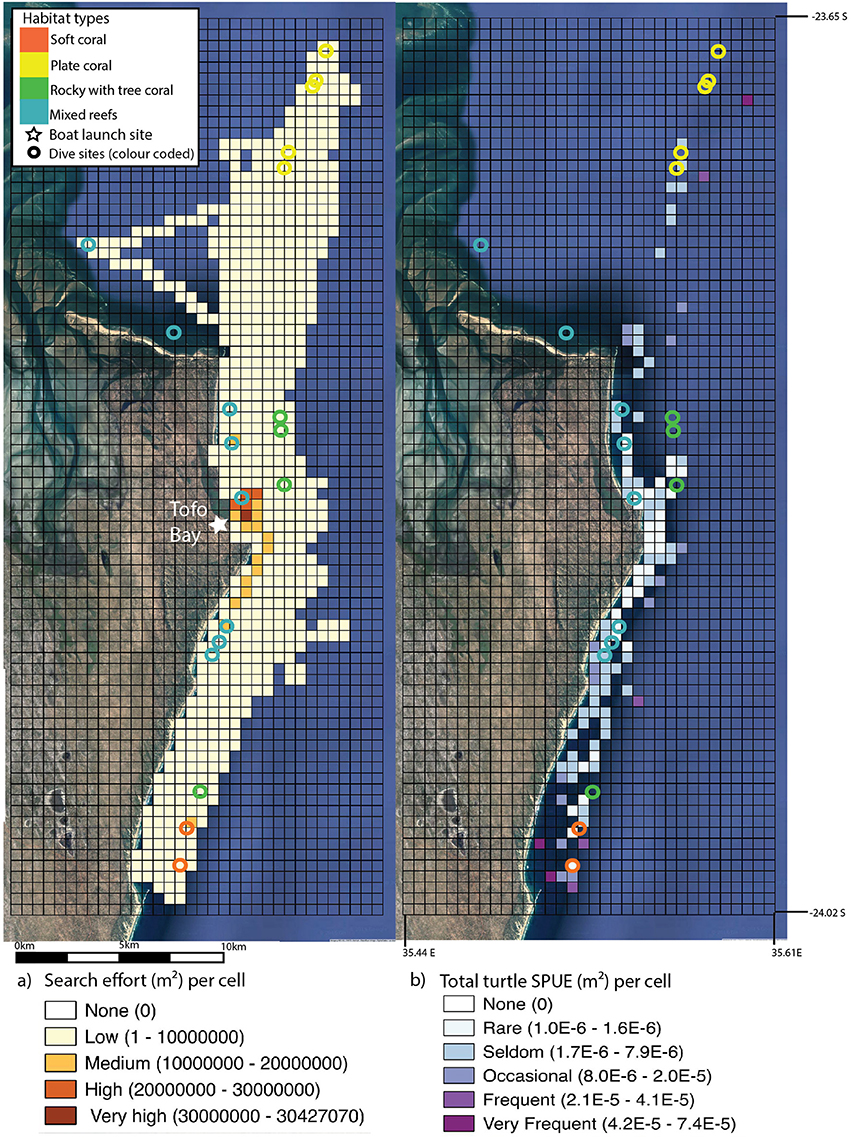
Figure 1. Search effort (insert a) (standardized in m2 and gridded into 500 × 500 m cells) from boat trips along the Inhambane coast, Mozambique. Area covered was estimated at 15 m on either side of the boat. Search effort, as estimated through total track length for each year, was similar: 2012 = 7336.05 km, 2013 = 8910.39 km, 2014 = 6391.73 km, and 2015 = 5593.36 km. Turtle surface encounters (insert b) per unit effort (SPUE) m2 of search effort conducted per 500 × 500 m grid cell, 2012–2015. Dive sites are overlaid onto both inserts (represented by open circles) and color coded according to four basic habitat types. Location of the boat launch site is marked on insert a. Imagery: Google Earth (2016).
Results
Dive Log Analysis
Dive effort was greatest in 2014 (n = 464) cf. 2011 (n = 71), 2012 (n = 256), 2013 (n = 321) and 2015 (n = 282). The mean monthly number of dive trips was 28 over the entire study duration, with a variation in effort dependent on year (2011 = 14, 2012 = 22, 2013 = 27, 2014 = 39, 2015 = 31). Minimum monthly dive effort was 10 dives and maximum monthly effort was 48 dives. Diving occurred all year and dive effort was not strongly influenced by seasons or seasonal weather (Dec-Feb mean = 70, Mar-May mean = 75, Jul- Aug mean = 74, Sep- Nov mean = 62). Data for the full 12 months were not available for analysis in 2011 (only commencing in Aug) or 2015 (data up to Sep) and this is likely to influence the effort/trends. Dive effort was biased toward the morning (n = 1015) rather than afternoon (n = 388), although afternoon dives were strongly biased toward shallow mixed habitat reefs. Mean depth of dives was 18.0 ± 0.1 m and mean horizontal underwater visibility was 13.4 ± 0.1 m. On 18% of dives visibility was suboptimal (i.e., ≥5 m ≤9 m (n = 254). Dive effort varied minimally (difference of 153 dives) between habitat type, with “soft coral” reefs the most frequently dived habitat (n = 423, 2 sites), “rocky sites with tree coral” (n = 377, 4 sites), “mixed” (n = 333, 8 sites) and least frequently dived were “plate coral” habitats (n = 270, 5 sites).
In total, 399 turtle sightings were reported across 1403 dives, over a period of 4 years and 2 months. Turtle sightings (mean sightings per minute of diving) were highly variable at each site and among dive sites (Figure 2) (Kruskal-Wallis chi-square = 30.1857, df = 3, p < 0.001). Patterns among habitat types and turtle sightings were less distinct. Although the “soft coral” habitat sites had the highest densities of turtles, the differences among the four habitat types were not significant. However, given that dive effort and turtle sightings were not consistent among sites (n = 17–311, Figure 2) we proceeded with inter-habitat pairwise comparisons using a Wilcoxon rank sum test. This identified significant differences in turtle density between the “mixed + soft” (p = 0.00059), “plate + soft” (p = 0.00621), and “soft + tree” (p = 1e-05) dive site groups where soft habitats had highest turtle sighting rates.
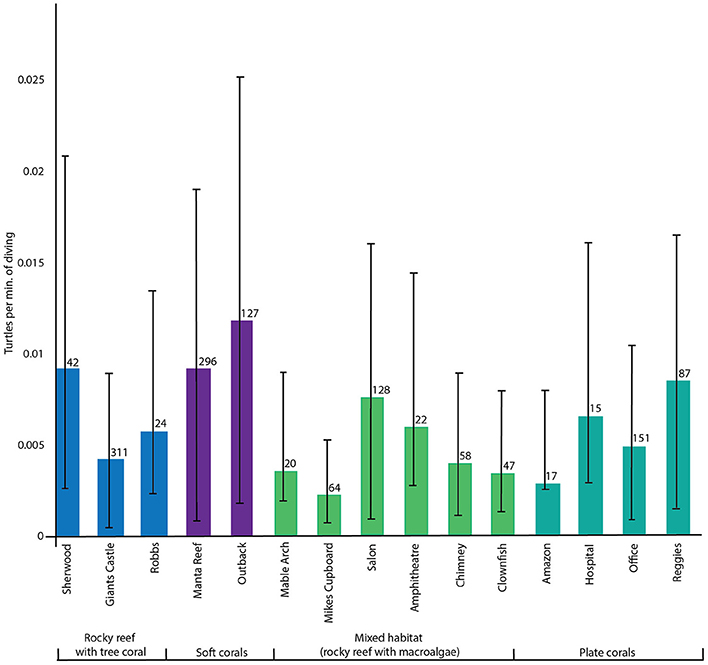
Figure 2. Mean turtle sightings per minute of diving for each dive site, sorted by habitat groupings, with standard error bars and dive effort.
Most turtle encounters reported by divers were identified to species level (88.5%). The sizes of turtles reported, variation in which could be indicative of reproductive immigration or emigration, did not correlate with day of the year. Varying size classes were reported throughout the year for all species. Mean carapace lengths for green and hawksbill turtles were similar at 0.7 m (green 0. 6 ± 0.2 and hawksbill 0.6 ± 0.2). Loggerheads were commonly reported at carapace lengths of 1 m (mean CL 0.8 ± 0.2). The range of size classes reported was greatest for green turtles (0.3–1.4 m, Figure 3.).
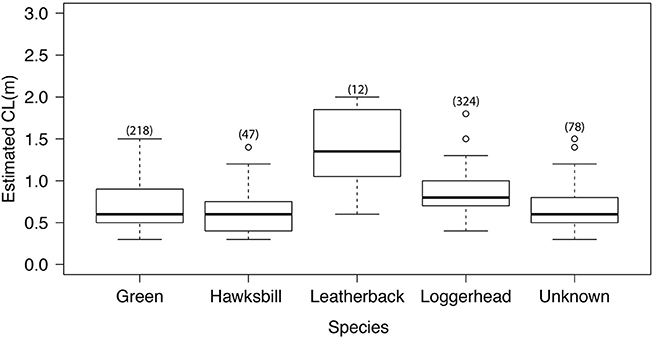
Figure 3. Estimated carapace length (CL), with species-specific n value in brackets. Linear descriptive statistics show range and spread CL data between the 25th and 75th percentiles, with the bold line representing the median and outliers plotted as circles.
The final GLM for turtle abundance had limited predictive power, explaining 8% of the total variance in turtle sightings. Five predictors were retained for the final model: year, day of the year, time of day, visibility and habitat type (Table S3). Year was a significant predictor of turtle sightings in the final GLM. Turtle abundance did not vary significantly through 2011–2015 (Kruskal-Wallis chi-squared = 4.8214, df = 4, p = 0.3061). A small inter-annual variation was present, with turtle abundance lowest in 2011 (Figure 4A). Sightings fluctuated through the year, with a peak occurring around day 250 (early September) and remaining high for the remainder of the calendar year even though seasonal dive effort was slightly higher during the autumn season (March to May) (Figure 4B). There was no obvious relationship between time of year and the size distribution of turtles present, so breeding-related migrations were not a likely contributor to this result (as above). Turtle sightings were highest in the soft coral habitat which also received the heaviest diving effort (Figure 4C). Time of day was a significant predictor of turtle abundance: afternoon dives (primarily shallow dives < 15 m) reported higher number of animals than morning dives, even though dive effort was ~2.5 times greater in the morning (Figure 4D). Underwater visibility was highly dynamic within seasons and years. Higher underwater visibility yielded higher turtle abundance (Figure 4E) and visibility was optimal (>9 m) on 82% of dives (n = 1403).
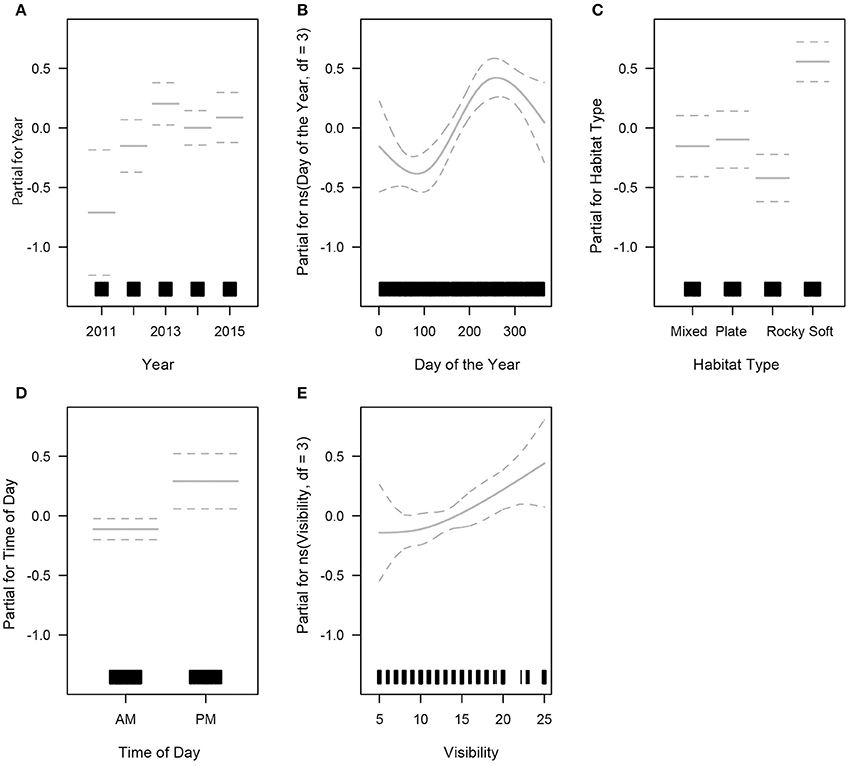
Figure 4. Generalised Linear Model outputs showing the relationship between sea turtle sightings (abundance) and all significant predictors. The rug plot along the x axis indicates sampling effort, and dotted lines indicate 95% confidence intervals (partial plots for; A- year, B- day of the year, C- habitat type, D- time of day, and E- visibility).
Photo-ID
A total of 1137 images (n = 323 encounters) were submitted to our photo-ID project by local researchers or citizen scientists between late 2010 and September 2015. The number of photos submitted varied per encounter, as did the subject area of each photograph (left or right facial scutes, carapace or some combination thereof). Citizen scientists also provided a small number of pictures taken between 2005 and 2010, before the project commenced. From these combined data we identified 22 individual green turtles and 42 loggerhead turtles (Figure S2). Most turtles were only seen once, and green turtles were more frequently re-sighted than loggerhead turtles (Figure S2).
Overall turtle encounter rate during the study period was low, with turtles sighted on only 24.1% of dives, at a sighting rate of 0.4 turtles per hour. Loggerheads were the most frequently sighted species at 0.2 turtles per hour (n = 210), but they had the lowest percentage of usable photos (i.e., identifiable to individual) submitted (51.7%). The majority of turtle encounters were identified to species (green n = 157, hawksbill n = 12, leatherback n = 2, unidentified species n = 23). Of 399 sea turtles observed, 80% had photo-ID encounters submitted (n = 323), of which 64% (n = 204) had scute patterns that could be coded out to determine individual identity. Although only a few hawksbill turtles were sighted (n = 12) these animals were easily photographed and 86.4% (n = 10) could be identified to a specific individual. Green turtle encounter also had a higher percentage of encounters where individual scute profiles could be distinguished (n = 125/157, 77.6%).
Loggerhead Turtle Site Residency and Lagged Identification Rate
Forty-two individual loggerhead turtles were identified from photographic encounters submitted between 2010 and 2015 (plus three additional encounters from 2007 to 2008). Only three of these individuals were re-sighted three (n = 2) and five (n = 1) times over the study (Figure S2). The longest time between sightings of a loggerhead turtle was 532 days for an adult individual. Of the eight models (Table S2), AIC results determined that models C and D (ΔAIC < 2) were the best fit, indicating that the population was best represented by an open population with some emigration and mortality (Table 1). There was no support for closed population models. The small sample size of this dataset means model outputs should be regarded as indicative rather than quantitative. Estimates of population size were low, and consistent between models C and D, with LIR decreasing to slightly above zero over time.
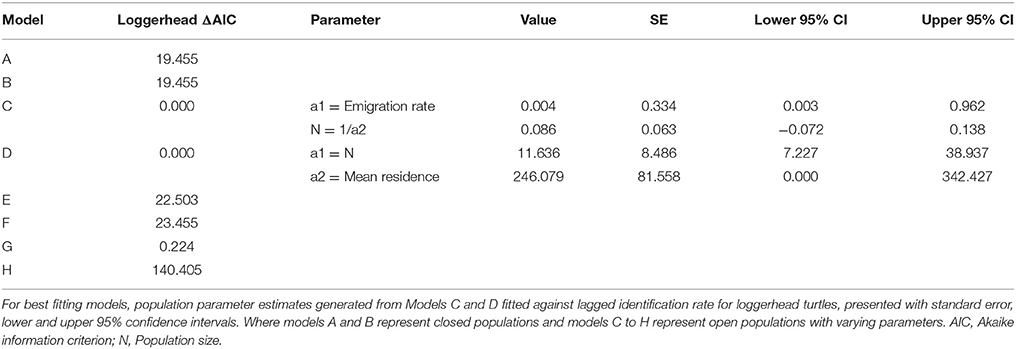
Table 1. Variation in AIC scores for the eight models fitted against the loggerhead turtle data.
Green Turtle Site Residency and Lagged Identification Rate
Twenty-two individual green turtles were identified and six were re-sighted more than twice. Resighted individuals were re-identified on 3 (n = 2), 5 (n = 1), 13 (n = 1), and 19 (n = 1) different occasions (Figure S2). Two individuals were re-sighted over periods of 2.5 and 3.2 years, respectively (Figure S2). The maximum time between first and last sightings for an individual was 1152 days, and this turtle was reported at two dive sites. Based on the slight differences in model fit (ΔQAIC <2; Table 2), three emigration and mortality models (C, D, and H) provided an equally valid representation of reality. There was no support for closed population models. The lagged identification rate for green turtles dropped sharply between days 1 and 6, then remained constant at slightly above zero thereafter.
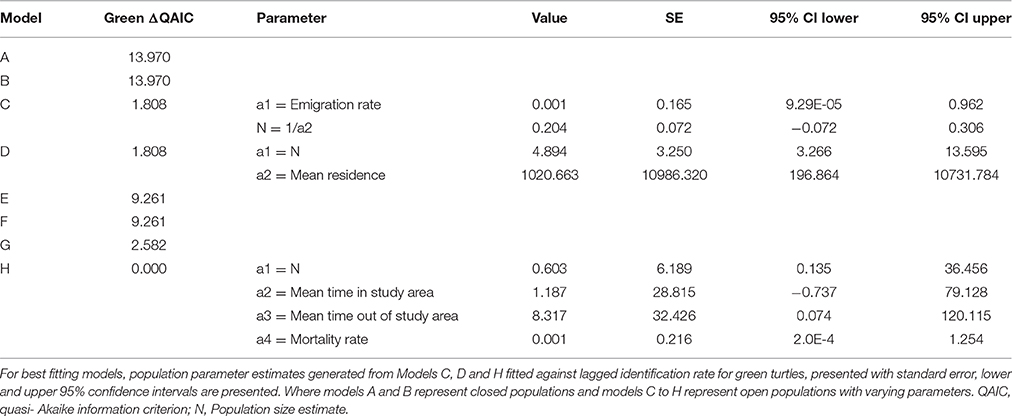
Table 2. Variation in QAIC scores for the eight models fitted against the green turtle data.
Surface Encounters
Boat search effort varied little, in effort or space, across years (Figure 1). The highest search effort across all years was in the inshore area surrounding the boat launching and landing site within Tofo Bay. Search effort was consistent from the northern to southern reefs. Sightings (turtles surface encounters per m2, SPUE) were low overall. Turtles were generally recorded in association with known reefs, as indicated by dive sites. The highest SPUE occurred close to dive sites in both northern and southern extremes of the study area (Figure 2). Search effort did not correlate with sightings and the area with the highest search effort, Tofo Bay, had the lowest SPUE.
Discussion
Our results confirm the year-round presence of sea turtles in the coastal waters and nearshore reefs of Praia do Tofo in southern Mozambique. However, both model analyses and encounter numbers indicate that the number of turtles present on these reef systems was low. In the Bazaruto Archipelago Marine National Park (BANP) (~250 km north), aerial surveys reported 154 turtles sighted over 5 days in May 2008 from a survey area of 174,900 ha (cf. 399 turtles reported in the 4-year Tofo dive log from survey area ~40,000 ha) (Provancha and Stolen, 2008). Their sightings suggest a significantly higher density of turtles occupy the nearshore coastal waters of BANP (4.85E-5 turtles h−1 per ha−1 Bazaruto cf. 9.45E-6 turtles h−1 per ha−1 Tofo). The greater turtle abundances reported in BANP may be attributed to two differing factors compared to Praia do Tofo; the area has extensive seagrass meadows which can support large numbers of turtles, and it receives some degree of protection and enforcement as marine protected area. Other areas still have many more turtles, such as algal dominated coral reef sites of the southern Great Barrier Reef, green turtle density was estimated at 0.45 turtles per ha (Chaloupka and Limpus, 2001).
Feeding behavior has been directly observed in green, loggerhead and hawksbill turtles in the area on dive encounters and within photo-ID encounters submitted (Williams et al., pers. observation). We can assume that the Praia do Tofo area is likely to be foraging grounds for juvenile turtles, however further evaluation of foraging behaviors specific to each species and age class are needed. No comparative studies from mainland coasts of the WIO region exist. However, daily abundance of foraging green turtles using seagrass beds and reef flats off Mayotte Island, Comoros is greater than at Tofo (Roos et al., 2005; Ballorain et al., 2010). From aerial surveys and snorkeling censuses, mean turtles per day were calculated at 32 (aerial survey) and 29 (snorkel surveys) (Roos et al., 2005). Adding to this, Ballorain et al. (2010) reports a turtle encounter rate on the seagrass meadows in N'Gouja Bay, Mayotte at 23.9 × 10⁻⁴ ± 10−4 turtles m−2. While their survey methods are not directly comparable to ours, the results suggest green turtle abundance was lower at Praia do Tofo (mean animals per day: 9.25E-10 turtles h−1 m−2) than at Mayotte, a significant year-round nesting rookery for green turtles (Dalleau et al., 2012) and a known foraging area (Ballorain et al., 2010).
Predictors of Turtle Abundance
Turtle abundance was not strongly influenced by the environmental, temporal or oceanographic variables tested in the GLM. Only 8% of the total variance in turtle abundance could be explained by the GLM, with five significant predictors. Three of these were temporal (year, day of the year and time of day), one oceanographic (visibility) and one environmental (habitat type). One additional spatial variable (dive site) was also a significant predictor of turtle abundance, but was removed from the final model due to a high standard error. Overall the GLM explained a low proportion of the variability in turtle abundance relative to studies on sympatric species. Rohner et al. (2013) documented that 40, 30, and 24% of total variance could be explained for sightings of reef manta rays (Manta alfredi), giant manta rays (M. birostris) and whale sharks (Rhincodon typus), respectively, within the same study area and from dive logbook data. Low model deviance (8.4%) of turtles and dugongs has also been noted in similar analyses in which oceanic conditions as predictors of megafauna assemblages were used to model aerial survey data at Ningaloo reef, Western Australia (Sleeman et al., 2007). While they reported a weak correlation between bathymetry and relative abundance, where animals were more abundant when a steep change in depth contour occurred (Sleeman et al., 2007), depth was not a significant predictor in our study. The low total variance explained by our model may have been influenced by the multi-specific nature of our analysis (sightings of two turtle species merged), or a high degree of independent behavior exhibited by turtles, as has been demonstrated from satellite tagged turtles (e.g., Papi et al., 1997; Hatase et al., 2002, 2006). Using models to predict and explain the distribution of marine megafauna and how it correlates with oceanographic or bathymetric variables is difficult (Polovina et al., 2004; Piatt et al., 2006; Sleeman et al., 2007). Further complications arise as these models struggle to account for the complexity of animal behavior, particularly predators (Sleeman et al., 2007). Abundance and distribution of turtles is likely to be influenced by a complex suite of factors, including oceanographic, bathymetric, habitat requirements for food and shelter, deterrents (artificial lighting, heavy anthropogenic use, and natural predators) and behavioral factors (conspecific competition, age class instincts). To improve our understanding, we would require higher resolution oceanographic data (spatial and temporal) coupled with long term species specific sightings records in which detailed behavioral information about habitat use and feeding habits is incorporated.
Diving effort was variable among reefs and on different trips to the same reef. Given that oceanic conditions in the area are dynamic and highly variable (i.e., strong currents, bad visibility, high surge), the total area of reef covered and direction the reef surveyed are dependent on ocean conditions. This may help to explain the variability in turtle sightings between successive trips to the same dive site, as it is possible that animals are present on a portion of the reef that does not get surveyed due to logistical restraints. In addition to this, the dive sites surveyed are part of an expansive chain of reefs that run parallel to the shore and regularly dived reefs comprise a small proportion of total reef area. It is possible that the home range of some of our photographed turtles does not occur in regularly surveyed areas, or that we have encountered animals in the periphery of their home ranges. Greens and loggerheads modify their home range both spatially and temporarily depending on resource availability, environmental conditions (e.g., temperature, depth, productivity of waters) or diurnal patterns (Luschi et al., 2006; Howell et al., 2010; Dalleau et al., 2014; Shimada, 2015; Christiansen et al., 2016; Varo-Cruz et al., 2016). The general behavioral-ecological model for Cheloniidae is a gradual shift from pelagic-vagile to benthic-sedentary lifestyle with progressive reduction of home ranges (Godley et al., 2008; Casale et al., 2012), with strong site fidelity evident in some populations (Shimada et al., 2016). Further investigation at our study site is needed to evaluate fine scale movements to investigate if seasonal patterns influenced by temperature (e.g., winter shifts) occur. Given the narrow width of the continental shelf along Inhambane Province, short forays between neritic into oceanic waters could be possible, similar to loggerheads in the Mediterranean, where favorable foraging grounds are exploited by opportunistic animals that use oceanic-neritic edges (Casale et al., 2012).
Some of the relationships among predictors and turtle sightings were intuitive, such as greater visibility resulting in a higher likelihood of observing turtles. Although turtles were present year-round, increased abundance of animals around the summer months could represent an influx to the area for the mating and nesting season (loggerheads or leatherbacks) even though recent (5 years) nesting effort in the immediate area has been minimal (<10 nests) (Fernandes et al., 2016). Average carapace size of first time nesters in the loggerhead South African rookery is 84 cm (Nel et al., 2013). Based on carapace length estimates supplied by citizen scientists the majority of in-water loggerhead encounters are of animals of this size or larger. However, we did not detect any changes in turtle size regardless of species over the course of the year.
Turtle sightings were significantly influenced by habitat type. Turtle densities were highest in the “soft coral” habitat types which were grouped in the south of the study area, in deeper waters (23–30 m). Turtle SPUE from surface encounters was also highest in the southern area in close proximity to these reefs. Abundance of turtles and surface encounter SPUE was also high in the north of the study area, where sites were largely the “plate coral” habitat type. The drivers of the increased abundance of turtles in these habitat types is unclear. In Gorgona National Park, Colombia atypical feeding behavior was described at mixed size foraging grounds of the east Pacific green turtle (Amorocho and Reina, 2007). They reported reefs comprising of hard and soft corals with sandy benthos and an absence of seagrass meadows, where turtles feed mainly on animal matter, with bias toward tunicates (Amorocho and Reina, 2007). If a similar feeding behavior was adopted by green turtle in the Praia do Tofo, this could explain why increased abundance was observed at “soft” and “plate” coral sites. We hypothesize that several factors (habitat quality, habitat diversity, food availability and SSF pressure) may influence the turtles to reside at these sites, rather than the inshore shallow sites, which are “mixed” habitat type. Fuentes et al. (2006) demonstrated clear dichotomy in juvenile green sea turtle diets foraging in seagrass meadows, patch reef and reef slope around Green Island in the Great Barrier Reef, Australia. They showed juveniles have strong preferences for either a seagrass or algal diet and that regular switches between diet preferences was possible (Fuentes et al., 2006). Turtles may have favored “plate” or “soft” coral habitat types, as it is possible these sites have greater quantities of macroalage or preferred variety of macroalgal species. Sea turtle abundance is unlikely to be homogeneously spread along our study area, and the spatial dataset found higher densities adjacent to the south and northern reefs. The reasons for this pattern are unclear. To elucidate this, we suggest spatial characterisation of the benthic habitats in the area be conducted to examine the relationship between habitat types and turtle sightings in detail. The Inhambane estuary system immediately adjacent to the north of our study area provides extensive shallow seagrass meadows. It is possible that turtle density is higher in these areas, or is more representative of the core habitat area of turtles using reefs in Praia do Tofo. To date, no work has been conducted in the area to determine if turtles of any species or size class exhibit avoidance behavior in the presence of either scuba divers or their boats, or artisanal fishers or their vessels.
Photo-Identification and Population Structure
Photo quality, as measured by the percentage of useable photos, varied among species. A higher proportion of identifiable photographs were obtained for green and hawksbill turtles relative to loggerheads. The former two species were generally encountered at shallower sites, where ambient light was higher, typically resulting in improved photos in instances where automated point-and-shoot cameras were used. Their facial scute patterns were also markedly more distinct than in most loggerheads. Although Jean et al. (2010) noted that specialist fieldwork and training was not required for successful photo-ID at Reunion Island, the comparatively low photo quality obtained in this study, and consequent low percentage of identifiable images, suggests that dedicated training could be of substantial benefit at this site. Such training could include the development of a series of guiding principles to aid recreational divers, or dive operators, to suitable photos for analysis, conducting practice sessions with models, suggested camera settings, and explaining the best way to approach turtles without initiating a flight response (Williams et al., 2015).
We identified 42 loggerhead and 22 green turtle individuals. Population estimates for both species were small, and encounter rates per dives were only around 24%. However, this was an increase from 8.1% in earlier work in the same area (Williams et al., 2015). We think that the higher rate reported here is more reflective of reality, as the new estimates are based on a significantly larger presence-absence dive log (n = 720 vs. 1425). A similar style of population modeling based on photo-ID of green turtles was conducted in the Philippines (Araujo et al., 2016). Araujo et al. (2016) also present similarly low resighting rates in the majority of their animals encountered. The limited sample sizes available likely mean that mark-recapture model results are more indicative than precise, although the relative daily population estimates (11.6 loggerheads and 4.9 green turtles) do suggest that proportionally more loggerheads were present.
A caveat of photo-ID studies has been the lack of long-term validation for the persistence of scute and scale shapes and colors across decades (Goodman-Hall and McNeill, 2013). The longest period of time over which we re-identified an individual was 1.4 years for an adult loggerhead, and 3.1 years for a juvenile/sub adult green. Other studies have re-identified individuals 3, 4 and 6 and 11 years later (Reisser et al., 2008; Jean et al., 2010; Goncalves and Loureiro, 2013; Carpentier et al., 2016, respectively). For greens there is some evidence to suggest facial scale stability exists, although pigmentation patterns can change (Féliz et al., 2010; Araujo et al., 2016; Carpentier et al., 2016). Long-term photo series from known individuals are required to quantify the rates and implications of changes to facial scales, but we think it is reasonable to assume that facial scutes remain stable over the 5-year period discussed here. A caveat to consider is that low resightings rates in loggerheads may be an artifact of identification tool (i.e., lack of suitability in TORSOOI to accurately identify individual loggerhead turtles). To avoid this, visual comparison and manual identification was undertaken for the entire loggerhead dataset and we feel TORSOOI suitably recognized unique details of facial patterns to assign loggerhead identifications. Robust methods testing of the application of this tool for loggerheads would confirm any doubts for future work.
Perception and Availability Bias
Our data also highlight the need to understand perception and availability bias when using observation based monitoring and citizen science for sea turtle monitoring (Pollock et al., 2006). In particular, we found that photo quality varied across species and was also likely to be influenced by depth (of the diver and turtle) and water visibility. Coupled with this, the GLM indicated that sightings and abundance were linked to several factors that relate more to when and where turtles are available such as time of day or year. Imperfect detection is known as availability bias and can be addressed by experimentally assessing sightability under a variety of environmental conditions. Perception bias could be linked to expertise or experience. Understanding the influence of bias, such as availability and perception, in citizen science based species monitoring is a key question for future research.
Movement Patterns
Green turtles, with a modeled mean residency time of 1021 days, were present on Inhambane reefs for longer periods of time than loggerhead turtles, which had a mean residency of 246 days. A small number of green turtles demonstrated strong site fidelity, with some individuals resighted between 13 and 19 times at a single dive site over the duration of the study. Dive log data identified most of these individuals to be juveniles. Juvenile green turtles have been well-documented to be resident in shallow coastal waters (Ballorain et al., 2010; Meylan et al., 2011; Scott et al., 2012). Thus, the likelihood of encountering resident animals in their home range can be relatively high. In contrast, although loggerhead turtles were more frequently encountered than greens (0.20 and 0.15 turtles per hour, respectively), they were rarely resighted. Dive log data showed that curved carapace size classes of ≥70 cm were present, suggesting that both sub-adult and adult loggerheads use the area. We advise some caution in interpreting the carapace length data presented, as it is estimates rather than measurements and future work should adopt more precise estimation techniques (described in Houghton et al., 2003) or continue to expand and evaluate the laser photogrammetry dataset. Several accounts exist of post-nesting loggerhead turtles using neritic waters of Mozambique (Hughes, 1974; Luschi et al., 2006; Pereira et al., 2014). Fidelity to these post-nesting foraging grounds and the migratory routes used to reach them have been reported from other loggerhead populations (Schofield et al., 2010). Pereira et al. (2014) documented the variability of foraging destination in northward post-nesting migrations (potentially shuttling migrations described in Luschi et al., 2006) from three satellite tracked female loggerhead turtles swimming from natal beaches in the Ponta D'Ouro Marine Partial Reserve in the extreme south of Mozambique. One animal traveled north into Macaneta and Xai Xai, an area Pereira et al. (2014) believed to be its resident foraging ground (250 km south of present study area). Dangers of artisanal fisheries interactions were also evident in the second animal which was caught by turtle hunters 20 km south of Praia do Tofo (Pereira et al., 2014). Some mature loggerhead turtles may therefore have permanent feeding grounds in coastal waters within Inhambane Province, with others being transient visitors returning to natal beaches or on their way to more distant feeding grounds (e.g., Tanzania, Madagascar) (Luschi et al., 2006; Pereira et al., 2014). The data types used in our study give a general indication of site fidelity and movements, but the absence of fine scale spatial and temporal data prohibits the calculation of reliable estimates of home ranges. Acoustic and satellite tagging of animals using this area would be a logical next step for progressing our knowledge of habitat use and movements.
Potential Interactions with Small-Scale Fisheries
Sea turtle populations near Praia do Tofo are small. Given the year-round presence of turtles documented here, their abundance in shallow (<35 m) nearshore reef areas, and the long residency periods of some individuals, we speculate that these turtles are highly susceptible to capture by SSF, either as bycatch or as illegal target species. Resighting rates, particularly of loggerhead turtles, were low. Population models indicated a high degree of movement into and out of the area. We are unable to ascertain if low resightings are due to high transient behaviors or if high mortality rates from SSF occurs in our study area or the surrounding region. Our unpublished data from the area has documented regular mortalities (n = 353, 2009-2016) from targeted hunting and bycatch from artisanal fisheries (Williams et al., in preparation). This number of dead turtles is on par with the number of live turtles we report, suggesting that SSF could be serious threat to turtles in this region. Rates of illegal take and use are suspected to be high within Mozambique (Louro et al., 2006) and within the SWIO all sea turtle species are highly vulnerable to artisanal fisheries bycatch (Bourjea et al., 2008; Kiszka, 2012; Bourjea, 2015). It is unclear whether the low population density in the area is a consequence of this hunting over the past decades, but future comparison with areas with lower contemporary anthropogenic pressure would be useful. Broadening citizen science data collection to include the activity of fishers would be particularly valuable.
Conclusions
We synthesized three different data types to reveal novel information on the nearshore habitat use, abundance and distribution of green and loggerhead sea turtles in the Praia do Tofo area in southern Mozambique. Both species use the area year-round, as a foraging ground for some immature green turtles and transient habitat for other life stages. Modeled population sizes, surface encounter and dive encounter rates all suggest that the contemporary turtle population in the area is small. However, limitations to our methodology prevent accurate assessment of abundance and the opportunistic nature of data collection have limited a robust evaluation of spatio-temporal patterns. While sightings trends were stable over the limited time series of the available datasets, they were also very low and we are thus concerned that high fishing and hunting pressure on these inshore reefs is a likely threat to these local sea turtle populations (Louro et al., 2006). Human impacts are likely to be higher on green turtles, which are more resident than loggerhead turtles, but the relatively higher number of loggerheads sighted means that fishing-derived mortality here could also have broader impacts on the Western Indian Ocean stock of the species.
Author Contributions
JW designed the study with SP, MH, and MF. JW conducted the fieldwork. JW analyzed the data with advice from CR, SP, MF, and MH. JW wrote the manuscript with editorial support from all authors.
Conflict of Interest Statement
The authors declare that the research was conducted in the absence of any commercial or financial relationships that could be construed as a potential conflict of interest.
The reviewer GS and handling Editor declared their shared affiliation, and the handling Editor states that the process nevertheless met the standards of a fair and objective review.
Acknowledgments
This project was approved through the animal ethics committee of James Cook University (Australia), permit number A1862. No animals were harmed or injured during the course of this study. This is the 6th publication in the series from the All Out Africa (AOA) Marine Research Unit. Sincere thanks go to the project coordinators (past and present) and marine volunteers from AOA, and the research staff of the Marine Megafauna Association who contributed to collection of the dive log datasets and submitted photo-ID encounters. Special thanks must be made to K. Reeve-Arnold and R. Newbigging for collecting the spatial dataset and to T. Salter for assisting in data formatting of dive log dataset. Many thanks are extended to all the divers and dive staff who contributed data. Idea Wild supported this project by providing underwater and laser photogrammetry equipment to advance the data collection methods. Rufford Small Grants supported JW work on illegal take and SSF. SP and CR participation in this work was supported by two private trusts.
Supplementary Material
The Supplementary Material for this article can be found online at: http://journal.frontiersin.org/article/10.3389/fmars.2016.00288/full#supplementary-material
Footnotes
1. ^TORSOOI (2015). Sea turtles photo identification protocol – 2015 TORSOOI/Kelonia/IFREMER.
References
Alfaro-Shigueto, J., Mangel, J. C., Pajuelo, M., Dutton, P. H., Seminoff, J. A., and Godley, B. J. (2010). Where small can have a large impact: structure and characterization of small-scale fisheries in Peru. Fish. Res. 106, 8–17. doi: 10.1016/j.fishres.2010.06.004
Amorocho, D. F., and Reina, R. D. (2007). Feeding ecology of the East Pacific green sea turtle Chelonia mydas agassizii at Gorgona National Park, Colombia. Endanger. Species Res. 3, 43–51. doi: 10.3354/esr003043
Araujo, G., Montgomery, J., Pahang, K., Labaja, J., Murray, R., and Ponzo, A. (2016). Using minimally invasive techniques to determine green sea turtle Chelonia mydas life-history parameters. Exp. Mar. Biol. Ecol. 483, 25–30. doi: 10.1016/j.jembe.2016.06.004
Ballorain, K., Ciccione, S., Bourjea, J., Grizel, H., Enstipp, M., and Georges, J. Y. (2010). Habitat use of a multispecific seagrass meadow by green turtles Chelonia mydas at Mayotte Island. Mar. Biol. 157, 2581–2590. doi: 10.1007/s00227-010-1520-7
Béné, C. (2006). Small-Scale Fisheries: Assessing Their Contribution to Rural Livelihoods in Developing Countries. Rome: FAO Fisheries Circular No. 1008 FIPL/C1008 (En).
Block, B. A., Jonsen, I. D., Jorgensen, S. J., Winship, A. J., Shaffer, S. A., Bograd, S. J., et al. (2011). Tracking apex marine predator movements in a dynamic ocean. Nature 475, 86–90. doi: 10.1038/nature10082
Bolten, A. B., and Witherington, B. E. (eds.). (2003). Loggerhead Sea Turtles. Washington, DC: Smithsonian Books.
Bourjea, J., Lapegue, S., Gagnevin, L., Broderick, D., Mortimer, J. A., Ciccione, S., et al. (2007). Phylogeography of the green turtle, Chelonia mydas, in the Southwest Indian Ocean. Mol. Ecol. 16, 175–186. doi: 10.1111/j.1365-294X.2006.03122.x
Bourjea, J., Mortimer, J. A., Garnier, J., Okemwa, G., Godley, B. J., Hughes, G., et al. (2015). Population structure enhances perspectives on regional management of the western Indian Ocean green turtle. Conserv. Genet. 16, 1069–1083. doi: 10.1007/s10592-015-0723-3
Bourjea, J., Nel, R., Jiddawi, N. S., Koonjul, M. S., and Bianchi, G. (2008). Sea turtle bycatch in the West Indian Ocean: review, recommendations and research priorities. Western Indian Ocean J. Mar. Sci. 7, 137–150. Available online at: https://www.researchgate.net/profile/Jerome_Bourjea/publication/232416462_Sea_Turtle_Bycatch_in_the_West_Indian_Ocean_Review_Recommendations_and_Research_Priorities/links/0fcfd5084d77cf235a000000.pdf
Bourjea, J. (2015). “Sea turtles; a review of status, distribution and interaction with fisheries in the Southwest Indian Ocean,” in Offshore Fisheries of the Southwest Indian Ocean: Their Status and the Impact on Vulnerable Species, eds R. P. Van der Elst and B. I. Everett (Durban: Oceanographic Research Institute, Special Publication, 10. 448 pp. Chap. 9), 325–349.
Bowen, B. W., and Karl, S. A. (2007). Population genetics and phylo- geography of sea turtles. Mol. Ecol. 16, 4886–4907. doi: 10.1111/j.1365-294X.2007.03542.x
Braun-McNeill, J., and Epperly, S. P. (2002). Spatial and temporal distribution of sea turtles in the western North Atlantic and the US Gulf of Mexico from Marine Recreational Fishery Statistics Survey (MRFSS). Mar. Fish. Rev. 64, 50–56.
Broderick, A. C., Coyne, M. S., Fuller, W. J., Glen, F., and Godley, B. J. (2007). Fidelity and over-wintering of sea turtles. Proc. R. Soc. Lond. B Biol. Sci. 274, 1533–1539. doi: 10.1098/rspb.2007.0211
Carpentier, A. S., Jean, C., Barret, M., Chassagneux, A., and Ciccione, S. (2016). Stability of facial scale patterns on green sea turtles Chelonia mydas over time: a validation for the use of a photo-identification method. J. Exp. Mar. Biol. Ecol. 476, 15–21. doi: 10.1016/j.jembe.2015.12.003
Casale, P., Broderick, A. C., Freggi, D., Mencacci, R., Fuller, W. J., Godley, B. J., et al. (2012). Long-term residence of juvenile loggerhead turtles to foraging grounds: a potential conservation hotspot in the Mediterranean. Aquat. Conserv. Mar. Fresh. Ecosyst. 22, 144–154. doi: 10.1002/aqc.2222
Chaloupka, M., and Limpus, C. (2001). Trends in the abundance of sea turtles resident in southern Great Barrier Reef waters. Biol. Conserv. 102, 235–249. doi: 10.1016/S0006-3207(01)00106-9
Christiansen, F., Putman, N., Farman, R., Parker, D., Rice, M., Polovina, J., et al. (2016). Spatial variation in directional swimming enables juvenile sea turtles to reach and remain in productive waters. Mar. Ecol. Prog. Ser. 557, 247–259. doi: 10.3354/meps11874
Dalleau, M. (2013). Spatial Ecology of Marine Turtles in the South- West Indian Ocean: Conservation Insights from Remote Sensing and Modeling. Doctoral thesis, University of Reunion Island.
Dalleau, M., Benhamou, S., Sudre, J., Ciccione, S., and Bourjea, J. (2014). The spatial ecology of juvenile loggerhead turtles (Caretta caretta) in the Indian Ocean sheds light on the “lost years” mystery. Mar. Biol. 161, 1835–1849. doi: 10.1007/s00227-014-2465-z
Dalleau, M., Ciccione, S., Mortimer, J. A., Garnier, J., Benhamou, S., and Bourjea, J. (2012). Nesting phenology of marine turtles: insights from a regional comparative analysis on green turtle (Chelonia mydas). PLoS ONE 7:e46920. doi: 10.1371/journal.pone.0046920
Dunbar, S., Ito, H., Bahjri, K., Dehom, S., and Salinas, L. (2014). Recognition of juvenile hawksbills Eretmochelys imbricata through face scale digitization and automated searching. Endanger. Species Res. 26, 137–146. doi: 10.3354/esr00637
Féliz, P., León, Y. M., Revuelta, O., Aucoin, S., Sofia, D., and Carreras, R. (2010). “Photo-identification of juvenile hawksbills using facial scales,” in Proceedings of the 30th Annual Symposium on Sea Turtle Biology and Conservation, Goa, India, eds J. Blumental, A. Panagopoulou, and A. Rees, NOAA Technical Memorandum NMFS-SEFC (Florida, FL: NOAA).
Fernandes, R. S. (2015). Estrutura da População Nidificante de Tartarugas Cabeçudas (Caretta caretta). na Reserva Marinha Parcial da Ponta do Ouro, sul de Moçambique. Tese de Mestrado, Universidade Eduardo Mondlane, 139 pp. Maputo.
Fernandes, R. S., Williams, J., and Trindade, J. (2016). Monitoring, Tagging and Conservation of Marine Turtles in Mozambique: Annual Report 2015/16. Maputo, CTV.
Francis, J., Mahongo, S., Semesi, A., Muhando, C., Mgaya, Y., Daffa, J., et al. (2001). Eastern Africa Atlas of Coastal Resources: Tanzania. Nairobi: UNEP.
Fuentes, M., Lawler, I. R., and Gyuris, E. (2006). Dietary preferences of juvenile green turtles (Chelonia mydas) on a tropical reef flat. Wildl. Res. 33, 671–678. doi: 10.1071/WR05081
Garnier, J., Hill, N., Guissamulo, A., Silva, I., Witt, M., and Godley, B. (2012). Status and community-based conservation of marine turtles in the northern Querimbas Islands (Mozambique). Oryx 46, 359–367. doi: 10.1017/S0030605311001566
Gerber, L. R., and Heppell, S. S. (2004). The use of demographic sensitivity analysis in marine species conservation planning. Biol. Conserv. 120, 121–128. doi: 10.1016/j.biocon.2004.01.029
Gilman, E., Gearhart, J., Price, B., Eckert, S., Milliken, H., Wang, J., et al. (2009). Mitigating sea turtle by-catch in coastal passive net fisheries. Fish Fish. 11, 57–88. doi: 10.1111/j.1467-2979.2009.00342.x
Godley, B. J., Blumenthal, J. M., Broderick, A. C., Coyne, M. S., Godfrey, M. H., Hawkes, L. A., et al. (2008). Satellite tracking of sea turtles: where have we been and where do we go next? Endanger. Species Res. 4, 3–22. doi: 10.3354/esr00060
Godley, B. J., Lima, E. H. S. M., Åkesson, S., Broderick, A. C., Glen, F., Godfrey, M. H., et al. (2003). Movement patterns of green turtles in Brazilian coastal waters described by satellite tracking and flipper tagging. Mar. Ecol. Prog. Ser. 253, 279–288. doi: 10.3354/meps253279
Goncalves, B. T., and Loureiro, N. S. (2013). “Advances in sea turtle photo identification. A case study carried out at the marine biological reserve of Arvoredo, Brazil,” in Proceedings of the 33m Annual Symposium on Sea Turtle Biology and Conservation, eds T. Tucker, L. Belskis, A. Panagopou- lou, A. Rees. M. Frick, K. Williams, R. LeRoux, and K. Stewart (Baltimore, MD: U.S. Dept. Commerce NOAA Tech. Memo.), 225.
Goodman-Hall, A., and McNeill, J. B. (2013). Inferring sea turtle recapture rates using photographic identification. Herpetol. Rev. 44, 561–596. Available online at: https://www.researchgate.net/profile/April_Hall2/publication/268745773_Inferring_sea_turtle_recapture_rates_using_photographic_identification/links/5474e4ba0cf245eb436e5677.pdf
Hamann, M., Godfrey, M., Seminoff, J., Arthur, K., Barata, P., Bjorndal, K., et al. (2010). Global research priorities for sea turtles: informing management and conservation in the 21st century. Endanger. Species Res. 11, 245–269. doi: 10.3354/esr00279
Hamann, M., Kamrowski, R., and Bodine, T. (2013). Assessment of the Conservation Status of the Loggerhead Turtle in the Indian Ocean and South-East Asia. IOSEA Species Assessment Volume II, Indian Ocean – South-East Asian Marine Turtle Memorandum of Understanding. Bangkok: IOSEA Marine Turtle MoU Secretariat.
Hatase, H., Sato, K., Yamaguchi, M., Takahashi, K., and Tsukamoto, K. (2006). Individual variation in feeding habitat use by adult female green sea turtles (Chelonia mydas): are they obligately neritic herbivores? Oecologia 149, 52–64. doi: 10.1007/s00442-006-0431-2
Hatase, H., Takai, N., Matsuzawa, Y., Sakamoto, W., Omuta, K., Goto, K., et al. (2002). Size-related differences in feeding habitat use of adult female loggerhead turtles Caretta caretta around Japan determined by stable isotope analyses and satellite telemetry. Mar. Ecol. Prog. Ser. 233, 273–281. doi: 10.3354/meps233273
Hawkes, L. A., Broderick, A. C., Coyne, M. S., Godfrey, M. H., Lopez-Jurado, L. F., Lopez-Suarez, P., et al. (2006). Phenotypically linked dichotomy in sea turtle foraging requires multiple conservation approaches. Curr. Biol. 16, 990–995. doi: 10.1016/j.cub.2006.03.063
Hays, G. C., Ferreira, L. C., Sequeira, A. M., Meekan, M. G., Duarte, C. M., Bailey, H., et al. (2016). Key questions in marine megafauna movement ecology. Trends Ecol. Evol. (Amst). 31, 463–475. doi: 10.1016/j.tree.2016.02.015
Hays, G. C., Fossette, S., Katselidis, K. A., Mariani, P., and Schofield, G. (2010). Ontogenetic development of migration: lagrangian drift trajectories suggest a new paradigm for sea turtles. J. R. Soc. Interface 7, 1319–1327. doi: 10.1098/rsif.2010.0009
Hays, G. C., Mortimer, J. A., Ierodiaconou, D., and Esteban, N. (2014). Use of long-distance migration patterns of an endangered species to inform conservation planning for the world's largest marine protected area. Conserv. Biol. 26, 1636–1644. doi: 10.1111/cobi.12325
Hays, G. C., and Scott, R. (2013). Global patterns for upper ceilings on migration distance in sea turtles and comparisons with fish, birds and mammals. Funct. Ecol. 27, 748–756. doi: 10.1111/1365-2435.12073
Heppell, S. S., Snover, M. L., and Crowder, L. B. (2003). “Sea turtle population ecology,” in The Biology of Sea Turtles, Vol 2., eds P. L. Lutz, J. Musick, and J. Wyneken (Boca Raton, FL: CRC Press), 275.
Houghton, J. D., Callow, M. J., and Hays, G. C. (2003). Habitat utilization by juvenile hawksbill turtles (Eretmochelys imbricata, Linnaeus, 1766) around a shallow water coral reef. J. Nat. Hist. 37, 1269–1280. doi: 10.1080/00222930110104276
Howell, E., Dutton, P., Polovina, J., Bailey, H., Parker, D., and Balazs, G. (2010). Oceanographic influences on the dive behavior of juvenile log- gerhead turtles (Caretta caretta) in the North Pacific Ocean. Mar. Biol. 157, 1011–1026. doi: 10.1007/s00227-009-1381-0
Hughes, G. R. (1974). The Sea Turtles of South-East Africa. Durban: Oceanographic Research Institute.
Humber, F., Godley, B. J., Ramahery, V., and Broderick, A. C. (2011). Using community members to assess artisanal fisheries: the marine turtle fishery in Madagascar. Anim. Conserv. 14, 175–185. doi: 10.1111/j.1469-1795.2010.00413.x
IFAD (2011). Republic of Mozambique, country strategic opportunities project. Technical report EB 2011/103/R.13.
Jean, C., Ciccione, S., Talma, E., Ballorain, K., and Bourjea, J. (2010). Photo-identification method for green and hawksbill turtles—first results from Reunion. Indian Ocean Turtle Newslett. 11, 8–13. Available online at: http://www.iotn.org/wp-content/uploads/2015/09/IOTN11.pdf#page=10
Kiszka, J. (2012). Bycatch Assessment of Vulnerable Megafauna in Coastal Artisanal Fisheries in the Southwest Indian Ocean. Final Report, South West Indian Ocean Fisheries Project (SWIOFP), 113.
Koch, V., Nichols, W. J., Peckham, H., and De La Toba, V. (2006). Estimates of sea turtle mortality from poaching and bycatch in Bahía Magdalena, Baja California Sur, Mexico. Biol. Conserv. 128, 327–334. doi: 10.1016/j.biocon.2005.09.038
Lauret-Stepler, M., Bourjea, J., Roos, D., Pelletier, D., Ryan, P. G., Ciccione, S., et al. (2007). Reproductive seasonality and trend of Chelonia mydas in the SW Indian Ocean: a 20 yr study based on track counts. Endanger. Species Res. 3, 217–227. doi: 10.3354/esr003217
Limpus, C. J., and Limpus, D. J. (2001). The loggerhead turtle, Caretta caretta, in Queensland: breeding migrations and fidelity to a warm temperate feeding area. Chelonian Conserv. Biol. 4, 142–153.
Louro, C., and Fernandes, R. (2012). Monitoring, Tagging and Conservation of Marine turtles in Mozambique: Annual Report 2012/12. Maputo, Centro Terra Viva.
Louro, C. M. M., Pereira, M. A. M., and Costa, A. C. D. (2006). Report on the Conservation Status of Marine Turtles in Mozambique. Ministerio para a Coordenação da Ação Ambiental, Maputo, 44.
Luschi, P., Hays, G. C., and Papi, F. (2003). A review of long-distance movements by marine turtles, and the possible role of ocean currents. Oikos 103, 293–302. doi: 10.1034/j.1600-0706.2003.12123.x
Luschi, P., Lutjeharms, J. R., Lambardi, P., Menacacci, R., Hughes, G. R., and Hays, G. C. (2006). A review of migratory behaviour of sea turtles off southeastern Africa. S. Afr. J. Sci. 102, 51–58.
Mancini, A., Koch, V., Seminoff, J., and Madon, B. (2011). Small-scale gill-net fisheries cause massive green turtle Chelonia mydas mortality in Baja California Sur, Mexico. Oryx 46, 69–67. doi: 10.1017/S0030605310001833
Menezes, A., Eide, A., and Raakjær, J. (2011). “Moving out of Poverty: conditions for wealth creation in small-scale fisheries in mozambique,” in Poverty Mosaics: Realities and Prospects in Small-Scale Fisheries, eds S. Jentoft and A. Eide (Dordrecht: Springer), 407–425.
Meylan, P. A., Meylan, A. B., and Gray, J. A. (2011). The ecology and migrations of sea turtles 8. Tests of the developmental habitat hypothesis. Bul. Am. Museum Nat. His. 357, 1–70. doi: 10.1206/357.1
Musick, J. A., and Limpus, C. J. (1997). Habitat Utilization and Migration in Juvenile Sea Turtles. Chapter 6. The Biology of Sea Turtles. Boca Raton, FL: CRC Press.
Nel, R., and Casale, P. (2015). Caretta Caretta (South West Indian Ocean Subpopulation). The IUCN Red List of Threatened Species. Cambridge: IUCN Global Species Programme Red List Unit.
Nel, R., Punt, A. E., and Hughes, G. R. (2013). Are coastal protected areas always effective in achieving population recovery for nesting sea turtles? PLoS ONE 8:e63525. doi: 10.1371/journal.pone.0063525
Papi, F., Luschi, P., Crosio, E., and Hughes, G. R. (1997). Satellite tracking experiments on navigational ability and migratory behaviour of the loggerhead turtle Caretta caretta. Mar. Biol. 129, 215–220. doi: 10.1007/s002270050162
Pereira, M. A. M., Videira, E. J. S., Gonçalves, P. M. B., and Fernandes, R. (2014). Post-nesting migration of Loggerhead turtles (Caretta caretta) from Southern Mozambique. Afr. Sea Turtle Newslett. 1, 48–51. doi: 10.13140/2.1.2092.5766
Piatt, J. F., Wetzel, J., Bell, K., DeGange, A. R., Balogh, G. R., Drew, G. S., et al. (2006). Predictable hotspots and foraging habitat of the endangered short-tailed albatross (Phoebastria albatrus) in the North Pacific: implications for conservation. DeepSea Res. Part II Top. Stud. Oceanogr. 53, 387–398. doi: 10.1016/j.dsr2.2006.01.008
Pierce, S. J., Méndez-Jiménez, A., Collins, K., and Rosero-Caicedo, M. (2010). Developing a code of conduct for whale shark interactions in Mozambique. Aquat. Conserv. Mar. Fres. Ecosyst. 20, 782–788. doi: 10.1002/aqc.1149
Pollock, K. H., Marsh, H. D., Lawler, I. R., and Alldredge, M. W. (2006). Estimating animal abundance in heterogeneous environments: an application to aerial surveys for dugongs. J. Wildl. Manage. 70, 255–262. doi: 10.2193/0022-541X(2006)70[255:EAAIHE]2.0.CO;2
Polovina, J. J., Balazs, G. H., Howell, E. A., Parker, D. M., Seki, M. P., and Dutton, P. H. (2004). Forage and migration habitat of loggerhead (Caretta caretta) and olive ridley (Lepidochelys olivacea) sea turtles in the central North Pacific Ocean. Fish. Oceanogr. 13, 36–51. doi: 10.1046/j.1365-2419.2003.00270.x
Provancha, J. A., and Stolen, E. D. (2008). Dugong aerial Survey Report, May 25–29, 2008. Bazaruto Archipelago National Park, Inhambane Province, Mozambique. Final report for WWF. Dynamac Corporation Kennedy Space Center, FL, U.S.A. 29.
Quantum GIS Development Team (2016). Quantum GIS Geographic Information System. Open Source Geospatial Foundation Project. Available online at: http://qgis.osgeo.org (Accessed January 10, 2016).
Rakotonirina, B., and Cooke, A. (1994). Sea turtles of Madagascar–their status, exploitation and conservation. Oryx 28, 51–61.
R Core Development Team (2016). R: A Language and Environment for Statistical Computing. R Vienna: Foundation for Statistical Computing. Version 3.0.2. Available online at: http://www.R-project.org
Reisser, J., Proietti, M., Kinas, P., and Sazima, I. (2008). Photographic identification of sea turtles: method description and validation, with an estimation of tag loss. Endanger. Species Res. 5, 73–82. doi: 10.3354/esr00113
Rohner, C. A., Pierce, S. J., Marshall, A. D., Weeks, S. J., Bennett, M. B., and Richardson, A. J. (2013). Trends in sightings and environmental influences on a coastal aggregation of manta rays and whale sharks. Mar. Ecol. Prog. Ser. 482, 153–168. doi: 10.3354/meps10290
Rohner, C. A., Richardson, A. J., Marshall, A. D., Weeks, S. J., and Pierce, S. J. (2011). How large is the world's largest fish? Measuring whale sharks Rhincodon typus with laser photogrammetry. J. Fish Biol. 78, 378–385. doi: 10.1111/j.1095-8649.2010.02861.x
Roos, D., Pelletier, D., Ciccione, S., Taquet, M., and Hughes, G. (2005). Aerial and snorkelling census techniques for estimating green turtle abundance on foraging areas: a pilot study in Mayotte Island (Indian Ocean). Aquat. Living Resour. 18, 193–198. doi: 10.1051/alr:2005021
Schofield, G., Hobson, V. J., Fossette, S., Lilley, M. K., Katselidis, K. A., and Hays, G. C. (2010). Biodiversity Research: fidelity to foraging sites, consistency of migration routes and habitat modulation of home range by sea turtles. Divers. Distrib. 16, 840–853. doi: 10.1111/j.1472-4642.2010.00694.x
Schofield, G., Katselidis, K. A., Dimopoulos, P., and Pantis, J. D. (2008). Investigating the viability of photo- identification as an objective tool to study endangered sea turtle populations. J. Exp. Mar. Biol. Ecol. 360, 103–108. doi: 10.1016/j.jembe.2008.04.005
Schroeder, B. A., Foley, A. M., and Bagley, D. A. (2003). “Nesting patterns, reproductive migrations, and adult foraging areas of loggerhead turtles,” in Loggerhead Sea Turtles, eds A. B. Bolten and B. E. Witherington (Washington, DC: Smithsonian Books), 114–124.
Scott, R., Hodgson, D. J., Witt, M. J., Coyne, M. S., Adnyana, W., Blumenthal, J. M., et al. (2012). Global analysis of satellite tracking data shows that adult green turtles are significantly aggregated in Marine Protected Areas. Glob. Ecol. Biogeogr. 21, 1053–1061. doi: 10.1111/j.1466-8238.2011.00757.x
Scott, R., Marsh, R., and Hays, G. C. (2014). Ontogeny of long distance migration. Ecology 95, 2851–5859. doi: 10.1890/13-2164.1
Shimada, T. (2015). Spatial Ecology and Conservation of Sea Turtles in Coastal Foraging Habitat. Ph.D. thesis, College of Marine and Environmental Sciences, James Cook University, Australia.
Shimada, T., Limpus, C., Jones, R., Hazel, J., Groom, R., and Hamann, M. (2016). Sea turtles return home after intentional displacement from coastal foraging areas. Mar. Biol. 163, 1–14. doi: 10.1007/s00227-015-2771-0
Sleeman, J. C., Meekan, M. G., Wilson, S. G., Jenner, C. K. S., Jenner, M. N., Boggs, G. S., et al. (2007). Biophysical correlates of relative abundance of marine megafauna at Ningaloo Reef, Western Australia. Mar. Freshwater Res. 8, 608–623. doi: 10.1071/MF06213
Soykan, C. U., Moore, J. E., Zydelis, R., Crowder, L. B., Safina, C., and Lewison, R. L. (2008). Why study bycatch? An introduction to the theme section on fisheries bycatch. Endanger. Species Res. 5, 91–102. doi: 10.3354/esr00175
Varo-Cruz, N., Bermejo, J. A., Calabuig, P., Cejudo, D., Godley, B. J., López-Jurado, L. F., et al. (2016). New findings about the spatial and temporal use of the Eastern Atlantic Ocean by large juvenile loggerhead turtles. Divers. Distrib. 22, 481–492. doi: 10.1111/ddi.12413
Venables, W. N., and Ripley, B. D. (2002). Modern Applied Statistics with S, 4th Edn. New York, NY: Springer.
Wallace, B. P., Heppell, S. S., Lewison, R. L., Kelez, S., and Crowder, L. B. (2008). Impacts of fisheries bycatch on loggerhead turtles worldwide inferred from reproductive value analyses. J. Appl. Ecol. 45, 1076–1085. doi: 10.1111/j.1365-2664.2008.01507.x
Whitehead, H. (2001). Analysis of animal movement using opportunistic individual identifications: application to sperm whales. Ecology 82, 1417–1432. doi: 10.1890/0012-9658(2001)082[1417:AOAMUO]2.0.CO;2
Whitehead, H. (2007). Selection of models of lagged identification rates and lagged association rates using AIC and QAIC. Commun. Stat. Simul. Comput. 36, 1233–1246. doi: 10.1080/03610910701569531
Whitehead, H. (2009). SOCPROG programs: analysing animal social structures. Behav. Ecol. Sociobiol. (Print). 63, 765–778. doi: 10.1007/s00265-008-0697-y
Keywords: marine turtle, citizen science, site fidelity, movement, photo-ID, Chelonia mydas, Caretta caretta
Citation: Williams JL, Pierce SJ, Rohner CA, Fuentes MMPB and Hamann M (2017) Spatial Distribution and Residency of Green and Loggerhead Sea Turtles Using Coastal Reef Habitats in Southern Mozambique. Front. Mar. Sci. 3:288. doi: 10.3389/fmars.2016.00288
Received: 02 September 2016; Accepted: 21 December 2016;
Published: 09 January 2017.
Edited by:
Graeme Clive Hays, Deakin University, AustraliaReviewed by:
Gail Schofield, Deakin University, AustraliaJérôme Bourjea, IFREMER, France
Jeanne A. Mortimer, Independent Researcher, Seychelles
Copyright © 2017 Williams, Pierce, Rohner, Fuentes and Hamann. This is an open-access article distributed under the terms of the Creative Commons Attribution License (CC BY). The use, distribution or reproduction in other forums is permitted, provided the original author(s) or licensor are credited and that the original publication in this journal is cited, in accordance with accepted academic practice. No use, distribution or reproduction is permitted which does not comply with these terms.
*Correspondence: Jessica L. Williams, amVzc0Btb3p0dXJ0bGVzLmNvbQ==