 Marc Sourisseau
 Valerie Le Guennec2,3
 Guillaume Le Gland
 Martin Plus
 Annie Chapelle
- 1Unité Dynamiques des Écosystèmes Côtiers, Laboratoire D'écologie Pélagique, Département Océanographie et Dynamique des Ecosystèmes, Institut Français de Recherche pour l'Exploitation de la Mer, Plouzané, France
- 2National Oceanography Center, Liverpool, UK
- 3Department of Earth, Ocean and Ecological Sciences, School of Environmental Sciences, University of Liverpool, Liverpool, UK
- 4Laboratoire des Sciences de l'environnement Marin (UMR6539), Institut Universitaire Européen de la Mer, Université de Bretagne Occidentale, Plouzané, France
Understanding the phenology of phytoplankton species is a challenge and despite a lot of theoretical work on competition for resources, this process is under-represented in deterministic models. To study the main driver of the species selection, we used a trait-based model that keeps phenotypic variability through physiological trait parameterization. Next, we validated the results by using the toxic dinoflagellate Alexandrium minutum which is a toxic species. Due to their monitoring, we show that harmful algae are ideal models for studying ecological niches and for contributing to this more global challenge. As a first step, a dimensionless model of an estuary (France) was built with water temperature and water exchanges deduced from a hydro-dynamic model. The biological parametrization takes into account the size (from pico- to microphytoplankton) and the type of assimilation. The results show that temperature, competition for nutrients and dilution are important factors regulating the community structure and Alexandrium minutum dynamics (more especially the bloom initiation and magnitude). These drivers contribute to the determination of the ecological niche of A. minutum, influence the shape of its blooms and provide potential explanations of its interannual variability. This approach makes the community structure more flexible in order to study how environmental forcings could drive its evolution.
1. Introduction
Over the past few decades, the frequency and intensity of observed events termed Harmful Algal Blooms (HABs), and commonly called red tides, have rapidly increased in global coastal waters (Hallegraeff, 1993, 2010). These phenomena are characterized by the fast growth or accumulation of one phytoplankton species (which can grow up to several million cells.L−1) which can color the surface water. Being photosynthetic, their occurrence is mainly dependent on light, nutrient availability and temperature. However, although phytoplankton enhances biological productivity and plays an outstanding role in the regulation of atmospheric carbon by scavenging it into deep water (Falkowski and Oliver, 2007), these algal blooms can be harmful by causing hypoxia or anoxia during bloom degradation or by spreading toxicity through the food chain for species producing toxin. They have a dramatic impact on aquaculture, fisheries, tourism and public health and often lead to severe economic losses. Among the dinoflagellates which are only a part of the marine phytoplankton, it is estimated that at least 60 species produce endogenous toxins (Burkholder, 1998) that can accumulate in shellfish (clams, mussels, oysters, scallops), fish, and even in birds and mammals to levels that can be lethal for humans.
Monitoring programs dedicated to these algae have provided a large (twice a month to weekly measurements on several years) data sets at the species level to test assumptions on ecological process such as the ecological niche definition. The description of species niches (specially for toxic species) and their evolution through abiotic and sometimes biotic factors is an important and useful goal to forecast the evolution of communities (Wiens et al., 2009; Elith et al., 2010; Kearney et al., 2010) but it requires a detailed understanding of the mechanisms driving their fitness. Our capacity of realistic predictions of species niches with mechanistic model remains however weak and mainly because mechanistic models still include a great deal of empirical fitting that decreases their generic aspect. Although our understanding of HABs events has increased, it remains complex and difficult to assess all the pathways that generate a succession of monospecific blooms (resources, predation, life cycle, etc…). Among all ecological processes and despite its use in conceptual models (Margalef, 1978; Reynolds, 2003), competition has been only poorly or partially used by mechanistic models for understanding and/or predicting future outcomes. However, during a bloom; when the resources required for phytoplankton growth become limited, strong interspecific competition should occur in most cases. The familiar assumption in aquatic microbiology (Bass Becking, 1934) that all the species are in the environment (Everything Is Everywhere) but environmental selection leads to species succession, also identifies interspecific competition as one of the key processes in coastal environment management. However, HABs species are mainly simulated in the environment alone (MacIntyre et al., 2004; Fauchot et al., 2008; He et al., 2008; Jeong et al., 2015 for three of the four groups proposed) or with a physiological description that differs between the other phytoplankton functional types (Lacroix et al., 2007). The relevance of the competition for resources is thus difficult to estimate because a great part of the community adaptation is removed by this reduction. A trait-based approach (Litchman et al., 2012) associated with the EIE assumption provides an interesting methodology that allows us to go further in understanding bloom events.
Thus, we present the first trait-based model that simulates the competition for resources between several phytoplankton species (including the toxic species A. minutum) with a consistent physiological resolution and in realistic conditions. Obtained from trade-offs, this consistency enables species fitness to be analyzed in a more reliable way. With this general model framework, the challenge was to reproduce phytoplankton phenology and A. minutum bloom dynamics. The approach was based on trait-based models that already exist on a global scale (Dutkiewicz et al., 2009; Barton et al., 2010) and one of the difficulties initially considered was the selection of traits and their parametrization for coastal waters. The parametrization of traits was achieved with a random process using a range of realistic values. In doing so, defining the trade-offs (evolutionary compromise for the resource allocation between different functional traits) was also an important step. By using this general approach, we also propose a way of studying phytoplanktonic bloom by understanding which relevant factors may favor A. minutum blooms and how the diversity of trait values can control species invasion and succession. The study was applied in the Bay of Brest due to the fact that since summer 2012, the bay has been affected by one of the most problematic organisms, i.e., the dinoflagellate Alexandrium minutum (Erard-Le Denn, 1997), which gives rise to toxic events. The selection of this species was driven by the large set of physiological parameters provided by the literature and previous studies with local strains (Labry et al., 2008). We focused on the simulated timing of A. minutum and its maximal intensity values for comparison with in-situ observations. This capacity to predict A. minutum blooms could be a good step toward improving coastal management measures.
2. Materials and Methods
2.1. Study Site
The Mignonne estuary, located within the Bay of Brest (Figure 1), was chosen as a good example of a so-called “invasion” by a toxic pelagic species. The Alexandrium minutum blooms started in 2012 despite a few earlier observations of low densities in the water (close to the detection threshold of the methodology used by the monitoring program: 10,000 cells.L−1). This site is a typical shallow estuary of Brittany with a mean depth of 3.75 m subjected to tidal effects. The Mignonne is a small coastal river with a mean discharge of 1.47 m3.s−1. The Mignonne river inputs exhibit very high concentrations of nutrients such as nitrate, silicate and phosphate with concentrations reaching 2,000 μmol.L−1, 2,000 μmol.L−1 and 20 μmol.L−1 respectively.
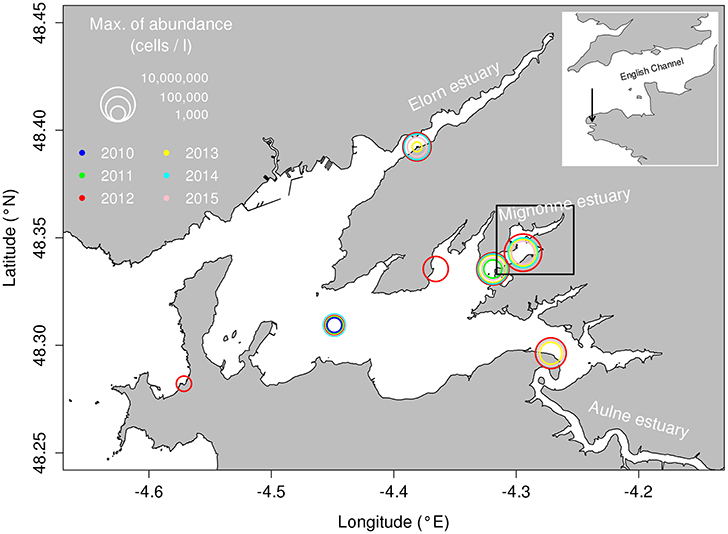
Figure 1. Bay of Brest with the A. minutum maximum abundance during the last 6 years and at the different monitoring stations. Black box shows the spatial coverage of the Mignonne estuary used by the hydrodynamic model to estimate water exchanges.
2.2. Area Definition and Forcings
To simulate inter-specific competition in a simple way, we chose to remove the spatial dimension by using a model similar to a chemostat with a Droop model (Droop, 1968, 1974) which is more reliable to physiological traits (Flynn, 2005) and accurate in many comparative studies (Grover, 1991, 1992). With this simplification, only the temporal variability of the niches in this small environment was analyzed and the spatial definition of this environment was fixed according to the recurrent observed distribution of Alexandrium minutum blooms during the 3 years considered: the Mignonne estuary (Figure 1). This approximation was possible because the strong tidal mixing and shallow depths in this area prevent front and stratification formation.
The considered area which sometimes provides favorable conditions for A. minutum growth; undergoes water exchanges associated with tide and river inputs. All these physical values (water residence time, water depth, nutrient exchanges and water temperature) were estimated using the hydrodynamic model MARS3D (Lazure and Dumas, 2008) configured for the Bay of Brest and forced by realistic weather conditions (wind, air temperature, relative humidity and atmospheric pressure from Météo-France AROME model, Seity et al., 2011) as well as by the measured daily Mignonne flow (HYDRO database, Governmental Environmental Agency, monitoring station Irvillac, see Figure 1 for river location). These forcing fields constitute the best set available for this area and the water residence time remains rather insensitive to the weather conditions. The model bathymetry was provided by the SHOM (French Naval Hydrographic and Oceanographic Service). Three years of interest (2012, 2013, and 2014) were simulated. The dilution rates (D) were computed by a classic methodology of tracer dilution over a time period close to 25 h (the period between two high tides): a passive tracer was initialized in the whole area at high tide and the decreasing concentration due to dilution was simulated by the three-dimensional (3D) model during 25 h until the next high tide. The dilution rate was computed as the difference between the two concentrations divided by the exact time lag between the two high tides, and the tracer was re-initialized for the next 25 h. Concomitantly, the simulated water temperature was recorded to calculate the mean temperature. Then, both dilution rates and temperatures were interpolated to provide values for a 24-h period. The mean water volume of the Mignonne estuary (V) was estimated at mean sea level height using the model bathymetry.
Commonly used to simulate phytoplankton dynamics in experiments or coastal waters (Flynn, 2005), the selected resources for phytoplankton competition were light and three macronutrients: nitrogen (as ammonium and nitrate), phosphorus (as phosphate) and silicium (as silicate). Light intensity was estimated from Sea Surface Irradiance (SSI) of daily satellite data (provided by METEOSAT Second generation satellites, full description available on the OSI-SAF web server www.osi-saf.org/index.php, validation by Le Borgne et al., 2006). The SSI is the mean daily solar irradiance reaching the earth's surface in the 0.3–4 m band expressed in W.m−2. It was multiplied by 0.95 to remove sea surface albedo and then by 0.425 (fraction of the total spectra wavelengths that is used by photosynthetic pigments) in order to estimate the mean daily Photosynthetically Active Radiation (PAR, I0). Then, instantaneous PAR was calculated as a sinusoidal function of the mean daily PAR and the Julian day length was calculated following the method described in Forsythe et al. (1995). The light extinction coefficient due to the water column (Kpar) was calculated following Gohin et al. (2005) using OSI-SAF satellite data for suspended matter (SM in mg.L−1) and chlorophyll a (in mg.L−1).
Nutrient concentrations in Mignonne waters were calculated by taking into account (i) the nutrients brought by the Mignonne River (interpolated from monthly data measured by Brest Metropole Oceane) and (ii) the nutrient concentrations prevailing in the rest of the Bay of Brest (interpolated from weekly data provided by the SOMLIT “Service d'Observation en Milieu Littoral,” INSU-CNRS, at the Porzic station).
2.3. Traits Description of Phytoplankton Model
A large diversity of traits and trade-offs associated can structure phytoplankton communities (Litchman et al., 2007; Litchman and Klausmeier, 2008). From these, we pragmatically selected only the traits (cell size, optimal temperature and silicate dependence, see Figure 2) relevant for the considered area and well defined for phytoplankton groups and species.
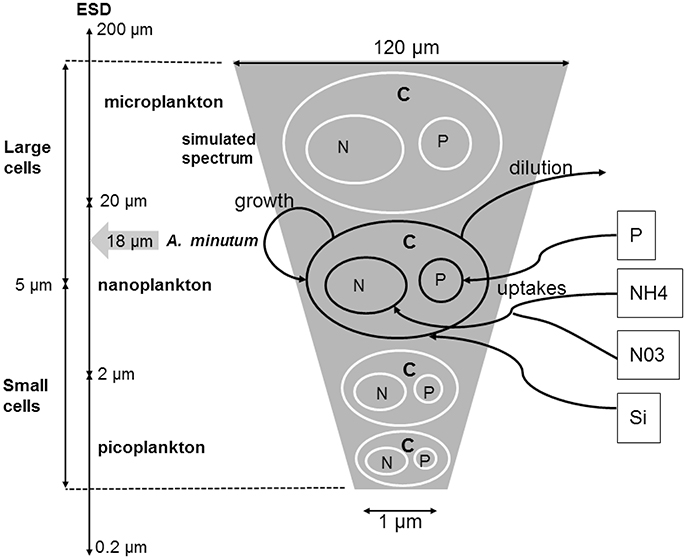
Figure 2. Conceptual model of the size class spectrum used. For each cell size, a quota of nitrogen and phosphate controls the growth rate (μ). The quota and the cellular volume (Vol.C−1) are based on allometric laws. For the diatoms, the silicates are not stored in the cells but directly used with a potential limitation directly on the growth rate. The size was randomly selected between 1 and 120 μm of ESD.
2.3.1. Cell Size and Cell Quotas
Cell size is a key trait that impacts growth, metabolism and access to resources (Litchman and Klausmeier, 2008). Major parameters of nutrient uptake and growth scale with cell size and the size is here considered as a fixed trait for each phenotype. The size range covers the whole size spectrum usually used to characterize the phytoplankton community from 1 to 120 μm (Figure 2). Size corresponds to the equivalent spherical diameter (Equivalent Spherical Diameter - ESD) and allows calculating cell volume which is next used to simulate trade-offs with nutrient uptake and growth. The Capacity of the phytoplankton cells to modify their size (Smith and Zhao, 2001; Arino et al., 2002; Flynn, 2005) was not considered here as we decided to simulate nutrients storage capacity (quota). In fact, the quota-based approach was used (Droop, 1968, 1974) because it is more reliable for physiological traits (Flynn, 2005) and simulations. All previous comparative studies concluded that growth is better described as a function of internal rather than environmental nutrient concentration (Grover, 1991, 1992). This approach and its application to species competition has been widely investigated in the literature (Pascual, 1994; Legovic and Cruzado, 1997; Smith, 1997; Smith and Zhao, 2001; Sunda et al., 2009) and the theoretical results are also fully applicable in our study. As the conditions are not stationary and perturbations occur at several frequencies from the seasonal cycle to tidal oscillations, the exclusive competition in our simulations was better reproduced by a Droop model. In this way, our approach is close to Sommer (1991) work and novative compared to Darwin model (Follows and Dutkiewicz, 2011). Intracellular cell quotas of phosphate and nitrogen were also considered.
2.3.2. Optimal Temperature
Temperature is a major environmental parameter that governs physiological functions like photosynthesis, respiration, growth, resource acquisition, motility and sinking (Eppley, 1972; Litchman and Klausmeier, 2008). This dependence may be characterized by the optimal temperature. It has been used here to model phytoplankton maximal growth rate with all other factors (nutrient, light) being optimal.
2.3.3. Silicate Dependence
Diatoms are one of the major microphytoplankton group observed in the Bay of Brest. All species in this taxonomic group are silicified species and this major trait induces a silicate assimilation. Without considering any relation between this trait and physiological rate (uptake, growth…) in our simulation, we wanted to determine how the relevance of the potential specific limitation of this large cell size could occur to permit a higher growth of non-silicate large size species (including Alexandrium minutum).
Other traits proposed by Litchman and Klausmeier (2008) such as toxin production, light adaptation and swimming capacities were considered but rejected. Chemical cues are relevant processes for species interactions (Ianora et al., 2011). Several metabolites have allelopathic effects and toxins of toxic algae are obviously widely studied in this way (Hulot and Huisman, 2004; Graneli et al., 2008). A. minutum thus produce allelopathic substances that would shift the grazing pressure to non-toxic species (Guisande et al., 2002) or decrease the growth rate of other phytoplankton species (Arzul et al., 1999). However, the “toxin” property is linked to a negative effects on humans (from a food safety aspect) and/or macro-organisms (fish or shellfish). This characteristic is not linked to the competition for resources or interactions with specific grazers. Even the toxic blooms can be grazed extensively (Jeong et al., 2015). We can thus assume that many other cellular metabolites can have allelopathic effects without affecting animal physiology and conversely, are not measured. The action of toxins in the environment is still being debated in the scientific community (Hulot and Huisman, 2004; Jonsson et al., 2009), we therefore chose to neglect this trait despite its potential implication in the results of competition (Roy and Chattopadhyay, 2007; Grover and Wang, 2014). The optimal irradiance for a cell is also a key parameter and is modulated by the quantity and quality of its pigment content. Although, the tidal mixing in the considered area removed the possibility of a vertical discretization of the phenotypes (Hickman et al., 2010), the bloom timing of each one could be modified according to their optimal irradiance. MacIntyre et al. (2004) used a remarkable adaptation to low light levels of one phytoplankton species to simulated its bloom initiation. However, despite the interest of such trait integration, we first used a constant optimal irradiance for all phenotypes by considering that, at the first order, the relevance should remain low because the light resource is rarely limiting during the blooming period of Alexandrium minitum (mid-May to August). One of the last critical traits considered is the organism's behavior and mobility. Dinoflagellates have especially significant swimming capacities (Kamykowski, 1995) that can lead: to heterogeneous vertical distributions (Kamykowski et al., 1992) and accumulation processes (Anderson and Stolznbach, 1985; Janowitz and Kamykowski, 2006) and to higher nutrients uptakes in oligotrophic conditions due to the depletion around the cell (Falkowski and Oliver, 2007). However, according to the hydrodynamic of the considered estuary (Raine, 2014), stratification (haline or thermal) never occurs over the year in the estuary because the mixing intensity is mainly driven by the interaction of the tide and the bathymetry. We therefore assume that this physical-biological interaction remains stable over the year and is included in the parametrization of the uptake rates.
2.3.4. Modeling the Phytoplankton Diversity
The large variability was implemented by using 50 species (or phenotypes for the selected traits) (Ns) with random trait values. Each species is defined by its cell size, its capacity or not to assimilate silicate and its optimal temperature. As it isnt linked to precise species, it can also be considered as phenotype. Only one species was fixed and defined for A. minutum. 51 phenotypes were thus in competition for a limited number of resources in each simulation. To analyze the outputs of the simulated phytoplanktonic community, 2 or 4 cell groups were created according to their size (or volume, see Figure 2). The small cells include the picoplankton (0.5–5 μm3) and a fraction of the small nanoplankton (ESD < 5 μm) while the large cells include the largest cells of the nanoplankton (ESD < 5 μm) and the microplankton (4,000–106 μm3). This size range covers the whole size spectrum (pico-, nano-, and micro-phytoplankton) usually used to characterize the phytoplankton community. The size division in nanoplankton is related to the identification limit by optic microscopy (ESD > 5 μm). Alexandrium minutum belongs to the microplankton group with a volume close to the value of 5,832 μm3 (18 μm of ESD, Maranon et al., 2013).
2.4. Mathematical Model Description
The differential equations governing the dynamics of the system are usual. The abundance of each species (Ni), nutrient concentrations ([PO4], [NH4], [NO3], and [Si]) and intracellular cell quotas of phosphate and nitrogen (QP,i and QN,i) are state variables whose evolution over time can be expressed as follows (for symbols and parameter values, see Tables 1, 2, respectively):
The net growth rate () of change in the abundance (Ni) is the gain from the growth rate (μi) minus the dilution (D). There is no specific term for a mortality process because it was overlooked compared to the dilution values. To prevent the extinction of a species due to dilution and to simulate a possible migration after unfavorable conditions, a minimal concentration (Nmin,i) is considered for each species. Due to the exponential distribution of the cell abundance according to their sizes, it is calculated in such a way that the total cell volume of each species is equal to 106μm3 L−1. This approach gives lower abundances for big cells (at least 1 cells.L−1) compared to small cells (at least 106 cells.L−1). Concerning A.minutum, the threshold is thus 171 cells.L−1 and similar to the detection threshold by using the protocol of the monitoring program (100 cells.L−1).
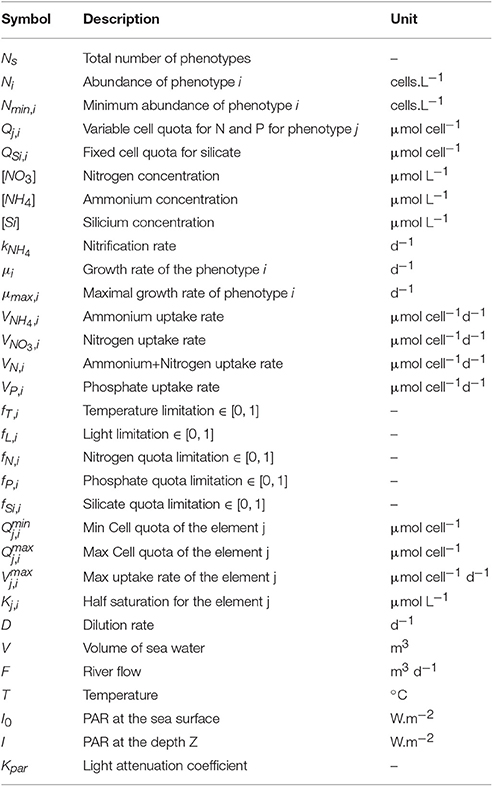
Table 1. Table of symbols.
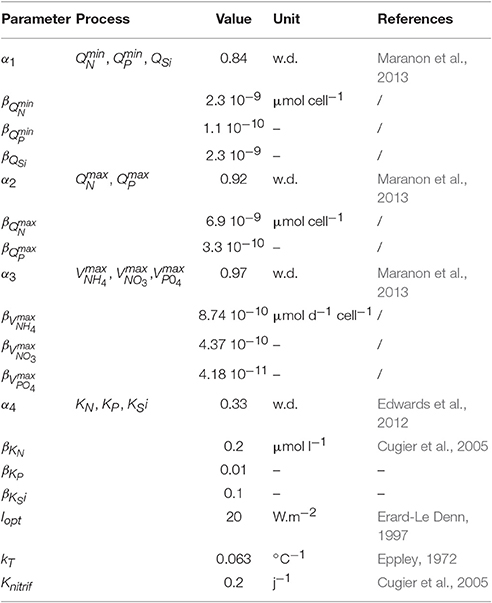
Table 2. Global parameters and allometric coefficients.
2.5. Parameter Values
The growth rate of each species is modulated by their maximal growth rate μmax,i (d−1), the temperature fT,i, and four limitation factors fL,i, fN,i, fP,i, fSi,i (dimensionless ranging from 0 to 1) where only the most constraining is retained (Liebig's minimum law):
Temperature limitation (fT,i) is simulated in the same way for all species with a function developed for A. minutum in the Bay of Cork (Nì Rathaille, 2007):
where Topt,i is the optimal temperature of growth for each species and T is the simulated temperature. The light limitation (fL,i) on phytoplankton growth rate is expressed by a hyperbolic tangent (Jassby and Platt, 1976):
where I corresponds to the Photosynthetically Available Radiation (PAR) and Iopt to the optimal light intensity. This value is assumed to be constant for all the phenotypes. Variations of the water depth associated with the tide are taken into account by calculating I for each given depth (z) with the Beer-Lambert law:
where Kpar is the light attenuation coefficient. The growth rate is calculated for each depth and the mean of these growth rates was used in the model.
Nitrogen (fN,i) and phosphorus (fP,i) limitations follow a normalized Droop function (Droop, 1974), which is a hyperbole depending on the minimum () and maximum () cell quotas for the element j:
According to Flynn (2008), silicate is not stored by siliceous cells and is only used for the fabrication of the frustule which occurs during cell division. The limitation in silicate is therefore expressed through a simple Michaelis-Menten formulation :
where KSi is the half-saturation constant for siliceous species.
The nutrient uptake rates (, , and ) follow Michaelis-Menten kinetics and decrease linearly when cell quotas increase:
The absorption of nitrogen as nitrate is inhibited by ammonium absorption (Parker, 1993) because the necessary reduction of nitrate ions to ammonium ions requires a great deal of energy.
2.6. Key Physiological Trade-Offs
Some trade-offs are used in order to define competition between all the species within the model ecosystem. Functional traits used to simulate phytoplanktonic diversity thus follow different types of distribution (see Table 3). Although, a large proportion of the traits is related to the cell volume, phytoplankton maximal growth rate is simulated by the temperature according to a global exponential law (Eppley, 1972). There is a relationship with Topt but not with cell size:
kT is the temperature coefficient for the growth rate and μmax,ref is the growth rate at 0° without other limitations. The following traits , , , , , , , QSi,i, KN,i, KP,i and KSi,i are dependent on the cell volume through an allometric relationship in the form of a power function β·Vα(see Table 3 for the allometric coefficient values). Hence, some size-related differences are introduced in the storage capacity and maximal nutrients uptake rate. Indeed, large cells possess a bigger storage capacity than small ones. The maximal uptake rate of small cells is lower than that of large cells but the reverse is true for nutrient affinity (1/KN,i, 1/KP,i). Consequently, small cells will outcompete large ones in oligotrophic conditions.
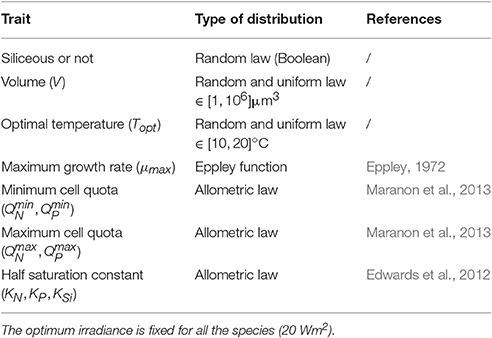
Table 3. Distribution of the functional trait.
Alexandrium minutum traits were obtained from the literature (see Table 4 for references). Its maximal growth rate is identical to species with the same volume but its distinction lies in its maximum phosphate uptake rate and its maximum cell quota which are both higher than in other cells (Chapelle et al., 2010).
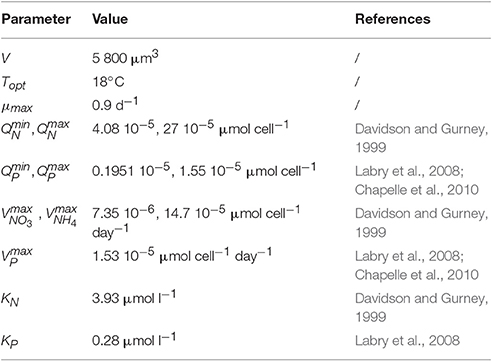
Table 4. Specific parameters used for A. minutum.
2.7. Phenological Characterization of A. minutum Bloom
Phenology refers to changes in the timing of seasonally re-occurring biological events due to environmental changes. Due to the random selection, 200 simulations were carried out with different random draws and their mean values were analyzed. To compare the simulated dynamics of A. minutum with the in situ observations, the method developed by Rolinski et al. (2007) was used instead of a simple correlation with the data. Some particular points of A. minutum phenology such as the maximum abundance, the date of this maximum, the beginning, end and duration of the bloom were thus obtained. To determine these shape parameters, a Weibull function is proposed by Rolinski et al. (2007):
After a log-transformation of the data, the values of the parameters (a, b, c, d, e, and f) that provide the best fit are chosen. The maximum abundance and its date are directly provided by the Weibull function. From these values, the area under the curve is calculated. The start date of the bloom corresponds therefore to the 2% quantile of the area under the curve before the date of the maximum. By contrast, the 98% quantile of the area under the curve after the date of the maximum, corresponds to the date of the end of the bloom. The duration of the bloom is the difference between the beginning and end of the bloom. This part aims to discover if the modeled phenology reveals strong variations over the years as observed in the field.
Several ensembles of simulations were then carried out through a selected range of phenotype numbers (Ns = 20, Ns = 100, Ns = 150, and Ns = 200). Next, the cardinal dates (beginning, maximum, and termination), timing and maximum abundances of the A. minutum bloom were recalculated with the same process (Table 5).
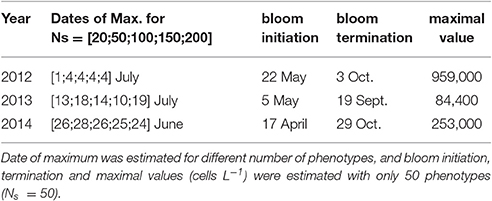
Table 5. Parameters obtained with the Weibull function fitted on A. minutum blooms for the three years.
3. Results
3.1. A. minutum Appearance and Bloom Characteristics
Whatever the year and the simulation, the presence of A. minutum is simulated from the beginning of May until the beginning of September (Figure 3). Despite a simulated interannual variability for the A. minutum bloom, the duration of the bloom is quite constant (≈ four and a half months). The random number of species is also sufficient to limit the variability of each ensemble with some reduced differences between the 25TH and 75TH percentiles. This observation enables some comparisons to be made between each year.
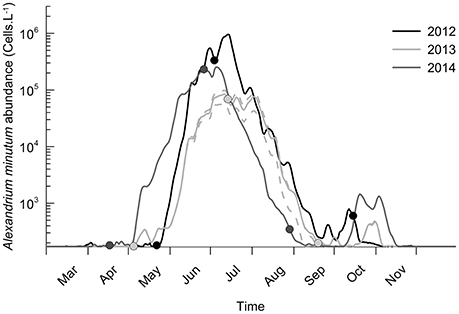
Figure 3. Interannual variability of A. minutum abundance for the years 2012, 2013, and 2014. Abundances are the mean of the simulation ensemble and 25th and 75th percentiles are plotted only for 2013 (dashed lines). Positions of the three estimated Weibull parameters are added (date of initiation, maximum and termination of the bloom).
The model simulates the highest abundances of A. minutum in 2012 with a mean value of 1 million cells.L−1 on 5TH July. In 2014, the maximum abundance remains large (around 3.105 cells.L−1) but three times lower than in 2012. The lowest values are observed in 2013 with 85,000 cells.L−1. Besides these maximal values and close bloom duration, some differences in the timing of the maximal abundances are also simulated in a significant way. In 2014, the maximum is reached on 5TH July which is a little bit sooner than in 2013 (8TH July) and 2012 (14TH July). Again, the percentiles indicate a low variability in these values related to the random process. They are driven by the phenotype succession and the environmental forcing. Regarding 2013, the lowest maximum abundance is simulated but with a long duration around this value (≈ one month). The earliest bloom initiation is simulated in 2014 (4TH May) and the latest in 2012 (25TH May). Concerning the termination, the bloom in 2014 ended earlier (end of August) whereas the one in 2012 ended the latest (end of September). The small oscillations during the bloom dynamics (notably in 2012) are associated with the spring/neap tidal cycle which affects the dilution rate.
3.2. Factors Controlling A. minutum Blooms
The difference between sink and source terms (the net growth) controls the simulated bloom timing and intensity, and thus the potential A. minutum appearance period during 2012 is four months from mid-May to the end of September (Figure 4). The growth rate depends on the following factors: temperature, nutrients (nitrogen and phosphate) and light. At the end of the winter of 2012, despite nitrogen and phosphate cell quota values close to their maximums, A. minutum growth is limited at low water temperatures (below 10°C). During the spring, the main limitation remains the temperature until the beginning of May after which the growth period occurs (Figure 5). Until mid-June, the nitrogen limitation is the most important, followed by a phosphate limitation that limits A. minutum growth in summer (after mid-June) until October 2012. In autumn, despite some new nutrient inputs from the river, the second growth period remains limited to 1 month and the simulated abundances remain very low due to light and temperature limitations.
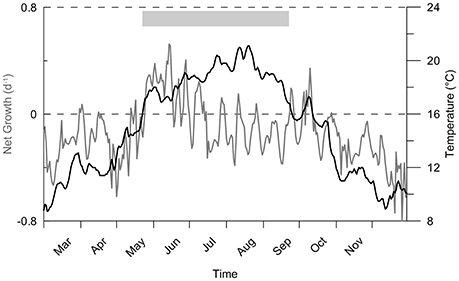
Figure 4. Net growth (μ − D) of A. minutum during the year 2012 and temperature variability in the considered area. The period of potential A. minutum occurence is indicated in gray.
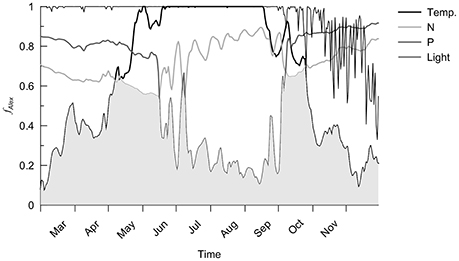
Figure 5. Temperature, nitrogen (N), phosphate (P) and light limitations for A. minutum during 2012. The gray area indicates the maximal limitation (Liebig's Law).
The same patterns are observed for subsequent years. There is therefore a marked temperature control for bloom initiation (Tables 5, 6). The shift of the onset toward an earlier period in 2014 is explained by a warmer temperature in mid April (12.8°C) compared to 2012 and 2013 (11.8 and 11.9°C, respectively). The simulated variability of the A. minutum bloom intensity is next explained by nutrient concentrations. Phosphate limitation is less important in 2012 due to higher flow rates from the Mignonne river (respectively 1.5, 0.47, 0.66, 0.55·105m3s−1 mean flow from May to August in 2012, 2013, 2014, and 2015) which allow higher maximum abundances. The relationship between river flow and nutrient concentrations is illustrated by the mean in situ PO4 concentrations that have been weekly measured in 2013, 2014, and 2015 with respective values of 0.12, 0.26, and 0.17 μmol.l−1. These measurements follow A. minutum maximum abundances, 2012 being higher than 2013.
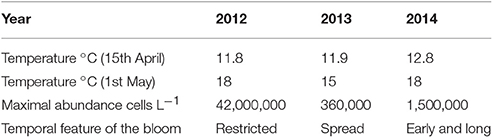
Table 6. Observed interannual variability of A. minutum blooms.
3.3. Phenology of A. minutum and Phytoplankton Successions
The outputs show a variation in the community structure that is repeated for each year. In fact, large cells (ESD > 5 μm) are the first to grow (Figure 6) and can be considered opportunist phenotypes (higher growth rates when nutrients are high). They are then replaced by smaller cells as the phosphate concentration decreases with a low evolution from opportunists to gleaners (more competitive cells when nutrients are low) from mid-May to September. Small cell abundances increase at the beginning of June and due to their higher affinity for phosphate than large cells, they generate a sharp decrease in phosphate concentration after 15th June (with a minimum of 0.01 μmol.L−1). Until October, phosphate concentration is the most limiting factor, which only rises in October because nutrient inputs from the river increase. The model thus simulates a second peak of A. minutum and large cell abundances well marked in October 2014 (with 2,000 cells.L−1). This is due to a lower dilution rate (0.2 d−1 in 2013 and 2012 against 0.1 d−1 in 2014). However, the growth period remains too short to create a significant peak. At the end of November in the 3 years simulated, A. minutum and large cell abundances return to their initial and minimal values. It is through an exclusive competition via phosphate limitation, that the termination of the A. minutum bloom is simulated.
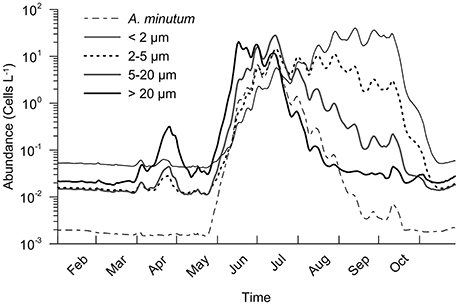
Figure 6. Seasonal evolution of the phytoplankton community in 2012. Four size classes were used.
To sum up, simulated A. minutum bloom initiation is controlled by temperature while the bloom duration and termination are controlled by interspecific competition for the nutrient resources (nitrogen and phosphate). The simulated difference in the A. minutum bloom intensity for the three years is due to the nutrient concentrations inside the area and the simulated limitation in phosphate is less in 2012 thus leading to higher values of maximum abundances.
3.4. Sensitivity Analysis and Comparison with the Data Set
Due to the small variability within the ensemble (see the percentiles in Figure 3), we assume the ensemble size sufficient to permit comparison between average results. The sensitivity tests were thus conducted on the number of selected phenotypes (Ns). Four quantities of phenotypes in competition with A. minutum inside the ecosystem were used (Ns = [20;50;100;150]). By doubling the number of species, (Ns = 50–100} and Ns = 100–200}), the maximum abundance is divided by 2 for the 3 years (Figure 7). The total cells per size class remain however constant and show the redundancy between phenotypes. Except for the lowest number (Ns = 20), the timing of the highest concentration remains independent of the number of selected species (Table 5). The small differences (±3 days) in 2013 are created by the fitting of the Weibull function and the relatively large bloom duration around the highest concentration.
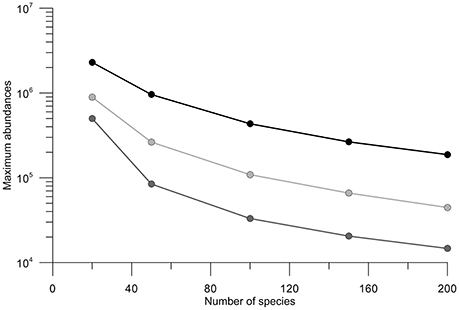
Figure 7. Variation in maximum abundance of A. minutum related to the number of species for the years 2012, 2013, and 2014 in black, light gray and gray, respectively.
Although the more realistic maximum values are obtained with Ns = 20 for all 3 years, the beginning and end of the associated bloom do not fit with these observations. By comparison with the in situ observations, the simulation with 50 phenotypes is more realistic and this was the main reason for choosing this value for the model validation.
For the 3 years and as explained above, the simulated intensity of the A. minutum bloom is slightly underestimated and reaches the values of 106, 4·105, and 7.8·105 cells.L−1 against 4.2·106, 8.4·105, and 1.5·106 respectively (Figure 8). Otherwise, for the years 2012 and 2013, the model reproduces very well the seasonal dynamics of A. minutum with a growth starting at the end of May, a maximum at the end of June and a rapid decrease in July. Concerning the year 2014, the growth of A. minutum occurs earlier and is well reproduced by the model. However, it does not fit with the decrease phase which is simulated on 29TH August instead of the 16TH September.
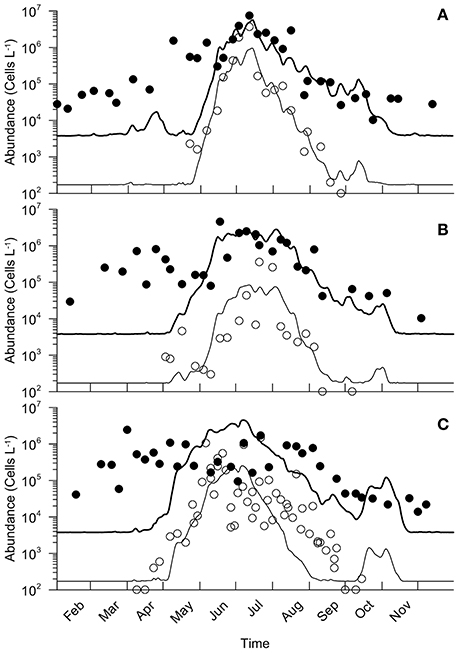
Figure 8. Comparison between simulations of A. minutum (thin line) and total cells (bold line) with density estimates for A. minutum and large phytoplankton (> 5μm of ESD) in circles and black dots respectively. Comparison are made for 2012, 2013, and 2014 in (A–C) respectively.
The total microphytoplankton flora was compared to the simulated dynamics of the large cells (large nanoflagellates + microphytoplankton, A.minutum included). Their spring bloom initiation is clearly not well simulated by the model (Figure 8). In fact, this delay in the bloom timing is related to an underestimation of the net growth rate and/or immigration. In 2012, the model simulates a maximum of 5.7·106 against 7.4·106 for the observations on approximately the same date. In 2013, the maximum abundance simulated reached 2.8·106 against 5.5·105 for the observations.
Conversely, for all 3 years, the dynamics after the bloom maximum fit well with the observations although small differences do appear in 2014. These simulated values are higher than the observations that were made that year (4.5·106 against 2.4·106). The decrease is also simulated earlier than observed (one month of delay) and overestimated by the model. A second increase in the abundance is simulated during October with values again higher than the observations.
4. Discussion
4.1. Dynamic of the Community Structure
Despite all the assumptions inherent to a model conception, the simulations are in good agreement with the observations. The community starts from opportunist phenotypes and during 2 months, progress to gleaners due to an increase of the resources competition. The strong initial assumption that the predation was negligible compared to dilution and constant over the years appears consistent for the selected area and period. However, for an application of the model in another area or over an extended period, this assumption could be challenged. An integration of a predation more or less specific could be required with a large set of formulation available in the literature going from a generalist grazer by keeping the same differences between phenotypes fitness (its capacity to invade the environment considered) only driven by their growth rates to the use of a “Kill The Winner” (KTW) strategy (Prowe et al., 2012; Vallina et al., 2014) which modifies the inter-specific competition by bringing the fitness of phenotypes very close.
The main error of the model is the delay of the bloom timing for diatoms and large flagellates. We link this bias to the lack of spatial dimension and the migration processes through open boundaries. The bloom timing of large cells is dependent on the available light and temperature but is mainly driven by the dilution rate. By considering another area or by increasing the considered area, the dilution rate will be strongly modified. All the connected areas, such as the up- and down-stream parts of the estuary, are associated with different dilution rates and later or earlier blooms can be expected with phenotypes having different optimal temperatures. The results of the simulation can thus be analyzed by assuming that an earlier bloom should take place in the bay of Brest from March to April before an advection in the estuary but that these phenotypes are not adapted to the Mignonne estuary conditions.
4.2. Dynamic of A. minutum
The initial objective, to simulate one species of interest with similar organisms inside a common framework based on trait, was successful. Without any particular fitting of the physiological parameters (all the parameters used are based on the literature at the community and species levels) and the same resolution of the biological processes for all the organisms, the model shows very interesting capacities to simulate the right timing and variability of the bloom intensity over the 3 years. Only one condition was required for A. minutum parameter set: for at least one trait, this species must have an equivalent or a better fitness than other theoretical species with the same size and optimal temperature. Without respecting this condition, A. minutum would not be able to invade.
The model also shows that the local growth is sufficient to support the observed densities and that the timing and intensities were driven only by local conditions and resources competition. This simulated growth and presence period must however be analyzed as the potential ecological niche defined by abiotic factors and inter-specific competition for resources with all external forcings being constant over time. Similar to the community structure, a modification of the phenotype fitness due to a variation of the selective grazing pressure will introduce a bias between the simulated and the observed inter-annual variability. Such variations over time in the grazers community were already observed in similar estuaries in recent studies. The grazer community observed was dinoflagellate parasites (Erard-Le Denn et al., 2000; Guillou et al., 2008) that can be both highly specific of their prey (Coats and Park, 2002; Chambouvet et al., 2008) or not (Figueroa et al., 2008) and can change over time.
The main difference between our work and previous theoretical studies focused at the community level (Grover, 1991, 1992; Pascual, 1994; Legovic and Cruzado, 1997; Smith, 1997; Smith and Zhao, 2001; Sunda et al., 2009) is the introduction of temperature preferences. This additional trait is independent of all the others with an optimal temperature that was randomly selected in the temperature range measured in the area [10–20]°C. The use of these two independent traits (size and optimal temperature) explains the minimum number of phenotypes required to obtain a good estimation of the bloom duration. Fifty is the minimal value required to sample correctly the traits-space. It must also be notice that the maximal densities of A. minutum bloom are always strongly correlated with this number of phenotypes (Figure 7). With a random process to select size and temperature instead of a regular distribution along the trait ranges, we accept the possibility of a full redundancy between a few phenotypes if the total number is large enough to sample correctly all the traits-space. The biomasses of these redundant phenotypes are obviously close but the temporal niche remains stable and particularly the bloom initiation timing. The relevance of the forcing on the timing is thus highlighted by the model: temperature and dilution appear as the main drivers of the bloom timing for A. minutum in the Mignonne estuary; the nutrient inflows mainly drive the maximal abundance values reached by the bloom while the inter-specific competition can also drive the bloom magnitude and termination.
The high capacity of the model to simulate correctly the right timing of the bloom initiation with only one average phenotype for one species raises the question of the phenotypic variability. The parameters used here are provided by only a few strains whereas intra-specific variability studies have highlighted a high heterogeneity of physiological parameters (Aguilera-Belmonte et al., 2011; Kremp et al., 2012; Hadjadji et al., 2012). The “surprising” good fit between the observations and simulations using this average phenotype could result from an average of many local dynamics mixed by the tide and the average of the ensemble simulation. Nevertheless, the effect of this intra-specific variability on the species dynamics remains another process to understand and a great challenge to the ecology of communities.
5. Conclusion and Perspectives
The main interest of the model was to understand, due to the mechanistic aspect, the processes driving the seasonal and inter-annual variability of the niche successions in the community. In this respect, this work was successful and was validated by considering one particular species in this area. Temperature and dilution appear to be the main factors enabling bloom events but competition process is also an important factor despite the high nutrient inputs. The trait based approach that integrates some variability in the organisms fitness instead of an empiric selection and limitation of the ecosystem complexity keeps more flexibilities for the adaptation of the community to environment pressure. We expect that by using and developing (increase of the traits complexity) this approach for ecosystem management, there will be larger spectrum of potential replies by the phytoplankton community to environment modifications. Despite that the forecasting potential of the model was not the initial objective, the model thus shows some very good capacities to simulate the ecological niche of A. minutum as well as the potential link with warning period. Finally, in the context of global change, these models could be used to study the relevance of abiotic factors on the species niches as well as their interaction through the competition process which could lead to more efficient management efforts.
Author Contributions
MS, MP, and AC had substantial contributions to the conception and design of the work. VL and GL contributed mainly to the acquisition but all the authors participated to analysis of data for the work. MS and VL participated mainly to the draft the work but all the authors revised it critically. All the authors approved the submitted version and agreed to be accountable for all aspects.
Funding
The project was supported by the Agence de l'Eau Loire Bretagne and the Region Bretagne (Daoulex project).
Conflict of Interest Statement
The authors declare that the research was conducted in the absence of any commercial or financial relationships that could be construed as a potential conflict of interest.
Acknowledgments
We thank Meteo-France, the REPHY monitoring program and the VELYGER program for providing the data set (Pouvreau et al., 2016). Data were successively collected in the framework of the Daoulex project. We thank S. Petton for the setting of the hydrodynamic configuration.
References
Aguilera-Belmonte, A., Inostroza, I., Franco, J. M., Riobo, P., and Gomez, P. I. (2011). The growth, toxicity and genetic characterization of seven strains of Alexandrium catenella (Whedon and Kofoid) Balech 1985 (Dinophyceae) isolated during the 2009 summer outbreak in southern Chile. Harmful Algae 12, 105–112. doi: 10.1016/j.hal.2011.09.006
Anderson, D. M., and Stolznbach, K. (1985). Selective retention of 2 dinoflagellates in a well-mixed estuarine embayment - the importance of diel vertical migration and surface avoidance. Marine Ecol. Progr. Ser. 25, 39–50. doi: 10.3354/meps025039
Arino, J., Gouze, J. L., and Sciandra, A. (2002). A discrete, size-structured model of phytoplankton growth in the chemostat - introduction of inhomogeneous cell division size. J. Math. Biol. 45, 313–336. doi: 10.1007/s002850200160
Arzul, G., Seguel, M., Guzman, L., and Erard-Le Denn, E. (1999). Comparison of allelopathic properties in three toxic Alexandrium species. J. Exp. Marine Biol. Ecol. 232, 285–295. doi: 10.1016/S0022-0981(98)00120-8
Barton, A. D., Dutkiewicz, S., Flierl, G., Bragg, J., and Follows, M. J. (2010). Patterns of diversity in marine phytoplankton. Science 327, 1509–1511. doi: 10.1126/science.1184961
Bass Becking, L. (1934). Geobiologie of Inleiding Tot de Milieukunde. The Hague: W. P. Van Stockum & Zoon.
Burkholder, J. M. (1998). Implications of harmful microalgae and heterotrophic dinoflagellates in management of sustainable marine fisheries. Ecol. Appl. 8, S37–S62.
Chambouvet, A., Morin, P., Marie, D., and Guillou, L. (2008). Control of Toxic Marine Dinoflagellate Blooms by Serial Parasitic Killers. Science 322, 1254–1257. doi: 10.1126/science.1164387
Chapelle, A., Labry, C., Sourisseau, M., Lebreton, C., Youenou, A., and Crassous, M. (2010). Alexandrium minutum growth controlled by phosphorus: an applied model. GEOHAB Model. 83, 181–191. doi: 10.1016/j.jmarsys.2010.05.012
Coats, D. W., and Park, M. G. (2002). Parasitism of photosynthetic dinoflagellates by three strains of Amoebophrya (Dinophyta): parasite survival, infectivity, generation time, and host specificity. J. Phycol. 38, 520–528. doi: 10.1046/j.1529-8817.2002.01200.x
Cugier, P., Billen, G., Guillaud, J. F., Garnier, J., and Menesguen, A. (2005). Modelling the eutrophication of the Seine Bight (France) under historical, present and future riverine nutrient loading. J. Hydrol. 304, 381–396. doi: 10.1016/j.jhydrol.2004.07.049
Davidson, K., and Gurney, W. S. C. (1999). An investigation of non-steady-state algal growth. II. Mathematical modelling of co-nutrient-limited algal growth. J. Plankton Res. 21, 839–858. doi: 10.1093/plankt/21.5.839
Droop, M. R. (1968). Vitamin B12 and Marine Ecology. IV. The Kinetics of Uptake, Growth and Inhibition in Monochrysis Lutheri. J. Marine Biol. Assoc. U.K. 48, 689–733.
Droop, M. R. (1974). Some thoughts on nutrient limitation in algae. Coll. Reprints Scott. Marine Biol. Assoc. 9:263. doi: 10.1017/S0025315400019238
Dutkiewicz, S., Follows, M. J., and Bragg, J. G. (2009). Modeling the coupling of ocean ecology and biogeochemistry. Global Biogeoch. Cycles 23, GB4017. doi: 10.1029/2008GB003405
Edwards, K. F., Thomas, M. K., Klausmeier, C. A., and Litchman, E. (2012). Allometric scaling and taxonomic variation in nutrient utilization traits and maximum growth rate of phytoplankton. Limnol. Oceanogr. 57, 554–566. doi: 10.4319/lo.2012.57.2.0554
Elith, J., Kearney, M., and Phillips, S. (2010). The art of modelling range-shifting species. Methods Ecol. Evol. 1, 330–342. doi: 10.1111/j.2041-210X.2010.00036.x
Erard-Le Denn, E. (1997). “Alexandrium minutum,” in Efflorescences Toxiques Des Eaux Cotieres Francaises. Ecologie, Ecophysiologie, Toxicologie, Ifremer Edn., eds B. Berland and P. Passus (Plouzané: Reperes Ocean), 53–65.
Erard-Le Denn, E., Chretiennot-Dinet, M. J., and Probert, I. (2000). First report of parasitism on the toxic dinoflagellate Alexandrium minutum Halim. Estuar. Coast. Shelf Sci. 50, 109–113. doi: 10.1006/ecss.1999.0537
Falkowski, P. G., and Oliver, M. J. (2007). Mix and match: how climate selects phytoplankton. Nat. Rev. Microbiol. 5, 813–819. doi: 10.1038/nrmicro1751
Fauchot, J., Saucier, F. J., Levasseur, M., Roy, S., and Zakardjian, B. (2008). Wind-driven river plume dynamics and toxic Alexandrium tamarense blooms in the St. Lawrence estuary (Canada): a modeling study. Harmful Algae 7, 214–227. doi: 10.1016/j.hal.2007.08.002
Figueroa, R. I., Garces, E., Massana, R., and Camp, J. (2008). Description, host-specificity, and strain selectivity of the dinoflagellate parasite Parvilucifera sinerae sp. nov. (Perkinsozoa). Protist 159, 563–578. doi: 10.1016/j.protis.2008.05.003
Flynn, K. J. (2005). Modelling marine phytoplankton growth under eutrophic conditions. J. Sea Res. 54, 92–103. doi: 10.1016/j.seares.2005.02.005
Flynn, K. J. (2008). “Use, abuse, misconceptions and insights from quota models - the droop cell quota model 40 years on,” in Oceanography and Marine Biology: An Annual Review, Vol. 46, eds R. N. Gibson, R. J. A. Atkinson, and J. D. M. Gordon (Boca Raton, FL: CRC Press), 1–23.
Follows, M. J., and Dutkiewicz, S. (2011). Modeling diverse communities of marine microbes. Annu. Rev. Mar. Sci. 3, 427–451. doi: 10.1146/annurev-marine-120709-142848
Forsythe, W., Rykiel, E., Stahl, R., Wu, H., and Schoolfiled, R. (1995). A model comparison for daylength as a function of latitude and day of year. Ecol. Model. 80, 87–95. doi: 10.1016/0304-3800(94)00034-F
Gohin, F., Loyer, S., Lunven, M., Labry, C., Froidefond, J.-M., Delmas, D., et al. (2005). Satellite-derived parameters for biological modelling in coastal waters: illustration over the eastern continental shelf of the Bay of Biscay. Remote Sens. Environ. 95, 29–46. doi: 10.1016/j.rse.2004.11.007
Graneli, E., Salomon, P. S., and Fistarol, G. O. (2008). “The role of allelopathy for harmful algae bloom formation,” in Algal Toxins: Nature, Occurrence, Effect and Detection, NATO Science for Peace and Security Series A: Chemistry and Biology, eds V. Evangelista, L. Barsanti, A.M. Frassanito, V. Passarelli, and P. Gualtieri (Dordrecht: Springer), 159–178.
Grover, J. (1991). Resource competition in a variable environment - phytoplankton growing according to the variable-internal-stores model. Am. Nat. 138, 811–835.
Grover, J. (1992). Constant-yield and variable-yield models of population-growth - responses to environmental variability and implications for competition. J. Theor. Biol. 158, 409–428.
Grover, J. P., and Wang, F.-B. (2014). Competition and allelopathy with resource storage: two resources. J. Theo. Biol. 351, 9–24. doi: 10.1016/j.jtbi.2014.02.013
Guillou, L., Viprey, M., Chambouvet, A., Welsh, R. M., Kirkham, A. R., Massana, R., et al. (2008). Widespread occurrence and genetic diversity of marine parasitoids belonging to Syndiniales (Alveolata). Environ. Microbiol. 10, 3349–3365. doi: 10.1111/j.1462-2920.2008.01731.x
Guisande, C., Frangopulos, M., Maneiro, I., Vergara, A. R., and Riveiro, I. (2002). Ecological advantages of toxin production by the dinoflagellate Alexandrium minutum under phosphorus limitation. Marine Ecol. Prog. Ser. 225, 169–176. doi: 10.3354/meps225169
Hadjadji, I., Masseret, E., Plisson, B., Laabir, M., Cecchi, P., and Collos, Y. (2012). Clonal variation in physiological parameters of Alexandrium tamarense: implications for biological invasions and maintenance. Cahiers De Biologie Marine 53, 357–363.
Hallegraeff, G. M. (1993). A review of harmful algal blooms and their apparent global increase. Phycologia 32, 79–99. doi: 10.2216/i0031-8884-32-2-79.1
Hallegraeff, G. M. (2010). Ocean climate phytoplankton community responses, and harmful algal blooms: a formidable predictive challenge. J. Phycol. 46, 220–235. doi: 10.1111/j.1529-8817.2010.00815.x
He, R., McGillicuddy, D. J., Keafer, B. A., and Anderson, D. M. (2008). Historic 2005 toxic bloom of Alexandrium fundyense in the western Gulf of Maine: 2. Coupled biophysical numerical modeling. J. Geophys. Res. Oceans 113, C07040. doi: 10.1029/2007JC004602
Hickman, A. E., Dutkiewicz, S., Williams, R. G., and Follows, M. J. (2010). Modelling the effects of chromatic adaptation on phytoplankton community structure in the oligotrophic ocean. Marine Ecol. Prog. Ser. 406, 1–17. doi: 10.3354/meps08588
Hulot, F. D., and Huisman, J. (2004). Allelopathic interactions between phytoplankton species: the roles of heterotrophic bacteria and mixing intensity. Limnol. Oceanogr. 49, 1424–1434. doi: 10.4319/lo.2004.49.4_part_2.1424
Ianora, A., Bentley, M. G., Caldwell, G. S., Casotti, R., Cembella, A. D., Engstrom-Ost, J., et al. (2011). The relevance of marine chemical ecology to Plankton and Ecosystem Function: an emerging field. Marine Drugs 9, 1625–1648. doi: 10.3390/md9091625
Janowitz, G. S., and Kamykowski, D. (2006). Modeled Karenia brevis accumulation in the vicinity of a coastal nutrient front. Marine Ecol. Prog. Ser. 314, 49–59. doi: 10.3354/meps314049
Jassby, A., and Platt, T. (1976). mathematical formulation of relationship between photosynthesis and light for phytoplankton. Limnol. Oceanogr. 21, 540–547. doi: 10.4319/lo.1976.21.4.0540
Jeong, H. J., Lim, A. S., Franks, P. J. S., Lee, K. H., Kim, J. H., Kang, N. S., et al. (2015). A hierarchy of conceptual models of red-tide generation: Nutrition, behavior, and biological interactions. Harmful Algae 47, 97–115. doi: 10.1016/j.hal.2015.06.004
Jonsson, P. R., Pavia, H., and Toth, G. (2009). Formation of harmful algal blooms cannot be explained by allelopathic interactions. Proc. Natl. Acad. Sci. U.S.A. 106, 11177–11182. doi: 10.1073/pnas.0900964106
Kamykowski, D., Reed, R. E., and Kirkpatrick, G. J. (1992). Comparison of sinking velocity, swimming velocity, rotation and path characteristics among six marine dinoflagellate species. Marine Biol. 113, 319–328.
Kearney, M., Simpson, S. J., Raubenheimer, D., and Helmuth, B. (2010). Modelling the ecological niche from functional traits. Philos. Trans. R. Soc. B Biol. Sci. 365, 3469–3483. doi: 10.1098/rstb.2010.0034
Kremp, A., Godhe, A., Egardt, J., Dupont, S., Suikkanen, S., Casabianca, S., et al. (2012). Intraspecific variability in the response of bloom-forming marine microalgae to changed climate conditions. Ecol. Evol. 2, 1195–1207. doi: 10.1002/ece3.245
Labry, C., Denn, E. E.-L., Chapelle, A., Fauchot, J., Youenou, A., Crassous, M. P., et al. (2008). Competition for phosphorus between two dinoflagellates: a toxic Alexandrium minutum and a non-toxic Heterocapsa triquetra. J. Exp. Marine Biol. Ecol. 358, 124–135. doi: 10.1016/j.jembe.2008.01.025
Lacroix, G., Ruddick, K., Park, Y., Gypens, N., and Lancelot, C. (2007). Validation of the 3D biogeochemical model MIRO&CO with field nutrient and phytoplankton data and MERIS-derived surface chlorophyll a images. J. Marine Sys. 64, 66–88. doi: 10.1016/j.jmarsys.2006.01.010
Lazure, P., and Dumas, F. (2008). An external-internal mode coupling for a 3D hydrodynamical model for applications at regional scale (MARS). Adv. Water Res. 31, 233–250. doi: 10.1016/j.advwatres.2007.06.010
Le Borgne, P., Legendre, G., and Marsouin, A. (2006). “Validation of the OSI SAF radiative fluxes,” in Proceedings of the 2006 EUMETSAT Meteorological Satellite Conference (Helsinki).
Legovic, T., and Cruzado, A. (1997). A model of phytoplankton growth on multiple nutrients based on the Michaelis-Menten-Monod uptake, Droop's growth and Liebig's law. Ecol. Model. 99, 19–31. doi: 10.1016/S0304-3800(96)01919-9
Litchman, E., Edwards, K. F., Klausmeier, C. A., and Thomas, M. K. (2012). Phytoplankton niches, traits and eco-evolutionary responses to global environmental change. Marine Ecol. Prog. Ser. 470, 235–248. doi: 10.3354/meps09912
Litchman, E., and Klausmeier, C. A. (2008). Trait-based community ecology of Phytoplankton. Ann. Rev. Ecol. Evol. Syst. 39, 615–639. doi: 10.1146/annurev.ecolsys.39.110707.173549
Litchman, E., Klausmeier, C. A., Schofield, O. M., and Falkowski, P. G. (2007). The role of functional traits and trade-offs in structuring phytoplankton communities: scaling from cellular to ecosystem level. Ecol. Lett. 10, 1170–1181. doi: 10.1111/j.1461-0248.2007.01117.x
MacIntyre, H. L., Lomas, M. W., Cornwell, J., Suggett, D. J., Gobler, C. J., Koch, E. W., et al. (2004). Mediation of benthic–pelagic coupling by microphytobenthos: an energy- and material-based model for initiation of blooms of Aureococcus anophagefferens. Harmful Algae 3, 403–437. doi: 10.1016/j.hal.2004.05.005
Maranon, E., Cermeno, P., Lopez-Sandoval, D. C., Rodriguez-Ramos, T., Sobrino, C., Huete-Ortega, M., et al. (2013). Unimodal size scaling of phytoplankton growth and the size dependence of nutrient uptake and use. Ecol. Lett. 16, 371–379. doi: 10.1111/ele.12052
Margalef, R. (1978). Life-forms of phytoplankton as survival alternatives in an unstable environment. Oceanol. Acta 1, 493–509.
Nì Rathaille, A. (2007). Modelling Alexandrium Bloom Dynamics in Cork Harbour. Ph.D. thesis, National University of Ireland, Galway.
Parker, R. A. (1993). Dynamic models for ammonium inhibition of nitrate uptake by phytoplankton. Ecol. Modell. 66, 113–120. doi: 10.1016/0304-3800(93)90042-Q
Pascual, M. (1994). Periodic-response to periodic forcing of the droop equations for phytoplankton growth. J. Math. Biol. 32, 743–759. doi: 10.1007/BF00168795
Prowe, A. E. F., Pahlow, M., Dutkiewicz, S., Follows, M., and Oschlies, A. (2012). Top-down control of marine phytoplankton diversity in a global ecosystem model. Prog. Oceanogr. 101, 1–13. doi: 10.1016/j.pocean.2011.11.016
Raine, R. (2014). A review of the biophysical interactions relevant to the promotion of HABs in stratified systems: the case study of Ireland. Deep Sea Res. II Topic. Stud. Oceanogr. 101, 21–31. doi: 10.1016/j.dsr2.2013.06.021
Reynolds, C. S. (2003). Pelagic community assemblage and the habitat template. Bocconea 16, 323–339.
Rolinski, S., Horn, H., Petzoldt, T., and Paul, L. (2007). Identifying cardinal dates in phytoplankton time series to enable the analysis of long-term trends. Oecologia 153, 997–1008. doi: 10.1007/s00442-007-0783-2
Roy, S., and Chattopadhyay, J. (2007). Toxin-allelopathy among phytoplankton species prevents competitive exclusion. J. Biol. Sys. 15, 73–93. doi: 10.1142/S021833900700209X
Seity, Y., Brousseau, P., Malardel, S., Hello, G., Benard, P., Bouttier, F., et al. (2011). The AROME-France convective-scale operational model. Mon. Weather Rev. 139, 976–991. doi: 10.1175/2010MWR3425.1
Smith, H. L. (1997). The periodically forced Droop model for phytoplankton growth in a chemostat. J. Math. Biol. 35, 545–556. doi: 10.1007/s002850050065
Smith, H. L., and Zhao, X. Q. (2001). Competitive exclusion in a discrete-time, size-structured chemostat model. Discrete Continuous Dyn. Sys. Ser. B 1, 183–191. doi: 10.3934/dcdsb.2001.1.183
Sommer, U. (1991). A comparison of the droop and the monod models of nutrient limited growth applied to natural-populations of phytoplankton. Funct. Ecol. 5, 535–544. doi: 10.2307/2389636
Pouvreau, S., Daniele, M., Auby, I., Lagarde, F., Le Gall, P., Cochet, H., et al. (2016). VELYGER Database: The Oyster Larvae Monitoring French Project. SEANOE. doi: 10.17882/41888
Sunda, W. G., Shertzer, K. W., and Hardison, D. R. (2009). Ammonium uptake and growth models in marine diatoms: Monod and Droop revisited. Marine Ecol. Prog. Ser. 386, 29–41. doi: 10.3354/meps08077
Vallina, S. M., Ward, B. A., Dutkiewicz, S., and Follows, M. J. (2014). Maximal feeding with active prey-switching: a kill-the-winner functional response and its effect on global diversity and biogeography. Prog. Oceanogr. 120, 93–109. doi: 10.1016/j.pocean.2013.08.001
Keywords: Droop, competition, inter-specific, estuary, Bay of Brest, Alexandrium minutum, phenology, niches
Citation: Sourisseau M, Le Guennec V, Le Gland G, Plus M and Chapelle A (2017) Resource Competition Affects Plankton Community Structure; Evidence from Trait-Based Modeling. Front. Mar. Sci. 4:52. doi: 10.3389/fmars.2017.00052
Received: 26 May 2016; Accepted: 14 February 2017;
Published: 04 April 2017.
Edited by:
Kevin John Flynn, Swansea University, UKReviewed by:
Akkur Vasudevan Raman, Andhra University, IndiaDavid Suggett, University of Technology Sydney, Australia
Copyright © 2017 Sourisseau, Le Guennec, Le Gland, Plus and Chapelle. This is an open-access article distributed under the terms of the Creative Commons Attribution License (CC BY). The use, distribution or reproduction in other forums is permitted, provided the original author(s) or licensor are credited and that the original publication in this journal is cited, in accordance with accepted academic practice. No use, distribution or reproduction is permitted which does not comply with these terms.
*Correspondence: Marc Sourisseau, bWFyYy5zb3VyaXNzZWF1QGlmcmVtZXIuZnI=