 Jamie K. Downes1,2*
 Megan L. Rigby3
 Richard S. Taylor3Ben T. Maynard3Eugene MacCarthy2
 Ian O'Connor2
 Mar Marcos-Lopez2,4
 Hamish D. Rodger4
 Evelyn Collins1
 Neil M. Ruane1Mathew T. Cook5
- 1Fish Health Unit, Marine Institute, Galway, Ireland
- 2Marine and Freshwater Research Centre, Galway Mayo Institute of Technology, Galway, Ireland
- 3CSIRO Agriculture and Food, Integrated Sustainable Aquaculture Production, Hobart, TAS, Australia
- 4Vet Aqua International, Oranmore Business Park, Galway, Ireland
- 5CSIRO Agriculture and Food, Integrated Sustainable Aquaculture Production, St. Lucia, QLD, Australia
Amoebic gill disease (AGD) caused by Neoparamoeba perurans, has emerged in Europe as a significant problem for the Atlantic salmon farming industry. Gross gill score is the most widely used and practical method for determining AGD severity on farms and informing management decisions on disease mitigation strategies. As molecular diagnosis of AGD remains a high priority for much of the international salmon farming industry, there is a need to evaluate the suitability of currently available molecular assays in conjunction with the most appropriate non-destructive sampling methodology. The aims of this study were to assess a non-destructive sampling methodology (gill swabs) and to compare a range of currently available real-time polymerase chain-reaction (PCR) assays for the detection of N. perurans. Furthermore a comparison of the non-destructive molecular diagnostics with traditional screening methods of gill scoring and histopathology was also undertaken. The study found that all molecular protocols assessed performed well in cases of clinical AGD with high gill scores. A TaqMan based assay (protocol 1) was the optimal assay based on a range of parameters including % positive samples from a field trial performed on fish with gill scores ranging from 0 to 5. A higher proportion of gill swab samples tested positive by all protocols than gill filament biopsies and there was a strong correlation between gill swabs tested by protocol 1 and gross gill score and histology scores. Screening for N. perurans using protocol 1 in conjunction with non-destructive gill swab samples was shown to give the best results.
Introduction
Amoebic gill disease (AGD), caused by Neoparamoeba perurans, is a major health challenge for the global Atlantic salmon (Salmo salar) farming industry (Rodger, 2014; Oldham et al., 2016). AGD has affected the marine Atlantic salmon industry in Tasmania since the 1980's and has since been described in farmed salmon in Ireland (Rodger and McArdle, 1996), Norway (Steinum et al., 2008), Chile (Bustos et al., 2011) as well as France, Scotland and the Faroe Islands (Rodger, 2014; Oldham et al., 2016). In addition to Atlantic salmon, AGD has also been described in a number of other marine fish species (Oldham et al., 2016) including cleaner fish species used as a biological control of sea lice in Atlantic salmon farms (Haugland et al., in press).
If left untreated, AGD can cause significant mortality, up to 10% of livestock per week (Munday et al., 2001). The economic cost of a challenging issue is often the catalyst with regards to prioritizing research and the management of resources (Costello, 2009). Current AGD management practices are resource demanding and labor intensive, involving numerous bath treatments throughout a production cycle. Freshwater bathing has been the standard method of treating the disease in Tasmania but is limited by access to freshwater (Nowak et al., 2014). In cooler production areas, hydrogen peroxide is an effective treatment, but the treatment is recognized as having a narrow safety margin at higher temperatures (Adams et al., 2012) or where fish are compromised by advanced AGD (McCarthy et al., 2015). Some estimates have put the cost of AGD-related mortality between $12.55 million in Norway and $81 million in Scotland (Shinn et al., 2015).
The case definition for AGD is through histopathology, where amoebae are observed with associated pathology (Clark and Nowak, 1999; Rodger, 2014). By far the most widely used and practical method for ascertaining AGD severity and hence triggers for intervention (freshwater bathing, hydrogen peroxide treatments) is the gross gill score across all 16 hemibranchs, as described by Taylor et al. (2009), which may be coupled with histopathology and fresh microscopy to confirm the presence of lesion-associated amoebae. The identification of N. perurans as the causal agent of AGD (Young et al., 2007) has allowed the development of specific DNA based molecular diagnostic assays for the detection of the amoeba. Currently there are two conventional polymerase chain-reaction (PCR) assays published for the detection of N. perurans, (Young et al., 2008; Rozas et al., 2011), while three real-time PCR assays were developed based on SYBR® green (Bridle et al., 2010) and TaqMan® chemistries (Fringuelli et al., 2012; Downes et al., 2015).
A standardized molecular diagnostic method has the potential to fulfill a role as an early warning and monitoring tool which would greatly complement traditional diagnostic methods, particularly in the early stages of infection when gross clinical signs may be absent and in other fish species for which the gill scoring method is less applicable. The aims of this study were to compare two non-destructive methods of sampling for N. perurans to confirm AGD, gill swabs and gill filament biopsy samples taken from the same animal during a naturally occurring infection in a field trial. A range of currently available molecular assays for the detection of N. perurans were compared with regards to sensitivity, specificity and practicality, utilizing the samples taken from the field trial. Furthermore, the preferred molecular assay used to test gill swab samples was then compared with the traditional screening methods of gross gill scoring and histopathology, on samples taken during an experimental infection trial.
Materials and Methods
Field Trial
The field trial consisted of commercial all-female diploid Atlantic salmon which were put to sea as smolts in south east Tasmania, Australia, on the 8th of July 2014. The samples were collected on the 13th of March 2015 when the fish were an average weight of 1.5 kg. All fish had previously been subjected to 5 freshwater bath treatments, the last of which was on 25th of February 2015. At the time of sampling, biomass in the cage was 96,407 kg (5.7 kg m−3). Five fish were selectively sampled from each gill score (scores 0–5 assessed across all gill surfaces, Taylor et al., 2009) (n = 30) with individual scores being recorded for each fish. The second gill arch on either side of each fish was used for tissue sampling, a gill filament biopsy was conducted on the right side targeting 25 ± 2 mg per sample while the front and back of the left side second arch was swabbed with isohelix swabs (Cell Project Ltd.). Both the filament and swab samples were stored in 2 mL screw-cap micro-centrifuge tubes in 100% AR ethanol for transport and storage.
Sample Preparation and DNA Extraction
Swab samples were placed into tissue lyser (Qiagen) for 10 min at a frequency setting of 20.0 Hz before vortexing and pulse centrifuging of each individual tube. The swabs were removed using a sterile forceps taking care not to cross-contaminate samples. Both swab and filament samples were then spun down at 21,130 g for 10 min in order to form a visible pellet for swab samples and to facilitate ethanol removal. Extraction was then completed using the DNA easy mini kit (Qiagen) according to manufacturer's instructions.
Real-Time PCR (qPCR) Evaluation and Protocols
The published methodologies available at the time for evaluation are listed in Table 1. Qualitative analysis of each assay was assessed in relation to the percentage of positive results for the gill swabs and filament samples in the field trial. The sensitivity, specificity, linearity and correlation to gill score of each assay were also analyzed. In order to investigate the sensitivity of the assays, a plasmid was created and its concentration determined as previously described (Downes et al., 2015). A dilution series was generated and analyzed by the three real-time assays (protocols 1, 2, and 4) to assess the lowest copy numbers detectable. Only dilutions that produced Ct-values in all triplicates were included in the analysis. DNA extracted from in vitro cultures of N. perurans obtained from three countries Norway, Ireland and Australia were used to assess the specificity of each of the assays. Additionally, the assays were appraised with respect to cost (in AUS$) per sample (cost of reagents for each assay for a single sample run in triplicate) and time requirements (runtime for each method in relation to through-put). All results were reviewed and each assay was then ranked on a scale of 1 to 5, with 1 being the most optimal score. These scores were combined and in order to compare the assays.
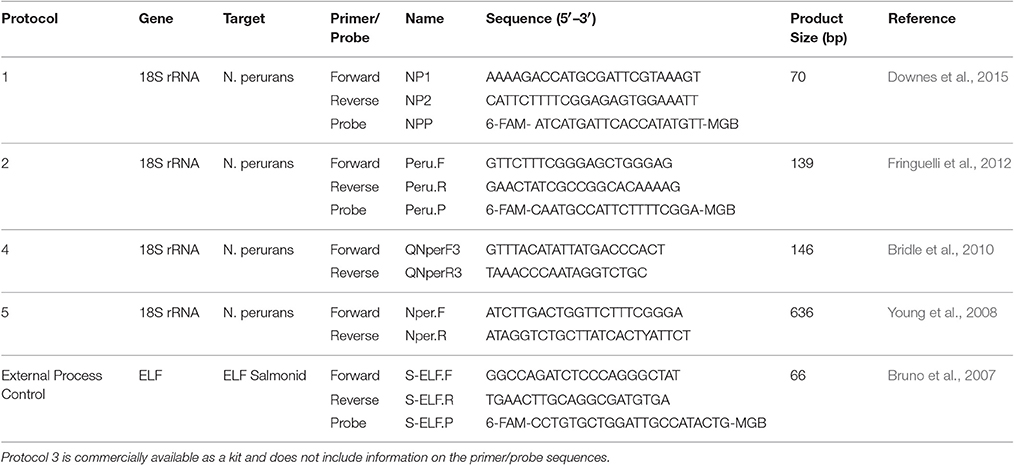
Table 1. A list of the real-time PCR protocols evaluated in this study in addition to the salmon elongation factor assay used as an external process control.
For each protocol, primers were obtained from Sigma (for work completed in Ireland) or GeneWorks (for work completed in Australia). TaqMan probes and master mix for protocols 1 and 2 were purchased from Life Technologies.
Protocol 1
Protocol 1 is a TaqMan® qPCR targeting the 18S rRNA gene sequence of N. perurans generating an amplicon of 70 bp (Downes et al., 2015).
Protocol 2
Protocol 2 is a TaqMan® qPCR targeting the 18S rRNA gene sequence of N. perurans generating an amplicon of 139 bp (Fringuelli et al., 2012).
Protocol 3
Protocol 3 was a commercial kit developed by Primerdesign Ltd for the detection of N. perurans. Each reaction mixture and thermal profile was completed following manufacturer's instructions.
Protocol 4
Protocol 4 was a SYBR® Green protocol targeting the 18S rRNA gene sequence of N. perurans generating an amplicon of 146 bp (Bridle et al., 2010). Each qPCR reaction contained 0.4 μM of each primer, 2x SensiFAST SYBR® Lo-ROX Master Mix (Bioline) and nuclease-free water. Following optimization of this protocol (unpublished) it was determined that addition of neat DNA was not appropriate, resulting in Ct < 10, therefore samples were diluted to ~5 ng μl−1 and 2 μl (10 ng) of DNA was added to each reaction.
The reaction was incubated at 95°C for 10 min followed by 45 cycles of 95°C for 10 s, 60°C for 15 s and 72°C for 34 s. Following the 45 cycles a melt curve analysis was performed to determine the specificity of the reaction. A 5-point standard curve based on a known quantity of cultured cells (chosen from 100, 50, 25, 10, 5, and 1 cell and also diluted down to 5 ng μl−1) was included in each run. To validate the results the melting temperature of the qPCR products were compared with the Tm of the culture (Tm ~77°C). A sample was considered positive if the Tm was between 75 and 77.5°C.
Protocol 5
Protocol 5 was a modified nested PCR based on the first round amplification described by (Young et al., 2008) which amplifies a 636 bp region of the N. perurans 18S rRNA gene followed by a 1:5 dilution of the PCR product in nuclease-free water and analyzing further using protocol 4. The nested PCR consisted of 0.365 μM of each primer, 2x GoTaq® Colorless Master Mix (Promega) and nuclease-free water. This initial amplification was completed for all samples, the full range of the known cell standard curve (100, 50, 25, 10, 5, and 1 cell) and also a Nested No Template Control (Nested NTC). As in Protocol 4, samples and the standard curve were diluted to 5 ng μl−1 and 2 μL (10 ng) of DNA added.
For each protocol, all samples were run in triplicate on an Applied Biosystems AB7500 Real-Time instrument and associated software. Each run included a positive control, a negative control and a non-process control. An external process (salmonid elongation factor-1α; Bruno et al., 2007) control was used for each sample.
Amoebae Culture
In order to conduct an infection trial for the comparison of the preferred assay with traditional screening methods, N. perurans was isolated from farmed Atlantic salmon affected by AGD in the west of Ireland using a method described in Downes et al. (2015), adapted from Morrison et al. (2004). The amoeba culture was established and maintained according to Crosbie et al. (2012). To confirm the presence of N. perurans in the culture, a sub-sample of the culture was tested by conventional PCR (Young et al., 2008). Amoebae were harvested by physical removal from the agar using a bacteriological spreading bar, followed by several seawater washes. The amoeba seawater solution was then collected in a sterile flask. Several counts of the amoeba seawater solution were undertaken using a 1 ml Sedgewick Rafter Counting Chamber (SPI Supplies).
Infection Trial
The infection trial was carried out at the Daithi O'Muruchu Marine Research Station, Bantry, Co. Cork, Ireland using four 400 L flow-through tanks at full salinity which were each stocked with 50 Atlantic salmon smolts weighing ~70 g. Following an acclimation period of 2 weeks, two of the tanks were challenged with cultured N. perurans and two other tanks were used as negative controls. For the infected tanks, the water level was lowered and inoculated with amoeba at 1,000 cells L−1 for 4 h. Throughout the trial the fish were fed 1% of body weight per day, water quality was monitored daily and the temperature was constant at 11–12°C throughout the trial. This work was authorized by the Health Products Regulatory Authority (HPRA) in Ireland under project authorisation number AE19114/P001, following the Animals Scientific Procedures Act 1986 (Directive 2010/63/EU transposed into Irish law by S.I. No 543 of 2012).
Sampling commenced 24 h post-infection with further samples taken at 2, 3, 8, 15, and 21 d post-infection. At each sampling point, three fish were sampled from each tank. Gross gill scoring of individual fish (n = 3) was conducted onsite using the gill scoring system described by Taylor et al. (2009). The second gill arch on the right-hand side was swabbed (Isohelix) and processed as described above for the field trial. Gill swab samples were tested by real-time PCR (Protocol 1). The second gill arch on the left-hand side was excised from each fish and immediately fixed in 10% neutral buffered formalin for histological processing. Sections (5 μm) from paraffin embedded tissue were stained with haematoxylin and eosin and examined microscopically on an Olympus BX51 microscope. In order to determine if there was a correlation between gross pathology and histopathology, a scoring system based on that described by Mitchell et al. (2012) was applied to determine the progression and severity of gill lesions in fish where AGD developed. A score of 0 = normal gill; 1 = low pathology <10% of gill tissue affected; 2 = moderate pathology <50% of gill tissue affected and 3 = severe pathology > than 50% of gill tissue affected. Only histological sections where pathology was observed in the presence of amoeba were recorded as AGD infected (Clark and Nowak, 1999; Rodger, 2014).
Statistical Analysis
Regression analysis was carried out in order to determine the lowest detectable copy number of each of the assays. Spearman's correlation analysis was undertaken to assess the relationship between gross gill pathology scores, histopathology scores and PCR analysis (Minitab 17). Kappa statistics were conducted in order to determine the level of agreement between PCR analysis, gill scoring and histopathology.
Results
Field Trial
Polymerase chain-reaction (PCR) results of each of the five protocols for both gill swabs and filaments are shown in Figure 1. Overall, more positive results were detected by each protocol for gill swab samples compared with gill filament biopsies. Protocol 1 gave 100% positive gill swabs, down to 55% with protocol 4. Protocol 1 gave 79% positive results with gill filament biopsy, compared with 14% for protocols 3 and 4.
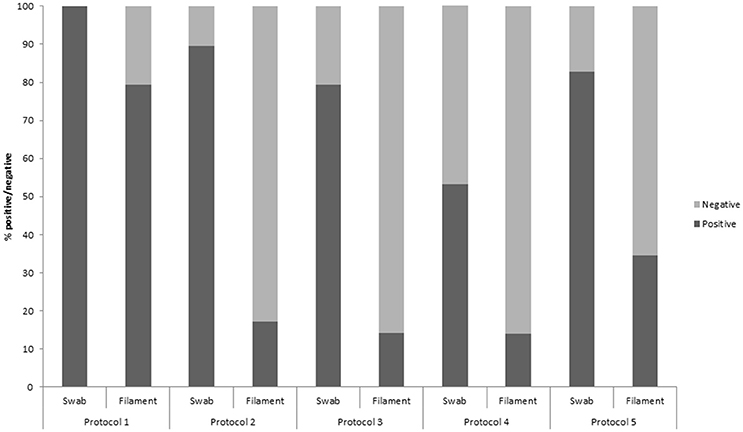
Figure 1. The percentage of gill swab and gill filament biopsy samples which were positive/negative for Neoparamoeba perurans during a natural outbreak of amoebic gill diseases in Atlantic salmon during a field trial, assessed by five qPCR protocols.
The percentage positive results for each protocol, for both gill swab and gill filament biopsy, across each gross gill score (0–5) are shown in Table 2. A higher number of positive results were found when using gill swabs rather than filament biopsies. There is a general increase of positive swab samples with increasing gross gill score, all protocols had 100% positive results at gill score 5 whereas only protocols 1 and 3 gave 100% positive results at gill scores 0–3. In relation to the percentage of positive filament biopsy samples, only protocol 1 found 100% of samples positive at gill scores of 2, 4, and 5.
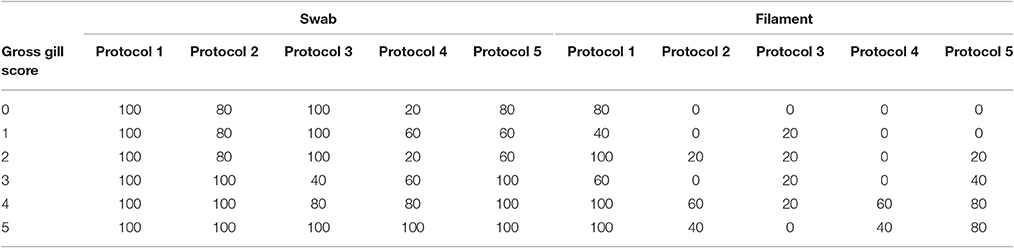
Table 2. The percentage positive results for each protocol for both gill swab and gill filament biopsy samples in relation to gross gill scores in Atlantic salmon during a field trial undergoing natural outbreaks of amoebic gill disease.
Linearity, Efficiency, Sensitivity, and Specificity
The known numbers of cells examined was 25, 10 and 1 amoebae cells and were analyzed by protocols 1, 2, 4, and 5 only. Each assay performed well with multiple cells, only protocols 1 and 2 were found to reliably detect N. perurans down to a single cell (Table 3). Both protocol 1 and 2 provided very similar results for the known quantity of cells and were shown to perform best when analyzing a single cell with average Ct-values of 35.10 and 35.51, respectively. These two assays also had similar linearity R2-values of 0.9679 (Protocol 1) and 0.9605 (Protocol 2), while protocol 5 had the lowest R2-value of 0.8171 (Table 3). Three of the assays were analyzed in relation to the lowest detectable copy numbers, the LOD determined for protocol 1 was 2.64 copies, protocol 2 was 14.7 and protocol 4 was 115 (Table 4). DNA extracted from cultures of N. perurans provided from three countries (Ireland, Norway and Australia) were analyzed to determine specificity and each protocol was found to perform comparatively (all results were positive). The amplification efficiency for each of the assays were found to be comparable and within the expected range of Ex = 90–110%.
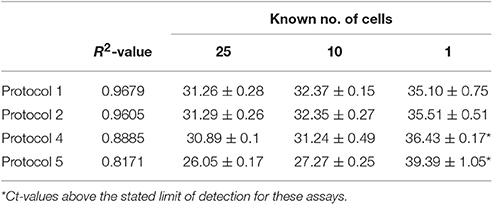
Table 3. Ct-values for known numbers of N. perurans cells and linearity assessed for protocols 1, 2, 4, and 5 (values are mean ± SD).
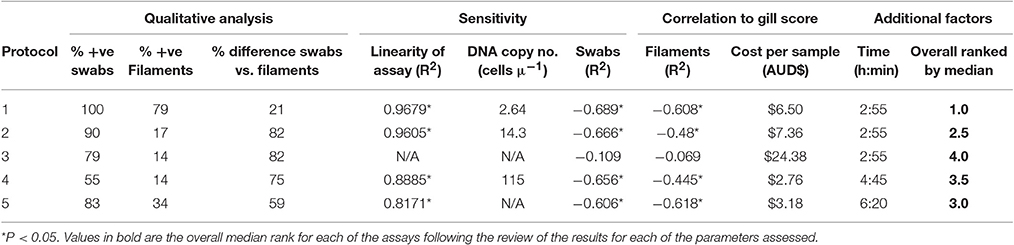
Table 4. Ranking of the real-time PCR protocols on a range of parameters assessed by analyzing samples of naturally infected Atlantic salmon in a field trial.
Swab/Gill Score Correlation
There was a significant (P < 0.01) negative correlation for protocols 1, 2, 4, and 5 when analyzing the Ct-values from the swab samples with the individual gross gill scores of the fish in the field trial (Table 4). The correlation between gross gill scores and gill filament samples was found to be significant for protocols 1, 2, and 5 (P < 0.01), however, the correlation coefficient for each of the assays was noticeably lower for the gill filament samples when compared with gill swab samples (Table 4).
Cost and Time Analysis
In relation to cost per sample, protocol 4 was the cheapest assay at $2.76 AUD and protocol 3 the most expensive at $24.38 AUD (Table 4). With respect to the time required based on a full 96-well plate, protocols 1, 2, and 3 take the same amount of time for analysis at 2 h 55 min, while protocol 5 took 6 h 20 min.
Ranking
All of the results recorded for each of the parameters examined were compared and ranked from 1 to 5 (1 being the optimal) (Table 4). It was found that protocol 1 performed better for several of the parameters, such as PCR efficiency for known cell numbers, % of positive samples for swabs and filaments, % difference between the positive results for swabs and filaments, in addition to having the greatest correlation between swabs and gross gill score. Protocol 5 was ranked 1 for correlation in relation to the filaments and the gill score. Protocol 4 was ranked 1 in relation to cost.
Infection Trial: Comparison of Gill Swab, Histology and Gross Gill Score
Results from the infection trial are shown in Figure 2. Using protocol 1, the first PCR positive samples were detected 2 d post-infection (16%) and by 15 d post-infection 100% of the samples were positive. Both gill score and histology scores first increased above score 0 on 8 d post-infection and continued to increase throughout the remainder of the trial. Gross pathology, as characterized by white mucoid spots and plaques on the gill surface, was first recorded 8 d post-infection. Amoebae were first observed during histological examination 15 d post infection. There was a significant correlation (P > 0.01) between each of the methods analyzed (Table 5). There was a significantly negative correlation between the PCR results and both the gill score (−0.938) and, the histology score (−0.836). Conversely, analysis between the gill score and histology score expressed a significant strong positive correlation (0.849). There was excellent concordance between the PCR and gill score (K = 0.80) and between gill score and histology score (K = 0.80). N. perurans DNA was detected in all samples where AGD was microscopically diagnosed, while overall agreement between the PCR and histology score was good (K = 0.69).
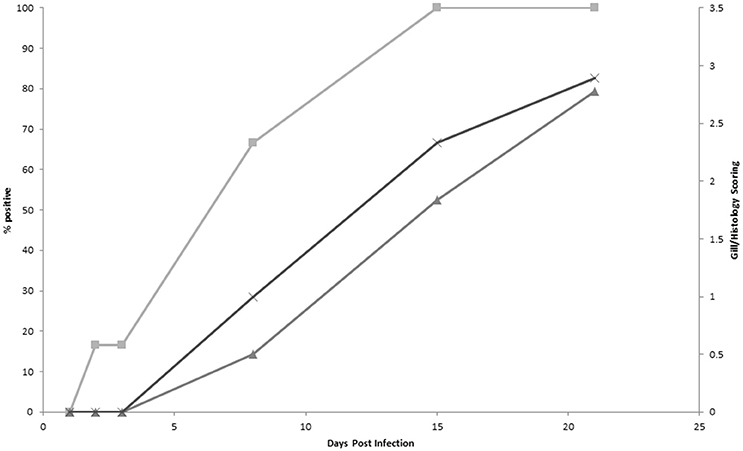
Figure 2. A comparison of qPCR positive results (protocol 1) (■), gross gill score (▲) and histology score (♦) in Atlantic salmon experimentally infected with Neoparamoeba perurans.
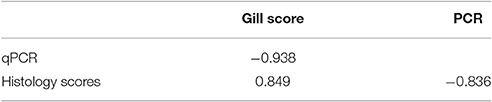
Table 5. Spearmans correlation between gill swab qPCR results, histology score and gross gill scores in Atlantic salmon experimentally infected with Neoparamoeba perurans.
Discussion
The identification of N. perurans as the causative agent of AGD (Young et al., 2007; Crosbie et al., 2012) has allowed the development of a range of molecular based diagnostic assays for the detection of the amoeba. While it is acknowledged that alternative molecular diagnostic assay are available (Haugland et al., in press; Hellebø et al., in press) they have not been published in the literature and therefore could not be included in this study. Therefore, this study has compared a range of published molecular assays available at the time and has shown that gill swab samples are more sensitive than gill filament biopsies, resulting in higher number of positive results from known infected fish. Molecular based diagnostic methods were also shown to correlate well with the more traditional diagnostic methods of gill and histology scoring.
Regular gross gill scoring provides fish farmers with immediate information on AGD prevalence and intensity to support husbandry and treatment decisions. This method is particularly suitable on Atlantic salmon farms that are constantly affected by the disease, allowing operators to become familiar with the gross presentation of lesions. However, the gross gill score can be difficult to interpret when non-AGD pathologies, such as proliferative gill disease or gill necrosis are present (Steinum et al., 2010; Mitchell and Rodger, 2011). It is also reported that the gross gill scoring method is less applicable for other fish species affected by AGD, such as lumpfish (Cyclopterus lumpus) which are used as cleaner fish in Atlantic salmon cages (Haugland et al., in press).
It is clear from the results of this study that gill swabs improved the sensitivity in comparison to gill filament biopsies. Results collected from each of the PCR protocols demonstrated an increase in the number of positive samples detected when samples were taken using the swabs. In addition to the increase in positive detections, there was also a higher correlation between gill swab and gross gill scores across the majority of the assays. The difference observed between the two sampling methods (swabs v filament) is likely due to the greater gill surface area sampled by the swab and there may be a greater abundance of amoeba in the mucous collected on the swab than between the distal filaments. However, one parameter that is likely to have had an effect on the difference of sensitivity between the two sampling methods is that of the matrix effect where the presence of inhibitors affect the sensitivity of the assays (Schrader et al., 2012). There was an observed reduction in the amount of salmon DNA between the gill filament biopsy and the gill swabs when tested using the salmon ELF assay (data not shown). It must be noted that non-detection with some of the assays may be due to the quantity of amoebae DNA below the detection threshold of the assay rather than a technical failure of the assay (Collins et al., 2016).
The qualitative analysis of each protocol demonstrated differences between the positive/negative results produced. As the fish sampled during the field trial were taken from a naturally infected population, which was in its sixth round of AGD infection, it enabled the study to sample a broad range of AGD gross gill scores. The Taqman assays (protocols 1 and 2) produced relatively similar results with respect to the swabs. Conversely, there was a stark difference between the results produced for the filament samples using these two protocols. A shorter amplification fragment and with primers designed closer to the probe in protocol 1 appears to have increased the sensitivity of the assay thus ensuring more positive results when testing the filament samples. The effect of a smaller amplicon size has previously been found to be advantageous for TaqMan assays in the presence of inhibiting compounds (Opel et al., 2010).
When using protocol 4 the melt curve analysis produced multiple peaks, which suggests a composite of more than one product with melting temperatures considerably different to that of the standard/positive control. Samples that produced Ct-values, but a product with a different melting temperature were deemed to be negative. When analyzing the samples with protocol 5 (which was a modified protocol 4), no additional peaks were found for the swab samples and only 20% of the filament biopsy samples produced additional peaks in the melt curve analysis suggesting that the nested PCR (protocol 5) appears to increase the specificity of the SYBR assay (protocol 4). Multiple peaks found in melt curves of SYBR green analysis is generally indicative of non-specific amplification as SYBR green is a dye that binds to all double-stranded DNA molecules, the specificity of an assay based on this chemistry is due only to the choice of primers (Martenot et al., 2010). Consequently, mispriming and the formation of primer dimers can produce false positive results in addition to overestimates of DNA quantities (Bustin, 2000). In other comparisons of SYBR green and TaqMan chemistries where there are low copy numbers of the gene, there is a greater accumulation of primer dimers and non-specific double stranded DNA by the SYBR Green Chemistry (Hein et al., 2001; Martenot et al., 2010). Additionally, TaqMan® chemistry is generally thought to offer a number of advantages over SYBR® green, in particular, the incorporation of minor-groove-binders (MGB) which allow for the raising of melting temperatures of the probes (enabling the use of shorter probes) and integration of the internal hydrolysis probe providing greater specificity in comparison to the intercalating dye assays, which have reduced specificity because any amplification product incorporates the dye. (Gunson et al., 2006; Purcell et al., 2011).
Each assay was designed to amplify specific regions of the 18S rRNA gene, which is generally chosen due to its high copy number, thus potentially increasing sensitivity. The 18S rRNA gene is an established marker for microbial identification, used in numerous studies, with a large database of species specific sequences (Bridle et al., 2010). Another reason for this choice is that multiple copies of this gene are encoded within the eukaryotic genome (Long and Dawid, 1980; Young et al., 2008). Sensitivity in relation to the lowest detectable DNA copy numbers was assessed for protocols 1, 2, and 4. Two of the protocols were not assessed for DNA copy numbers due to availability of information on the primer sequences for protocol 3 and for protocol 5 which was based on the Young et al. (2008) primers which were used to produce the plasmid DNA. From the analysis of the three protocols assessed it was found that protocol 1 was able to detect the lowest concentration of copies of DNA at 2.64 copies μl−1, which approaches the theoretical limit of detection (Purcell et al., 2011). Analysis of protocol 2 gave a concentration of 14.3 copies μl−1 which is similar to levels reported by Fringuelli et al. (2012). Protocol 4 has previously been described as having an LOD of 1.418 copies μl−1, however this was not achievable during this study and was found to be able to detect 115 copies μl−1. Further dilutions produced multiple peaks and incorrect melting temperatures, making melt curve analysis difficult.
Correlations between the molecular results and the gill scores were consistent for each of the protocols used during the field trial for both gill swabs and filament biopsies. Previously Bridle et al. (2010) reported excellent agreement between AGD gross gill scores (Powell et al., 2001) and molecular results (gill scores 1 through to 4, no gill score 0), though the gill area sampled, fish size and season are not specified. The results of the current field study showed lower agreement, which may reflect the wider gill score range used in this study (from 0 to 5). The samples were taken in early Autumn (Australia), which is typically associated with a slowing of AGD pathology and the onset of non-specific gill necrosis prior to winter. A higher correlation between gill score and gross pathology was recorded in the naïve smolt during the infection trial. This may be an indication of the differences between initial and subsequent infections (as the fish in the field trial had undergone previous cycles of AGD and freshwater treatment) and may also reflect differences in host tolerance or resistance to amoeba exposure between naive smolts and larger fish following several rounds of bathing and reinfection.
Taking into account the additional factors assessed for each of the assays, it is clear that the SYBR green protocols are generally cheaper to run as they do not require the inclusion of costly hydrolysis probes. The higher cost of the commercial product is due to the inclusion in the cost of several other reagents in the kit, required for controls and standard curves. In relation to time, the SYBR green assays require longer run times due to addition of melt curve analyses which result in a reduced throughput rate in comparison to that of the TaqMan protocols. Protocol 1 was seen to perform most favorably across most of the attributes assessed and was ranked by median score as the most suitable assay. Following this it was decided to compare protocol 1 with traditional screening methods (gross gill scoring and histopathology) during an infection trial.
The gross gill scoring, histological scoring and in particular the molecular data presented showed that detection of N. perurans was possible within 2weeks post-infection and has been previously reported (Morrison et al., 2004; Taylor et al., 2007). Histological examination of the samples in this study identified pathological changes within the first week; however the observation of amoeba in the presence of pathology and therefore case definition was not confirmed by histology until the second week. While histopathology can indicate both the presence of the pathogen and resultant host response, it requires destructive sampling which could potentially limit the scale of epidemiological studies (Douglas-Helders et al., 2001; Adams et al., 2004) and is not suitable for screening valuable fish e.g., tagged individuals in a breeding program. Molecular analysis did however confirm the presence of N. perurans in the first 48 h of infection and subsequently at each further sampling point. This clearly indicates the usefulness of this non-destructive molecular diagnostic assay for the early detection of N. perurans and in sub-clinical cases of AGD. Additionally, with significant gains made through selective breeding (as measured by reduced gill score, Kube et al., 2012) there is an opportunity to fully optimize non-destructive sampling techniques in conjunction with molecular methods to help inform management decisions, such as when to treat fish and also determine the efficacy of treatments, and to more finely measure potential gains in AGD resistance/resilience.
Author Contributions
Conceived and designed the experiments: JD, RT, MC, EM, and NR. Performed the experiments and sample analysis: JD, MR, RT, BM, MM, and EC. Writing and editing manuscript: JD, RT, EM, IO, HR, NR, and MC.
Funding
This project is funded under the Marine Institute Research Fellowship Programme (project MEFSS/ PhD/2013). JD study visit to Tasmania was carried out with the support of the Marine Institute under the Marine Research Sub-programme funded by the Irish Government.
Conflict of Interest Statement
The authors declare that the research was conducted in the absence of any commercial or financial relationships that could be construed as a potential conflict of interest.
Acknowledgments
The authors wish to thank Tassal Operations Pty Ltd., for their support of the project and particularly Chantelle Reid and Daniel Smith for assistance with sampling (Tasmania).
References
Adams, M. B., Ellard, K., and Nowak, B. F. (2004). Gross pathology and its relationship with histopathology of amoebic gill disease (AGD) in farmed Atlantic salmon, Salmo salar L. J. Fish Dis. 27, 151–161. doi: 10.1111/j.1365-2761.2004.00526.x
Adams, M., Crosbie, P., and Nowak, B. (2012). Preliminary success using hydrogen peroxide to treat Atlantic salmon, Salmo salar L., affected with experimentally induced amoebic gill disease (AGD). J. Fish Dis. 35, 839–848. doi: 10.1111/j.1365-2761.2012.01422.x
Bridle, A. R., Crosbie, P. B. B., Cadoret, K., and Nowak, B. F. (2010). Rapid detection and quantification of Neoparamoeba perurans in the marine environment. Aquaculture 309, 56–61. doi: 10.1016/j.aquaculture.2010.09.018
Bruno, D., Collet, B., Turnbull, A., Kilburn, R., Walker, A., Pendrey, D., et al. (2007). Evaluation and development of diagnostic methods for Renibacterium salmoninarum causing bacterial kidney disease (BKD) in the UK. Aquaculture 269, 114–122. doi: 10.1016/j.aquaculture.2007.04.057
Bustin, S. A. (2000). Absolute quantification of mRNA using real-time reverse transcription polymerase chain reaction assays. J. Mol. Endocrinol. 25, 169–193. doi: 10.1677/jme.0.0250169
Bustos, P. A., Young, N. D., Rozas, M. A., Bohle, H. M., Ildefonso, R. S., Morrison, R. N., et al. (2011). Amoebic gill disease (AGD) in Atlantic salmon (Salmo salar) farmed in Chile. Aquaculture 310, 281–288. doi: 10.1016/j.aquaculture.2010.11.001
Clark, A., and Nowak, B. F. (1999). Field investigations of amoebic gill disease in Atlantic salmon, Salmo salar L., in Tasmania. J. Fish Dis. 22, 433–443. doi: 10.1046/j.1365-2761.1999.00175.x
Collins, C., Hall, M., Bruno, D., Sokolowska, J., Duncan, L., Yuecel, R., et al. (2016). Generation of Paramoeba perurans clonal cultures using flow cytometry and confirmation of virulence. J. Fish Dis. 40, 351–365. doi: 10.1111/jfd.12517
Costello, M. J. (2009). The global economic cost of sea lice to the salmonid farming industry. J. Fish Dis. 32, 115–118. doi: 10.1111/j.1365-2761.2008.01011.x
Crosbie, P. B., Bridle, A. R., Cadoret, K., and Nowak, B. F. (2012). In vitro cultured Neoparamoeba perurans causes amoebic gill disease in Atlantic salmon and fulfils Koch's postulates. Int. J. Parasitol. 42, 511–515. doi: 10.1016/j.ijpara.2012.04.002
Douglas-Helders, M., Carson, J., Howard, T., and Nowak, B. (2001). Development and validation of a new dot blot test for the detection of Paramoeba pemaquidensis (Page) in fish. J. Fish Dis. 24, 273–280. doi: 10.1046/j.1365-2761.2001.00295.x
Downes, J., Henshilwood, K., Collins, E., Ryan, A., O'Connor, I., Rodger, H., et al. (2015). A longitudinal study of amoebic gill disease on a marine Atlantic salmon farm utilising a real-time PCR assay for the detection of Neoparamoeba perurans. Aquac. Environ. Interact. 7, 239–251. doi: 10.3354/aei00150
Fringuelli, E., Gordon, A. W., Rodger, H., Welsh, M. D., and Graham, D. A. (2012). Detection of Neoparamoeba perurans by duplex quantitative Taqman real-time PCR in formalin-fixed, paraffin-embedded Atlantic salmonid gill tissues. J. Fish Dis. 35, 711–724. doi: 10.1111/j.1365-2761.2012.01395.x
Gunson, R. N., Collins, T. C., and Carman, W. F. (2006). Practical experience of high throughput real time PCR in the routine diagnostic virology setting. J. Clin. Virol. 35, 355–367. doi: 10.1016/j.jcv.2005.12.006
Haugland, G. T., Olsen, A. B., Ronneseth, A., and Andersen, L. (in press). Lumpfish (Cyclopterus lumpus L.) develop amoebic gill disease (AGD) after experimental challenge with Paramoeba perurans and can transfer amoebae to Atlantic salmon (Salmo salar L.). Aquaculture. doi: 10.1016/j.aquaculture.2016.04.001
Hein, I., Lehner, A., Rieck, P., Klein, K., Brandl, E., and Wagner, M. (2001). Comparison of different approaches to quantify Staphylococcus aureus cells by real-time quantitative PCR and application of this technique for examination of cheese. Appl. Environ. Microbiol. 67, 3122–3126. doi: 10.1128/AEM.67.7.3122-3126.2001
Hellebø, A., Stene, A., and Aspehaug, V. (in press). PCR survey for Paramoeba perurans in fauna, environmental samples fish associated with marine farming sites for Atlantic salmon (Salmo salar L.). J. Fish Dis. doi: 10.1111/jfd.12546
Kube, P. D., Taylor, R. S., and Elliott, N. G. (2012). Genetic variation in parasite resistance of Atlantic salmon to amoebic gill disease over multiple infections. Aquaculture 364–365, 165–172. doi: 10.1016/j.aquaculture.2012.08.026
Long, E. O., and Dawid, I. B. (1980). Repeated genes in eukaryotes. Annu. Rev. Biochem. 49, 727–764. doi: 10.1146/annurev.bi.49.070180.003455
Martenot, C., Oden, E., Travaillé, E., Malas, J. P., and Houssin, M. (2010). Comparison of two real-time PCR methods for detection of ostreid herpesvirus 1 in the Pacific oyster Crassostrea gigas. J. Virol. Methods 170, 86–89. doi: 10.1016/j.jviromet.2010.09.003
McCarthy, U., Hall, M., Schrittwieser, M., Ho, Y. M., Collins, C., Feehan, L., et al. (2015). “Assessment of the viability of Neoparamoeba perurans following exposure to hydrogen peroxide (SARF SP005),” in A study commissioned by the Scottish Aquaculture Research Forum (SARF). Available online at: http://www.sarf.org.uk/
Mitchell, S. O., Baxter, E. J., Holland, C., and Rodger, H. D. (2012). Development of a novel histopathological gill scoring protocol for assessment of gill health during a longitudinal study in marine-farmed Atlantic salmon (Salmo salar). Aquac. Int. 20, 813–825. doi: 10.1007/s10499-012-9504-x
Mitchell, S. O., and Rodger, H. D. (2011). A review of infectious gill disease in marine salmonid fish. J. Fish Dis. 34, 411–432. doi: 10.1111/j.1365-2761.2011.01251.x
Morrison, R. N., Crosbie, P. B. B., and Nowak, B. F. (2004). The induction of laboratory-based amoebic gill disease revisited. J. Fish Dis. 27, 445–449. doi: 10.1111/j.1365-2761.2004.00561.x
Munday, B. L., Zilberg, D., and Findlay, V. (2001). Gill disease of marine fish caused by infection with Neoparamoeba pemaquidensis. J. Fish Dis. 24, 497–507. doi: 10.1046/j.1365-2761.2001.00329.x
Nowak, B., Valdenegro-Vega, V., Crosbie, P., and Bridle, A. (2014). Immunity to amoeba. Dev. Comp. Immunol. 43, 257–267. doi: 10.1016/j.dci.2013.07.021
Oldham, T., Rodger, H., and Nowak, B. F. (2016). Incidence and distribution of amoebic gill disease (AGD)-An epidemiological review. Aquaculture 457, 35–42. doi: 10.1016/j.aquaculture.2016.02.013
Opel, K. L., Chung, D., and McCord, B. R. (2010). A study of PCR inhibition mechanisms using real time PCR. J. Forensic Sci. 55, 25–33. doi: 10.1111/j.1556-4029.2009.01245.x
Powell, M. D., Parsons, H. J., and Nowak, B. F. (2001). Physiological effects of freshwater bathing of Atlantic salmon (Salmo salar) as a treatment for amoebic gill disease. Aquaculture 199, 259–266. doi: 10.1016/S0044-8486(01)00573-7
Purcell, M. K., Getchell, R. G., McClure, C. A., and Garver, K. A. (2011). Quantitative polymerase chain reaction (PCR) for detection of aquatic animal pathogens in a diagnostic laboratory setting. J. Aquat. Anim. Health 23, 148–161. doi: 10.1080/08997659.2011.620217
Rodger, H. D. (2014). Amoebic gill disease (AGD) in farmed salmon (Salmo salar) in Europe. Fish Vet. J. 14, 16–26.
Rodger, H. D., and McArdle, J. F. (1996). An outbreak of amoebic gill disease in Ireland. Vet. Rec. 139:348. doi: 10.1136/vr.139.14.348
Rozas, M., Bohle, H., Ildefonso, R., and Bustos, P. (2011). Development of PCR assay for detection of Neoparamoeba perurans and comparison of histological diagnosis. Bull. Eur. Assoc. Fish Pathol. 31, 211–218.
Schrader, C., Schielke, A., Ellerbroek, L., and Johne, R. (2012). PCR inhibitors-occurrence, properties and removal. J. Appl. Microbiol. 113, 1014–1026. doi: 10.1111/j.1365-2672.2012.05384.x
Shinn, A. P., Pratoomyot, J., Bron, J. E., Paladini, G., Brooker, E. E., and Brooker, A. J. (2015). Economic costs of protistan and metazoan parasites to global mariculture. Parasitology 142, 196–270. doi: 10.1017/S0031182014001437
Steinum, T., Kvellestad, A., Colquhoun, D. J., Heum, M., Mohammad, S., Grøntvedt, R. N., et al. (2010). Microbial and pathological findings in farmed Atlantic salmon Salmo salar with proliferative gill inflammation. Dis. Aquat. Org. 91, 201–211. doi: 10.3354/dao02266
Steinum, T., Kvellestad, A., Rønneberg, L. B., Nilsen, H., Asheim, A., Fjell, K., et al. (2008). First cases of amoebic gill disease (AGD) in Norwegian seawater farmed Atlantic salmon, Salmo salar L., and phylogeny of the causative amoeba using 18S cDNA sequences. J. Fish Dis. 31, 205–214. doi: 10.1111/j.1365-2761.2007.00893.x
Taylor, R. S., Muller, W. J., Cook, M. T., Kube, P. D., and Elliott, N. G. (2009). Gill observations in Atlantic salmon (Salmo salar, L.) during repeated amoebic gill disease (AGD) field exposure and survival challenge. Aquaculture 290, 1–8. doi: 10.1016/j.aquaculture.2009.01.030
Taylor, R. S., Wynne, J. W., Kube, P. D., and Elliott, N. G. (2007). Genetic variation of resistance to amoebic gill disease in Atlantic salmon (Salmo salar) assessed in a challenge system. Aquaculture 272, S94–S99. doi: 10.1016/j.aquaculture.2007.08.007
Young, N. D., Crosbie, P. B. B., Adams, M. B., Nowak, B. F., and Morrison, R. N. (2007). Neoparamoeba perurans n. sp., an agent of amoebic gill disease of Atlantic salmon (Salmo salar). Int. J. Parasitol. 37, 1469–1481. doi: 10.1016/j.ijpara.2007.04.018
Keywords: Atlantic salmon, amoebic gill disease, Neoparamoeba perurans, molecular diagnostics, method validation
Citation: Downes JK, Rigby ML, Taylor RS, Maynard BT, MacCarthy E, O'Connor I, Marcos-Lopez M, Rodger HD, Collins E, Ruane NM and Cook MT (2017) Evaluation of Non-destructive Molecular Diagnostics for the Detection of Neoparamoeba perurans. Front. Mar. Sci. 4:61. doi: 10.3389/fmars.2017.00061
Received: 30 September 2016; Accepted: 17 February 2017;
Published: 02 March 2017.
Edited by:
Rubina Sirri, University of Bologna, ItalyReviewed by:
Lorenzo Gallus, University of Genoa, ItalyMikko Juhani Nikinmaa, University of Turku, Finland
Karl Blyth Andree, Institute of Agrifood Research and Technology (IRTA), Spain
Copyright © 2017 Downes, Rigby, Taylor, Maynard, MacCarthy, O'Connor, Marcos-Lopez, Rodger, Collins, Ruane and Cook. This is an open-access article distributed under the terms of the Creative Commons Attribution License (CC BY). The use, distribution or reproduction in other forums is permitted, provided the original author(s) or licensor are credited and that the original publication in this journal is cited, in accordance with accepted academic practice. No use, distribution or reproduction is permitted which does not comply with these terms.
*Correspondence: Jamie K. Downes, amFtaWUuZG93bmVzQG1hcmluZS5pZQ==