 Kai G. Schulz1,2*
 Lennart T. Bach2
 Richard G. J. Bellerby3,4
 Rafael Bermúdez2,5
 Jan Büdenbender2
 Tim Boxhammer2Jan Czerny2
 Anja Engel2
 Andrea Ludwig2Michael Meyerhöfer2Aud Larsen6
 Allanah J. Paul2Michael Sswat2
 Ulf Riebesell2
- 1Centre for Coastal Biogeochemistry, School of Environment, Science and Engineering, Southern Cross University, Lismore, NSW, Australia
- 2GEOMAR Helmholtz Centre for Ocean Research Kiel, Kiel, Germany
- 3SKLEC-NIVA Centre for Marine and Coastal Climate Research, East China Normal University, Shanghai, China
- 4Norwegian Institute for Water Research, Bergen, Norway
- 5Facultad de Ingeniería Marítima, Ciencias Biológicas, Oceánicas y Recursos Naturales, Escuela Superior Politécnica del Litoral (ESPOL), Guayaquil, Ecuador
- 6Uni Research Environment, Hjort Centre for Marine Ecosystems Dynamics, Bergen, Norway
Anthropogenic emissions of carbon dioxide (CO2) and the ongoing accumulation in the surface ocean together with concomitantly decreasing pH and calcium carbonate saturation states have the potential to impact phytoplankton community composition and therefore biogeochemical element cycling on a global scale. Here we report on a recent mesocosm CO2 perturbation study (Raunefjorden, Norway), with a focus on organic matter and phytoplankton dynamics. Cell numbers of three phytoplankton groups were particularly affected by increasing levels of seawater CO2 throughout the entire experiment, with the cyanobacterium Synechococcus and picoeukaryotes (prasinophytes) profiting, and the coccolithophore Emiliania huxleyi (prymnesiophyte) being negatively impacted. Combining these results with other phytoplankton community CO2 experiments into a data-set of global coverage suggests that, whenever CO2 effects are found, prymnesiophyte (especially coccolithophore) abundances are negatively affected, while the opposite holds true for small picoeukaryotes belonging to the class of prasinophytes, or the division of chlorophytes in general. Future reductions in calcium carbonate-producing coccolithophores, providing ballast which accelerates the sinking of particulate organic matter, together with increases in picoeukaryotes, an important component of the microbial loop in the euphotic zone, have the potential to impact marine export production, with feedbacks to Earth's climate system.
1. Introduction
Increasing levels of atmospheric carbon dioxide (CO2) as the result of anthropogenic burning of fossil fuels, and variations in land-use and deforestation are driving a number of environmental changes on a global scale (Ciais et al., 2013). In the surface ocean, simultaneous CO2 concentration increases reduce pH and calcium carbonate saturation states (Ω). Increasing CO2 and decreasing seawater pH have the potential to selectively affect the photosynthetic activity and growth of marine phytoplankton, due to individual sensitivities of so-called carbon concentrating mechanisms (for a review see e.g., Giordano et al., 2005; Reinfelder, 2010). Declining pH and Ω are thought to be of special importance for marine calcifiers such as corals, mollusks or the autotrophic group of pelagic coccolithophores (see Kroeker et al., 2010 for a meta-analysis but also Cyronak et al., 2016a,b; Waldbusser et al., 2016 for a discussion on the role of individual carbonate chemistry parameters). Furthermore, increasing surface ocean temperatures have been hypothesized to lead to the shoaling of the upper mixed layer depth, changing light and nutrient availability for marine primary producers. This has the potential to impact marine primary productivity (Bopp et al., 2001; Boyd and Doney, 2002) and marine export production (Laufkötter et al., 2016). The mechanisms behind such changes include phytoplankton species specific requirements and sensitivities for CO2 and , pH, inorganic nutrients, light and temperature, which in turn will influence community composition, a major factor shaping export efficiency, i.e., the ratio of carbon exported to the depth of the euphotic zone (<1% light penetration) to surface net primary production, and transfer efficiency in the deep ocean, i.e., the ratio of carbon reaching deeper layers to export production. Together, the attenuation of the organic carbon flux with depth and marine primary productivity ultimately determine the amount of atmospheric carbon locked away in the deeper ocean for timescales beyond decades (compare e.g., Buessler and Boyd, 2009; De La Rocha and Passow, 2014; Mouw et al., 2016).
Assessing the impact of increasing CO2 levels and associated carbonate chemistry changes on phytoplankton community composition require incubations of natural assemblages, allowing for species interaction and competition. Experimental setups vary in a number of aspects, including location, duration and volume (Table 1), which could influence observed responses. For instance, the larger the experimental volume, the more trophic levels can be accommodated, adding important processes such as grazing by and of herbivores (for an overview see Riebesell et al., 2013 and references therein). And the longer an experiment can be run, the higher the likelihood for potential direct CO2 effects to become detectable and trigger indirect ones (Schulz et al., 2013).
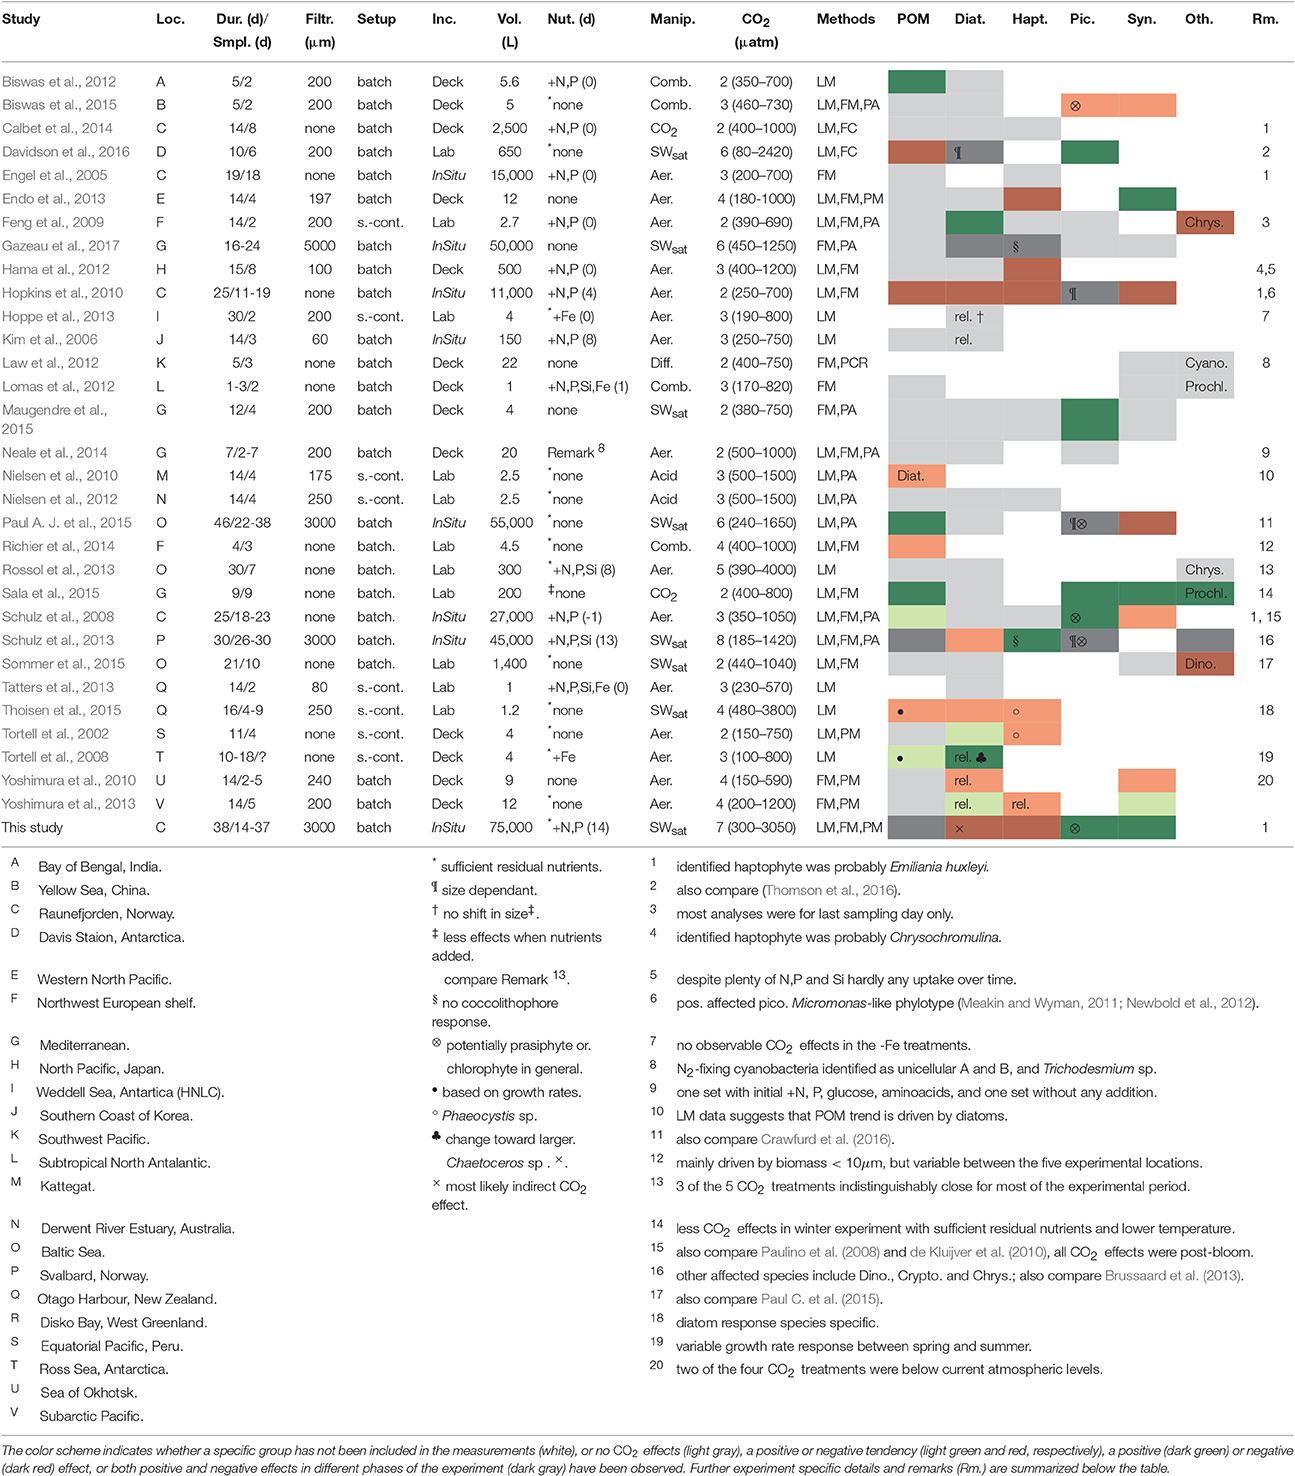
Table 1. Comparison of published experiments on CO2 effects on phytoplankton community composition, in terms of experimental setup and findings, i.e., at different locations (Loc.), duration (Dur.) and number of sampling days (Sampl.), type of incubation (Inc.) at in-situ light and temperature (InSitu), semi-natural light and temperature (Deck) and fully controlled light and temperature (Lab) conditions, volume (Vol.), inorganic nutrient (Nut.) additions and timing, carbonate chemistry manipulation approach (Manip.), either by combined additions of sodium carbonate/bicarbonate and acid (Comb.), direct CO2 gas additions (CO2), aeration at target pCO2 levels (Aer.), diffusive CO2 supply (Diff.), CO2 saturated seawater addition (SWsat) or acid/base additions (Acid), number of treatments and pCO2 range applied (CO2), methods employed to characterize phytoplankton community composition, being it by light microscopy (LM), flow cytometry (FM), pigment analysis (PA), FlowCam (FC) or genetic approaches (PCR), and measured effects on particulate organic matter in general (POM), diatoms (Diat.), haptophytes (Hapt.), picoeukaryotes (Pic.), Synechococcus (Syn.) or other (Oth.) phytoplankton groups including chrysophytes (Chrys.), cyanobacteria in general (Cyano.), Prochlorococcus, (Prochl.) and dinoflagellates (Dino.).
There have been attempts to search for general patterns in phytoplankton community composition changes in response to changing carbonate chemistry by comparing past experiments (e.g., Riebesell, 2004; Boyd et al., 2010; Gao et al., 2012). However, in the last 4 years alone the amount of studies investigating the effects of increasing CO2 levels on marine phytoplankton community composition has more than doubled. This significant increase in available data should considerably facilitate the identification of general patterns.
Here we report on original results from a mesocosm CO2 perturbation study in Raunefjorden, Norway, in 2011 and compare the observed effects on phytoplankton community composition to similar studies at the same location. This allows identification of experimental differences, potentially responsible for differing results. In a second step, community composition responses to increasing CO2 are compared across thirty one studies, in an attempt to identify repeating general patterns within certain phytoplankton groups. Finally, potential impacts of changes in phytoplankton community composition on biogeochemical element cycling are discussed.
2. Methods
2.1. Mesocosm Setup
On 30 April 2011 (day -8) nine mesocosms were deployed from the research vessel R/V Alkor in Raunefjorden, Norway, and moored in rows of three at about 60.265°N and 5.205°E. The experimental setup and design of this KOSMOS study (Kiel Off-Shore Mesocosms for future Ocean Simulations) was similar to a previous one in Kongsfjorden on the west coast of Spitsbergen (for details see Riebesell et al., 2013; Schulz et al., 2013). Briefly, following deployment and mooring of the floating structures (see Figure 1 for a chronology of major experimental events) the 25 m long and 2 m in diameter (0.5–1 mm thick) thermoplastic polyurethane bags were lowered to depth the next day, thereby enclosing a natural plankton community. Screens with a 3 mm mesh size attached to the bottom (instead of the funnel-shaped sediment trap) and top of the bags, excluded larger plankton species. Furthermore, the upper ring of the bags were pulled about 1.5 m underneath the water surface and the enclosed water was allowed to exchange freely with that of the surrounding fjord water passing by for an additional 3 days. Then on day −4 the screens were removed and the funnel-shaped sediment traps mounted by divers while the upper rings were pulled out of the water and attached about 1.5 m above the water line (see Figure S-1 for details). On top of the floating structures dome-shaped roofs were mounted to reduce potential freshwater and dirt input. A full description of the KOSMOS setup can be found in Riebesell et al. (2013).
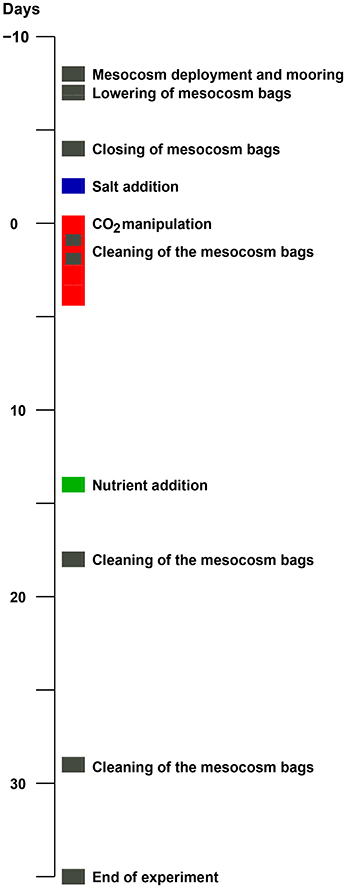
Figure 1. Timeline of major experimental events. The mesocosm deployment and mooring on day -8 was on April 30, and the end of the experiment on June 7, day 35. See Section 2.1 for details.
2.2. Volume Determination
Adding a precisely calibrated brine solution of known mass to each of the mesocosms allows determination of the enclosed seawater volume by monitoring the change in salinity. Exact knowledge of the amount of seawater in each mesocosm is paramount for certain manipulations such as dissolved inorganic nutrient additions. A full description of this approach can be found in Czerny et al. (2013). To summarize, the hand-operated Sea and Sun Technology memory probe CTD 60M (for full sensor details and corresponding accuracy and precision see Schulz and Riebesell, 2013) was used to monitor vertical salinity profiles in each mesocosm before and after the even addition (~100 kg per mesocosm) of the calibrated brine solution (~300 g NaCl kg−1 seawater) on day -2. The overall change in mean salinity was about 0.3 units (compare Figure S-2B) and the estimated uncertainty in volume determination was less than 1%. Seawater volumes ranged from 73.5 to 79.9 m3. Prior to the salt addition, on days -4 and -3, the water column in all mesocosms was homogenized by aeration with compressed air for 45 s.
2.3. Carbon Dioxide Addition
Seawater carbonate chemistry manipulations were by additions of CO2 enriched seawater, by increasing dissolved inorganic carbon (DIC) concentrations while keeping total alkalinity (TA) constant (Schulz et al., 2009; Gattuso et al., 2010). A full description of the various steps involved in preparing and evenly adding the CO2 enriched seawater can be found in Riebesell et al. (2013). Briefly, while two mesocosms were chosen to serve as controls varying amounts of CO2 enriched seawater were added to the remaining seven mesocosms over a period of five consecutive days (from day 0 to 4), creating an fCO2 (fugacity of carbon dioxide) and corresponding pHT gradient ranging from initially ~300 to ~3,055 μatm and ~8.14 to ~7.20, respectively (see Table 2 and Figure 2 for details). Although the three highest CO2 levels might seem unrealistically high in comparison to projections for the end of this century, they were chosen to act as “proof of concept” while keeping the majority of mesocosms within realistic boundaries. After the CO2 manipulation, seawater carbonate chemistry speciation was allowed to drift freely in response to air-sea CO2 gas exchange and biological activity.
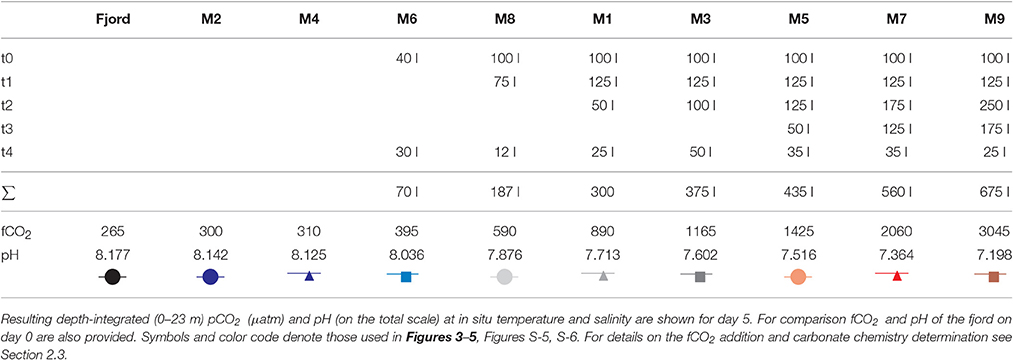
Table 2. Amounts of CO2 enriched seawater added to the mesocosms on 5 consecutive days.
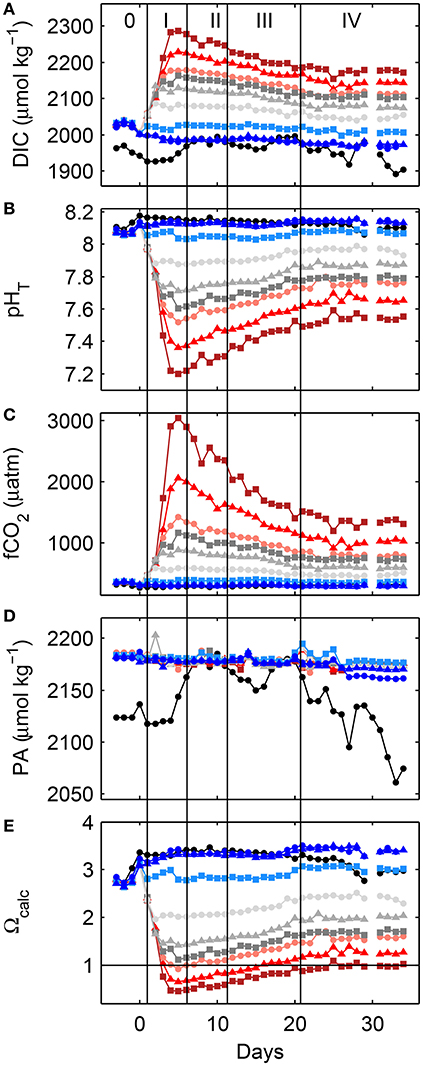
Figure 2. Changes in depth-integrated (0–23 m) measured dissolved inorganic carbon (A) and pHT (B), and calculated fugacity of carbon dioxide (C), practical alkalinity, PA (D) and calcite saturation state (E) at in-situ conditions. For symbols and color coding see Table 2. Vertical lines and Roman numbers illustrate the different phases during this experiment while 0 is the phase prior to any significant CO2 gradient. For details on phases and CO2 calculations see Sections 3.1 and 2.7, respectively. Note that the drop in salinity-derived PA estimates in mesocosm M2 from day 27 onwards is related to water exchange with the fjord (see Section 2.8 for details).
2.4. Nutrient Addition
Dissolved inorganic nutrients were added about half-way through the experiment on day 14, to increase nitrate () by 5 μmoll−1, together with phosphate () in a 32:1 ratio. This addition was meant to simulate up-welling of nutrient-enriched deep water, stimulating autotrophic growth. The relatively high N/P stoichiometry was chosen to increase the competitive fitness of the coccolithophore Emiliania huxleyi over other phytoplankton species, promoting the potential for bloom formation (Egge and Heimdal, 1994). This is a procedure successfully employed in several other experiments at the same location and time of year (e.g., Engel et al., 2005; Schulz et al., 2008) and was also the rational behind the decision not to supply additional silicate. While the latter would have left a smaller share of the added nitrate and phosphate for the other phytoplankton groups to be utilized, the observed direct CO2 effects, however, should have prevailed as driven by impacts on cellular growth rates (compare Sections 4.2 and 4.4.1 for details). For the purpose of nutrient addition, a single stock solution containing suitable concentrations of NaNO3 and NaH2PO4 was prepared in Milli-Q water and added as described in Schulz et al. (2013).
2.5. Sampling Procedures, CTD Operation and Light Measurements
Sampling procedures, CTD operation and light measurements are described in full detail in Riebesell et al. (2013) and Schulz et al. (2013). In short, the water column of each mesocosm was representatively sampled each day, typically between 09:00 and 11:00 local time, by means of depth-integrating water samplers IWS (HYDROBIOS) from 0–23 m. Samples for dissolved inorganic carbon (DIC) and pH were the first samples drawn from an IWS and filled from the bottom to top into 500 ml glass stoppered bottles (Schott Duran) using Tygon tubing, with considerable overflow. Water samples brought back to shore were stored at in-situ temperatures in the dark and processed within the next hours.
Daily CTD casts in each mesocosm and the fjord were typically between 14:00 and 16:00. For a full list of the CTD60M (Sea and Sun Technology) sensors and associated accuracies and precisions see Schulz and Riebesell (2013). The fast shallow-water oxygen sensor (AMT Analysenmesstechnik GmbH, precision better than 2%, i.e., better than ~6 μmolkg−1) had relatively stable readings (depth-averaged mean of 319 ± 4 μmolkg−1) in the fjord until day 10. Then after a sharp drop by about 40 μmolkg−1 the next day, depth-averaged dissolved oxygen concentrations continued decreasing to about 225 μmolkg−1 toward the end of the experiment, probably due to continuous sensor degradation. Thus, measured depth-averaged oxygen concentrations in each mesocosm were normalized daily to corresponding levels in the fjord, termed hereafter Δ[O2], thus not reflecting absolute concentration changes but allowing to compare mesocosms among each other. CTD pH measurements were corrected and brought to the total scale by daily linear regressions (R2 typically better than 0.99) of mean water column (0.3–23 m) pH as derived from CTD profiles vs. spectrophotometrically determined pH on the total scale (see Section 2.7 and Section S-3.1 for details) of IWS samples at in-situ temperatures.
Measurements of photosynthetic active radiation (PAR) were performed with a LI-192 quantum sensor (LICOR) mounted on a pole in about 2 meters height in air, and underwater in parallel to CTD casts with a spherical quantum sensor LI-193 (LICOR). Due to a power failure measurements of incident PAR in air between days 4 and 9 were lost.
2.6. Analyses
Samples for particulate organic carbon, nitrogen and phosphorus (POC, PON, POP) and total particulate carbon and nitrogen (TPC and TPN) were taken by filtration of typically 500 ml of seawater onto pre-combusted (450°C for 5 h) duplicate GF/F filters. Sample water for dissolved organic carbon, nitrogen and phosphorus (DOC, DON, DOP) was passed through pre-combusted, acid and Milli-Q rinsed GF/F filters. Pigment samples including chlorophyll a (Chl a) were again taken by filtration of similar amounts of seawater onto GF/F filters, while for the collection of biogenic silica (BSi) cellulose acetate filters (0.45 μm) were used. POC/PON filters were fumed over 37% HCl in a desiccator for 2 h prior to drying and analysis and measured together with dried TPC/TPN filters according to Sharp (1974) on a EuroVector elemental analyser. Given the relatively small contribution of particulate inorganic carbon (PIC) to TPC by Emiliania huxleyi of less than 1 μmoll−1 for most of the experiment (at cell numbers of less than 1,000 cells/ml and assuming a cellular PIC quota of about 10 pg), and given increased noise in the acid-fumed filters, probably due to storage in plastic petri-dishes, both TPC and POC, and TPN and PON measurements were pooled, averaged and reported as particulate organic carbon and nitrogen in the following. POP, DOP and BSi were measured following Hansen and Koroleff (1999) on a Hitachi U2000 spectrophotometer, Chla and other phytoplankton pigments on a WATERS high performance liquid chromatograph (HPLC) equipped with a Varian Microsorb-MV 100-3 C8 column according to Barlow et al. (1997), and DOC and DON as detailed in Engel et al. (2014) and described by Qian and Mopper (1996) and Cauwet (1999) on a Shimadzu TOC-VCH. Further details on actual analytical procedures can be found in Schulz et al. (2013) and it is noted that the here reported POP might comprise an inorganic phase (Labry et al., 2012).
Dissolved inorganic nutrients nitrate (), nitrite (), ammonium (), phosphate () and silicate (Si(OH)4) were analyzed using standard methods outlined in Hansen and Koroleff (1999) on a Hitachi U2000 spectrophotometer.
Phytoplankton counts by microscopy were on concentrated 50 ml samples, fixed with alkaline Lugol's iodine (1% final concentration) on a ZEISS Axiovert 100. Details on species identification, enumeration and cellular organic carbon conversions can be found in Schulz et al. (2013). Separation of dinoflagellates into toxic and non-toxic groups followed Ignatiades and Gotsis-Skretas (2010). Flow cytometric counts were aquired on a BD (Beckton, Dickinson and Company) FACSCalibur, equipped with a 488 nm argon laser providing 15 mW. Phytoplankton groups were classified in fresh samples by red fluorescence, and forward and side scatter, and Synechococcus and cryptophytes by additional orange fluorescence (for details see Larsen et al., 2001). Finally, phytoplankton community composition (in terms of contributions to total Chla) was also assessed by pigment analysis using the CHEMTAX algorithm (Mackey et al., 1996). Details on pigment ratios, and the input and output matrices are provided as a supplement.
2.7. Carbonate Chemistry Measurements and Calculations
Dissolved inorganic carbon (DIC) was measured coulometrically according to Johnson et al. (1987) and calibrated against certified reference material, CRM batch 108, (Dickson, 2010). Precision was typically better than 2 μmolkg−1. If measurements could not be done on the same day, samples for DIC were poisoned with a saturated mercury chloride solution (0.5‰ final concentration) following Dickson et al. (2007).
For seawater pH determination, a similar spectrophotometric approach as described in Carter et al. (2013) was adopted (see Supplement S-3.1 for details). Prior to pH measurements seawater samples were gently pressure-filtered (see Supplement S-3.2 for details), in a similar fashion as described in Bockmon and Dickson (2014).
Seawater carbonate chemistry speciation at in-situ temperature and salinity was calculated from measured DIC and pH (see Supplement S-3.3 for details).
2.8. Statistics
Instead of treatment replication a wide range of fCO2 levels was chosen along a gradient from initially ~300 to ~3,000 μatm, corresponding to a pHT of ~8.14 and ~7.20, respectively (compare Table 2). A regression type approach is not as vulnerable to the potential loss of one or two mesocosms, a critical assest in larger scale experiments. And indeed, a hole discovered in mesocosm M2 during the first week could not be mended despite considerable efforts. Based on measured salinity changes mesocosm M2 exchanged several cubic meters of water with the fjord and was thus excluded from statistical analyses (although still shown in the figures). Regressions of fCO2 means from each mesocosm (excluding M2) during a certain phase against the means of each measurement parameter were analyzed with F-tests (see Table S-1 for details).
3. Results
For details on temporal changes and evolution of light, temperature and salinity within the mesocosms and the fjord during the 2011 CO2 perturbation study in Bergen, Norway, the reader is referred to Section S-4.1 and Figures S-2 and S-3.
3.1. Dividing the Experimental Period into Different Phases
In accordance to CO2 manipulation, and Chla and dissolved inorganic nutrient dynamics (mainly nitrate and phosphate), the experiment was sub-divided into several phases (compare Figure 3). Phase 0 encompasses the time prior to establishing any significant CO2 gradient between the mesocosms (day -2 to 2). During phase I (day 3–8) the first phytoplankton bloom peaked while dissolved inorganic nutrients were rapidly utilized. Phase II (day 9–14) was the first post-bloom phase with little change in autotrophic biomass at relatively low nitrate and phosphate availability. The second phytoplankton bloom then peaked during phase III (day 15–25), stimulated by the addition of nitrate and phosphate on day 14. The last experimental period, phase IV (day 26–34), was again characterized by little change in autotrophic biomass at relatively low, probably limiting, phosphate concentrations. Note that in terms of phase division, Bach et al. (2016) chose to combine phases 0, I, and II into a single one.
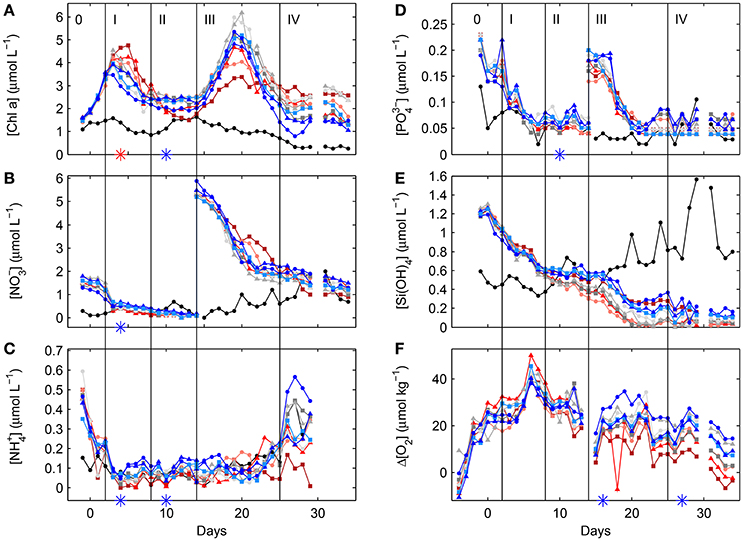
Figure 3. Temporal dynamics of depth-integrated (0–23 m) Chla (A), nitrate (B), ammonium (C), phosphate (D) and silicate concentrations (E) inside the fjord and the mesocosms. Daily depth-averaged dissolved oxygen concentrations from CTD casts were normalized to respective fjord levels (F). For symbols and color coding see Table 2. Vertical lines and Roman numbers illustrate the different phases during this experiment while 0 is the phase prior to any significant CO2 gradient. Red and blue stars denote statistically significant positive and negative correlations with fCO2 during a certain phase, respectively (compare Section 2.8 and Table S1 for details.) Style and color coding follow that of Figure 2.
3.2. Changes in Carbonate Chemistry Speciation and Oxygen
Initial depth-averaged (0.3–23 m) water column pHT levels on day -4 in the fjord and mesocosms ranged between 8.09 and 8.12, being about 0.05 units higher and lower at the surface (0.3–5 m) and depth (15–23 m), respectively (Figure S-4). Corresponding depth-averaged fCO2 levels started at about 330 μatm. Following the CO2 enriched seawater additions between days 0 and 4 (compare Table 2) a pHT and fCO2 gradient was established on day 5 with depth-averaged levels ranging from 7.12 and about 3045 μatm, respectively, in the highest CO2 treatment to 8.13–8.14 and 310–300 μatm, respectively, in the two control mesocosms. From then on, pH continuously increased while fCO2 levels decreased in all mesocosms, except the two controls where both remained relatively constant (Figures 2B,C). Changes were most pronounced in the surface layer, especially toward higher CO2 levels. Nevertheless, a pHT (and fCO2) gradient between mesocosms was maintained until the end of the experiment with depth-averaged levels ranging from 7.59 to up to 8.15 (Figure 2 and Figure S-4). In comparison, pHT in the fjord gradually declined from day 0 onwards by a total of about 0.06 units.
In comparison to the fjord oxygen concentrations in the mesocosms (Δ[O2]) increased by about 40 μmolkg−1 from day −4 to 6, the peak of the first bloom during phase I (compare Figure 3F). From then on it continuously declined until the end of phase II. The second bloom period during phase III was marked by another increase in Δ[O2] and followed by a another decline, however, this time both were lower toward higher CO2 levels with statistical significance (compare Table S-1).
Only during the first 2 weeks both oxygen and carbonate chemistry speciation such as fCO2 or pH were relatively homogeneously distributed with depth (see Figure S-4 for pH). From then on, continuous fresh water increasingly stratified the water column (Figure S-2) in all mesocosms, separating the surface from depth. Although phytoplankton and biomass density together with CO2 levels were certainly higher in the upper than in the lower layer, this should not influence our analyses and conclusions regarding potential CO2 effects on community composition as stratification was the same in all mesocosms.
3.3. Dissolved Inorganic Nutrient Dynamics Over Time
Closing of the mesocosms on day -4 enclosed significant amounts of dissolved inorganic nutrients such as nitrate (), ammonium (), phosphate () and silicate (Si(OH)4), measured at about 1.5, 0.45, 0.2, and 1.2 μmoll−1, respectively, on day -1 (Figure 3). Following the build-up of autotrophic biomass, dissolved inorganic nutrients constantly declined toward the end of phase II in all mesocosms. While a statistically significant higher and draw-down was observed toward higher CO2 levels during phase I, a statistically significant higher depletion of and toward higher CO2 levels occurred in the next phase II (Figure 3 and Table S-1).
Following the additions of about 5 μmoll−1 of and 0.16 μmoll−1 of on day 14, a second autotrophic bloom event during phase III rapidly utilized the remaining Si(OH)4, and most and nearly all of the added and , respectively. While there were no detectable CO2 related trends concerning the latter two nutrients, Si(OH)4 draw-down was statistically higher toward higher CO2 when the highest level was excluded (R2 = 0.7744, f = 21.59, p = 0.006). In the second post-bloom period during phase IV, [] decreased by about another 1 μmoll−1, [] were relatively stable at about 0.05 μmoll−1, and [] started to increase in all mesocosms (compare Figure 3).
In the fjord dissolved inorganic nutrient dynamics were comparatively small and while there was hardly any temporal change concerning [] and [], hovering around 0.1 and 0.05 μmoll−1, respectively, [] and [Si(OH)4] constantly increased during the second part of the experiment to up to about 1 and 0.8 μmoll−1, respectively (Figure 3).
3.4. Temporal Chlorophyll a, and Particulate and Dissolved Organic Matter Dynamics
The autotrophic bloom development, depicted by Chla, with its two distinct bloom peaks (phases I and III) and the post-bloom condition in phase II was closely resembled by particulate organic carbon, nitrogen and phosphorus concentration changes (compare Figure 3 and Figure S-5). To a certain extent overall particulate biogenic silica (BSi) dynamics were similar, differing however during the first post-bloom phase II, with BSi concentrations remaining rather constant toward higher CO2 and declining at lower levels.
During the first bloom peak in phase I Chla, POC, PON and POP concentrations were higher toward increasing CO2 levels. These correlations were statistically significant (Table S-1). For POP this was also the case during the following post-bloom phase II.
Dynamics of dissolved organic matter, however, were different for carbon, nitrogen and phosphorus. While DOC concentrations clearly increased throughout the experiment from about 95 by about 30 μmoll−1, DON concentrations slightly increased during phases I and II by an average of about 1 μmolkg−1, dropped after the nutrient addition on day 14 and continued increasing toward the end of the experiment by about another 2 μmolkg−1. In contrast, DOP concentrations slightly decreased throughout the first couple of days from about 0.12 by about 0.04 μmoll−1 and remained rather constant from then on until the middle of phase II from which on it slowly increased by about 0.15 μmoll−1 in all mesocosms until the end of phase III. Then in the last phase IV DOP concentrations seemed to decrease again (Figure S-5). Statistically significant correlations with CO2 (Table S-1) were found for DOC in phase IV (negative) and DOP in phases I (negative) and III (positive).
Finally, Chla, and particulate and dissolved inorganic matter dynamics in the mesocosm followed similar trends as in the fjord. While the first bloom peak in phase I was at about the same time in the fjord as in the mesocosms, the second occurred a couple of days earlier in the fjord due to natural nutrient up-welling. Furthermore, absolute concentration changes were typically smaller in the fjord compared to the mesocosms (compare Figure 3 and Figure S-5).
3.5. Temporal Changes in Phytoplankton Community Composition based on Marker Pigment Analysis, Flow Cytometry and Light Microscopy
Phytoplankton community composition was estimated by three different, but complementary approaches, i.e., CHEMTAX analysis of marker pigment ratios (differentiating mostly into taxonomic classes), flow cytometry (differentiating mostly by cell size (forward scatter), but also being able to identify cells with specific fluorescence (red and/or orange) or surface texture (side scatter) patterns such as unicellular cyanobacteria like Synechococcus sp. and coccolithophores like Emiliania huxleyi) and traditional light microscopy (typically identifying the larger phytoplankton groups down to the genus or species level).
Based on CHEMTAX analysis the most important contributors to total Chla were diatoms, followed by chlorophytes, cryptophytes and haptophytes. Of minor importance were cyanobacteria, dinoflagellates and chrysophytes (Figure 4). Statistically significant negative CO2 effects were detected for haptophytes in phases II, III, and IV, for diatoms in phase III, and for chrysophytes and cryptophytes in phase II. Positive effects were found for chlorophytes in phases I, II, III, and IV and for cyanobacteria in phases II, III, and IV (compare Table S-1). Comparison of phytoplankton peak heights and shapes identified by CHEMTAX analysis with those obtained by flow cytometry suggests that the cyanobacteria were most likely dominated by Synechococcus sp. (compare Figure 4G and Figure 5A), most chlorophytes were belonging to the size class of picoeukaryotes (compare Figure 4E and Figure 5B), the coccolithophore Emiliania huxleyi was probably not the dominant haptophyte at least not in phases I and II (compare Figure 4A and Figure 5C), small nanoeukaryote dynamics were similar to that of diatoms (compare Figure 4D and Figure 5D), and the group of big nanoeukaryotes seemed to encompass a variety of organisms including dinoflagellates, haptophytes and diatoms. Although some estimates on the relative biomass contribution of phytoplankton groups based on microscopic counts differ from those based on CHEMTAX analysis, general patterns were similar (Figure S-6). Moreover, the most important diatom was identified to be Arcocellulus sp., the dominant coccolithophore was Emiliania huxleyi and one of the chlorophytes, but probably not the most important one (compare Figure S-6E, Figure 5B and Figure 4E), was Chlamydomonas sp. Furthermore, the dominant chryptophyte was identified to be Plagioselmis prolonga. When sub-dividing dinoflagellates into those known as heterotrophic, toxic and non-toxic statistically significant CO2 effects were only found on non-toxic (negative) and heterotrophic (positive) species in phase II (compare Table S-1).
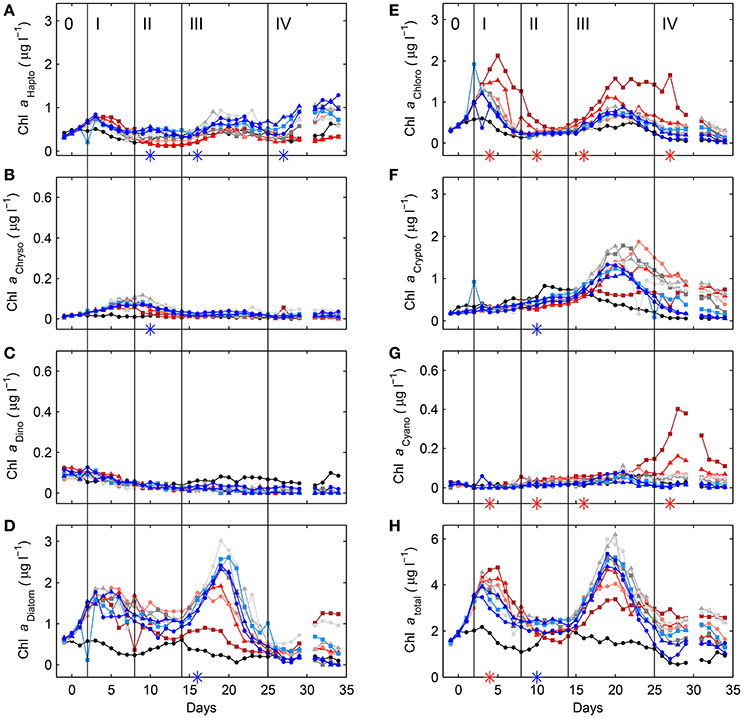
Figure 4. Temporal dynamics of depth-integrated (0–23 m) contributions to Chla by haptophytes (A), chrysophytes (B), dinoflagellates (C), diatoms (D), chlorophytes (E), cryptophytes (F), and cyanobacteria (G) inside the fjord and the mesocosms, as determined by CHEMTAX analysis on pigments measured by HPLC (see Section 2.6 for details). For comparison, total Chla concentrations from Figure 3A are also shown (H). Style and color coding follow that of Figure 2.
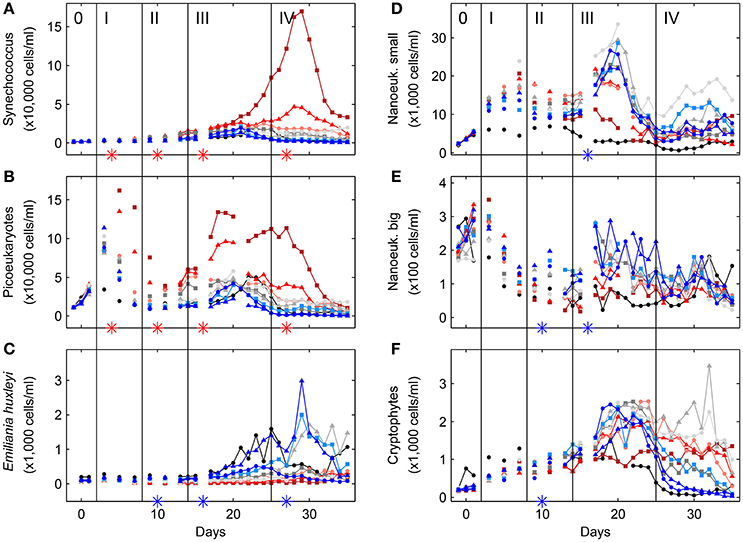
Figure 5. Temporal dynamics of depth-integrated (0–23 m) cell concentrations of Synechococcus (A), picoeukaryotes (B), the coccolithophore Emiliania huxleyi (C), small nanoeukaryotes (D), big nanoeukaryotes (E), and cryptophytes (F) inside the fjord and the mesocosms, as determined by flow cytometry (see Section 2.6 for details). Style and color coding follow that of Figure 2.
4. Discussion
4.1. Experimental Starting Conditions
Depth-averaged (0.3–23 m) dissolved oxygen concentrations as derived from daily CTD profiling was relatively stable in the fjord until about day 10, at 319.0 ± 3.8 μmol. This was slightly higher than calculated equilibrium concentrations of 300 μmolkg−1, for an initial temperature of about 7°C and a salinity of 32 (García and Gordon, 1992). Oxygen over-saturation corresponds well with under-saturated seawater fCO2. A level of 270 μatm would suggest that a minimum (concomitant temperature increase would reduce the measured difference) of 60 μmolkg−1 of dissolved inorganic carbon had been taken up by the plankton community during a previous bloom (calculated from initially measured TA and a fCO2 in equilibrium with the atmosphere of 400 μatm). Using a photosynthetic quotient (amount of oxygen evolved per carbon fixed) of 1.4, predicted for phytoplankton growth relying on nitrate as sole nitrogen source (Laws, 1991), one could have expected an oxygen over-saturation by 84 μmolkg−1. The reason for measuring only about a fourth of that is most likely the result of the about 10 times quicker air/sea gas equilibration for oxygen than for carbon dioxide. This in turn is explained by the fact that only about a tenth of the DIC consumed is reflected in an actual CO2 draw down. In summary, seawater oxygen and carbon dioxide levels were indicative for post spring-bloom conditions, as expected for this time of the year.
4.2. General Autotrophic Biomass and Nutrient Dynamics: Direct and Indirect CO2 Effects
Like in other CO2 perturbation experiments with a very similar experimental design (Schulz et al., 2013; Paul A. J. et al., 2015), there were numerous (59 out of 160) statistically significant correlations between mean treatment CO2 levels in a certain phase and corresponding dissolved inorganic nutrient, and organic matter concentrations and its derivatives (compare Table S-1). This is in contrast to some, but also supported by other, CO2 perturbation studies with natural plankton assemblages (for a comprehensive list see Table 1). Apart from the possibility of simply non-existing CO2 effects in some studies a potential alternative explanation could be differences in the individual experimental design which can make it more or less likely to observe CO2 effects. Critical factors include incubation time, sampling intervals, separation of CO2 manipulation from other changes such as in nutrient, light and temperature regime, and will be discussed in more detail in Section 4.3.
Changes in autotrophic biomass based on Chla and certain group specific equivalents corresponded well with changes in particulate and dissolved organic matter in all phases (although to a lesser extent in phase IV), with Δ(POC+DOC) to ΔChla ratios (μmol/μg) of about 5 in both bloom phases II and IV (Figure S-5, Figure 4). This is well within the range reported for marine phytoplankton (Montagnes et al., 1994). Furthermore, these changes were basically mirrored by dissolved inorganic and organic nutrient dynamics (Figure 3) close to classical Redfield proportions (Redfield et al., 1963). This highlights the prime importance of marine autotrophs in this experiment concerning biogeochemical element cycling (as opposed to a potential top-down control by heterotrophs). The numerous CO2 related differences in nutrient utilization, organic matter turnover and stoichiometry (for the latter see Boxhmmaer et al., submitted for additional details) are thus most likely connected to CO2 induced (both directly and indirectly) community composition changes.
Examples for potentially direct (physiological) effects are reduced haptophyte abundances with increasing CO2 and the opposite for chlorophytes and cyanobacteria (Figure 4) as (1) all three occur early on in the experiment as an immediate response to carbonate chemistry manipulation, and (2) are consistent throughout the entire experiment. An example for a potentially indirect effect are the lower diatom abundances toward higher CO2 during phase III as this appears a consequence of lower silicate availability at the beginning of this period (compare Figure 4D and Figure 3E). However, indirect effects on phytoplankton community composition can also be brought about by grazers or viruses, selectively impacting certain species, although there is no clear indication for either of them in our particular experiment.
4.3. Comparison of CO2 Effects on Phytoplankton Community Composition of this with Other Studies in Raunefjorden: Potential Effects of Experimental Design
In this study three phytoplankton groups, i.e., haptophytes, chlorophytes, and cyanobacteria were potentially directly impacted by increasing levels of carbon dioxide (or associated changes in carbonate chemistry speciation), as indicated by CO2 related changes in cell abundances early on and consistently throughout the experiment (compare Figures 4A,E and Figure 4G, respectively). While an important member of the pigment-based haptophyte fraction identified was the coccolithophore Emiliania huxleyi, the chlorophytes appeared to belong to the size class of picophytoplankton and the cyanobacteria to be dominated by Synechococcus (compare with Figures 5B,C and Figure 5A, respectively). In the first mesocosm CO2 experiment at this location in 2001 (Engel et al., 2005), only one of this three groups was specifically targeted, i.e., the coccolithophore Emiliania huxleyi (compare Table 1). However, no statistically significant CO2 effects on Emiliania huxleyi abundances were found back in 2001 (for a discussion on growth rates see Section 4.4.1), a phenomenon also encountered in two more successful experiments a few years later (Schulz et al., 2008; Calbet et al., 2014). This is in contrast to the findings of both this study, and another (Hopkins et al., 2010), reporting on negative CO2 effects on Emiliania huxleyi abundances. An obvious difference between those five studies at the same location is that the three which did not detect such CO2 effect on Emiliania huxleyi had inorganic nutrients added together with the CO2 manipulation at the start of the experiments. It has been argued that inorganic nutrient addition when applied in combination with the CO2 manipulation will dominate any phytoplankton community response, at least initially during the subsequent bloom phase (Riebesell et al., 2008), thus masking potentially more subtle CO2 effects (Schulz et al., 2013). Such overpowering nutrient response was also found in a recent experiment comparing phytoplankton responses to CO2 with and without initial nutrient addition in a summer community (Sala et al., 2015). During winter, however, there was no significant difference in terms of community response between CO2 treatments with and without inorganic nutrient addition. This is most likely connected to the fact that initial residual nutrient concentrations were already relatively high during winter, effectively being a nutrient addition treatment. Thus, both treatments in winter started with substantial amounts of inorganic nutrients, which might also be reflected in the fact that the community responses in both rather resembled those of the nutrient addition in the summer (in terms of overall phytoplankton community responses).
In essence, potential CO2 sensitivities of phytoplankton can be masked by the stimulating response to inorganic nutrients, which affect physiological rates in a more fundamental manner than ocean-acidification relevant ranges in carbonate chemistry speciation. For instance, a growth rate difference of nutrient limited and therefore relatively slowly growing phytoplankton of 0.15 per day (observed for Emiliania huxleyi in this study, but see also Section 4.4.1) between cells grown at high in comparison to low CO2 will not lead to easily detectable differences in abundance if growth rates are considerably stimulated by concomitant nutrient addition and the same CO2 offset in growth. This is connected to a more pronounced temporal separation of potential peak abundances at overall lower growth rates. Furthermore, a nutrient addition after the CO2 manipulation will tend to amplify CO2 related abundance differences because of differing seed stock population sizes (compare Riebesell et al., 2017).
On the other scale of the nutrient spectrum, such as in the oligotrophic Mediterranean (initial nitrate concentrations below 300 and phosphate below 50 nmoll−1) potential CO2 effects on phytoplankton community composition appear also small, at least in shorter-term incubations (e.g., Gazeau et al., 2017; Maugendre et al., 2017).
Finally, consideration has to be given to the analytical methods and techniques employed to assess phytoplankton community composition such as pigment analysis, flow cytometry or light microscopy. As each has individual advantages and disadvantages over the others with respect to certain phytoplankton groups, employing as many as possible in a single experiment makes detection of potential CO2 effects more likely. For instance, picophytoplankton will be difficult to quantify by microscopy as opposed to flow cytometry. For the latter, however, taxonomic identification can be challenging and clusters of certain scatter/fluorescence patterns can contain multiple species or taxonomic groups, a gap which in turn can partially be filled by correlative pigment analysis (compare Figures 4, 5 and Figure S-6).
4.4. General Patterns of CO2 Effects on Marine Phytoplankton: A Comparison among Studies of Global Distribution
All available studies with phytoplankton community composition responses to increasing levels of CO2 constitute a data-set of global coverage (Figure 6). Experimental setups and designs among these thirty one studies vary in several respects (compare Table 1) and have the potential to significantly influence detectability of CO2 effects (compare Section 4.3). Thus, we opted against aggregating all in a meta analysis. Nevertheless, an attempt is made in the following to identify general patterns or the lack thereof within individual phytoplankton groups.
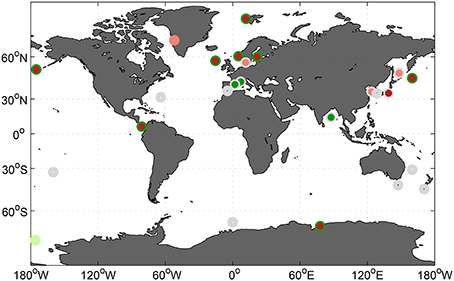
Figure 6. Geographical distribution of all phytoplankton community composition experiments listed in Table 1. Color coding refers to no observed (gray) and positive or negative CO2 effects (dark green and red, respectively), and tendencies (light green and red, respectively. For details see see Table 1.
4.4.1. Potential CO2 Effects on Prymnesiophytes (Haptophyta), with a Focus on Coccolithophores
There is only one community study so far which has reported positive CO2 effects on haptophyte abundances (Schulz et al., 2013 but also compare Table 1). Unfortunately, neither the exact genus, family, order or class was determined as marker pigments were used for identification with the CHEMTAX algorithm (Mackey et al., 1996). Neither flow cytometry nor light microscopy provided any further clues, except that the haptophyte(s) in question did not belong to the group of coccolithophores. In the other seven community studies (compare Table 1) reporting negative CO2 effects on haptophyte abundances, two were identified as Phaeocystis sp. (Tortell et al., 2008; Thoisen et al., 2015), three as coccolithophores (Hopkins et al., 2010 and this study as Emiliania huxleyi and Endo et al., 2013 as unidentified), one as Chrysochromulina sp. (Hama et al., 2012), and one was an un-identified haptophyte (Yoshimura et al., 2013). Among the haptophytes these three identified genera are all prymnesiophytes, indicating that this entire class might be negatively impacted by increasing seawater levels of carbon dioxide. Potential drivers of reduced cell abundances include reduced cellular growth rates, indeed reported affected in single-species and mesocosm CO2 experiments (for details see Riebesell et al., 2017)—although it should be noted that the responsible carbonate chemistry parameter is rather the concomitantly decreasing pH level than increasing CO2 (Bach et al., 2011; Kottmeier et al., 2016). Optimum CO2/pH levels for growth have been suggested to vary between species and strains (e.g., Langer et al., 2006, 2009; Krug et al., 2011; Bach et al., 2015), but also by other environmental factors such as temperature (Sett et al., 2014) and light (Rost et al., 2002; Rokitta and Rost, 2012; Zhang et al., 2015). For an Emiliania huxleyi strain isolated in Bergen in 1994 at the location of this study optimum CO2/pH has been found around current day levels at 15°C and a light intensity of 150 μmolm−2s−1 (Bach et al., 2011). This is also the case for the coccolithophores Gephyrocapsa oceanica at 15 and 20°C (Sett et al., 2014) and Coccolithus pelagicus at 15°C, although the latter with a wider optimum (Bach et al., 2015). There is also evidence for a CO2 optimum for growth close to present day levels or even lower toward saturating light conditions in Phaeocystis sp. at 15°C (Chen and Gao, 2011; Hoogstraten et al., 2012) and at 20°C (Wang et al., 2010), although in an Antarctic population grown at 3°C this trend was less clear (Trimborn et al., 2013). This difference could be related to overall lower temperatures or the actual species as the former experiments were with Phaeocystis globosa while the latter utilized Phaeocystis antarctica. In summary, there appears to be a general tendency toward lower CO2 optima for growth in prymnesiophytes, in contrast to other phytoplankton taxa such as picoeukaryotes (see Section 4.4.2 for details) or some diatoms (see Section 4.4.3 for details).
However, indirect CO2 effects as drivers of reduced cell abundances of prymnesiophytes such as increased grazing pressure can not be ruled out. In the case of coccolithophores this could be related to typically decreased calcification rates toward higher CO2 levels (for an overview see e.g., Bach et al., 2015), although calcification as an effective defensive mechanisms against zooplankton grazing is controversially discussed (e.g., compare Paasche, 2002; Monteiro et al., 2016).
4.4.2. Potential CO2 Effects on Picoeukaryotes (Chlorophyceae)
Out of the eleven phytoplankton community studies which investigated the effects of increasing CO2 levels on picoeukaryote abundances two did not detect any significant effects (Feng et al., 2009; Neale et al., 2014), one found a tendency for higher abundances at the highest of three CO2 levels (Biswas et al., 2015), and the remaining eight reported on positive effects, especially on the smaller size fraction of the picoeukaryotes (compare Table 1). When taxonomic identification of the picoeukaryotes was attempted, it was the class of prasinophytes, or the division of chlorophytes in general, which profited from higher CO2 levels. Like for prymnesiophytes, direct effects of changed carbonate chemistry speciation on growth rates, although with an opposite sign, are conceivable. The only single species CO2 experiment with chlorophytes or prasinophytes in the picophytoplankton size class, that we are aware of, indeed found higher growth rates in sixteen ecotypes of Ostreococcus tauri at about 1,000 in comparison to 400 μatm (Schaum et al., 2013). Furthermore, in this and other studies (e.g., Schulz et al., 2013; Crawfurd et al., 2016, but also Davidson et al., 2016) positive CO2 effects on small picoeukaryotes were detected early on and almost throughout the entire experiment, indicating a direct stimulating effect on cellular growth rates. Having observed this CO2 stimulation in a previous experiment, Schulz et al. (2013) speculated that picoeukaryotes might refrain from operating the costly active uptake of CO2 and like most phytoplankton species investigated thus far (and therefore directly profit from increasing seawater CO2 levels), because of the relatively small diffusive boundary layer around the cells. In this respect it is interesting to note that whenever the picoeukaryote community was further divided into different size classes, it was the smallest which consistently profited from increasing CO2 concentrations (Hopkins et al., 2010; Brussaard et al., 2013). Finally, as mentioned above, the stimulation might not only be due to size but also connected to a certain taxonomic group (sharing a common evolutionary history), namely the class of prasinophytes or division of chlorophytes in general.
4.4.3. Potential CO2 Effects on Marine Diatoms
While in this study there were no detectable CO2 related effects on overall diatom biomass development during phases I and II, it was negatively affected during the second bloom in phase III (compare Figure 4 and Figure S-6). It is noted, however, that this is most likely an indirect consequence of lower silicate availability toward higher CO2 during this period which had developed in phase II (Figure 3E).
Although there is some evidence for negative (Hare et al., 2007; Hopkins et al., 2010; Yoshimura et al., 2010; Schulz et al., 2013) or positive (Tortell et al., 2002; Feng et al., 2009) effects on diatom biomass with increasing CO2 levels most studies did not find strong evidence for either (compare Table 1). This more variable response in comparison to prymnesiophytes or small picoeukaryotes belonging to the group of prasinophytes, or chlorophytes in general, could be related to their relatively high diversity, estimated at more than 4,500 marine, morphologically distinct, planktonic species (Malviya et al., 2016). Thus they appear to be a more heterogeneous group of organisms, potentially able to occupy a wider range of ecological niches. Furthermore, also concerning size they are much more diverse than the two other groups, spanning two orders of magnitude (Tomas, 1997). For instance, it has been reported that larger diatoms did profit at the expense of smaller ones (Tortell et al., 2008; Feng et al., 2009), however, also the opposite has been found (Davidson et al., 2016). A potential issue is clearly that actual sizes in categories of “large” and “small” can be variable when comparing different species within and then between experiments. That can even be the case for the same species as diatom populations grow considerably smaller in size with progression of the annual cycle (e.g., D'Alelio et al., 2010). In essence, potential CO2 effects are more likely on the species level rather than on the entire diatom community and therefore more difficult to detect, especially with flow cytometry and pigment analysis.
4.4.4. Potential CO2 Effects on Cyanobacteria (Synechococcus)
In this study Synechococcus sp. appeared to directly profit from increasing CO2 levels, indicated by increased abundances (determined by flow cytometry and corroborated by pigment analysis), early on and throughout the entire experiment (compare Figure 5A and Figure 4G). This is in contrast to two other experiments at the same location (Schulz et al., 2008; Hopkins et al., 2010), although it has to be noted that the effects found in Schulz et al. (2008) were post-bloom only and that inorganic nutrients had been added together with the CO2 addition at the beginning of the experiment (compare 4.3). Combining the findings of all available studies, about one third did detect negative, one third positive and one third no CO2 related effects (compare Table 1). Thus, there are either so far overlooked factors (including potentially indirect rather than direct effects) within the individual experimental designs that can lead to positive, negative or no observable CO2 effects, or the genus Synechococcus (mostly a flow cytometric cluster of a particular forward scatter and orange fluorescence) contains a physiologically more diverse group of autotrophic bacteria than the label Synechococcus might suggest. Indeed, the genus Synechococcus has been described to comprise more than a dozen clades at a single geographic location and numerous ecotypes with specific environmental preferences (Ahlgren and Rocap, 2006; Hunter-Cevera et al., 2016). Furthermore, the presence of either a more opportunistic than specialized life-cycle, broadly associated to either more coastal or oceanic conditions (Dufresne et al., 2008) could add to the differing CO2 responses observed. In single species laboratory experiments, growth rates of an open ocean Sargasso Sea isolate (CCMP1334, a.k.a WH7803 or DC2) significantly increased when CO2 was raised from about 380 to 750 μatm (Fu et al., 2007). Surprisingly, a second experiment on the same isolate found exactly the opposite response (Traving et al., 2014). It has to be noted, however, that dissolved inorganic nutrient and DIC concentrations in the latter where rather unusual, with 8.8 mmoll−1 of nitrate, 0.2 mmoll−1 of phosphate at only 0.2 mmolkg−1 of DIC, potentially manifested in relatively low overall growth rates and thus a differing response. Hence, the usual call for more experiments seems justified in the case of Synechococcus, preferentially with multiple isolates of different clades and known ecotypes.
4.5. Implications for Future Biogeochemical Element Cycling
When combing the results of this mesocosm study with previous experiments on phytoplankton community composition at increasing levels of CO2, two groups stand out with relatively consistent response patterns. Among the prymnesiophytes, coccolithophore abundances (mostly Emiliania huxleyi) were negatively correlated with increasing CO2, while small picoeukaryotes belonging to the group of prasinophytes, or chlorophytes in general, were positively affected in this respect (compare Table 1).
Concerning biogeochemical element cycling and export of organic matter from the sunlit surface to depth, both groups are thought to serve distinct and opposing functions within the pelagic system. The calcium carbonate (CaCO3) produced by coccolithophores has been hypothesized to effectively ballast otherwise almost neutrally buoyant organic matter and facilitate export production. This is based on positive correlations of CaCO3 with organic carbon in deep sea sediment traps (Francois et al., 2002; Klaas and Archer, 2002). In contrast, being an important component of the microbial loop in the euphotic zone, small picoeukaryotes are typically thought to rather retain organic carbon in the surface ocean. This is evidenced by export efficiencies in the lower range (more of the net primary production is remineralized in the euphotic zone) at various open ocean locations with a considerable picophytoplankton contribution (for a review see De La Rocha and Passow, 2014). At a single location, however, during a seasonal cycle smaller assemblages, although not necessarily comprising picophytoplankton, can be associated with higher export efficiency than larger assemblages (Mouw et al., 2016).
In this study, the total amount of organic carbon accumulating in the sediment traps at 25 m depth decreased by about 25% toward higher CO2 and higher overall picophytoplankton (and lower Emiliania huxleyi) abundances (compare Figure 4 and see Riebesell et al., 2017 for details). Together with similar POC and less DOC in the water column and lower net oxygen production levels at the end of the experiment toward higher CO2 (Figures S-5A,B and Figure 3F, respectively), this points toward more organic carbon turnover in the upper water column under these conditions (e.g., less Emiliania huxleyi and more picophytoplankton). In general, a reduction in marine export production and an increase in remineralization of organic matter within the upper winter mixed layer would constitute a positive feedback mechanism to atmsopheric CO2 levels by reducing the ocean's uptake capacity.
It is noted that in the community experiments compiled here, CO2 was the only driver of ocean change considered, while increasing levels of atmospheric CO2 are projected to furthermore result in increased surface ocean temperatures, reduced mixing and therefore changes in dissolved inorganic nutrient and light availability. These in turn have the potential to significantly influence marine productivity on a global scale (e.g., Bopp et al., 2001; Boyd and Doney, 2002). Thus, the direct CO2 effects reported here are likely to be modulated by light and nutrient availability but also temperature changes. However, whether they will amplify or mitigate the observed CO2 effects is impossible to forecast, although it is unlikely that the trends in certain groups will simply reverse as nutrients, light and temperature have stimulating effects on the entire phytoplankton community. Currently, there are reports suggesting decreasing coccolithophore abundances/calcification in the Southern Ocean (Freeman and Lovenduski, 2015), poleward expansion (Winter et al., 2014) or a subtropical North Atlantic increase (Krumhardt et al., 2016) over the past decades. Given the more than an order of magnitude larger increase in atmospheric CO2 levels projected until the end of the the century in comparison to that during the past decades, these reports and our findings and conclusions are not a contradiction.
Other potentially climate-relevant processes impacted by coccolithophore abundances are the production of trace gases such as DMS (dimethylsulfide), being lower at lower Emiliania huxleyi abundances in this (Webb et al., 2016) and other CO2 perturbation experiments (Hopkins et al., 2010; Avgoustidi et al., 2012).
In summary, the consistent negative and positive effects of increasing levels of atmospheric CO2 on coccolithophore and picoeukaryote abundances throughout numerous experiments have the potential to significantly impact biogeochemical element cycling, and marine export production in particular, in the future ocean.
Author Contributions
KS, LB, RB, JB, TB, JC, ALudwig, AP, MS, and UR carried out the Raunefjorden mesocosm experiment in 2011. RGJB measured dissolved inorganic carbon and total alkalinity, RB did microscopic phytoplankton counts, AE dissolved organic carbon analyses, ALudwig chlorophyll a measurements, MM CHEMTAX analysis, ALarsen flow cytometric phytoplankton counts, AP dissolved organic phosphorous and nitrogen, and MS biogenic silica measurements. KS did the CTD casts and data analyses, measured pHT, calculated carbonate chemistry, prepared the figures and wrote the manuscript. All authors contributed to data analyses and discussion, and critically commented on the manuscript draft.
Conflict of Interest Statement
The authors declare that the research was conducted in the absence of any commercial or financial relationships that could be construed as a potential conflict of interest.
Acknowledgments
We thank all participants of the Bergen Mesocosm Experiment 2011, in particular the KOSMOS team and the staff at the Marine Biological Station, University of Bergen for providing mesocosm logistics, technical assistance and support during sampling. We also acknowledge S. Febiri for phytoplankton pigment measurements. This mesocosm study received financial support in the framework of the coordinated projects SOPRAN (Surface Ocean Processes in the ANthropocene) and BIOACID (Biological Impacts of Ocean ACIDification) funded by the German Ministry for Education and Research (BMBF). ALarsen received salary from the MINOS project funded by EU-ERC (project no. 250254) and the core project BIOFEEDBACK of the Centre for Climate Dynamics (SKD) within the Bjerknes Centre for Climate Research. RGJB received support from the EU Framework 7 EuroBASIN (EUROpean Basin-scale Analysis, Synthesis and Integration) project no. 264933. KS is the recipient of an Australian Research Council Future Fellowship (FT120100384). We thank the captains and crews of R/V Håkon Mosby (2011609), R/V Alkor (AL376), and R/V Heincke (HE360) for support during transport, deployment and recovery of the mesocosm facility.
Supplementary Material
The Supplementary Material for this article can be found online at: http://journal.frontiersin.org/article/10.3389/fmars.2017.00064/full#supplementary-material
References
Ahlgren, N. A., and Rocap, G. (2006). Culture isolation and culture-independent clone libraries reveal new marine Synechococcus ecotypes with distinctive light and N physiologies. Appl. Environ. Microbiol. 72, 7193–7204. doi: 10.1128/aem.00358-06
Avgoustidi, V., Nightingale, P. D., Joint, I., Steinke, M., Turner, S. M., Hopkins, F. E., et al. (2012). Decreased marine dimethyl sulfide production under elevated Co2 levels in mesocosm and in vitro studies. Environ. Chem. 9, 399–404. doi: 10.1071/EN11125
Bach, L. T., Boxhammer, T., Larsen, A., Hildebrandt, N., Schulz, K. G., and Riebesell, U. (2016). Influence of plankton community structure on the sinking veloccity of marine aggregates. Glob. Biogeochem. Cycles. 30, 1145–1165. doi: 10.1002/2016GB005372
Bach, L. T., Riebesell, U., Gutowska, M. A., Federwisch, L., and Schulz, K. G. (2015). A unifying concept of coccolithophore sensitivity to changing carbonate chemistry embedded in an ecological framework. Prog. Oceanogr. 135, 125–138. doi: 10.1016/j.pocean.2015.04.012
Bach, L. T., Riebesell, U., and Schulz, K. G. (2011). Distinguishing between the effects of ocean acidification and ocean carbonation in the coccolithophore Emiliania huxleyi. Limnol. Oceanogr. 56, 2040–2050. doi: 10.4319/lo.2011.56.6.2040
Barlow, R. G., Cummings, D. G., and Gibb, S. W. (1997). Improved resolution of mono- and divinyl chlorophylls a and b and zeaxanthin and lutein in phytoplankton extracts using reverse phase c-8 hplc. Mar. Ecol. Prog. Ser. 161, 303–307. doi: 10.3354/meps161303
Biswas, H., Gadi, S. D., Ramana, V., Bharathi, M. D., Manjari, D. T., and Kumar, M. D. (2012). Enhanced abundance of tintinnids under elevated CO2 level from coastal Bay of Bengal. Biodicers. Conserv. 21, 1309–1326. doi: 10.1007/s10531-011-0209-7
Biswas, H., Jie, J., Li, Y., Zhang, G., Zhu, Z.-Y., Wu, Y., et al. (2015). Response of a natural phytoplankton community from the Quingdao coast (Yellow Sea, China) to variable CO2 levels over a short-term incubation experiment. Curr. Sci. 108, 1901–1909.
Bockmon, E., and Dickson, A. (2014). A seawater filtration method suitable for total dissolved inorganic carbon and ph analyses. Limnol. Oceanogr. Methods 12, 191–195. doi: 10.4319/lom.2014.12.191
Bopp, L., Monfray, P., Aumont, O., Dufresne, J.-L., Le Treut, H., Madec, G., et al. (2001). Potential impact of climate change on marine export production. Glob. Biogeochem. Cycles 15, 81–99. doi: 10.1029/1999GB001256
Boyd, P. W., and Doney, S. C. (2002). Modelling regional responses by marine pelagic ecosystems to global climate changed. Geophys. Res. Let. 29, 53-1–53-4. doi: 10.1029/2001GL014130
Boyd, P. W., Strzepek, R., Fu, F., and Hutchins, D. A. (2010). Environmental control of open-ocean phytoplankton groups: now and in the future. Limnol. Oceanogr. 55, 1353–1376. doi: 10.4319/lo.2010.55.3.1353
Brussaard, C. P. D., Noordeloss, A. A. M., Witte, H., Collenteur, M. C. J., Schulz, K. G., Ludwig, A., et al. (2013). Arctic microbial community dynamics influenced by elevated CO2 levels. Biogeoscience 10, 719–731. doi: 10.5194/bg-10-719-2013
Buessler, K. O., and Boyd, P. W. (2009). Shedding light on processes that control particle export and flux attenuation in the twilight zone of the open ocean. Limnol. Oceanogr. 54, 1210–1232. doi: 10.4319/lo.2009.54.4.1210
Calbet, A., Sazhin, A. F., Nejstgaard, J. C., Berger, S. A., Tait, Z. S., Olmos, L., et al. (2014). Future climate scenarios for a coastal productive planktonic food web resulting in microplankton phenology changes and decreased trophic transfer efficiency. PLoS ONE 9:e94388. doi: 10.1371/journal.pone.0094388
Carter, B., Radich, J., Doyle, H., and Dickson, A. (2013). An automated system for spectrophotometric seawater ph measurements. Limnol. Oceanogr. Methods 11, 16–27. doi: 10.4319/lom.2013.11.16
Cauwet, G. (1999). “Determination of dissolved organic carbon and nitrogen by high temperature combustion,” in Methods of Seawater Analysis, eds K. K. K. Grasshoff and M. Ehrhardt (Hoboken, NJ: John Wiley), 407–420.
Chen, S., and Gao, K. (2011). Solar ultraviolet radiation and CO2-induced ocean acidification interacts to influence the photosynthetic performance of the red tide alga Phaeocystis globosa (Prymnesiophyceae). Hydrobiology 675, 105–117. doi: 10.1007/s10750-011-0807-0
Ciais, P., Sabine, C., Bala, G., Bopp, L., Brovkin, V., Canadell, J., et al. (2013). “Carbon and other biogeochemical cycles,” in Climate Change 2013: The Physical Science Basis. Contribution of Working Group I to the Fifth Assessment Report of the Intergovernmental Panel on Climate Change, eds T. F. Stocker, D. Qin, G.-K. Plattner, M. Tignor, S. K. Allen, J. Boschung, A. Nauels, Y. Xia, V. Bex, and P. M. Midgley (Cambridge; New York: Cambridge University Press), 465–570.
Crawfurd, K. J., Riebesell, U., and Brussaard, C. P. D. (2016). Shifts in the microbial community in the Baltic Sea with increasing CO2. Biogeosci. Discuss. doi: 10.5194/bg-2015-606
Cyronak, T., Schulz, K. G., and Jokiel, P. L. (2016a). Response to Waldbusser et al. (2016): ‘Calcium carbonate saturation state: on myths and this or that stories’. ICES J. Mar. Sci. 73, 569–571. doi: 10.1093/icesjms/fsv224
Cyronak, T., Schulz, K. G., and Jokiel, P. L. (2016b). The Omega myth: what really drives lower calcification rates in an acidifying ocean. ICES J. Mar. Sci. 73, 558–562. doi: 10.1093/icesjms/fsv075
Czerny, J., Schulz, K. G., Krug, S. A., Ludwig, A., and Riebesell, U. (2013). The determination of enclosed water volume in large flexible- wall mesocosms 'KOSMOS'. Biogeoscience 10, 1937–1941. doi: 10.5194/bg-10-1937-2013
D'Alelio, D., D'Alcalc, M., Dubroca, L., Sarno, D., Zingone, A., and Montresor, M. (2010). The time for sex: a biennial life cycle in a marine planktonic diatom. Limnol. Oceanogr. 55, 106–114. doi: 10.4319/lo.2010.55.1.0106
Davidson, A., McKinlay, J., Westwood, K., Thomson, P., Van Den Enden, R., De Salas, M., et al. (2016). Enhanced CO2 concentrations change the structure of Antarctic marine microbial communities. Mar. Ecol. Progr. Ser. 552, 93–113. doi: 10.3354/meps11742
de Kluijver, A., Schulz, K. G., Riebesell, U., Bellerby, R. G. J., and Middelburg, J. J. (2010). Phytoplankton-bacteria coupling under elevated CO2 levels: a stable isotope labelling study. Biogeoscience 7, 3783–3797. doi: 10.5194/bg-7-3783-2010
De La Rocha, C., and Passow, U. (2014). The biological pump. Treatise Geochemi. Second Ed. 8, 93–122. doi: 10.1016/B978-0-08-095975-7.00604-5
Dickson, A. G. (2010). Standards for ocean measurements. Oceanography 23, 34–47. doi: 10.5670/oceanog.2010.22
Dickson, A. G., Sabine, C. L., and Christian, J. R. (eds.). (2007). Guide to best practices for ocean CO2 measurements. PICES Special Publication 3.
Dufresne, A., Ostrowski, M., Scanlan, D. J., Garczarek, L., Mazard, S., Palenik, B. P., et al. (2008). Unraveling the genomic mosaic of a ubiquitous genus of marine cyanobacteria. Gen. Biol. 9:R90. doi: 10.1186/gb-2008-9-5-r90
Egge, J., and Heimdal, B. R. (1994). Blooms of phytoplankton including Emiliania huxleyi (Haptophyta). Effects of nutrient supply in different N:P ratios. Sarsia 79, 333–348. doi: 10.1080/00364827.1994.10413565
Endo, H., Yoshimura, T., Kataoka, T., and Suzuki, K. (2013). Effects of CO2 and iron availability on phytoplankton and eubacterial community compositions in the northwest subarctic Pacific. J. Exp. Mar. Biol. Ecol. 439, 160–175. doi: 10.1016/j.jembe.2012.11.003
Engel, A., Piontek, J., Grossart, H.-P., Riebesell, U., Schulz, K. G., and Sperling, M. (2014). Impact of CO2 enrichment on organic matter dynamics during nutrient induced coastal phytoplankton blooms. J. Plankton Res. 36, 641–657. doi: 10.1093/plankt/fbt125
Engel, A., Zondervan, I., Aerts, K., Beaufort, L., Benthien, A., Chou, L., et al. (2005). Testing the direct effect of CO2 concentration on a bloom of the coccolithophorid Emiliania huxleyi in mesocosm experiments. Limnol. Oceanogr. 50, 493–507. doi: 10.4319/lo.2005.50.2.0493
Feng, Y., Hare, C. E., Leblanc, K., Rose, J. M., Zhang, Y., DiTullio, G. R., et al. (2009). Effects of increased pCO2 and temperature on the North Atlantic spring bloom. I. The phytoplankton community and biogeochemical response. Mar. Ecol. Progr. Ser. 388, 13–25. doi: 10.3354/meps08133
Francois, R., Honjo, S., Krishfield, R., and Manganini, S. (2002). Factors controlling the flux of organic carbon to the bathypelagic zone of the ocean. Glob. Biogeochem. Cycles 16, 34-1–34-20. doi: 10.1029/2001gb001722
Freeman, N. M., and Lovenduski, N. S. (2015). Decreased calcification in the Southern Ocean over the satellite record. Geophys. Res. Lett. 42, 1834–1840. doi: 10.1002/2014GL062769
Fu, F.-X., Warner, M. E., Zhang, Y., Feng, Y., and Hutchins, D. A. (2007). Effects of increased temperature and CO2 on photosynthesis, growth, and elemental ratios in marine synechococcus and prochlorococcus (cyanobacteria). Phycol. Soc. Am. 43, 485–496. doi: 10.1111/j.1529-8817.2007.00355.x
Gao, K. W. H. W., Häder, D.-P., and Hutchins, D. A. (2012). Responses of marine primary producers to interactions between ocean acidification, solar radiation, and warming. Mar. Ecol. Progr. Ser. 470, 167–189. doi: 10.3354/meps10043
García, H. E., and Gordon, L. I. (1992). Oxygen solubility in seawater: Better fitting equations. Limnol. Oceanogr. 37, 1307–1312.
Gattuso, J.-P., Lee, K., Rost, B., and Schulz, K. G. (2010). “Approaches and tools to manipulate the carbonate chemistry,” in Guide to Best Practices in Ocean Acidification Research and Data Reporting, eds U. Riebesell, V. J. Fabry, and J.-P. Gattuso. Available online at: http://www.epoca-project.eu/index.php/Home/Guide-to-OA-Research/
Gazeau, F., Sallon, A., Pitta, P., Tsiola, A., Maugendre, L., Giani, M., et al. (2017). Limited impact of ocean acidification on phytoplankton community structure and carbon export in an oligotrophic environment: results from two short-term mesocosm studies in the Mediterranean Sea. Estuar. Coast. Shelf Sci. 186, 72–88. doi: 10.1016/j.ecss.2016.11.016
Giordano, M., Beardall, J., and Raven, J. A. (2005). CO2 concentrating mechanisms in algae: mechanisms, environmental modulation, and evolution. Annu. Rev. Plant. Biol. 56, 99–131. doi: 10.1146/annurev.arplant.56.032604.144052
Hama, T., Kawashima, S., Shimotori, K., Satoh, Y., Omori, Y., Wada, S., et al. (2012). Effect of ocean acidification on coastal phytoplankton composition and accompanying organic nitrogen production. J. Oceanogr. 68, 183–194. doi: 10.1007/s10872-011-0084-6
Hansen, H. P., and Koroleff, F. (1999). “Determination of nutrients,” in Methods of Seawater Analysis, eds K. K. K. Grasshoff and M. Ehrhardt (Hoboken, NJ: John Wiley), 159–229.
Hare, C. E., Leblanc, K., DiTullio, G. R., Kudela, R. M., Zhang, Y., Lee, P. A., et al. (2007). Consequences of increased temperature and CO2 for phytoplankton community structure in the Bering Sea. Mar. Ecol. Progr. Ser. 352, 9–16. doi: 10.3354/meps07182
Hoogstraten, A., Peters, M., Timmermans, K. R., and de Baar, H. J. W. (2012). Combined effects of inorganic carbon and light on Phaeocystis globosa Scherffel (Prymnesiophyceae). Biogeoscience 9, 1885–1896. doi: 10.5194/bg-9-1885-2012
Hopkins, F. E., Turner, S. M., Nightingale, P. D., Steinke, M., Bakker, D., and Liss, P. (2010). Ocean acidification and marine trace gas emissions. Proc. Natl. Acad. Sci. U.S.A. 107, 760–765. doi: 10.1073/pnas.0907163107
Hoppe, C. J., Hassler, C. S., Payne, C. D., Tortell, P. D., Rost, B., and Trimborn, S. (2013). Iron limitation modulates ocean acidification effects on Southern Ocean phytoplankton communities. PLoS ONE 8:e79890. doi: 10.1371/journal.pone.0079890
Hunter-Cevera, K. R., Post, A. F., Peacock, E. E., and Sosik, H. M. (2016). Diversity of Synechococcus at the martha's vineyard coastal observatory: insights from culture isolations, clone libraries, and flow cytometry. Microb. Ecol. 71, 276–289. doi: 10.1007/s00248-015-0644-1
Ignatiades, L., and Gotsis-Skretas, O. (2010). A review on toxic and harmful algae in Greek coastal waters (E. Mediterranean Sea). Toxins (Basel) 2, 1019–1037. doi: 10.3390/toxins2051019
Johnson, K. M., Sieburth, J. M., Williams, P. J. I., and Brändström, L. (1987). Coulometric total carbon dioxide analysis for marine studies: automation and calibration. Mar. Chem. 21, 117–133. doi: 10.1016/0304-4203(87)90033-8
Kim, J.-M., Lee, K., Shin, K., Kang, J.-H., Lee, H.-W., Kim, M., et al. (2006). The effect of seawater CO2 concentration on growth of a natural phytoplankton assemblage in a controlled mesocosm experiment. Limol. Oceanogr. 5, 1629–1636. doi: 10.4319/lo.2006.51.4.1629
Klaas, C., and Archer, D. E. (2002). Association of sinking organic matter with various types of mineral ballast in the deep sea: implications for the rain ratio. Glob. Biogeochem. Cycles 16, 63-1–63-14. doi: 10.1029/2001GB001765
Kottmeier, D. M., Rokitta, S. D., and Rost, B. (2016). H+-driven increase in CO2 uptake and decrease in uptake explain coccolithophores' acclimation responses to ocean acidification. Limnol. Oceanogr. 61, 2045–2057. doi: 10.1002/lno.10352
Kroeker, K. J., Kordas, R. L., Crim, R. N., and Singh, G. G. (2010). Meta-analysis reveals negative yet variable effects of ocean acidification on marine organisms. Ecol. Lett. 13, 1419–1343. doi: 10.1111/j.1461-0248.2010.01518.x
Krug, S. A., Schulz, K. G., and Riebesell, U. (2011). Effects of changes in carbonate chemistry speciation on Coccolithus braarudii: a discussion of coccolithophorid sensitivities. Biogeoscience 8, 771–777. doi: 10.5194/bg-8-771-2011
Krumhardt, K. M., Lovenduski, N. S., Freeman, N. M., and Bates, N. R. (2016). Apparent increase in coccolithophore abundance in the subtropical North Atlantic from 1990 to 2014. Biogeoscience 13, 1163–1177. doi: 10.5194/bg-13-1163-2016
Labry, C., Youenou, A., Delmas, D., and Michelon, P. (2012). Addressing the measurement of particulate organic and inorganic phosphorus in estuarine and coastal waters. Cont. Shelf Res. 60, 28–37. doi: 10.1016/j.csr.2013.04.019
Langer, G., Geisen, M., Baumann, K.-H., Kläs, J., Riebesll, U., Thoms, S., et al. (2006). Species-specific responses of calcifying algae to changing seawater carbonate chemistry. Geochem. Geophys. Geosyst. 7, Q09006. doi: 10.1029/2005gc001227
Langer, G., Nehrke, G., Probert, I., Ly, J., and Ziveri, P. (2009). Strain-specific responses of Emiliania huxleyi to changing seawater carbonate chemistry. Biogeoscience 6, 2637–2646. doi: 10.5194/bg-6-2637-2009
Larsen, A., Castberg, T., Sandaa, R.-A., Brussaard, C. P. D., Egge, J., Heldal, M., et al. (2001). Population dynamics and diversity of phytoplankton, bacteria and virus in a seawater enclosure. Mar. Ecol. Progr. Ser. 221, 47–57. doi: 10.3354/meps221047
Laufkötter, C., Vogt, M., Gruber, N., Aumont, O., Doney, S. C., Dunne, J. P., et al. (2016). Projected decreases in future marine export production: the role of the carbon flux through the upper ocean ecosystem. Biogeoscience 13, 4023–4047. doi: 10.5194/bg-13-4023-2016
Law, C. S., Breitbarth, E., Hoffmann, L. J., McGraw, C. M., Langlois, R. J., LaRoche, J., et al. (2012). No stimulation of nitrogen fixation by non-filamentous diazotrophs under elevated CO2 in the South Pacific. Glob. Change Biol. 18, 3004–3014. doi: 10.1111/j.1365-2486.2012.02777.x
Laws, E. A. (1991). Photosynthetic quotients, new producion and net community production in the open ocean. Deep Sea Res. 38, 143–167. doi: 10.1016/0198-0149(91)90059-O
Lomas, M. W., Hopkinson, B. M., Losh, J. L., Ryan, D. E., Shi, D. L., Xu, Y., et al. (2012). Effect of ocean acidification on cyanobacteria in the subtropical North Atlantic. Aquat. Microb. Ecol. 66, 211–222. doi: 10.3354/ame01576
Mackey, M. D., Mackey, D. J., Higgins, H. W., and Wright, S. W. (1996). Chemtax - a program for estimating class abundances from chemical markers: application to hplc measurements of phytoplankton. Mar. Ecol. Prog. Ser. 144, 265–283. doi: 10.3354/meps144265
Malviya, S., Scalco, E., Audic, S., Vincent, F., Veluchamy, A., Poulain, J., et al. (2016). Insights into global diatom distribution and diversity in the world's ocean. Proc. Natl. Acad. Sci. U.S.A. 113, E1516–E1525. doi: 10.1073/pnas.1509523113
Maugendre, L., Gattuso, J.-P., Louis, J., de Kluijver, A., Marro, S., Soetaert, S., et al. (2015). Effect of ocean warming and acidification on a plankton community in the NW Mediterranean Sea. ICES J. Mar. Sci. 72, 1744–1755. doi: 10.1093/icesjms/fsu161
Maugendre, L., Guieu, C., Gattuso, J.-P., and Gazeau, F. (2017). Ocean acidification in the Mediterranean Sea: pelagic mesocosm experiments. A synthesis. Estuar. Coast. Shelf Sci. 186, 1–10. doi: 10.1016/j.ecss.2017.01.006
Meakin, N. G., and Wyman, M. (2011). Rapid shifts in picoeukaryote community structure in response to ocean acidification. ISME J. 5, 1397–1405. doi: 10.1038/ismej.2011.18
Montagnes, D. J. S., Berges, A., Harrison, P. J., and Taylor, F. J. R. (1994). Estimating carbon, nitrogen, protein, and chlorophyll a from volume in marine phytoplankton. Limnol. Oceanogr. 39, 1044–1060. doi: 10.4319/lo.1994.39.5.1044
Monteiro, F. M., Bach, L. T., Brownlee, C., Bown, P., Rickaby, R. E. M., Poulton, A. J., et al. (2016). Why marine phytoplankton calcify. Sci. Adv. 2:e1501822. doi: 10.1126/sciadv.1501822
Mouw, C. B., Barnett, A., McKinley, G. A., Gloege, L., and Pilcher, D. (2016). Phytoplankton size impact on export flux in the global ocean. Glob. Biogeochem. Cycles. 30, 1542–1562. doi: 10.1002/2015GB005355
Neale, P. J., Sobrino, C., Segovia, M., Mercado, J. M., Leon, P., Cortés, M. D., et al. (2014). Effect of CO2, nutrients and light on coastal plankton. I. Abiotic conditions and biological responses. Aquat. Biol. 22, 25–41. doi: 10.3354/ab00587
Newbold, L. K., Oliver, A. E., Booth, T., Tiwari, B., Desantis, T., Maguire, M., et al. (2012). The response of marine picoplankton to ocean acidification. Environ. Microbiol. 14, 2293–2307. doi: 10.1111/j.1462-2920.2012.02762.x
Nielsen, L. T., Hallegraeff, G. M., Wright, S. W., and Hansen, P. J. (2012). Effects of experimental seawater acidification on an estuarine plankton community. Aquat. Microbiol. Ecol. 65, 271–285. doi: 10.3354/ame01554
Nielsen, L. T., Jakobsen, H. H., and Hansen, P. J. (2010). High resilience of two coastal plankton communities to twenty-first century seawater acidification: Evidence from microcosm studies. Mar. Biol. Res. 6, 542–555. doi: 10.1080/17451000903476941
Paasche, E. (2002). A review of the coccolithophorid Emiliania huxleyi (Prymnesiophyceae), with particular reference to growth, coccolith formation, and calcification-photosynthesis interactions. Phycologia 40, 503–529. doi: 10.2216/i0031-8884-40-6-503.1
Paul, A. J., Bach, L. T., Schulz, K. G., Boxhammer, T., Czerny, J., Achterberg, E. P., et al. (2015). Effect of elevated CO2 on organic matter pools and fluxes in a summer Baltic Sea plankton community. Biogeoscience 12, 6181–6203. doi: 10.5194/bg-12-6181-2015
Paul, C., Matthiessen, B., and Sommer, U. (2015). Warming, but not enhanced CO2 concentration, quantitatively and qualitatively affects phytoplankton biomass. Mar. Ecol. Prog. Ser. 528, 39–51. doi: 10.3354/meps11264
Paulino, A. I., Egge, J. K., and Larsen, A. (2008). Effects of increased atmospheric CO2 on small and intermediate sized osmotrophs during a nutrient induced phytoplankton bloom. Biogeoscience 5, 739–748. doi: 10.5194/bg-5-739-2008
Qian, J., and Mopper, K. (1996). Automated high-performance, high temperature combustion total organic carbon analyzer. Anal. Chem. 68, 3090–3097. doi: 10.1021/ac960370z
Redfield, A. C., Ketchum, B. H., and Richards, F. A. (1963). “The influence of organisms on the composition of seawater,” in The Sea, 2nd Edn., ed M. N. Hill (New York, NY: Wiley), 26–77.
Reinfelder, J. R. (2010). Carbon concentrating mechanisms in eukaryotic marine phytoplankton. Annu. Rew. Mar. Sci. 3, 291–315. doi: 10.1146/annurev-marine-120709-142720
Richier, S., Achterberg, E. P., Dumousseaud, C., Poulton, A. J., Suggett, D. J., Tyrell, T., et al. (2014). Phytoplankton responses and associated carbon cycling during shipboard carbonate chemistry manipulation experiments conducted around northwest european shelf seas. Biogeoscience 11, 4733–4752. doi: 10.5194/bg-11-4733-2014
Riebesell, U. (2004). Effects of CO2 enrichment on marine phytoplankton. J. Oceanogr. 60, 719–729. doi: 10.1007/s10872-004-5764-z
Riebesell, U., Bach, L. T., Bellerby, R. G. J., Bermúdez Monsalve, J. R., Boxhammer, T., Czerny, J., et al. (2017). Competitive fitness of a predominant pelagic calcifier impaired by ocean acidification. Nat. Geosci. 10, 19–23. doi: 10.1038/ngeo2854
Riebesell, U., Bellerby, R. G. J., Grossart, H.-P., and Thingstad, F. (2008). Mesocosm CO2 perturbation studies: from organism to community level. Biogeosciences 5, 1157–1164. doi: 10.5194/bg-5-1157-2008
Riebesell, U., Czerny, J., von Bröckel, K., Boxhammer, T., Büdenbender, J., Deckelnick, M., et al. (2013). A mobile sea-going mesocosm system - new opportunities for ocean change research. Biogeoscience 10, 1835–1847. doi: 10.5194/bg-10-1835-2013
Rokitta, S., and Rost, B. (2012). Effects of CO2 and their modulation by light in the life-cycle stages of the coccolithophore Emiliania huxleyi. Limnol. Oceanogr. 57, 607–618. doi: 10.4319/lo.2012.57.2.0607
Rossol, D., Sommer, U., and Winder, M. (2013). Community interactions dampen acidification effects in a coastal plankton system. Mar. Ecol. Progr. Ser. 486, 37–46. doi: 10.3354/meps10352
Rost, B., Zondervan, I., and Riebesell, U. (2002). Light-dependent carbon isotope fractionation in the coccolithophorid Emiliania huxleyi. Limnol. Oceanogr. 47, 120–128. doi: 10.4319/lo.2002.47.1.0120
Sala, M. M., Aparicio, F. L., Balagué, V., Boras, J. A., Borrull, E., Cardelús, C., Cros, L., et al. (2015). Contrasting effects of ocean acidification on the microbial food web under different trophic conditions. ICES J. Mar. Sci. 73, 670–679. doi: 10.1093/icesjms/fsv130
Schaum, E., Rost, B., Millar, A. J., and Collins, S. (2013). Variation in plastic responses of a globally distributed picoplankton species to ocean acidification. Nat. Clim. Change 3, 298–302. doi: 10.1038/nclimate1774
Schulz, K. G., Barcelos e Ramos, J., Zeebe, R. E., and Riebesell, U. (2009). CO2 perturbation experiments: similarities and differences between dissolved inorganic carbon and total alkalinity manipulations. Biogeoscience 6, 2145–2153. doi: 10.5194/bg-6-2145-2009
Schulz, K. G., Bellerby, R. G. J., Brussaard, C. P. D., Büdenebnder, J., Czerny, J., Engel, A., et al. (2013). Temporal biomass dynamics of an Arctic plankton bloom in response to increasing levels of atmospheric carbon dioxide. Biogeoscience 10, 161–180. doi: 10.5194/bg-10-161-2013
Schulz, K. G., and Riebesell, U. (2013). Diurnal changes in seawater carbonate chemistry speciation in a high CO2 world. Mar. Biol. 160, 1889–1899. doi: 10.1007/s00227-012-1965-y
Schulz, K. G., Riebesell, U., Bellerby, R. G. J., Biswas, H., Meyeröfer, M., Müller, M. N., et al. (2008). Build-up and decline of organic matter during PeECE III. Biogeoscience 5, 707–718. doi: 10.5194/bg-5-707-2008
Sett, S., Bach, L. T., Schulz, K. G., Koch-Klavsen, S., Lebrato, M., and Riebesell, U. (2014). Temperature modulates coccolithophorid sensitivity of growth, photosynthesis and calcification to increasing seawater pCO2. PLoS ONE 9:e88308. doi: 10.1371/journal.pone.0088308
Sharp, J. H. (1974). Improved analysis for ‘particulate’ organic carbon and nitrogen from seawater. Limnol. Oceanogr. 19, 984–989. doi: 10.4319/lo.1974.19.6.0984
Sommer, U., Paul, C., and Moustaka-Gouni, M. (2015). Warming and ocean acidification effects on phytoplankton - from species shifts to size shifts within species in a mesocosm experiment. PLoS ONE 10:e0125239. doi: 10.1371/journal.pone.0125239
Tatters, A. O., Roleda, M. Y., Schnetzer, A., Fu, F., Hurd, C. L., Boyd, P. W., et al. (2013). Short- and long-term conditioning of a temperate marine diatom community to acidification and warming. Philos. Trans. R. Soc. B 368:20120437. doi: 10.1098/rstb.2012.0437
Thoisen, C., Riisgaard, K., Lundholm, N., Nielsen, T. G., and Hansen, P. J. (2015). Effect of acidification on an Arctic phytoplankton community from Disko Bay, West Greenland. Mar. Ecol. Progr. Ser. 520, 21–34. doi: 10.3354/meps11123
Thomson, P. G., Davidson, A. T., and Maher, L. (2016). Increasing CO2 changes community composition of pico- and nano-sized protists and prokaryotes at a coastal Antarctic site. Mar. Ecol. Progr. Ser. 554, 51–69. doi: 10.3354/meps11803
Tortell, P. D., DiTullio, G. R., Sigman, D. M., and Morell, F. M. M. (2002). CO2 effects on taxonomic composition and nutrient utilization in an Equatorial Pacific phytoplankton assemblage. Mar. Ecol. Progr. Ser. 236, 37–43. doi: 10.3354/meps236037
Tortell, P. D., Payne, C. D., Li, Y., Trimborn, S., Rost, B., Smith, W. O., et al. (2008). CO2 sensitiviy of Southern Ocean phytoplankton. Geophys. Res. Lett. 35, L04605. doi: 10.1029/2007GL032583
Traving, S. J., Clokie, M. R., and Middelboe, M. (2014). Increased acidification has a profound effect on the interactions between the cyanobacterium Synechococcus sp. WH7803 and its viruses. FEMS Microbiol. Ecol. 87, 133–141. doi: 10.1111/1574-6941.12199
Trimborn, S., Brenneis, T., Sweet, E., and Rost, B. (2013). Sensitivity of Antarctic phytoplankton species to ocean acidification: Growth, carbon acquisition, and species interaction. Limnol. Oceanogr. 58, 997–1007. doi: 10.4319/lo.2013.58.3.0997
Waldbusser, G. G., Hales, B., and Haley, B. A. (2016). Calcium carbonate saturation state: on myths and this or that stories. ICES J. Mar. Sci. 73, 563–568. doi: 10.1093/icesjms/fsv174
Wang, Y., Smith, W. O., Wang, X., and Li, S. (2010). Subtle biological responses to increased CO2 concentrations by Phaeocystis globosa Scherffel, a harmful algal bloom species. Geophys. Res. Lett. 37:L09604. doi: 10.1029/2010GL042666
Webb, A., Malin, G., Hopkins, F., Ho, K. L., Riebesell, U., Schulz, K. G., et al. (2016). Ocean acidification has different effects on the production of dimethylsulfide and dimethylsulfoniopropionate measured in cultures of Emiliania huxleyi and a mesocosm study: a comparison of laboratory monocultures and community interactions. Environm. Chem. 13, 314–329. doi: 10.1071/EN14268
Winter, A., Henderiks, J., Beaufort, L., Rickaby, R. M., and Brown, C. W. (2014). Poleward expansion of the coccolithophore Emiliania huxleyi. J. Plankton Res. 36, 316–325. doi: 10.1093/plankt/fbt110
Yoshimura, T., Nishioka, J., Suzuki, K., Hattori, H., Kiyosawa, H., and Watanabe, Y. W. (2010). Impacts of elevated CO2 on organic carbon dynamics in nutrient depleted Okhotsk Sea surface waters. J. Exp. Mar. Biol. Ecol. 395, 191–198. doi: 10.1016/j.jembe.2010.09.001
Yoshimura, T., Suzuki, K., Kioyosawa, H., Ono, T., Hattori, H., Kuma, K., et al. (2013). Impacts of elevated CO2 on particulate and dissolved organic matter production: microcosm experiments using iron-deficient plankton communities in open subarctic waters. J. Oceanogr. 69, 601–618. doi: 10.1007/s10872-013-0196-2
Keywords: phytoplankton, CO2, ocean acidification, community composition, prymnesiophytes, coccolithophores, picoeukaryotes
Citation: Schulz KG, Bach LT, Bellerby RGJ, Bermúdez R, Büdenbender J, Boxhammer T, Czerny J, Engel A, Ludwig A, Meyerhöfer M, Larsen A, Paul AJ, Sswat M and Riebesell U (2017) Phytoplankton Blooms at Increasing Levels of Atmospheric Carbon Dioxide: Experimental Evidence for Negative Effects on Prymnesiophytes and Positive on Small Picoeukaryotes. Front. Mar. Sci. 4:64. doi: 10.3389/fmars.2017.00064
Received: 02 December 2016; Accepted: 20 February 2017;
Published: 22 March 2017.
Edited by:
Cecile Guieu, Centre National de la Recherche Scientifique (CNRS), FranceReviewed by:
Haimanti Biswas, National Institute of Oceanography, IndiaChristophe Brunet, Stazione Zoologica Anton Dohrn, Italy
Copyright © 2017 Schulz, Bach, Bellerby, Bermúdez, Büdenbender, Boxhammer, Czerny, Engel, Ludwig, Meyerhöfer, Larsen, Paul, Sswat and Riebesell. This is an open-access article distributed under the terms of the Creative Commons Attribution License (CC BY). The use, distribution or reproduction in other forums is permitted, provided the original author(s) or licensor are credited and that the original publication in this journal is cited, in accordance with accepted academic practice. No use, distribution or reproduction is permitted which does not comply with these terms.
*Correspondence: Kai G. Schulz, a2FpLnNjaHVsekBzY3UuZWR1LmF1