 Ana P. Avó
 Tim J. Daniell
 Roy Neilson3
 Solange Oliveira
 Helena Adão
- 1Biology Department, MARE - Marine and Environmental Sciences Centre, University of Évora, Évora, Portugal
- 2University of Sheffield, Western Bank, Sheffield, UK
- 3The James Hutton Institute, Invergowrie, Dundee, UK
- 4Laboratório de Microbiologia do Solo, Departamento de Biologia, Instituto de Ciências Agrárias e Ambientais Mediterrânicas, Universidade de Évora, Evora, Portugal
Concerns regarding the status of marine ecosystems have increased in part due to traditional and emerging human activities in marine waters, driving a demand for approaches with high sample throughput capability to improve ecosystem monitoring. Nematodes are already used as indicator species in biodiversity assessments and biomonitoring of terrestrial and marine systems, with molecular approaches offering the opportunity to utilize these organisms further in large scale ecological surveys and environmental assessments. Based on an available nematode dataset for estuarine sediments of the Mira estuary (SW coast, Portugal), we evaluated the diversity of the nematode community of this system, using the molecular markers 18S rRNA and COI genes. These approaches were compared to voucher specimens from a morphological characterization of the same samples allowing validation and comparison between nematode communities. The spatial and temporal variability of the density and diversity of the nematode assemblages was analyzed based on morphological characterization to allow the validation and efficiency of the genetic characterization. A PCO ordination plot showed a distinct separation of the assemblages between sampling occasions confirmed by PERMANOVA analysis, which showed significant differences, although no significant differences were detected between sampling sites. The morphological characterization identified 50 genera of which only 26 and 25 distinct 18S rRNA and COI DNA barcodes, respectively, were obtained. 90.2% of the morphologically identified specimens representing eleven different genera, successfully generated DNA barcodes for both 18S rRNA and COI genes. This study confirmed that the success of the 18S rRNA gene PCR amplification is higher than of COI gene with 43 species amplified against 34. The study highlights a limitation of available sequences for both targets in databases when compared to the known diversity of marine nematodes. The gene sequences of this study enriched the databases, contributing gene sequences from 7 to 16 new genera for the 18S rRNA and COI genes, respectively. A robust database of gene sequences is a prerequisite for the development of robust high sample throughput techniques to be applied in marine assessing and monitoring programs.
Introduction
Concerns regarding the status of marine ecosystems have increased in part due to traditional and emerging human activities in marine waters, driving development of many methods for the assessment of its ecological status. The primary goal of the Marine Strategy Framework Directive (MSFD) (2008/56/CE) is to achieve or maintain the Good Environmental Status (GES) of European marine waters. The Directive states that GES is achieved when the marine waters provide ecologically diverse and dynamic oceans and seas which are clean, healthy and productive (Article 3). The main aim of the MSFD is to ensure the sustainable marine resources for future generations. Eleven descriptors will be used to assess the GES; here we will focus on Descriptor 1 (Biodiversity), which aims to ensure that the biodiversity will be “maintained,” and where high sample throughput methods can be used to assess, for example, species distribution, population size and habitat condition. Further development of tools for a rapid evaluation of the marine health status is therefore critical with molecular tools seen as a promising approach to improve ecosystem monitoring providing greater accuracy and throughput than traditional approaches (Bourlat et al., 2013). Genomic analysis has catapulted ecology into a new era, representing, perhaps, the largest source of innovation in marine monitoring techniques.
Assessing ecosystem health requires detailed species inventories and biodiversity studies to understand patterns and trends (Larigauderie et al., 2012). It is now common to use DNA barcoding to facilitate identification of taxa and the technique has wide applications in biodiversity conservation, environmental management, invasion biology, trophic interactions studies and food safety (Valentini et al., 2009; Taylor and Harris, 2012). Assessment of DNA allows construction of high-quality sequence reference libraries for the development of high-throughput molecular tools for environmental monitoring, e.g., metabarcoding (Taberlet et al., 2012; Bourlat et al., 2013) or T-RFLP (Terminal-Restriction Fragment Length Polymorphism) (Chen et al., 2010; Donn et al., 2012). The available reference barcode library, if depleted, will affect the results of the community composition inferred from such data. Once a high quality reference database has been established, environmental samples can be analyzed, in a high throughput manner, without the need to isolate individuals for identification (Borja et al., 2016).
Since the inception of DNA barcoding (Hebert et al., 2003; Blaxter et al., 2004), molecular approaches have been increasingly adopted in biodiversity studies. The combination of molecular with morphological approaches is powerful and has facilitated identification and resolution of evolutionary relationships within marine nematodes (Derycke et al., 2008; Fonseca et al., 2008). A good degree of concordance has been achieved between morphology-based taxonomy and DNA barcoding in marine nematodes (De Ley et al., 2005; Bhadury et al., 2006a, 2008). Nematodes are the most diverse and abundant metazoans in aquatic habitats (Lambshead, 2004) crossing many trophic levels of the food web (Vafeiadou et al., 2014), and prevalent in habitats varying from freshwater (Weber and Traunspurger, 2016) to deep sea habitats (Ramalho et al., 2014), and from pristine to extremely polluted environments, and thus are considered excellent as indicators for biodiversity assessment and biomonitoring (Yeates and Boag, 2004). Molecular approaches have been increasingly adopted and offer the opportunity to utilize nematode communities in ecological surveys and environmental assessments (Bhadury et al., 2006a; Griffiths et al., 2006; Donn et al., 2008; Neilson et al., 2009; Bik et al., 2010, 2012; Chen et al., 2010; Creer et al., 2010; Pereira et al., 2010).
The nuclear small subunit (SSU) ribosomal RNA gene (hereafter 18S rRNA gene) is encoded by a conserved gene that allows the design and use of universal PCR nematode primers with resolution at genus level (De Ley et al., 2005). The accumulation of nematode 18S rRNA sequences in public databases reflects its easy amplification across the phylum and its usefulness in molecular phylogenetic studies (Blaxter et al., 1998; Bhadury et al., 2006b; Meldal et al., 2007). Cytochrome c oxidase subunit 1 (COI) gene has been successfully used in barcoding of marine nematodes to resolve taxonomic relationships among closely related and/or cryptic species (Blouin et al., 1998; Derycke et al., 2005, 2010).
The comparison between traditional and molecular based taxonomic composition inferences is the baseline for the construction of high-throughput molecular tools, such as metabarcoding or T-RFLP, to be used as regular techniques in monitoring programs (Donn et al., 2012; Borja et al., 2016). A dataset is available for the nematode assemblages associated to sediment of the Mira estuary (SW cost, Portugal) based on morphological identification, which exhibit spatial and temporal distribution patterns in density and species composition (Adão et al., 2009; Alves et al., 2009; Materatski et al., 2015, 2016). The existing knowledge of the nematode communities of the Mira estuary based on traditional methodology and acquired over many years underpins molecular characterization of nematode communities, creating a sequence library for future application of molecular approaches to assess and monitor the marine ecosystem.
The main aim of this study was to evaluate the diversity of the nematode community of Mira estuary based on morphological and molecular approaches. A temporal and spatial morphological characterization of the community of Mira estuary was performed to assess density and diversity variability to confirm posteriorly a good genetic characterization was achieved for the community. The specific objectives of this study were to: (i) perform temporal and spatial morphological characterization of the nematode community of Mira estuary; (ii) to generate voucher specimens of the different species of marine nematodes; (iii) sequence the 18S rRNA and COI genes of each vouchered nematode individual and species; (iv) create a library of gene sequences (DNA barcodes) of nematode genera/species that were morphologically identified; (v) to contribute the public gene database available for marine nematodes for molecular approaches application to assess and monitor marine ecosystems.
Materials and Methods
Sampling and Nematode Collection
Sampling was performed in the Mira estuary, a small mesotidal system with a semidiurnal tidal regime, located on the southwestern coast of Portugal (37°40′N, 8°40′W) (Figure 1). Together with its surrounding area, this estuary is within a protected area, the Natural Park of “Sudoeste Alentejano e Costa Vicentina” (Adão et al., 2009). The lower section of the estuary was characterized by the presence of Zostera noltii seagrass beds under natural recovery process, and in 2015 it was possible to observe a considerable large area of seagrass beds naturally recovered (Materatski et al., 2016).
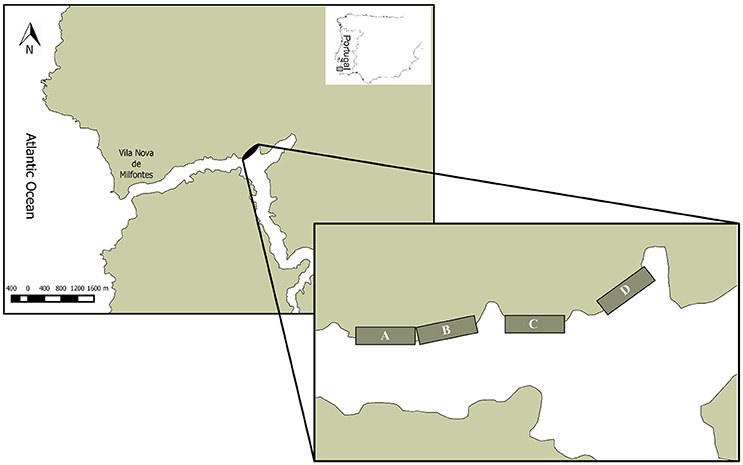
Figure 1. Location of the Mira estuary (Portugal) with an indication of sampling sites (A, B, C, and D).
The mainly environmental variables determining estuarine nematodes assemblages as salinity, grain size and organic matter content of the sediments (Adão et al., 2009) were analyzed through the study. Salinity of the sediment intersticial water was measured in situ using a VWR pHenomenal® MU600H with pHenomenal® 111 electrode. Total organic matter was measured following the Loss on Ignition (LOI) method (Heiri et al., 2001). Three additional sediment cores (5 cm inner diameter, 10 cm deep) were collected and frozen until further laboratorial analysis of the particle size. All samples were analyzed using a Coulter Laser Light Scatter 230 and the following size categories of sediment were determined: clay (<0.004 mm), silt (0.004–0.063 mm), sand (0.063–2 mm) and gravel (>2 mm). The relative content of the different grain size fractions was expressed as a percentage of the total sample weight.
Nematode samples were collected from four sites in July and October 2015 by forcing a hand core (3.6 cm inner diameter) 3 cm into the sediment at the four sites (A, B, C, and D). Each core was randomly selected along a fixed transect in the intertidal zone during low tide. Sites were selected based on information from earlier studies (Adão, 2004; Materatski et al., 2015, 2016) to enable the coverage of known nematode taxonomic diversity in the system. At each site, 3 replicates were collected for morphological identification and 1 replicate for molecular analysis. Collected sediments were immediately fixed in a 4% buffered formalin solution for morphological characterization, and the other replicate was fixed in 70% ethanol for molecular characterization.
Nematodes were extracted from sediment using Ludox HS-40 colloidal silica at a specific gravity 1.18 gcm−3 and a 38μm sieve (Heip et al., 1985). Extracted nematodes for morphological characterization were stored in a 4% formalin solution and stained with Rose Bengal with those for molecular characterization stored in 70% ethanol.
Morphological Characterization of the Nematode Community
Morphological Identification
Nematodes were counted using a stereomicroscope Olympus DP70 (40× magnification) and a counting dish. From each replicate, a random set of 120 nematodes was picked and transferred through a graded series of glycerol-ethanol solutions, following by storage in anhydrous glycerol and mounted on slides (Vincx, 1996). Based on morphological characters, each specimen was identified, wherever possible, to genus and species level (Olympus BX50 light microscope and cell software D Olympus, Japan). Identification was made using pictorial keys (Platt and Warwick, 1983, 1988; Warwick et al., 1998), and online identification keys/literature available in the Nemys database (Guilini et al., 2016). Specimens were denoted as sp. when identification was ambiguous beyond genus level.
Data Analysis
Univariate and multivariate analyses aimed to detect temporal and spatial changes in nematode assemblages over time (T1 and T2). Analyses were performed using PRIMER v6 software package (Clarke and Gorley, 2006) including the PERMANOVA module (Anderson et al., 2008).
Total nematode density (individuals 10 cm−2), genera richness and the ecological diversity indicators: Margalef's richness Index (d) (Margalef, 1958) and Shannon-Wiener diversity (H′) (Shannon and Weaver, 1963) and the genera Rarefaction (EG) (Hurlbert, 1971) were calculated.
Assemblage descriptors (genera total density, genera diversity, d and H′) were subjected to a two-way permutational analysis of variance (PERMANOVA) to test the null hypothesis that there no significant temporal and spatial differences existed in nematode density, diversity between sites (“Site”) and sampling occasions (“Time”). The PERMANOVA analysis was carried out following a two factor design: “Time”: T1 and T2 (2 levels, random); “Site”: Site A, Site B, Site C and Site D (4 levels, fixed). Nematode density data were square root transformed for normality. PERMANOVA analysis (p < 0.05) used a Bray-Curtis similarity matrix. When the number of permutations was lower than 150, the Monte Carlo permutation p(MC) was used. A posteriori pairwise comparisons were performed whenever significant interactions between factors were detected. Euclidean distance similarity matrices were used for univariate data (number of genera, Margalef index and Shannon-Wiener index) and Bray-Curtis similarity matrices for multivariate data (genera composition). “Time” and “Site” similarity data were plotted by Principal Coordinates Analysis (PCO).
Genetic Characterization of the Nematode Community
Morphological Identification
Individual nematodes were hand-picked, rinsed with distilled water and mounted on temporary slides in a drop of sterile water for morphological identification using taxonomic keys described above. Digital photographic (Olympus DP70, Japan) vouchers representing anatomical details of the species nematode were taken.
DNA Extraction
Immediately after the vouchering procedure, individual nematodes were collected from the temporary slide and transferred into individual microtubes containing 20 μl of Worm Lysis Buffer (WLB) (50 mM KCl, 10 mM Tris (pH 8.5), 2.5 mM MgCl2, 0.5% Triton X-100, 0.5% Tween 20) (Ristau et al., 2013) and stored at −20°C. To extract genomic DNA, 1 μl of proteinase K (10 mgml−1) was added to the WLB. Subsequently, nematodes were frozen at −80°C for 10 min followed by an incubation at 65°C for 1h for protein digestion and 10 min at 95°C for proteinase inactivation. Extracts were centrifuged for 1 min at 13,000 rpm and 1.5 μl of the supernatant was used in subsequent PCR amplifications.
Amplification of the 18S rRNA Gene
The 18S rRNA gene region was amplified using primers G18S4 (Blaxter et al., 1998), 4R (Armenteros et al., 2014), 18S_Nem F and 18S_NemR (this study) (Table 1). The primer set G18S4-4R, which amplifies a fragment ca. 925 bp, was used when the two primer sets G18S4-18S_NemR and 18S_NemF-18S_NemR, which amplify a fragment ca. 1700 bp, did not generate product. PCR amplification was performed in 25 μl reaction volume which included: 1.5 μl of DNA template, 1X PCR Buffer, 2 mM MgSO4, 0.2 mM dNTPs (VWR), 0.3 μM each primer (synthesized by STAB VIDA), 400 μg mL−1 of Bovine serum albumin (BSA) and 1 unit of Platinum® Taq DNA Polymerase High Fidelity (Invitrogen). BSA was included in PCR to avoid interferences of possible inhibitors. PCR cycling conditions were: initial denaturation of 1 min at 94°C, 35 cycles of 94°C for 15 s, 56°C for 30 s and 68°C for 2 min with the primer sets G18S4-18S_NemR or 18S_NemF-18S_NemR, or 68°C for 1 min with the primer set G18S4-4R.
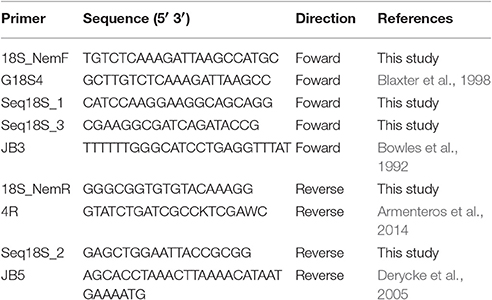
Table 1. Primers sequences for amplification and sequencing of 18S rRNA and COI genes.
Amplification of the COI Gene
The COI region was amplified using the primer pair JB3 (Bowles et al., 1992) and JB5 (Derycke et al., 2005), which amplifies a fragment ca. 426 bp (Table 1). PCR amplification was performed in a 25 μl reaction volume including: 1 μl of DNA template, 1X PCR Buffer, 1X Coral Buffer, 1.5 mM MgCl2, 0.2 mM dNTPs (VWR), 0.25 μM each primer (synthesized by STAB VIDA), 400 μg mL−1 of BSA and 1.25 units of TopTaq DNA Polymerase (Qiagen). Touchdown PCR cycling conditions were: initial denaturation of 5 min at 94°C, 5 cycles of (94°C for 30 s, 54°C for 30 s and temperature decreasing with 1°C for each cycle, 72°C for 30 s) followed by 35 cycles of (94°C for 30 s, 50°C for 30 s, 72°C for 30 s), and a final extension of 10 min at 72°C.
Purification and Sequencing of the 18S rRNA and COI Genes
PCR products were analyzed by 1% agarose gel electrophoresis and those of the expected size were excised and purified using the MinElute PCR Purification Kit (Qiagen) following the instructions of the manufacturer.
Both strands were sequenced with the primers utilized for PCR amplifications (Table 1) and compared with those available in Genbank. Internal primers for the 18S rRNA fragment (Seq18S_1, Seq18S_2 and Seq18S_3) (Table 1) were designed and used to obtain the full sequence. Sequences have been submitted to GenBank under accession numbers KX944126-KX944168 (18S rRNA) and KX951882-KX951915 (COI).
Phylogenetic Analyses of 18S rRNA and COI Gene Sequences
Electropherograms were visually checked for sequence quality and manually edited using BioEdit v7.0.9.0 (Hall, 1999). To search for nucleotide sequence homology, sequences were analyzed using BLAST (Basic Local Alignment Tool) (Altschul et al., 1990). DNA barcodes were aligned with database sequences using ClustalW2 (Larkin et al., 2007). MEGA6 (Tamura et al., 2013) was used for the selection of the best nucleotide substitution model. Phylogenetic trees were then inferred using the Maximum Likelihood (ML) estimation. Branch support was estimated by 1000 bootstrap resamplings.
Results
Environmental Data
The environmental variables measured in sediment and interstitial water during the sampling occasions showed in average a salinity of 37 and sediment organic matter was in average 7%. The sediment samples were characterized by dominance of silt (47%) followed by sand (36%) and clay fractions (17.2%), with a mean grain size ranging from 89 to 139 μm.
Morphological Characterization
The spatial and temporal variability of the density and diversity of the nematode assemblages was analyzed based on morphological characterization to allow the validation and efficiency of the genetic characterization for the community of Mira estuary to be assessed. Highest nematode densities were observed at the first sampling time (July 2015) (Site A: 6,540 ± 1,546; Site B: 5,150 ± 1,389; Site C: 1,964 ± 708; Site D: 4,766 ± 1,508 ind. 10 cm−2); at sampling occasion T2 (October 2015) the density decreased (Site A: 2,420 ± 321; Site B: 2,275 ± 562; Site C: 1,575 ± 357; Site D: 1,580 ± 87 ind. 10 cm−2) (Figure 2). A PCO ordination plot clearly reflects a distinct separation (PCO1 – 30.2%; PCO2 – 17.7%) between the majority of nematode assemblages of T1 and T2 (Figure 3). However, Site C T1 samples were more similar to those samples taken at T2 (Figure 3). These results are also supported by PERMANOVA analysis of density data which showed significant differences between both sampling occasions T1 and T2(“Time”: p < 0.05), although no significant differences were detected between sampling sites (Table 2).
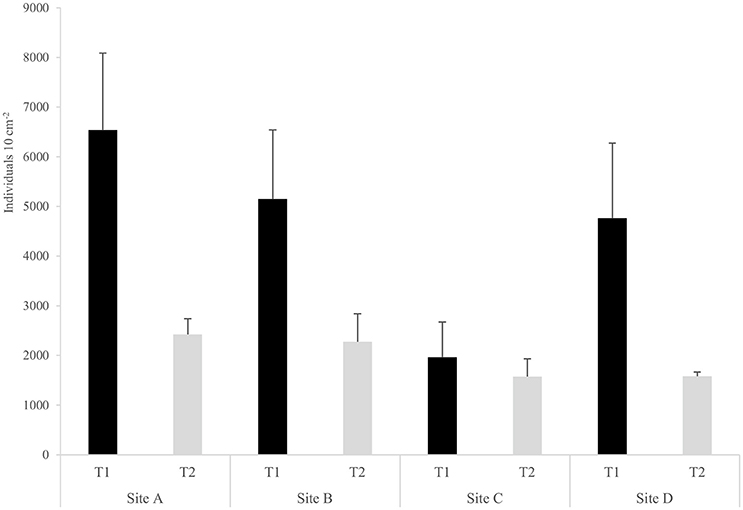
Figure 2. Mean density ± standard error (SE) of nematode assemblages (number of individual per 10 cm−2) at each of the four sampling sites (A, B, C, D) on each sampling occasion (T1, T2).
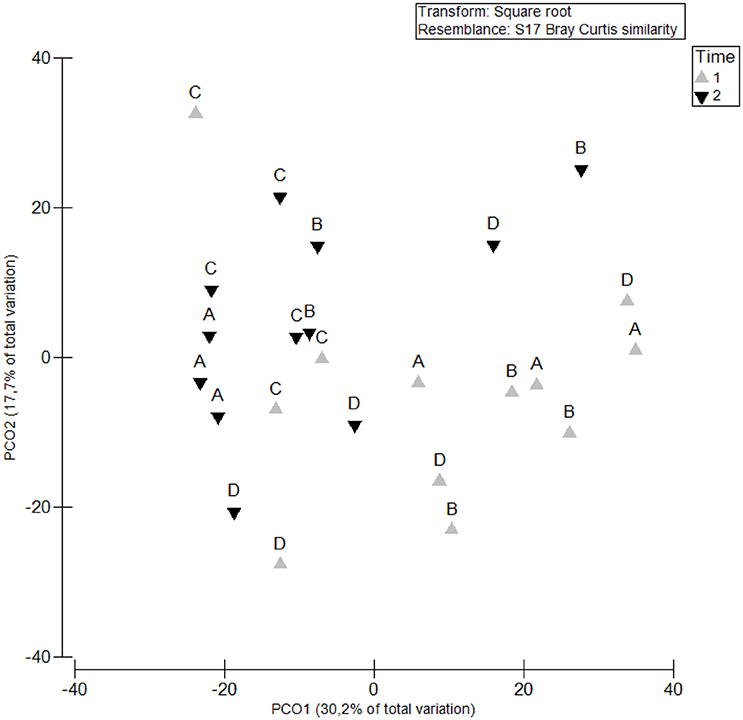
Figure 3. Principal coordinates analysis (PCO) based on nematode densities at each sampling site (“Site”: A, B, C, and D) and sampling occasion (“Time”: T1 and T2).
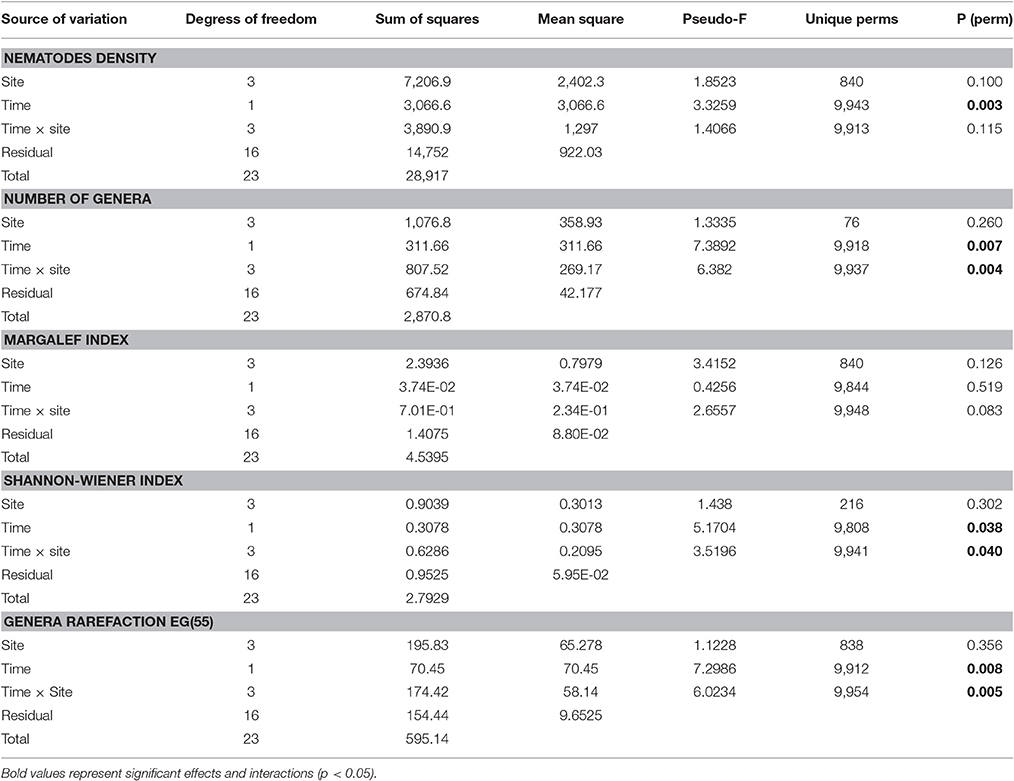
Table 2. Two-factor PERMANOVA test with “Time” (2 levels, random) and “Site” (4 levels, fixed) for nematode total density, number of genera, genera rarefaction, Margalef and Shannon Index.
Fifty nematode genera belonging to 21 families and 3 orders were identified (Table 3). The most abundant families were Linhomoeidae (40.2%) (genera Terschellingia, Linhomoeus, Metalinhomoeus and Megadesmolaimus), Comesomatidae (33.2%) (genera Paracomesoma, Sabatieria, Cervonema and Comesoma), Chromadoridae (7.5%) (genera Ptycholaimellus, Atrochromadora, Chromadorina, Prochromadorella, Chromadora, Neochromadora and Dichromadora), Xyalidae (4.6%) (genera Daptonema, Promonhystera and Metadesmolaimus) and Axonolaimidae (4.4%) (genera Odontophora, Axonolaimus and Ascolaimus). At order level, Monhysterida (50.3%) (genera Terschellingia, Paracomesoma, Linhomoeus, Daptonema, Sphaerolaimus, Metalinhomoeus, Promonhystera, Cervonema, Comesoma, Megadesmolaimus and Metadesmolaimus) was the most abundant, followed by Chromadorida (46.6%) (genera Ptycholaimellus, Atrochromadora, Chromadorina, Synonchiella, Paracanthonchus, Prochromadorella, Paracyatholaimus, Chromadora, Neochromadora, Dichromadora and Praeacanthonchus) and Enoplida (3.1%) (genera Anoplostoma, Halalaimus, Viscosia, Eurystomina, Oncholaimellus, Bathylaimus, Oxystomina, Metoncholaimus, Calyptronema, Oncholaimus and Nemanema) (Table 3).
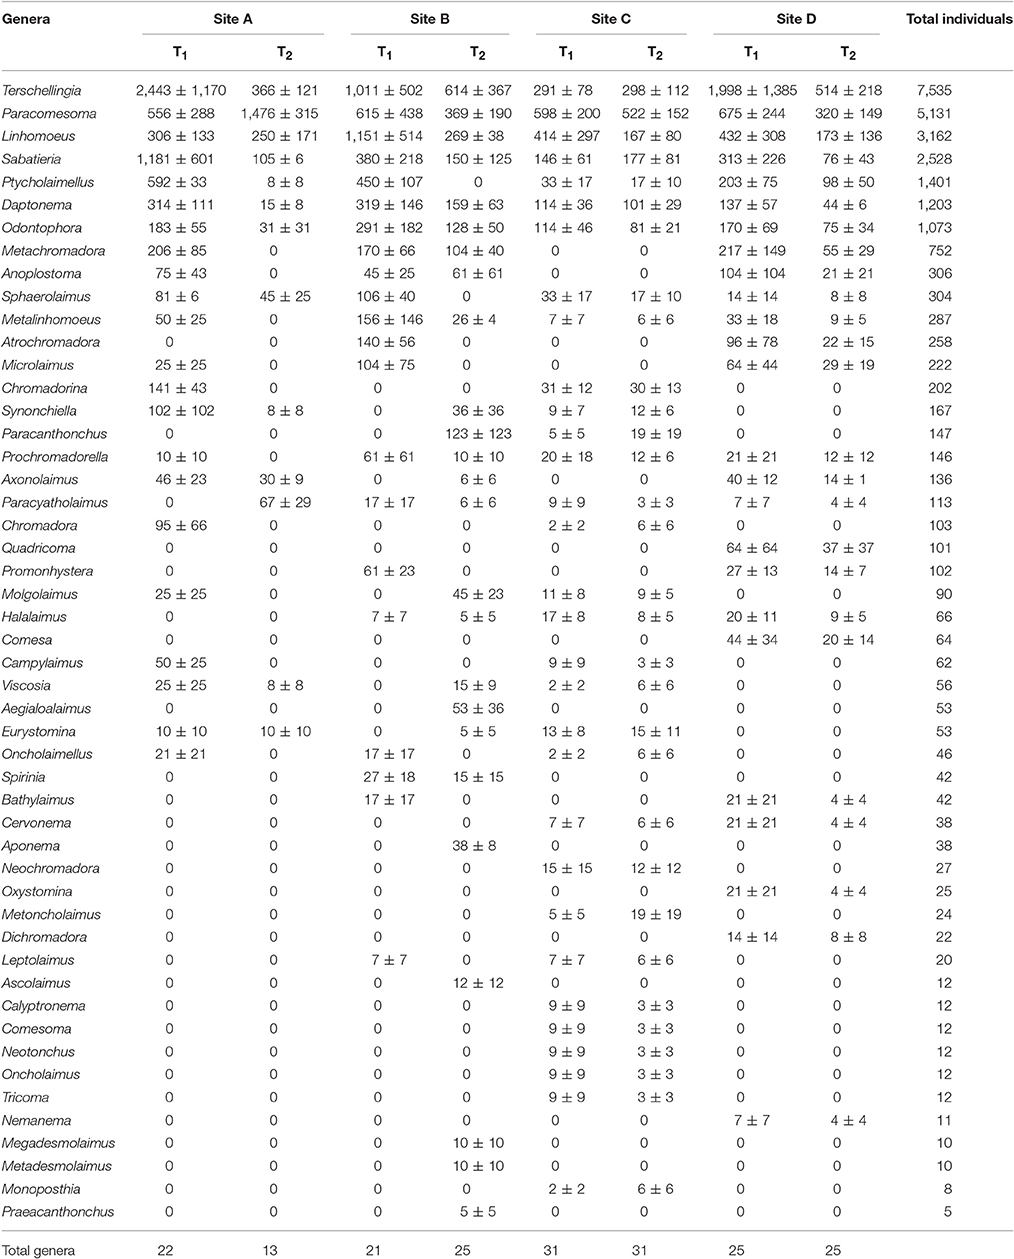
Table 3. Mean density ± standard error (SE) of nematode genera (number of individuals per 10 cm−2) at each sampling site (A, B, C, and D) and sampling occasion (T1 and T2).
The genera Terschellingia (28.7%), Paracomesoma (19.5%), Linhomoeus (12%), Sabatieria (9.6%), Ptycholaimellus (5.3%), Daptonema (4.6%), Odontophora (4.1%), Metachromadora (2.9%), Anoplostoma (1.2%), Sphaerolaimus (1.2%) and Metalinhomoeus (1.1%) represented 90.2% of the total nematode density. The remaining genera represented densities <1% (Table 3). Number of genera (N, p < 0.01), Shannon-Wiener (H′, p < 0.05) and genera rarefaction (EG55, p < 0.01) were significantly different for factor “Time” with a significant interaction for all three attributes at either p < 0.01 (N, EG55) or p < 0.05 (H′) between both factors (“Time” × “Sites”). No significant differences were detected for Margalef index (d) (Table 2).
The highest number of genera (n = 31) was registered at site C, in both sampling occasions T1 and T2, and the lowest number of genera (n = 13) was registered at site A T2 (Table 3). Shannon-Wiener (H′) ranged from site C (H′ = 2.26) to the lowest values at site A (H′ = 1.03), both at the sampling occasion T2. Margalef index (d) showed the highest value in Site B, at the sampling occasion T1 (d = 2.19) and the lowest value in Site A, at the sampling occasion T2 (d = 1.23).
Genetic Characterization
18S rRNA Gene
For a total of 43 specimens (Table 4), 18 (42%) specimens DNA was successfully amplified with primers G18S4-18S_NemR or 18S_NemF-18S_NemR. The remaining individuals (25; 58%) were amplified with primers G18S4-4R.
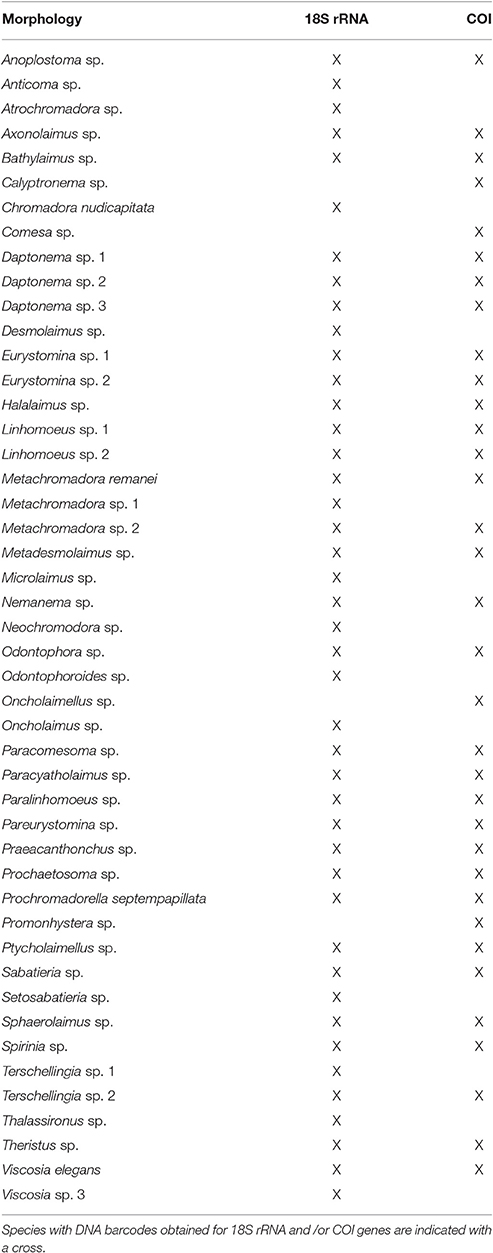
Table 4. Nematode species list identified by the three methods (morphology, 18s rRNA gene and COI gene).
All sequences showed homology with nematode sequences (between 86 and 99%). In total, 43 sequences were obtained representing many of the families, suborders or orders of marine taxa (Meldal et al., 2007). The exceptions were the families Enoplidae, Monoposthiidae, Desmoscolecidae, and Monhysteridae, for which no specimens were obtained for genetic characterization or no amplification was achieved.
Comparison of sequences generated in this study with database sequences fully matched the morphological identification. However, the genera Linhomoeus (Bastian, 1865), Microlaimus (de Man, 1880), Nemanema (Cobb, 1920), Odontophoroides (Boucher and Helléouët, 1977), Paracomesoma (Hope and Murphy, 1972), Prochromadorella (Micoletzky, 1924); and Thalassironus (de Man, 1889) had neither 18S rRNA nor COI sequences in databases. Thus, this dataset contributed with 8 gene sequences from 7 new genera to the database.
An alignment which included 114 18S rRNA sequences generated a consensus sequence of 998 bp in length of which 662 positions were parsimony informative. The best nucleotide substitution model was the General Time Reversible with gamma distributed rates (GTR + G). A Maximum Likelihood (ML) tree (Figure 4) showed a topology consistent with that known for families and orders of marine nematodes. The two classes of marine nematodes (Chromadorea and Enoplea) are separated in two monophyletic groups.
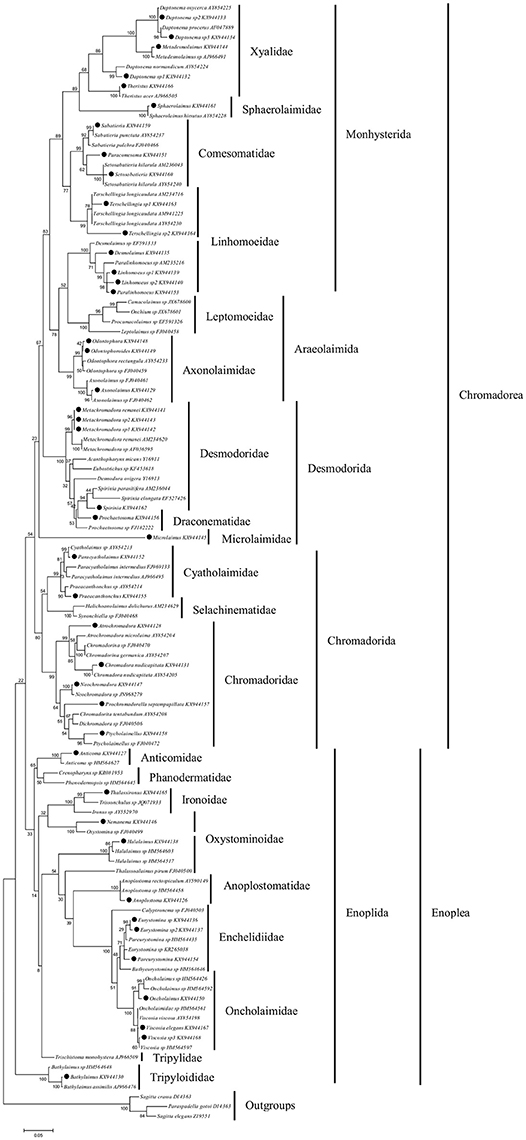
Figure 4. Maximum likelihood tree based on a region of 998 bp of 18S rRNA gene. Sequences labelled with black dots are from this study. Numbers above/below the branches indicate branch support based on 1,000 bootstrap replicates. Scale bars indicate the number of substitutions per site. Families are indicated by vertical bars, followed by orders and classes.
Sequences obtained in this study clustered into well-defined clades together with sequences retrieved from database belonging to 17 different families (Xyalidae, Sphaerolaimidae, Comesomatidae, Linhomoeidae, Axonolaimidae, Desmodoridae, Draconematidae, Microlaimidae, Cyatholaimidae, Chromadoridae, Anticomidae, Ironidae, Oxystominidae, Anoplostomatidae, Enchelidiidae, Oncholaimidae and Tripyloididae). The exceptions are the Linhomoeidae and Oxystominidae families that are both separated in two different clades. The sequences from nematodes identified as Desmolaimus, Prochaetosoma and Atrochromadora do not form clades with sequences from database of the same genera although they are proximal (Figure 4). The identification of these specimens was further confirmed by comparison to stored photo-vouchers.
Among the total 43 specimens, only four (9%) specimens were identified morphologically to the species level. Twelve specimens (28%) were identified as different species being labeled as sp. 1, sp. 2 or sp. 3. The phylogenetic analysis of the 43 sequences with known marine nematode 18S rRNA sequences resolved 11 (27.5%) specimens to species level in the ML tree (Figure 4).
COI Gene
Thirty four of the 43 specimens morphologically identified were successfully amplified with primers JB3 and JB5 (Table 4). Most sequences (82.3%, n = 28) showed a closest match to database nematode sequences with a homology between 73 and 99%. The remaining sequences, 14.7% (n = 5) showed homology with sequences from other phyla, and no significant similarity was found for 3% (n = 1) of the sequences.
Analysis confirmed the morphological characterization. With this study, 34 COI sequences belonging to 34 different species of sixteen genera (Axonolaimus, de Man, 1889; Chromadora, Bastian, 1865; Comesa, Gerlach, 1956; Eurystomina, Filipjev, 1921; Linhomoeus, Bastian, 1865; Metadesmolaimus, Schuurmans Stekhoven, 1935; Metalinhomoeus, de Man, 1907; Nemanema, Cobb, 1920; Paracomesoma, Hope and Murphy, 1972; Paracyatholaimus, Micoletzky, 1922; Paralinhomoeus, de Man, 1907; Pareurystomina, Micoletzky and Kreis, 1930; Prochaetosoma, Micoletzky, 1922; Promonhystera, Wieser, 1956; Ptycholaimellus, Cobb, 1920; and Terschellingia, de Man, 1888) were determined for the first time.
An alignment of 60 COI sequences yielded a consensus sequence of 362 bp in length of which 304 positions were parsimony informative. The best nucleotide substitution model was the General Time Reversible with non-uniform evolutionary rates (GTR + G). The ML tree of COI gene (Figure 5) showed a topology consistent with that known for families of marine nematodes. The two classes of marine nematodes (Chromadorea and Enoplea) are not separated in two clades. The Monhysterida, Chromadorida and Enoplida orders are separated in two clades each.
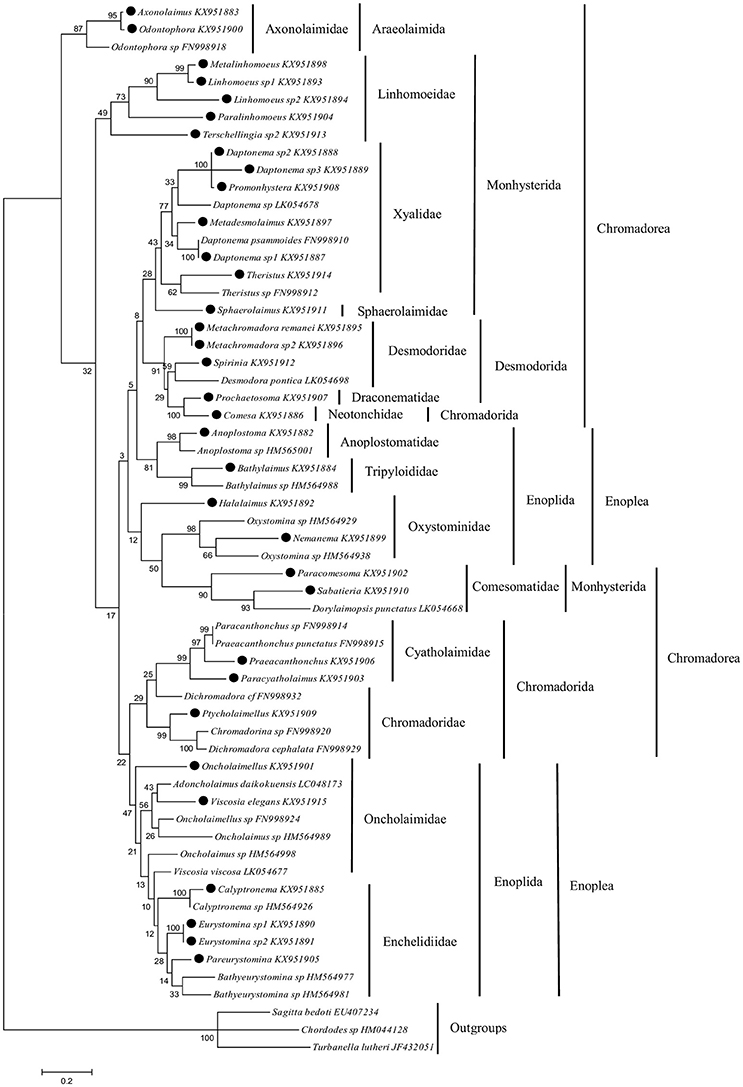
Figure 5. Maximum likelihood tree based on a region of 362 bp of COI gene. Sequences labelled with black dots are from this study. Numbers above/below the branches indicate branch support based on 1,000 bootstrap replicates. Scale bars indicate the number of substitutions per site. Families are indicated by vertical bars, followed by orders and classes.
Sequences obtained in this study segregated into clades with sequences retrieved from databases belonging to fifteen different families (Axonolaimidae, Linhomoeidae, Xyalidae, Sphaerolaimidae, Desmodoridae, Draconematidae, Neotonchidae, Anoplostomatidae, Tripyloididae, Oxystominidae, Comesomatidae, Cyatholaimidae, Chromadoridae, Oncholaimidae and Enchelidiidae). The exceptions were the Desmodoridae and Oncholaimidae families which do not form individual clades. Sequences for Halalaimus and Oncholaimellus did not group with database sequences putatively of the same family although they are similar (Figure 5). Photo-vouchers were used to confirm the identification of these specimens.
From the total 34 specimens, only two (5.9%) specimens were identified morphologically to the species level. Nine specimens (26.5%) were identified as different species being labeled as sp. 1, sp. 2, or sp. 3.
Discussion
Marine nematodes are recognized as good indicators of environmental ecological conditions for a variety of marine habitats, from the estuaries until the deep sea ecosystems. They respond to several types of pressures as the physical and chemical disturbances at spatial and temporal scales. It is the combination of many attributes that gives them the status of a good bioindicator: (i) they are ubiquitous and the assemblages presenting high abundances and many species; (ii) most nematode species have a short life cycle; (iii) some species/genera are tolerant to extreme conditions, and in addition, (iv) marine nematodes are easily sampled (Fonseca and Gallucci, 2016). These nematode characteristics are very useful to develop good tools for assessment of the “Good Environmental Status” of marine ecosystems. Nematodes are considered the ideal model organism or community for exploring the relationship between diversity and ecosystem functioning (Danovaro et al., 2008). However, monitoring programs based on marine nematodes has limitations, the morphological species identification requires extensive taxonomic expertise, is time-consuming, expensive, and laborious (De Ley et al., 2005). This limitation can be overcome with the rapid development of high sample throughput tools representing a promise opportunity to facilitate the implementation of molecular approaches for monitoring programs, and the ability to provide a more comprehensive community analysis than traditional assessments (Bourlat et al., 2013; Dowle et al., 2016). The high-quality reference database provided by DNA barcoding is essential for the design, construction, development, and testing of other high-throughput molecular tools, e.g., metabarcoding or T-RFLP (Donn et al., 2012; Borja et al., 2016). T-RFLP was developed for soil nematode communities, allowing to process large sample numbers compared with classical taxonomic or low throughput molecular analyses, and this tool may be relevant for marine assemblages (Chen et al., 2010; Donn et al., 2012). A rapid and cost-effective taxonomic identification of thousands of samples are also possible with DNA metabarcoding. With this technique, barcodes specific for a species are obtained from the entire environmental sample and compared to a previously generated DNA sequence reference database. Therefore, the community composition inferred from genomic data is dependent on available reference barcode library (Taberlet et al., 2012; Bourlat et al., 2013). In this study, we performed a comparison of morphological and barcoding characterization of the intertidal sediments nematode community of Mira estuary, thus validating that barcoding was established for the community capturing the majority of dominant taxa in the system. This DNA barcode reference database will be used in the future for the development and implementation of high sample throughput tools.
Nematode assemblage densities and diversity obtained by morphological identification were in agreement with previous studies developed in seagrass beds of Mira estuary (Adão, 2004; Vafeiadou et al., 2013, 2014; Materatski et al., 2015, 2016). The high nematode density and diversity, low spatial variability and homogeneous community structure are driven by the physico-chemical, trophic dynamics and biological factors of the seagrass environment characteristics, namely sediment grain size, higher percentage of clay, higher sediment organic matter content and salinity, that are fundamental for structuring the distribution of the nematode assemblages (Alves et al., 2009; Materatski et al., 2015, 2016).
The organic carbon input in the seagrass bed food web at the Mira estuary was also previously assessed and identified as a driver of high nematode density, with several sources, i.e., seagrass detritus, epiphytes, microphytobenthos and suspended particulate organic matter (Vafeiadou et al., 2013, 2014). In this study, temporal differences in nematode density and diversity were associated with greater mean grain size at T2. This is in agreement with previous studies showing decreased nematode abundance in finer sands (Adão et al., 2009; Moens et al., 2014). Genus composition and the most prevalent genera recorded throughout this study were typical of nematode assemblages from estuarine muddy intertidal sediments; i.e., mud-adapted genera belonging to the families Linhomoeidae (Terschellingia, Linhomoeus), Comesomatidae (Paracomesoma), Desmodoridae (Spirinia) and Axonolaimidae (Odontophora) (Smol et al., 1994; Soetaert et al., 1995; Olafsson et al., 2000; Steyaert et al., 2003; Fonseca et al., 2011; Moens et al., 2014).
Intensive morphology-based analyses whilst essential are difficult, time consuming and require an expert taxonomist in marine nematode taxonomy. The decreasing availability of these skills and requirement of higher sample numbers for monitoring is driving a need for development of high sample throughput molecular tools. However, barcoding approaches for nematodes also have limitations, especially in a requirement for validation matching genetic sequences with traditional taxonomy. This integration between molecular approaches and morphological vouchering (photos or videos) is essential for the efficient investigation of nematode biodiversity (De Ley et al., 2005) and development of new high throughput methods. Most molecular studies on marine nematodes focus on the use of 18S rRNA gene due to the availability of universal nematode primers (De Ley et al., 2005; Meldal et al., 2007). The mitochondrial COI gene is used less as a phylogenetic marker in marine nematodes because, in part, it is less constrained than the 18S rRNA gene and making it more difficult to design universal primers for this target (Blaxter et al., 2005; De Ley et al., 2005; Bhadury et al., 2006a). This study confirmed that PCR amplification success of 18S rRNA is higher than COI as reported in previous studies (Bhadury et al., 2006a; Creer et al., 2010; Porazinska et al., 2010). The DNA from specimens of the same nematode genera was amplified using the primers for 18S rRNA and COI genes. The COI gene from 34 species was successfully amplified, against the 18S rRNA gene that was amplified in 43 species. Among the two 18S rRNA gene regions tested, the primers G18S4-4R proved to be more efficient in amplifying the gene region than the primer sets G18S4-18S_NemR and 18S_NemF-18S_NemR for the longer region. Shorter regions are more easily amplified than longer ones and may be sufficiently specific (Hadziavdic et al., 2014).
For the 18S rRNA analysis, sequences showed a nematode origin, and the morphological identification matched with the molecular based identification. The COI analysis showed five sequences with high similarity with the Arthropoda Phylum, probably due to DNA contamination. A limitation of available sequences when compared to the enormous diversity of marine nematodes (Lambshead, 2004) is observed, especially for COI gene, for which only 281 sequences are available, against 1020 for 18S rRNA gene. Therefore, it is essential to improve the databases with morphological vouchers associated with gene sequences.
Generic diversity differed both spatially and temporally. Although 50 nematode genera were morphologically identified from all four sampling sites, only 26 and 25 DNA barcodes were obtained for the 18S rRNA and COI genes, respectively. However, 90.2% of the nematode assemblages are constituted by Terschellingia, Paracomesoma, Linhomoeus, Sabatieria, Ptycholaimellus, Daptonema, Odontophora, Metachromadora, Anoplostoma, Sphaerolaimus, and Metalinhomoeus. With the exception of the genus Metalinhomoeus which amplified only with COI, for all of the other genera, DNA barcodes were obtained for both genes. Therefore, the barcoding is representative of the nematode assemblages in Mira estuary. The remaining genera represented abundances lower than 1%. For example, for the genera Ascolaimus, Comesoma, Megadesmolaimus, Neotonchus and Tricoma, 12 or fewer individuals were found in all the sites and times (Table 3). These rare genera drove the differences in spatial and temporal distributions.
In general, both phylogenetic trees based on 18S rRNA and COI genes show a topology congruent with that known for families and orders of marine nematodes. However, lower support bootstrap values were obtained in the ML tree of the COI gene. The ML tree based on the 18S rRNA gene sequence is more robust with higher bootstrap values. Several factors can contribute to the lower robustness of the COI gene-based tree compared with the 18S rRNA gene tree, namely (1) the higher sequence variability of the COI gene, (2) the shorter length of the sequenced fragment of the COI gene, and (3) the lower number of COI gene sequences in the databases.
Taxa morphologically identified and whose 18S rRNA (Linhomoeus, Microlaimus, Nemanema, Odontophoroides, Paracomesoma, Prochromadorella and Thalassironus) and COI (Axonolaimus, Chromadora, Comesa, Eurystomina, Linhomoeus, Metadesmolaimus, Metalinhomoeus, Nemanema, Paracomesoma, Paracyatholaimus, Paralinhomoeus, Pareurystomina, Prochaetosoma, Promonhystera, Ptycholaimellus, and Terschellingia) genes had not been previously sequenced were placed consistently within clades representatives of the families. This result confirms the agreement between the morphology- and DNA-based approaches at family level of marine nematodes (van Megen et al., 2009; Derycke et al., 2010).
Generally COI gene sequencing seems to be a promising tool for DNA barcoding of nematodes (Derycke et al., 2010; Armenteros et al., 2014). However, the poor knowledge of the diversity and taxonomy of marine nematodes (Bucklin et al., 2011), and the low number of sequences of COI in databases, have been limiting the implementation of COI barcoding for marine nematodes driving poor coverage probably driven by sequence variability reducing primer efficiency. Thereafter, in the absence of a robust database of COI sequences, 18S rRNA gene will remain the most widely used molecular marker for identification of marine nematodes.
The genomic approach application to marine monitoring is the most promising techniques. However, these routine applications require available reference barcode library, which affect the taxonomic composition inferred from genomic data (Aylagas et al., 2014). There is therefore an urgent need to compare both traditional and molecular based taxonomic composition inferences so that can be introduced as regular tool in monitoring program (Borja et al., 2016). Benthic nematodes are considered as good indicators either for biodiversity and ecosystems interactions assessment providing a community monitoring model in aquatic ecosystems (Alves et al., 2013).
The classical morphology-based approach to assess the nematode diversity for ecosystem functioning is a very time consuming and laborious task that requires considerable taxonomic expertise and nullified their ecological abilities. This makes the development of high-throughput and low cost molecular tools for nematode identification appealing and essential, e.g., the dT-RFLP (directed Terminal-Restriction Fragment Length Polymorphism) whose principle is the selection of restriction endonucleases which cut the DNA in positions that discriminate between taxa of interest. dT-RFLP characterizes nematode assemblages by relative abundance of feeding guilds, providing a high-throughput semi-quantitative characterization of nematode communities (Donn et al., 2012). However, the dT-RFLP application in estuarine and marine assemblages is not direct and requires effort in design and validation stages, including a combination of morphological analysis and cloning—sequence libraries performed on selected samples barcoding library.
Conclusion
The temporal and spatial morphological characterization of the nematode assemblages allowed the confirmation of their genetic characterization. Although 50 nematode genera were morphologically identified, and only 26 and 25 DNA barcodes were obtained for the 18S rRNA and COI genes, respectively, the barcoding of the Mira estuary community was mostly achieved. 90.2% of the nematode assemblages were constituted by eleven nematode genera and DNA barcodes were obtained for both 18S rRNA and COI genes. Gene sequences obtained in this study enriched public databases and will provide a reference barcode database for future studies of the Mira estuary and other similar estuarine systems. This dataset contributed with gene sequences from 7 to 16 new genera for 18S rRNA and COI genes, respectively, to the database. This will be useful not only for the rapid identification of nematodes from the Mira estuary, but may also be applicable to other estuaries with similar communities. The information provided here demonstrates that molecular and morphological data is congruent opening the way for the development of high sample throughput molecular tools for the assessment of sediment environmental quality. These tools will be especially useful in next generation marine monitoring programs due to their capability for the processing of the high sample numbers required to enable the achievement of the goals of worldwide marine legislation.
Author Contributions
HA was the main coordinator of this study, she was responsible in obtaining the financial support and she conducted the sampling and sample processing including taxonomic identification of the nematodes. She came up with the study design and working plan and actively contributed to the data analysis, and writing. AA was responsible for the genetic characterization of the nematodes, sample processing, phylogenetic analyses, data analysis and writing of the manuscript. TD participated in the orientation of the sample design, the genetic characterization of the nematodes and writing of the manuscript. RN participated in the genetic characterization of the nematodes and writing of the manuscript. JB participated in sampling process, morphological identification of the nematodes and data analysis. SO participated in the genetic characterization of the nematodes and writing of the manuscript.
Conflict of Interest Statement
The authors declare that the research was conducted in the absence of any commercial or financial relationships that could be construed as a potential conflict of interest.
Acknowledgments
This work was supported by the Fundação para a Ciência e Tecnologia (FCT), through the research projects CoolNematode (FCT; EXPL/MAR-EST0553/2013) and ProMira (PROMAR; 31-03-02-FEP-006) and by the strategic project UID/MAR/04292/2013. RN and TD were partly funded by the Rural and Environment Science and Analytical Services Division of the Scottish Government. TD is partly funded by the HEFCE N8 Agrifood programme.
References
Adão, H. (2004). Dynamics of Meiofauna Communities in Association with Zostera Noltii Seagrass Beds in the Mira Estuary (SW Portugal). [Ph.D. Thesis]. Évora, University of Évora.
Adão, H., Alves, A. S., Patrício, J., Neto, J. M., Costa, M. J., and Marques, J. C. (2009). Spatial distribution of subtidal Nematoda communities along the salinity gradient in southern European estuaries. Acta Oecol. 35, 287–300. doi: 10.1016/j.actao.2008.11.007
Altschul, S. F., Gish, W., Miller, W., Myers, E. W., and Lipman, J. D. (1990). Basic local alignment search tool. J. Mol. Biol. 215, 403–410. doi: 10.1016/S0022-2836(05)80360-2
Alves, A. S., Adão, H., Ferrero, T. J., Marques, J. C., Costa, M. J., and Patrício, J. (2013). Benthic meiofauna as indicator of ecological changes in estuarine ecosystems: The use of nematodes in ecological quality assessment. Ecol. Indic. 24, 462–475. doi: 10.1016/j.ecolind.2012.07.013
Alves, A. S., Adão, H., Patrício, J., Neto, J. M., Costa, M. J., and Marques, J. C. (2009). Spatial distribution of subtidal meiobenthos along estuarine gradients in two Southern European estuaries (Portugal). J. Mar. Biol. Assoc. UK 89, 1529–1540. doi: 10.1017/S0025315409000691
Anderson, M. J., Gorley, R. N., and Clarke, K. R. (2008). Permanova+ for Primer: Guide to Software and Statistical Methods. Plymouth: PRIMER-E.
Armenteros, M., Rojas-Corzo, A., Ruiz-Abierno, A., Derycke, S., Backeljau, T., and Decraemer, W. (2014). Systematics and DNA barcoding of free-living marine nematodes with emphasis on tropical desmodorids using nuclear SSU rDNA and mitochondrial COI sequences. Nematology 16, 979–989. doi: 10.1163/15685411-00002824
Aylagas, E., Borja, Á., and Rodríguez-Ezpeleta, N. (2014). Environmental status assessment using DNA metabarcoding :towards a genetics based Marine Biotic Index (gAMBI). PLoS ONE 9:e90529. doi: 10.1371/journal.pone.0090529
Bhadury, P., Austen, M. C., Bilton, D. T., Lambshead, P. J. D., Rogers, A. D., and Smerdon, G. R. (2006a). Development and evaluation of a DNA-barcoding approach for the rapid identification of nematodes. Mar. Ecol. Prog. Ser. 320, 1–9. doi: 10.3354/meps320001
Bhadury, P., Austen, M. C., Bilton, D. T., Lambshead, P. J. D., Rogers, A. D., and Smerdon, G. R. (2006b). Molecular detection of marine nematodes from environmental samples: overcoming eukaryotic interference. Aquatic Microb. Ecol. 44, 97–103. doi: 10.3354/ame044097
Bhadury, P., Austens, M., Bilton, D., Lambshead, P., Rogers, A., and Smerdon, G. (2008). Evaluation of combined morphological and molecular techniques for marine nematode (Terschellingia spp.) identification. Mar. Biol. 154, 509–518. doi: 10.1007/s00227-008-0945-8
Bik, H. M., Lambshead, P. J., Thomas, W. K., and Lunt, D. H. (2010). Moving towards a complete molecular framework of the Nematoda: a focus on the Enoplida and early-branching clades. BMC Evol. Biol. 10:353. doi: 10.1186/1471-2148-10-353
Bik, H. M., Porazinska, D. L., Creer, S., Caporaso, J. G., Knight, R., and Thomas, W. K. (2012). Sequencing our way towards understanding global eukaryotic biodiversity. Trends Ecol. Evol. 27, 233–243. doi: 10.1016/j.tree.2011.11.010
Blaxter, M., Elsworth, B., and Daub, J. (2004). DNA taxonomy of a neglected animal phylum: an unexpected diversity of tardigrades. Proc. Biol. Sci. 271(Suppl. 4), S189–S192. doi: 10.1098/rsbl.2003.0130
Blaxter, M. L., De Ley, P., Garey, J. R., Liu, L. X., Scheldeman, P., Vierstraete, A., et al. (1998). A molecular evolutionary framework for the phylum Nematoda. Nature 392, 71–75. doi: 10.1038/32160
Blaxter, M., Mann, J., Chapman, T., Thomas, F., Whitton, C., Floyd, R., et al. (2005). Defining operational taxonomic units using DNA barcode data. Philos. Trans. R. Soc. Lond. B Biol. Sci. 360, 1935–1943. doi: 10.1098/rstb.2005.1725
Blouin, M. S., Yowell, C. A., Courtney, C. H., and Dame, J. B. (1998). Substitution bias, rapid saturation, and the use of mtDNA for nematode systematics. Mol. Biol. Evol. 15, 1719–1727. doi: 10.1093/oxfordjournals.molbev.a025898
Borja, A., Elliott, M., Andersen, J. H., Berg, T., Carstensen, J., Halpern, B. S., et al. (2016). Overview of integrative assessment of marine systems: the ecosystem approach in practice. Front. Mar. Sci. 3:20. doi: 10.3389/fmars.2016.00020
Bourlat, S. J., Borja, A., Gilbert, J., Taylor, M. I., Davies, N., Weisberg, S. B., et al. (2013). Genomics in marine monitoring: new opportunities for assessing marine health status. Mar. Pollut. Bull. 74, 19–31. doi: 10.1016/j.marpolbul.2013.05.042
Bowles, J., Blair, D., and McManus, D. P. (1992). Genetic variants within the genus Echinococcus identified by mitochondrial DNA sequencing. Mol. Biochem. Parasitol. 54, 165–173. doi: 10.1016/0166-6851(92)90109-W
Bucklin, A., Steinke, D., and Blanco-Bercial, L. (2011). DNA barcoding of marine metazoa. Ann. Rev. Mar. Sci. 3, 471–508. doi: 10.1146/annurev-marine-120308-080950
Chen, X., Daniell, T., Neilson, R., O'Flaherty, V., and Griffiths, B. (2010). A comparison of molecular methods for monitoring soil nematodes and their use as biological indicators. Eur. J. Soil Biol. 46, 319–324. doi: 10.1016/j.ejsobi.2010.05.002
Creer, S., Fonseca, V. G., Porazinska, D. L., Giblin-Davis, R. M., Sung, W., Power, D. M., et al. (2010). Ultrasequencing of the meiofaunal biosphere: practice, pitfalls and promises. Mol. Ecol. 19(Suppl. 1), 4–20. doi: 10.1111/j.1365-294X.2009.04473.x
Danovaro, R., Gambi, C., Dell'Anno, A., Corinaldesi, C., Fraschetti, S., Vanreusel, A., et al. (2008). Exponential decline of deep-sea ecosystem functioning linked to benthic biodiversity loss. Curr. Biol. 18, 1–8. doi: 10.1016/j.cub.2007.11.056
De Ley, P., De Ley, I. T., Morris, K., Abebe, E., Mundo-Ocampo, M., Yoder, M., et al. (2005). An integrated approach to fast and informative morphological vouchering of nematodes for applications in molecular barcoding. Philos. Trans. R. Soc. Lond. B Biol. Sci. 360, 1945–1958. doi: 10.1098/rstb.2005.1726
Derycke, S., Fonseca, G., Vierstraete, A., Vanfleteren, J., Vincx, M., and Moens, T. (2008). Disentangling taxonomy within the Rhabditis (Pellioditis) marina (Nematoda, Rhabditidae) species complex using molecular and morphological tools. Zool. J. Linn. Soc. 152, 1–15. doi: 10.1111/j.1096-3642.2007.00365.x
Derycke, S., Remerie, T., Vierstraete, A., Backeljau, T., Vanfleteren, J., Vincx, M., et al. (2005). Mitochondrial DNA variation and cryptic speciation within the free-living marine nematode Pellioditis marina. Mar. Ecol. Prog. Ser. 300, 91–103. doi: 10.3354/meps300091
Derycke, S., Vanaverbeke, J., Rigaux, A., Backeljau, T., and Moens, T. (2010). Exploring the use of cytochrome oxidase c subunit 1 (COI) for DNA barcoding of free-living marine nematodes. PLoS ONE 5:e13716. doi: 10.1371/journal.pone.0013716
Donn, S., Griffiths, B. S., Neilson, R., and Daniell, T. J. (2008). DNA extraction from soil nematodes for multi-sample community studies. Appl. Soil Ecol. 38, 20–26. doi: 10.1016/j.apsoil.2007.08.006
Donn, S., Neilson, R., Griffiths, B. G., and Daniell, T. J. (2012). A novel molecular approach for rapid assessment of soil nematode assemblages – variation, validation and potential applications. Methods Ecol. Evol. 3, 12–23. doi: 10.1111/j.2041-210X.2011.00145.x
Dowle, E. J., Pochon, X. C., Banks, J., Shearer, K., and Wood, S. A. (2016). Targeted gene enrichment and high-throughput sequencing for environmental biomonitoring: a case study using freshwater macroinvertebrates. Mol. Ecol. Resour. 16, 1240–1254. doi: 10.1111/1755-0998.12488
Fonseca, G., Derycke, S., and Moens, T. (2008). Integrative taxonomy in two free-living nematode species complexes. Biol. J. Linn. Soc. 94, 737–753. doi: 10.1111/j.1095-8312.2008.01015.x
Fonseca, G., and Gallucci, F. (2016). The need of hypothesis-driven designs and conceptual models in impact assessment studies: an example from the free-living marine nematodes. Ecol. Indic. 71, 79–86. doi: 10.1016/j.ecolind.2016.06.051
Fonseca, G., Hutchings, P., and Gallucci, F. (2011). Meiobenthic communities of seagrass beds (Zostera capricorni) and unvegetated sediments along the coast of New South Wales, Australia. Estuar. Coast. Shelf Sci. 91, 69–77. doi: 10.1016/j.ecss.2010.10.003
Griffiths, B., Donn, S., Neilson, R., and Daniell, T. (2006). Molecular sequencing and morphological analysis of a nematode community. Appl. Soil Ecol. 32, 325–337. doi: 10.1016/j.apsoil.2005.07.006
Guilini, K., Bezerra, T. N., Eisendle-Flöckner, U., Deprez, T., Fonseca, G., Holovachov, O., et al. (2016). NeMys: World Database of Free-Living Marine Nematodes. Available online at: http://nemys.ugent.be
Hadziavdic, K., Lekang, K., Lanzen, A., Jonassen, I., Thompson, E. M., and Troedsson, C. (2014). Characterization of the 18S rRNA gene for designing universal eukaryote specific primers. PLoS ONE 9:e87624. doi: 10.1371/journal.pone.0087624
Hall, T. (1999). BioEdit: a user-friendly biological sequence alignment editor and analysis program for Windows 95/98/NT. Nucleic Acids Symp. Ser. 41, 95–98.
Hebert, P. D., Cywinska, A., Ball, S. L., and deWaard, J. R. (2003). Biological identifications through DNA barcodes. Proc. Biol. Sci. 270, 313–321. doi: 10.1098/rspb.2002.2218
Heip, C., Vincx, M., and Vranken, G. (1985). The ecology of marine Nematoda. Ann. Rev. Oceanogr. Mar. Biol. 23, 399–489.
Heiri, O., Lotter, A. F., and Lemcke, G. (2001). Loss on ignition as a method for estimating organic and carbonate content in sediments: reproducibility and comparability of results. J. Paleomnol. 25, 101–110. doi: 10.1023/A:1008119611481
Hurlbert, S. H. (1971). The non-concept of species diversity: a critique and alternative parameters. Ecology 52, 577–586. doi: 10.2307/1934145
Lambshead, P. J. D. (2004). “Marine nematode biodiversity,” in Nematology: Advances and Perspectives, eds Z. X. Chen, S. Y. Chen, and D. W. Dickson (Wallingford, CT: CABI Publishing), 436–467.
Larigauderie, A., Prieur-Richard, A. H., Mace, G. M., Lonsdale, M., Mooney, H. A., Brussaard, L., et al. (2012). Biodiversity and ecosystem services science for a sustainable planet: the DIVERSITAS vision for 2012-20. Curr. Opin. Environ. Sustain. 4, 101–105. doi: 10.1016/j.cosust.2012.01.007
Larkin, M. A., Blackshields, G., Brown, N. P., Chenna, R., McGettigan, P. A., McWilliam, H., et al. (2007). Clustal W and Clustal X version 2.0. Bioinformatics 23, 2947–2948. doi: 10.1093/bioinformatics/btm404
Materatski, P., Vafeiadou, A. M., Moens, T., and Adão, H. (2016). Structural and functional composition of benthic nematode assemblages during a natural recovery process of Zostera noltii seagrass beds. Estuar. Coast. 39, 1478–1490. doi: 10.1007/s12237-016-0086-0
Materatski, P., Vafeiadou, A. M., Ribeiro, R., Moens, T., and Adão, H. (2015). A comparative analysis of benthic nematode assemblages from Zostera noltii beds before and after a major vegetation collapse. Estuar. Coast. Shelf Sci. 167, 256–268. doi: 10.1016/j.ecss.2015.07.001
Meldal, B. H., Debenham, N. J., De Ley, P., De Ley, I. T., Vanfleteren, J. R., Vierstraete, A. R., et al. (2007). An improved molecular phylogeny of the Nematoda with special emphasis on marine taxa. Mol. Phylogenet. Evol. 42, 622–636. doi: 10.1016/j.ympev.2006.08.025
Moens, T., Vafeiadou, A. M., Geyter, E. D., Vanormelingen, P., Sabbe, K., and Troch, M. D. (2014). Diatom feeding across trophic guilds in tidal flat nematodes, and the importance of diatom cell size. J. Sea Res. 92, 125–133. doi: 10.1016/j.seares.2013.08.007
Neilson, R., Donn, S., Griffiths, B., Daniell, T., Rybarczk, K., van den Elsen, S., et al. (2009). “Molecular tools for analysing nematode assemblages,” in Nematodes as Environmental Bioindicators, eds M. Wilson and T. Kakouli-Duarte (Wallingford: CABI), 108–207.
Olafsson, E., Carlstrom, S., and Ndaro, S. G. M. (2000). Meiobenthos of hypersaline tropical mangrove sediment in relation to spring tide inundation. Hydrobiologia 426, 57–64. doi: 10.1023/A:1003992211656
Pereira, T. J., Fonseca, G., Mundo-Ocampo, M., Guilherme, B. C., and Rocha-Olivares, A. (2010). Diversity of free-living marine nematodes (Enoplida) from Baja California assessed by integrative taxonomy. Mar. Biol. 157, 1665–1678. doi: 10.1007/s00227-010-1439-z
Platt, H. M., and Warwick, R. M. (1983). Free Living Marine Nematodes. Part I: British Enoplids. Pictorial Key to World Genera and Notes for the Identification of British Species. London: Cambridge University Press.
Platt, H. M., and Warwick, R. M. (1988). Free Living Marine Nematodes. Part II: British Chromadorids. Pictorial Key to World Genera and Notes for the Identification of British Species. Leiden: E. J. Brill/Dr. W. Backhuys.
Porazinska, D. L., Giblin-Davis, R. M., Sung, W., and Thomas, W. K. (2010). Linking operational clustered taxonomic units (OCTUs) from parallel ultra sequencing (PUS) to nematode species. Zootaxa 2427, 55–63. doi: 10.11646/zootaxa.2427.1.6
Ramalho, S. P., Adão, H., Kiriakoulakis, K., Wolff, G. A., Vanreusel, A., and Ingels, J. (2014). Temporal and spatial variation in the Nazaré Canyon (Western Iberian margin): inter-annual and canyon heterogeneity effects on meiofauna biomass and diversity. Deep Sea Res. Part I Oceanogr. Res. Pap. 83, 102–114. doi: 10.1016/j.dsr.2013.09.010
Ristau, K., Steinfartz, S., and Traunspurger, W. (2013). First evidence of cryptic species diversity and significant population structure in a widespread freshwater nematode morphospecies (Tobrilus gracilis). Mol. Ecol. 22, 4562–4575. doi: 10.1111/mec.12414
Shannon, C. E., and Weaver, W. (1963). The mathematical theory of communication. Bell Syst. Tech. J. 27, 623–656. doi: 10.1002/j.1538-7305.1948.tb00917.x
Smol, N., Willems, K. A., Govaere, J. C. R., and Sandee, A. J. J. (1994). Composition, distribution, biomass of meiobenthos in the Oosterschelde estuary (SW Netherlands). Dev. Hydrobiol. 282/283, 197–217. doi: 10.1007/BF00024631
Soetaert, K., Vincx, M., Wittoeck, J., and Tulkens, M. (1995). Meiobenthic distribution and nematode community structure in five European estuaries. Hydrobiologia 311, 185–206. doi: 10.1007/978-94-009-0117-9_15
Steyaert, M., Vanaverbeke, J., Vanreusel, A., Barranguet, C., Lucas, C., and Vincx, M. (2003). The importance of fine-scale, vertical profiles in characterizing nematode community structure. Estuar. Coast. Shelf Sci. 58, 353–366. doi: 10.1016/S0272-7714(03)00086-6
Taberlet, P., Coissac, E., Pompanon, F., Brochmann, C., and Willerslev, E. (2012). Towards next-generation biodiversity assessment using DNA metabarcoding. Mol. Ecol. 21, 2045–2050. doi: 10.1111/j.1365-294X.2012.05470.x
Tamura, K., Stecher, G., Peterson, D., Filipski, A., and Kumar, S. (2013). MEGA6: molecular evolutionary genetics analysis version 6.0. Mol. Biol. Evol. 30, 2725–2729. doi: 10.1093/molbev/mst197
Taylor, H. R., and Harris, W. E. (2012). An emergent science on the brink of irrelevance: a review of the past 8 years of DNA barcoding. Mol. Ecol. Resour. 12, 377–388. doi: 10.1111/j.1755-0998.2012.03119.x
Vafeiadou, A., Materatski, P., Adão, H., De Troch, M., and Moens, T. (2013). Food sources of macrobenthos in an estuarine seagrass habitat (Zostera noltii) as revealed by dual stable isotope signatures. Mar. Biol. 160, 2517–2523. doi: 10.1007/s00227-013-2238-0
Vafeiadou, A., Materatski, P., Adão, H., De Troch, M., and Moens, T. (2014). Resource utilization and trophic position of nematodes and harpacticoid copepods in and adjacent to Zostera noltii beds. Biogeosciences 11, 4001–4014. doi: 10.5194/bg-11-4001-2014
Valentini, A., Pompanon, F., and Taberlet, P. (2009). DNA barcoding for ecologists. Trends Ecol. Evol. 24, 110–117. doi: 10.1016/j.tree.2008.09.011
van Megen, H., van den Elsen, S., Holterman, M., Karssen, G., Mooyman, P., Bongers, T., et al. (2009). A phylogenetic tree of nematodes based on about 1200 full-length small subunit ribosomal DNA sequences. Nematology 11, 927–950. doi: 10.1163/156854109X456862
Vincx, M. (1996). “Meiofauna in marine and freshwater sediments,” in Methods for the Examination of Organismal Diversity in Soils and Sediments, ed G. S. Hall (Wallingford: Cabi Publishing), 187–195.
Warwick, R. M., Platt, H. M., and Somerfield, P. J. (1998). Free Living Marine Nematodes. Part III: Monhysterids. Pictorial Key to World Genera and Notes for the Identification of British Species. Shrewsbury: Field Studies Council.
Keywords: benthic nematodes, DNA barcoding, good environmental status (GES), biodiversity assessment, COI, molecular monitoring, 18S rRNA
Citation: Avó AP, Daniell TJ, Neilson R, Oliveira S, Branco J and Adão H (2017) DNA Barcoding and Morphological Identification of Benthic Nematodes Assemblages of Estuarine Intertidal Sediments: Advances in Molecular Tools for Biodiversity Assessment. Front. Mar. Sci. 4:66. doi: 10.3389/fmars.2017.00066
Received: 21 December 2016; Accepted: 24 February 2017;
Published: 13 March 2017.
Edited by:
Christopher Kim Pham, University of the Azores, PortugalReviewed by:
Jongseong Ryu, Anyang University, South KoreaXiaoshou Liu, Ocean University of China, China
Copyright © 2017 Avó, Daniell, Neilson, Oliveira, Branco and Adão. This is an open-access article distributed under the terms of the Creative Commons Attribution License (CC BY). The use, distribution or reproduction in other forums is permitted, provided the original author(s) or licensor are credited and that the original publication in this journal is cited, in accordance with accepted academic practice. No use, distribution or reproduction is permitted which does not comply with these terms.
*Correspondence: Helena Adão, aGFkYW9AdWV2b3JhLnB0