 Rachel G. Tiller
 Jean-Luc De Kok
 Karolien Vermeiren
 Trine Thorvaldsen
- 1Department is Fisheries Technology, SINTEF Ocean, Trondheim, Norway
- 2Environmental Modelling Unit, Flemish Institute for Technological Research (VITO), Mol, Belgium
The aquaculture industry in Norway currently represents 60% (US$ 5.4 billion) of Norwegian seafood exports. Of these, farmed Atlantic Salmon (Salmo salar) represents over 80% (850,000 tons). These production levels are driven by a strong and growing demand for farmed fish, and has a stated political goal of increased growth by a factor of 5 by 2050 in Norway alone. However, growth is potentially more challenging without the public support and trust in the governance regime that regulates the industry. The theoretical framework of this paper rests on accountability theory, whereby the research team highlighted and tested the paradox between the ideal and the actual practices on a group of stakeholders representing the aquaculture industry and municipal, regional, and sector management in northern Norway relative to their interactions and need thereof—vs. the expectations of the public. The findings of a workshop were used to develop a conceptual model and test our theory on stakeholder driven future scenarios using a combination of systems thinking and fuzzy cognitive mapping. We found that stakeholders and management alike in a workshop setting valued flexibility of legislation and expert opinions highly, whereby regulatory standardization is not prioritized—in line with soft accountability. The industry acknowledged, though, that the public perception and negative media attention of the industry, in turn depended on hard accountability.
Introduction
Passing 7 billion people in 2012, the human population on earth is expected to reach 9 billion people in 2050 (Garcia and Rosenberg, 2010; United Nations, 2014), with the resultant need for increased nourishment. It is known that the natural marine fish stocks cannot provide the need for proteins of this increase. This is because their biomasses have continued to decline and that in 2011, 61.3% were fully utilized and could no longer be harvested at a biologically sustainable level (FAO, 2014). The primary method of the past several decades has therefore been to expand the aquaculture industry for all farmed species, from fresh-water prawns (Macrobranchium rosenbergii) in the global South to Atlantic salmon (Salmo salar) in Norway (Abdallah and Sumaila, 2007; Garcia and Rosenberg, 2010; van Vliet et al., 2010; Islam, 2014). In 2010–2012 numbers, aquaculture accounted for 41% of total global food fish supply. It is also the fastest-growing animal food-producing sector globally. The sector is furthermore expected to supply more than 50% of fish for human consumption by 2015, and 53% by 2022 (FAO, 2014). As such, it has the potential to contribute substantially to the global food supply (Cunningham, 2005; FAO, 2014; Lem et al., 2014). This also holds true in Norway, where the industry is the world leader in the production and export of farmed Atlantic salmon (Salmo salar), and the seafood industry is predicted to be one of the most important Norwegian industries in the future (Olafsen et al., 2012). It is also expected to expand its large contributions to the national export income. At the same time, the industry is crucial to the settlement and development of rural areas along the coast, thereby being a contributor to keeping the “lights on” in the houses in these areas (Pedersen, 2006; Ministry of Trade Industry and Fisheries, 2013). Also, the farming of Atlantic Salmon, has a potential to grow by a factor of five times its current volume by 2050 in Norway alone (Olafsen et al., 2012). Furthermore, a continued position of this industry as globally leading in production and export is defined by the Norwegian political leadership as a key objective (Ministry of Trade Industry and Fisheries, 2007).
However, the Norwegian aquaculture industry is also highly dependent on a good public reputation. It is critical that it is considered trustworthy in order to have access to future resources and regulatory/administrative conditions that support the growth and development of the sector. The public support of the Norwegian contribution to this increased food production has been a recurring topic of debate in Norway, though, and many oppose its ambitions of a five-fold growth. In fact, public perception of the industry has decreased substantially in response to the increase in production volume (Guldseth, 2010; Tiller et al., 2012). The public perception of the industry is influenced by the impact it has on both the natural environment itself, as well as on the humans consuming (or not consuming) the fish. Salmon aquaculture within a Norwegian setting is among others considered, under certain conditions (and not uncontested), as a threat to wild salmon and other species, and suffers from other environmental sustainability challenges as well, including the potential for eutrophication in areas outside the production area itself (Ford and Myers, 2008; Liu et al., 2011; Bannister et al., 2014; Taranger et al., 2015). Escape of fish from the fish farms is another challenge that has been given a lot of negative attention by media and authorities, thereby influencing the public opinion (Thorvaldsen et al., 2015). Adding to this negative publicity, some studies have also suggested the health effects of farmed salmon to be harmful to humans (Hites et al., 2004; Foran et al., 2005; Ibrahim et al., 2011). In addition to this, the trustworthiness and legitimacy of the responsible authorities have been questioned, since central politicians and administrators sometimes have dual roles as both regulators and owners in the Norwegian aquaculture industry, which the public could perceive as resulting in biased regulations (Guldseth, 2010).
In light of this, we argue that the reputation of and trust in the aquaculture industry depends on whether the public believes governmental agencies are capable of controlling the industry in a sound, rational, and unbiased manner. As such, the following article focuses on the governance issues surrounding the management of Atlantic salmon, and how this relates to the public acceptance the industry requires in order to achieve its ambitions of continued growth. This is because the trustworthiness the public assigns to the industry affects the critical framework conditions of the industry, including access to suitable and productive marine farm sites, coupled with predictable rules and regulations, allowances for innovation flexibility, and logistics that are market favorable. We use an innovative and interdisciplinary method for exploring these questions in this article. We combined stakeholders1 from industry and government in a dialogue and interaction setting, developed a conceptual model of the challenges, and ran future scenarios based on the underlying causalities. We then applied the findings to accountability theory (Tetlock, 1999), exploring soft and hard accountability in the case of ideal vs. real practices in the Norwegian management of the Atlantic salmon industry. First, we present a more detailed Background Section on the Norwegian aquaculture industry, and its development in space and time in Norway. This is followed by an introduction to our theoretical framework, followed by the methodological steps taken in the project in order to explore our research questions related to accountability. Finally, we present our results and conclusions.
Background
The Norwegian Aquaculture Industry
In the current article, the term aquaculture refers to the farming of Atlantic Salmon within the framework of the production process of placing produced smolts in sea cages for saltwater growing until the fish reaches the size that is suitable for market purposes. Accessible and available areas suitable for farming are few though. Marine locations for farms require excellent water quality and constant temperatures to ensure low mortalities and maximum profitability. This is also critical to minimize the environmental impact of the farms on the surrounding natural environment. In Norway, the marine temperature and salinity along the coast are generally stable, making these areas very suitable for cold-water fish farming. In addition, pollution and eutrophication are restricted to a few areas, and the water quality is good. All of these lay the ground work for the comparative advantage the aquaculture industry experiences relative to environmental factors (Ervik et al., 2007). A total of 276 out of 428 Norwegian municipalities (64%) border directly on the coastal waters (Statistics Norway, 2009), and as many as 80% of the Norwegian population live within <10 km of the coast line (Government.no, 2002). Coastal areas with their adjacent marine spaces are thus the home of many interest groups, ranging from environmental conservationists and the recreation sector, to catch fisheries, aquaculture and the oil and gas producing sector, wind parks, transport, indigenous rights holders, and tourism, ensuring a plenitude of competing claims to these coastal waters.
Competing claims to the use of coastal waters are nothing new though (Young et al., 2007; Douvere, 2008; Meiner, 2010; Tiller et al., 2012, 2013, 2014). Multiple users make claims to coastal areas all over the world, and use it for recreational purposes, food production, transport lanes, energy harvesting (windmills, wave energy etc.), tourism activities etc. The claimant which interests are prioritized has the benefit of public and regulatory priority in the given area where the claim is made. A traditional use of coastal areas has been the harvest of fish for food consumption, and this continues to be an important activity globally. Within the Norwegian context, when the fishing industry started to decline in the 1960s however, many jobs were lost and the coastal population began to drift away from the coastal areas, while aquaculture became the marine food producer with the highest growth over time in the same areas over the next decades. In fact, the aquaculture industry has since become very valuable for communities in terms of value added, ripple effects, and job creation along the rural areas of the Norwegian coast (Richardsen and Bull-Berg, 2016), which still is an emphasized political priority across Norwegian party lines (Regjeringen Stoltenberg II, 2005; Pedersen, 2006; Ministry of Trade Industry and Fisheries, 2014). Today, the Norwegian salmon industry is the world leader in the production and export of farmed Atlantic salmon, and seafood production is the largest industry in Norway after gas and oil. In 2014, for instance, the industry employed ~5,900 full-time equivalents (FTE) directly, and 28,590 FTE with the ripple effect jobs included. Adjusted for inflation, the aquaculture industry has furthermore seen an economic growth from approximately USD 55,000–156,000 revenue/profit per employee from the early 80's until 2012, with a record high in 2010 of USD 418,000 because of high market value for salmon that year (Tveterås and Asche, 2011; Sandberg et al., 2014; Richardsen and Bull-Berg, 2016).
However, as the industry grew both in terms of employment and value added to the GNP, political priorities and management focus relative to the industry shifted. The industry had originally been a political tool for strengthening the industrial foundations of the coastal and fjord communities in Norway. However, this ended in 1991 with the Aquaculture Law, which removed the local ownership criteria previously upheld (Hovland, 2014). This opened the door to an industrialization of the industry with vertically integrated companies controlled by a few multinational corporations whose headquarters were often far removed from the local communities where the installations were in the water (Jørgensen and Nilssen, 2011; Hovland, 2014). This led to the industry struggling to find its place among the country's many locally anchored coastal zone stakeholders, and in turn resulted in a growth in negative media attention, exponentially following the growth of the industry. The long-term exclusive use of certain marine areas demanded by the industry was also in conflict with the strong Norwegian tradition of open access rights to the coastal zone. In addition, long-term concerns about the environmental impact of fish farming including outbreaks of diseases at salmon farms, were prevalent (FAO Fisheries and Aquaculture Department, 2010, 2012). Concerns about the social and environmental impacts of the transformation of small, locally-owned fish farms into a big, multinational business have also been expressed during this time (Tiller et al., 2012, 2013).
The Atlantic Salmon Governance Regime in Norway
The governance process of what industrial or stakeholder needs are taken care of with regard to the coastal zone area plans follows a governance model of inclusion of stakeholders at all times in Norway (Tiller, 2008). This system would therefore arguably favor stakeholders with urgency in their claims in general, provided they have power and legitimacy in their claims (Tiller et al., 2015). It is a tripartite coalition system, with the national, regional, and municipal governments working in unison to develop area plans for both terrestrial and marine areas in the given municipality. The schematic in Figure 1 refers to the actual municipal area planning process, where areas, both terrestrial and marine, are divided into usage areas. These usage areas can be open access, aquaculture, pipelines, windmills, or any other usage a given stakeholder group might have for a given marine spatial area. Though all three levels of government are included in the governance system, the municipalities have the primary responsibility to develop area plans along the coastal zone. Their job is to determine the optimal marine location (“localities”) for these industries, from a socio-ecological angle/perspective. However, the regional government has the obligation to assist the municipalities in this endeavor, specifically concerning the goals and expectations of the national government, though, legally, they do not have the right to impose any specific usage to any given area. This is even the case if the plans are not in accordance with the wishes of the national government (Planportal Vestfold, 2014). However, given the complexity of facing both a planning process, as well as actual enforcement of a variety of laws governing the planned-for areas and ventures in the given locations, the demands for expertise are immense. When in addition national expectations have an effect on the planning process, the necessity of cooperation between levels of governance is evident, as well as the inclusion of both stakeholders and different sectors (Sørtrøndelag Fylkeskommune, 2010).
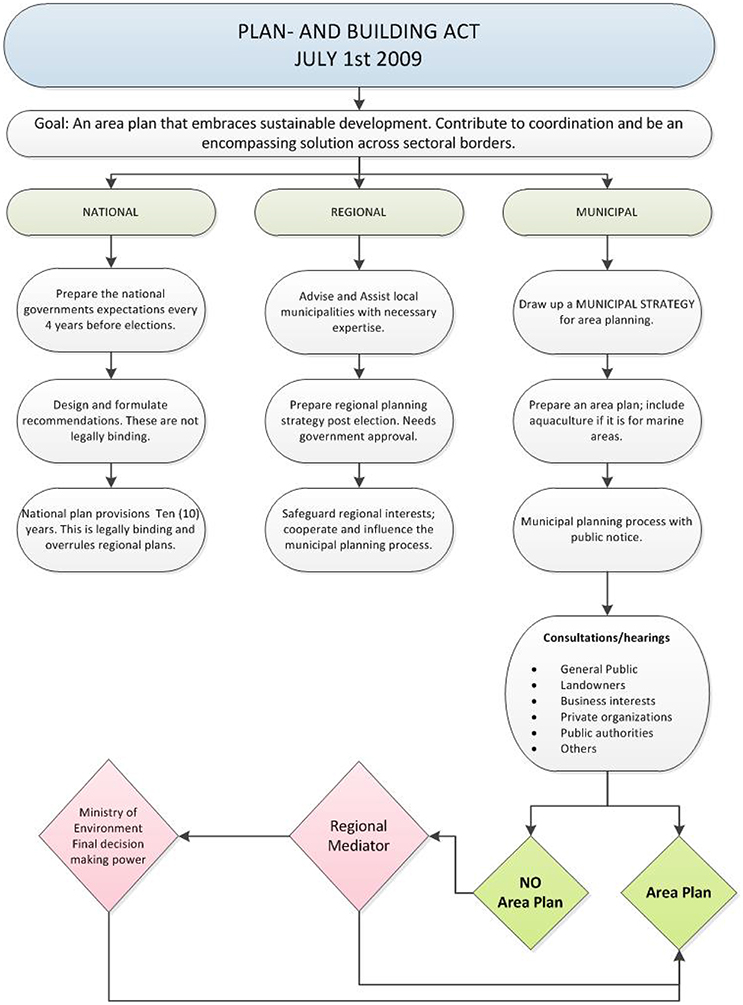
Figure 1. Plan- and Building-Act of July 1st 2009.
The role of the municipalities is only to develop the actual area plans for the marine areas within their borders. Once the application from an industry representative arrives at the regional government, a number of other government sectors determine whether the application is actually approved (see Figure 2). One of the requirements for the actual placing of aquaculture facilities in water is that other affected sectors (step 9 in Figure 2) have given their approval to the application. The application is also subject to rigorous municipal hearings with affected stakeholders (steps 5–6 in Figure 2), and special dispensations from the municipal plans are administered if the actual area plans are to be sidestepped or changed—in favor or disfavor of the applicant. There are, in other words, many instances the affected stakeholders have an opportunity to influence the government process2. As a result, the reputation of the industry is of critical importance in the likelihood of either such scenario.
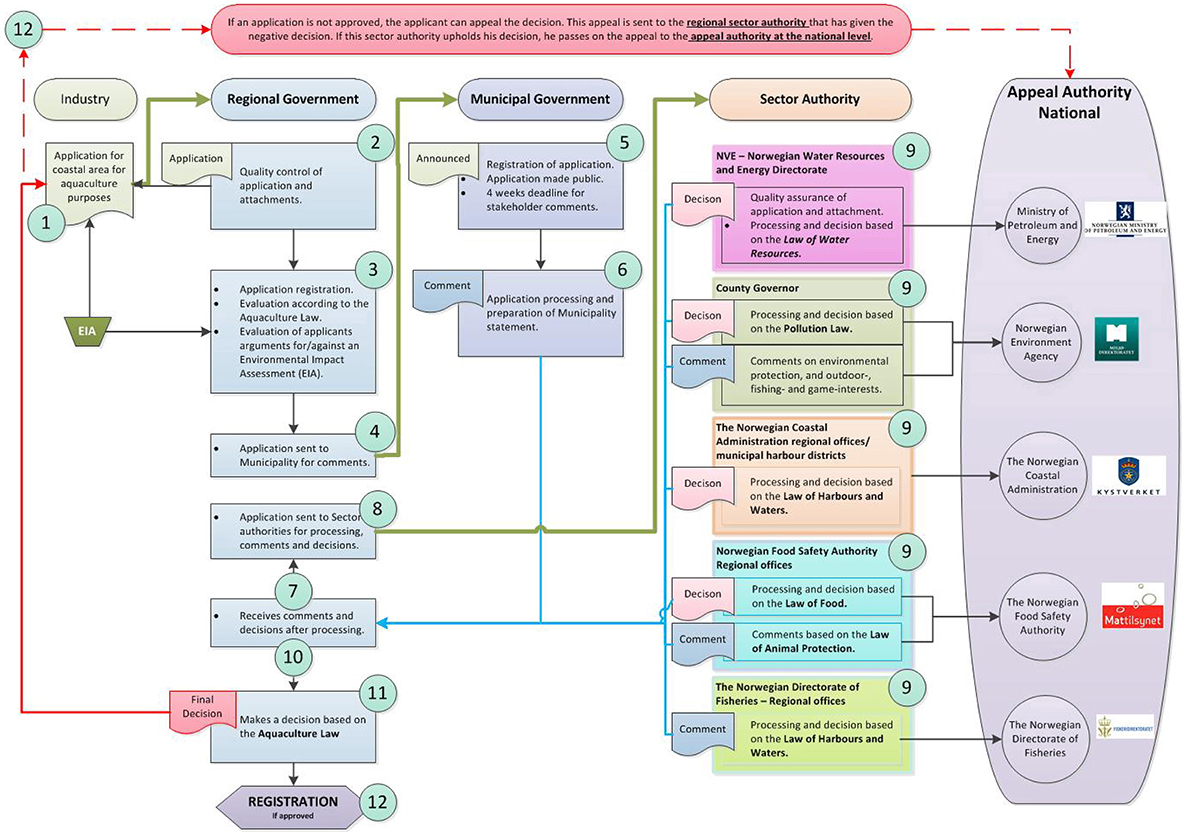
Figure 2. Application system for placing aquaculture installations in marine space in Norway. Adapted from Osmundsen and Finne (2014).
Theory
In order to assess the reputation and potential for growth of the aquaculture industry, and run scenarios of how the complex governance regime and public perceptions affect it, we turn to accountability theory, and the relationship between social actors and the governance system (Tetlock, 1999; Frink and Klimoski, 2004; Bergsteiner, 2011). The key vehicle of public trust in governance is transparency through regimes of accountability, whereby we have “…an actor or agent in a social context who potentially is subject to observation and evaluation by some audience(s), including one's self” (Frink and Klimoski, 2004). The behavior of this given actor, in this case the Atlantic Salmon aquaculture industry in Norway, is thus subject to standards and expectations in this framework. Failure to comply with these expectations will have negative implications for the agent, which acts as a controlling mechanism, ensuring the compliance to regulations. This form for accountability is at the core of all social systems and for all issues whereby an actor performs. Trust in the governance system and norm internalizations are naturally also critical elements of a well-functioning accountability scheme in a given setting, in that monitoring all actors or agents at all times is unrealistic.
However, compliance requires more than trust. For the purposes of governing commercial actors working in the public sphere, regulatory standardization, or applying similar criteria to all affected parties, as well as transparency in its application, is of utmost importance in order to uphold public trust, also known as extrinsic audience-approval motivation (Tetlock, 1999). In other words, the aquaculture industry values a resource (marine space) that someone else controls3. As such, the industry is in an asymmetric resource dependency with the municipal government, representing the public in the municipality in question. Because of this power relationship, the industry is motivated to comply with the accountability regime in order to gain access. The public and the municipalities may, in turn, rather than trusting the personal, professional judgment of a food authority supervisor inspecting a fish farm for instance (those assigned with the task of monitoring compliance with the accountability regime), require the imposition of standardized checklists, irrespective of differing geographical or environmental variables, in order to trust the regime. This would ideally exclude, or minimalize, the importance of that given supervisor's personal or professional judgment and thereby be perceived as being more legitimate to the public, and accountability will have been achieved (Porter, 1996; Power, 1999; Tetlock, 1999; Swift, 2001). However, with a heterogeneous industry and varying regional and local conditions, our hypothesis is that supervisors and other public authorities must also exercise expert judgment in monitoring the accountability of the salmon aquaculture incidents, which results in an intrinsic tension in the role of the public bodies between soft and hard accountability. This former, “soft” accountability is more based on lasting relationships and collegial discussions between the industry and sector supervisors, whereas the latter is framed more as a mechanical auditing tool, using scientific justifications and standardization.
Tools used in Hard Accountability, like “management by objectives,” auditing and benchmarking are used both in the public sector and to regulate private enterprises. Examples reflecting this development in the aquaculture industry are transfers of power to the supervisory authority and fragmentation where there is less contact between different aquaculture regulatory sectors (Figure 2; Aarset et al., 2005; Aarset and Jakobsen, 2009). The benefits of hard accountability rests on the ability to facilitate political debates and rebut arguments when, for instance, reports argue that some of the authorities' regulations are based on assumptions and not science or local knowledge (Osmundsen et al., 2012). This is opposed to soft accountability theory, which assumes the industry has close relations and dialogues with the authorities on many levels. We argue that though such relations can be subject to public suspicion, especially seen from the ideal of hard accountability, they are also important success factors in terms of a more competent regulation of the industry.
Methods
For the current study, we first used “Systems Thinking” (Senge, 1990; Forrester, 1994; Sterman, 2000). This method is a conceptualization process that allows the researcher to investigate a given system by eliciting information from real world stakeholders. Six stakeholders representing regional and municipal management, sector management, and the aquaculture industry attended a workshop. We developed a conceptual system model based on photos of the actual map created with the stakeholders during the workshop. We then used the freeware Vensim (2015) for developing the model. Concurrently, we analyzed the narratives from the recorded session in order to validate the model. The outcomes were translated into a semi-qualitative model based on Fuzzy Cognitive Mapping (Kosko, 1986; Kok, 2009; Gray et al., 2015) using the free online modeling software Mental Modeler (MentalModeler, 2015). The aim of the workshop and consecutive steps was to analyze and understand the system and, in the end, explore the possibilities to improve it. We achieved the latter by examining the explicit output as a holistic narrative, thereby developing a better understanding of the social group of stakeholders in question relative to the research questions.
Systems Thinking
Systems thinking (Senge, 1990) and systems dynamics (Forrester, 1994; Sterman, 2000) can be used to explore real world problems as identified by the stakeholders that inhabit the given system. The aquaculture industry's asymmetric resource dependency with the municipal government relative to its need for marine space described earlier is one such system. This process takes the form of group conceptualization or group modeling which has the aim to develop a stakeholder-driven representation of their “system.” These conceptual models are graphical visualizations of a basic construct of the system feedback structure, and rely on both qualitative and subjective interpretations of the system (Bredehoeft, 2005). In this study, the conceptual model consists of “concepts” or state variables with causalities between them, highlighting how the stakeholders perceive their system, including the feedback pathways. Feedback is important for the response of the system to different pressures or management actions and can lead to unexpected, counter-intuitive results (Sterman, 2000). The purpose of a conceptual model is to use it either as a research tool for further exploration and quantitative modeling, or as a management tool for consensus building amongst stakeholders and for exploring possible actions of given groups (Flood, 2010; BeLue et al., 2012). These conceptual models are also referred to as “concept networks” or “concepts maps” (Axelrod, 2015).
We selected the groups of stakeholders for this workshop using the snowball method (Biernacki and Waldorf, 1981) through the respective organization of the stakeholders that were targeted in the STARR project (Research Council of Norway, 2014). We used this approach because the quality of the results sampled from this group would outweigh the relative small number of informants the method usually produces. This is often the case in qualitative research studies, where large samples can at times be ineffective and do not provide the detailed and contextual information desired by the researcher. For the purposes of this workshop, the primary researcher judged 15 to be the maximum of what would provide a holistic narrative where all participants were provided ample opportunities to share their perceptions. The sample size can be as small as one or two as well, if this participant has information which is of critical value for the given sector and advances the research toward a specific goal (Sandelowski, 1995). By prior consent from all participants, we recorded the session using the Voice Memo app on an iPhone 6. The facilitator emphasized that these narratives from the workshop would be used to illuminate and ensure the correctness of the results, and would later be deleted.
During the session with the stakeholders the researchers started the group model building experience by presenting pertinent background information about the project and the project aims (Impson, 2011). Given these, the facilitator asked the stakeholders to consider a context in which they were to give their perceptions on the interaction between public bodies with regulatory/supervisory roles and the aquaculture industry, and how they considered that this could influence the public perception of the sustainability of the aquaculture industry. The system conceptualization process was initiated by presenting the participants with seven predetermined “drivers.” The research group qualitatively selected these drivers before the workshop. The facilitator explained that the drivers were variables that could have an effect on other variables, though seldom vice versa. They were also described as having multiple “states” or “settings” (e.g., if the variable is “the color of a boat” then potential states could be red/blue/green etc.). The drivers list was not exhaustive and the facilitator emphasized that the stakeholders could change the variables during the workshop. They were only to be considered vehicles to get the conversation going and encourage the stakeholders to speak on the issues. This ability to change or modify the drivers speaks of the benefits of this method, as it allows the inclusion of additional drivers through facilitating direct group input. The variables that the research group selected initially as drivers affecting the interaction between regulators and the industry were:
(1) Media;
(2) Area for aquaculture industry;
(3) Framework conditions;
(4) Research;
(5) Personal relationships;
(6) National priorities and management; and
(7) Local community.
The drivers were posted on the board with colored “sticky” notes, and the stakeholders were then encouraged to identify the causal interrelationships/connections between these variables (Figure 3) in the form of directional associations. This could for example be connections that highlighted that employment in the aquaculture sector (variable “A”) was affected by the area taken up by the Aquaculture industry (variable “B”). It could also for example be that the amount of fish that an aquaculture venture released to the market (variable “C”) directly affected the public perceptions of the industry (variable “D”). The result of this variable identification and interconnection process, which took about 2 h, was a system conceptualization or group mental model. This model represented how this particular group of workshop participants collectively viewed the causal pathways between variables at that given time, and identified by closer inspection where possible conflict points could be located.
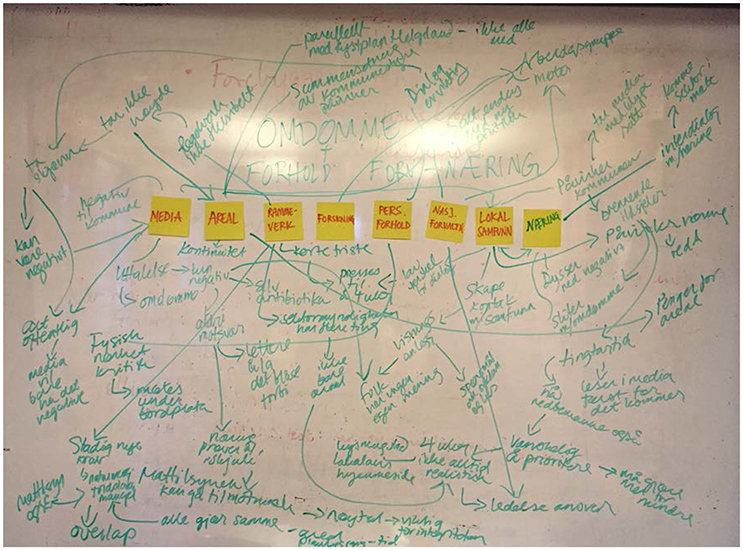
Figure 3. Sticky Note conceptual map from workshop (written in Norwegian). Notice the directional arrows throughout.
Narrative Analysis
Post-workshop, the research team used the simulation software Vensim (www.vensim.com) to visualize the results graphically in combination with analyzing the narratives from the workshop. Vensim allows the development and testing of conceptual models (causal loop diagrams) and subsequent translation into quantitative systems dynamic models (Helfrich and Schade, 2008; Lan et al., 2013). In our case, the “causes trees” and “uses trees” diagnostic tools within the program were used to visualize the degree of connectivity between variables of the group conceptualization. However, the researchers had experienced that the mechanical transfer from “board to digital” was limited in its efficacy, unless it was coupled with a narrative analysis from the recordings taken during the workshop. Narratives are popularly described as “discourses with a clear sequential order that connect events in a meaningful way for a definite audience and thus offer insights about the world and/or people's experiences of it” (Hinchman and Hinchman, 1997). After having obtained the narratives, in this case through the recordings from the workshop, there are two methods of employment. The first is to concoct one's own narrative; that of the researcher's interpretation of what was discussed during the workshop, rewritten from its original form. The second option is to analyze them as special kinds of texts, in and of themselves, using conversation analysis (Czarniawska, 2004). For the purposes of this study, the researcher used a mix/combination of the two, interpreting their narratives within the context of the workshop setting, and other times treating the text literally as it related to the output of the systems thinking analysis from the workshop (Figure 3). The most important role of the narrative in the case of this workshop was the knowledge content that could be extracted. This is in line with Elliott's account of narratives as being instrumental in that “…internal validity is…thought to be improved by the use of narrative because participants are empowered to provide more concrete and specific details about the topics discussed and to use their own vocabulary and conceptual framework to describe life experiences” (Elliott, 2005).
Fuzzy Cognitive Mapping (FCM)
Once the concept maps were constructed using Vensim, photos from the workshop exercise, as well as the narratives, we used Fuzzy Cognitive Mapping (FCM; Kosko, 1986; Kok, 2009; Kontogianni et al., 2012; Gray et al., 2015) to analyze the feedback mechanisms of the system (see Figure 4 for schematic overview). FCMs are directed, causal graphs that can be used to describe the dynamic feedback behavior of systems of varying complexity and help bridge the gap between qualitative and quantitative knowledge. Rather than predicting the time-dependent changes, FCMs can be used to analyze the key feedback mechanisms and causalities of systems by means of step-wise iteration. Compared to concept maps, FCMs take the modeling process one step further, by assigning “fuzzy” weights to the causalities in the system. These weights are representations of the strengths of the positive (reinforcing) and negative (balancing) direct impacts variables have on one another, and collected in an adjacency matrix. The weights are usually defined in a range between −1 and +1, with the number of values discerned on the level of accuracy in understanding the causalities. In this case a distinction between the values “low,” “medium,” and “high” was considered sufficient to set the weights for the causal dependencies. A variety of tools is available to develop FCMs and run scenarios. For the purposes of this study, we used MentalModeler (www.mentalmodeler.org) because of its user-friendliness, and the in-built functionality to export the model to spreadsheets. This was then used to run and compare different scenarios using a MatLab script. In Mental Modeler, one can choose between six different states, with “fuzzy” ranges from +/++/+++ to −−−/−−/−. The variables or concepts can change their value between the minimum and maximum on a pre-defined range between 0 (the minimum) and 1(the maximum). Starting from a vector of initial states of the variables one uses the adjacency matrix with the weights to calculate the states for the next iteration step. This procedure is repeated for a number of steps until an equilibrium or semi-equilibrium (periodic behavior) is reached for all variables. Depending on the result, some of the variables need to be “squashed” to the allowed range between 0 and 1 after each iteration step. In fuzzy cognitive mapping, squashing refers to the resetting of variables to their allowed range after each iteration step. Some of these variables may have obtained a value outside the standard range (usually 0–1). Different mathematical operations are available to project the results back to the allowed range. It does not affect the qualitative interpretation of the results, which is the main purpose of fuzzy cognitive maps.
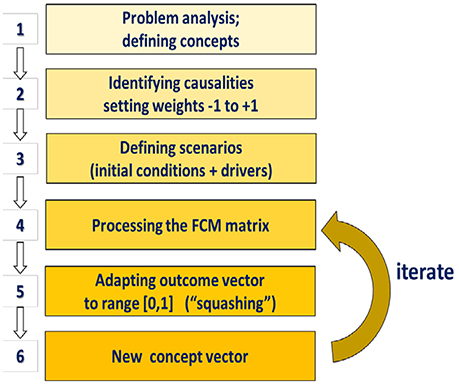
Figure 4. Steps in Fuzzy Cognitive Mapping.
The presence of so-called “transmitter” variables (Kontogianni et al., 2012) with a one-way impact on one or more other variables are those that actually drive the system. Their development over time in turn define the scenario. This means that we have to predetermine what we would like these transmitters to “do” in a given scenario. For instance, if Sea Surface Temperature (SST) is considered a transmitter, one scenario could be to explore the effect an increase from 0 to 1 would have over 50 years. Another scenario could be to see what 0.5–0 would do to the system, relative to the stakeholders perceptions. The scenarios are as such not “real” numbers, but fall within the definition of scenarios as a series of hypothetical events or potential futures, in this case in the commercial future of the aquaculture industry in light of different understandings of the efficacy of accountability (Kahn and Wiener, 1968). The original purpose of the scenarios was to draw management attention to relationships that existed between actual developments and the possible interventions that could be prepared were a given scenario to be actualized (Botterhuis et al., 2010).
The step-wise iteration of the model and analysis of the resulting changes can help understand the role of system feedback and effectiveness of management options under different scenarios. It is very useful for the researchers understanding of the dynamics of the model that the system evolves. Fuzzy cognitive mapping allows quantitative analysis of the system feedback that surpasses the conceptual nature of complex, inter-disciplinary discussions or narrative storylines as used in e.g., participatory modeling, such as those developed during our system thinking exercise alone.
The use of the word “scenario” is increasingly popularized in the social sciences, with great variability to the methods used to reach them. “Scenario” originates from the Italian language, based on the Latin word scaenarium—which is a place for erecting stages, based on the latin word scaena (Merriam-Webster, 2012). An academic definition of a scenario that covers the purposes of this paper is that Scenarios are consistent and coherent descriptions of alternative hypothetical futures that reflect different perspectives on past, present, and future developments, which can serve as a basis for action (van Notten, 2006). The founder of the Scenario method, however, was Herman Kahn (Kahn and Wiener, 1967), who described scenarios as a series of hypothetical events that describe what could potentially happen within our environment in the future. The storylines in the scenarios, the different futures the researcher envisioned, were to be lively but realistic and attempt to draw attention to causal relationships between developments and the possible interventions policy makers or businesses can prepare for in the event of an actualization of a given scenario (Botterhuis et al., 2010). The literature generally highlights that scenarios are not predictions (Schnaars, 1987; De Jouvenel, 2000; Börjeson et al., 2006; Kristóf, 2006), and that forecasts and scenarios can be proposed and explored, but neither suggestion offered, whether based on linearity or history or expert opinion is correct until it is observed at a future time.
The combination of semantic, conceptual networks with iterative computation of state changes makes the semi-qualitative modeling technique used in this study transparent in nature, adaptable to problems of arbitrary complexity and highly interactive. FCMs can be used to compare the behavior of key variables under different future scenarios as envisioned by the stakeholders in a more consistent way, or to analyze the sensitivity to changes in the system structure. Methodologically, FCMs are semi-quantitative and take a position in between conceptual models and system dynamics models. The latter are based on a mathematical representation of the causal dependencies between the variables, including time delays on non-linearities. Therefore, the scenarios produced with FCMs are to be interpreted with care because these time delays and non-linearities are not taken into consideration in FCMs.
Results
Before developing the stakeholder-driven scenarios, the stakeholders were asked to talk about the drivers and what events in their system this affected. We also wanted them to consider whether they perceived climate change to be a stressor that could have an effect on their system in the geographical region where they lived. The discussion focused initially most heavily on the media. The stakeholders discussed how negative articles and lack of response from the industry upheld a negative perception with the general public, e.g., that the industry used large amounts of antibiotics. The following is the Systems Thinking conceptual model (Figure 5) of their first session.
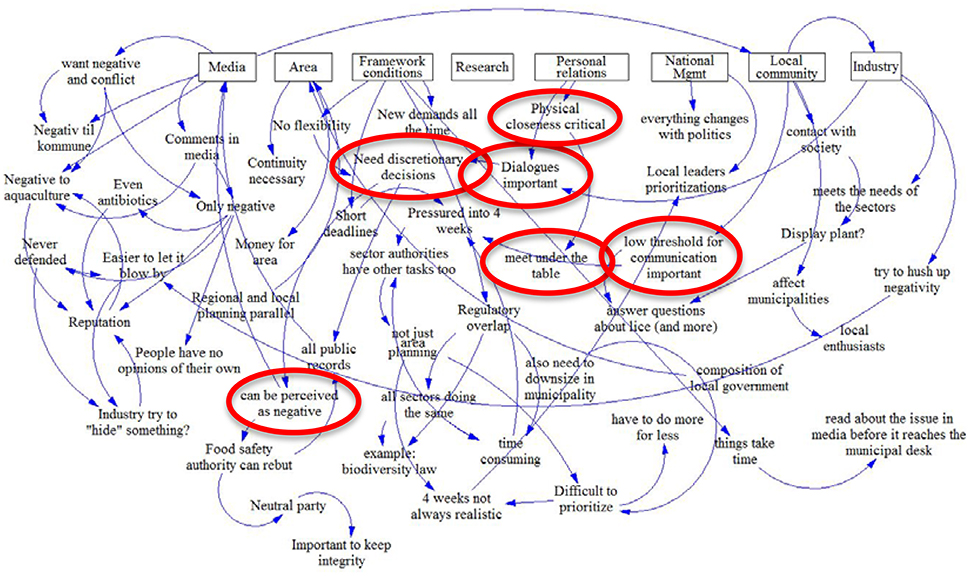
Figure 5. Digital version of the conceptual map, based on images of the board, and the narrative analysis done post-workshop.
The industry was very clear on their perception that the media focused on the negative aspects of the industry, and would not include anything that was constructive or optimistic, such as the positive effect they perceived it had for small communities. They also argued that they were partly to blame themselves, in that the aquaculture industry seldom defended itself—and when it did, it boomeranged back to them with more force. The municipality emphasized that this was not exclusive to the aquaculture industry though. They (the municipality) argued that they experienced that they themselves at all times were portrayed in the media as working excessively slow, and that they were considered a hinder for the process for the aquaculture industry. The time limits, however, they emphasized, were sometimes unrealistic and attributed to the fact that they did not only have applications for aquaculture localities on their desk. This was seconded by the representative from the Norwegian food safety authority, a sector authority with a decision power to veto aquaculture applications when the application runs counter to either the Law of food production and food safety (Lovdata.no, 2004) or the Law of animal welfare (Lovdata.no, 2010). This representative also was in agreement with comments about media concentrating on the negative cases, and explained that more often than not, when media contacted them for access to documents related to an inspection, they never asked for positive examples. Their perception was that it was therefore critical for the aquaculture industry that the Food Safety Authority was strict with the industry, in order to legitimize their own role, and in turn aid in increasing the reputation of the industry. Initially, they therefore leaned toward hard accountability as a necessity for legitimacy. However, they also emphasized that a close dialogue with the industry was also of utmost importance, which can be considered contradictory by some. This is because a close dialogue with the affected party directly negates hard accountability (where the manager is strictly unaffected by industry and has no need for their input).
All participants agreed on this latter point about the necessity of collaborations. Their experience was that the aquaculture industry developed much faster than any governance regime did, and as such, rules and regulations often lagged behind the reality of the situation in which both sector authorities and the industry were situated. The Food Safety Authority emphasized that the point of the regulations were among others to ensure that the fish was thriving and that the environment was not being compromised. Therefore, at times, judgment calls ought to be made, regardless of whether they were contrary to the regulations. Sometimes, the regulations were not adapted to the real life situation, they said. However, the representative emphasized that this sometimes resulted in negative media articles. At that point, it was critical that they, as a sector authority, would be able to account for their actions in order to regain trust.
The main perception, by the end of the session, was that close communication between sector authorities, municipalities, and regional government was important for the industry, and that they had to meet informally to discuss issues related to management—even if this publicly would be considered a weakening of the accountability of the industry. They also all emphasized the need for discretionary decisions by expert judgment, since the coastline is so diverse, and it would be difficult to have one legal framework that would fit all geographical and environmental conditions the sector authorities could encounter. Thus, despite the fact that hard accountability is what brings most legitimacy to the process, relative to public perception, the workshop participants perceived the industry to be advancing so much faster than r than regulations could keep up with, and that discretions at times were necessary in order to adapt regulations to current realities. The goal, in the end, is to uphold the regulations but these may at times need to be stretched to cover the situation at hand, as long as the ultimate goal of the rules are intact.
The narratives from this workshop along with the Vensim diagram were translated into an FCM (Figure 6) of their perceptions, in order to facilitate the development of future scenarios. There are many similarities between systems thinking and fuzzy cognitive mapping in terms of the conceptual map, and the latter builds on the former. However, the FCM is a simplification that has weights added to the causal linkages between variables (Table 1).
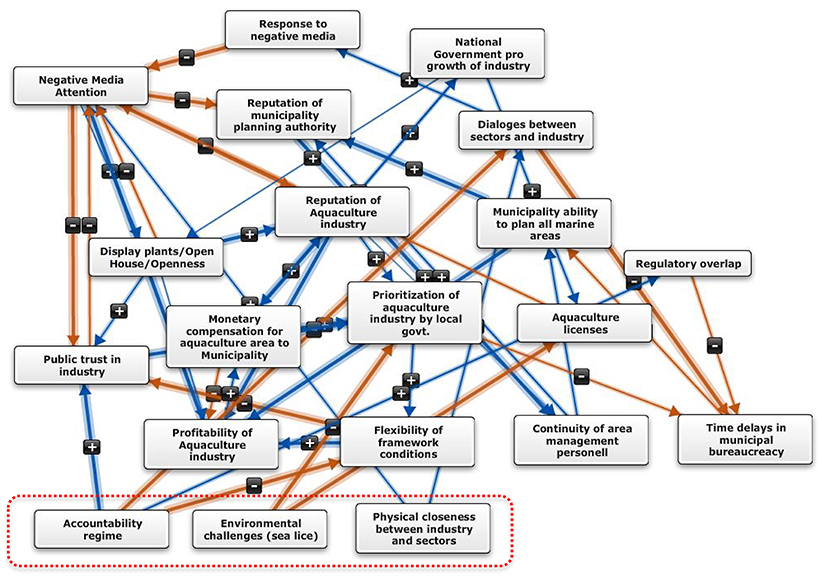
Figure 6. Results from fuzzy cognitive mapping exercise—see Table 1 for weights of variables relative to one another.
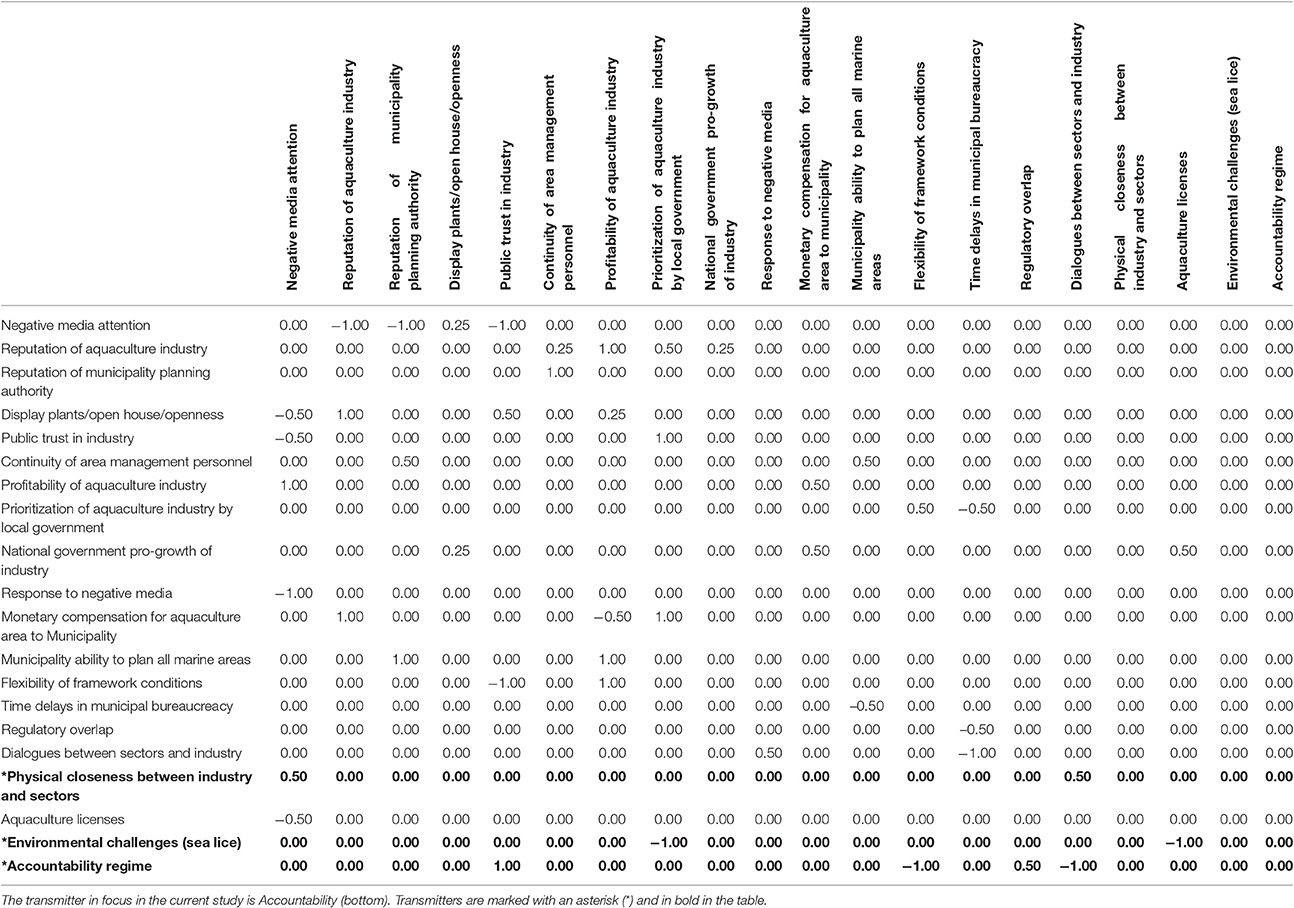
Table 1. Adjacency matrix of variables in the FCM and their effects on each other.
The scenarios that were run in MatLab centered on a selection of the transmitters driving the system, rather than running scenarios for each of them (Table 3 has transmitters marked with an asterisk symbol and in bold. The visual representation is encircling the bottom variables in Figure 6). Notice there are no arrows coming in to the transmitters in Figure 6. This means they are not affected by any other variable in the system, but can affect all variables, either directly or indirectly. The transmitters that materialized after the Vensim conceptualization and the narrative analysis are presented with explanations in Table 2.
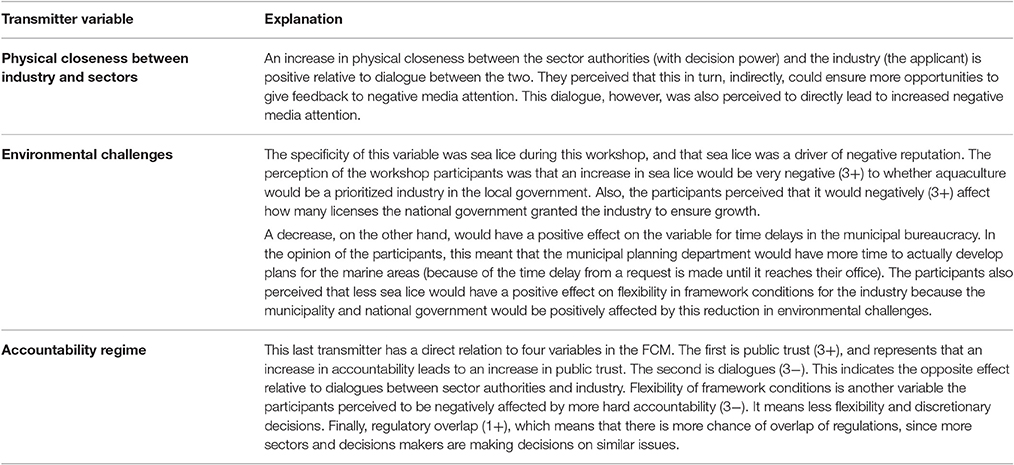
Table 2. Transmitters relative to industry reputation, and explanations of variable meaning relative to stakeholder workshop and narrative analysis.
For the purposes of this study, we chose to concentrate on the variable Accountability regime and develop scenarios for change in this variable to see how these changes would affect the different variables in the model. We assigned a pre-determined value for each of the variables based on the narratives from the workshop. We also ran a scenario keeping this at a high (hardest possible accountability regime) and exploring how high accountability would affect the perceptions the public has of the industry in light of increased environmental concerns (sea lice) when accountability is consistently considered “high.” Table 3 shows these values that run from 0 to 14.
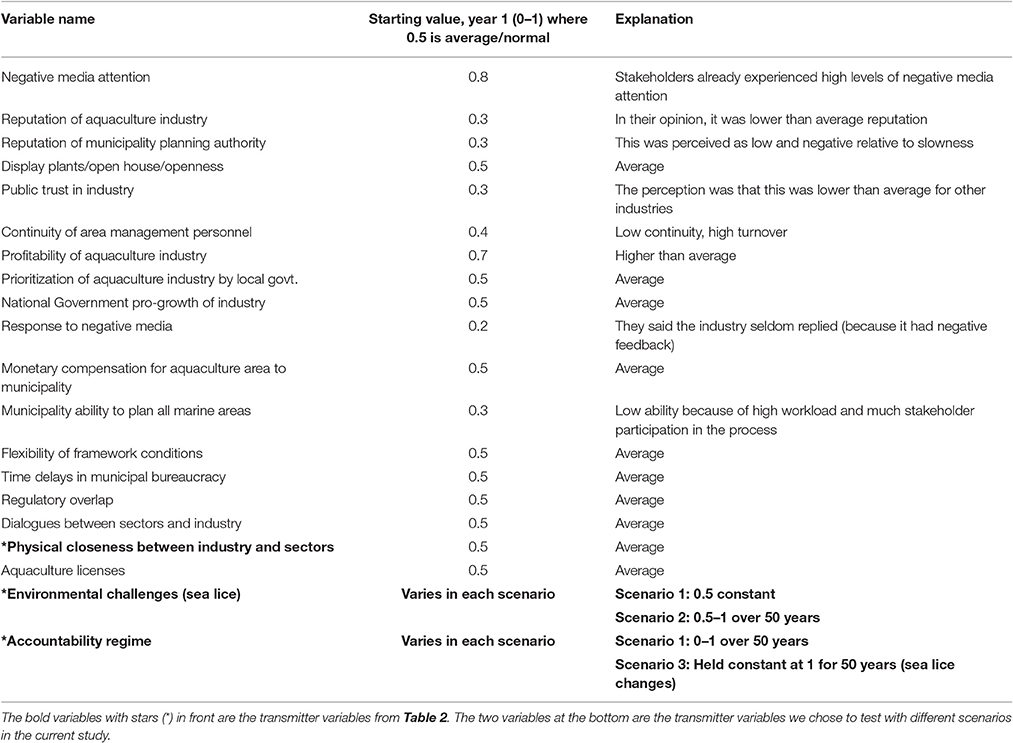
Table 3. Initial conceptual values from 0 to 1 for each variable, based on interpretations from workshop and the narratives.
The following two Figures (Figures 7,8) represent the 50 years scenario development for each scenario as illustrated by changes in the two bottom transmitters in Table 3.
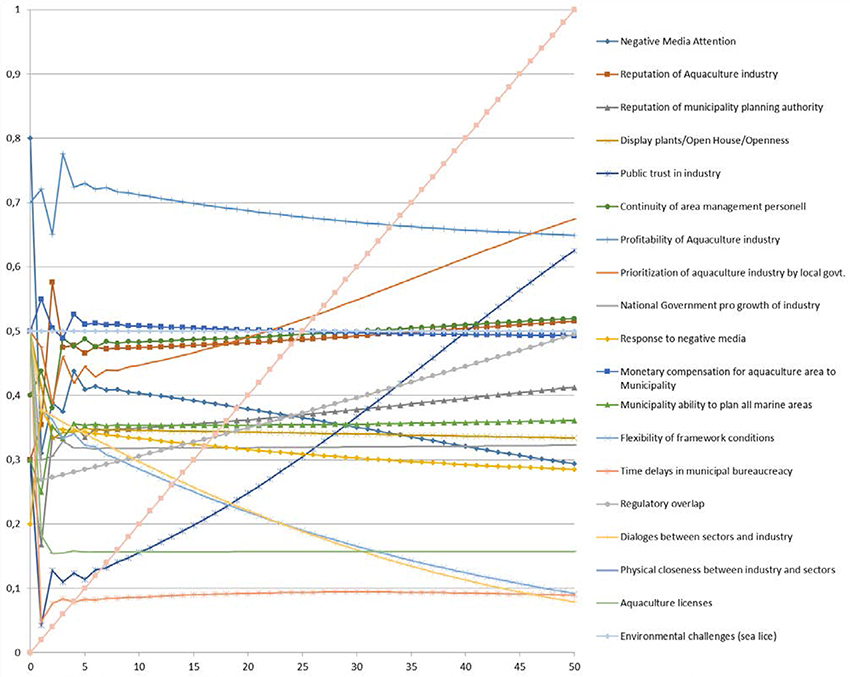
Figure 7. Scenario 1, with accountability (not shown) moving from 0 (lowest possible accountability “hardness”) to 1 (hardest possible accountability regime) over 50 years. Environmental challenges are kept at a constant 0.5 in this scenario, indicating they are “normal” the entire period, and in that case, not affecting public opinion more than “normal” for the entire period.
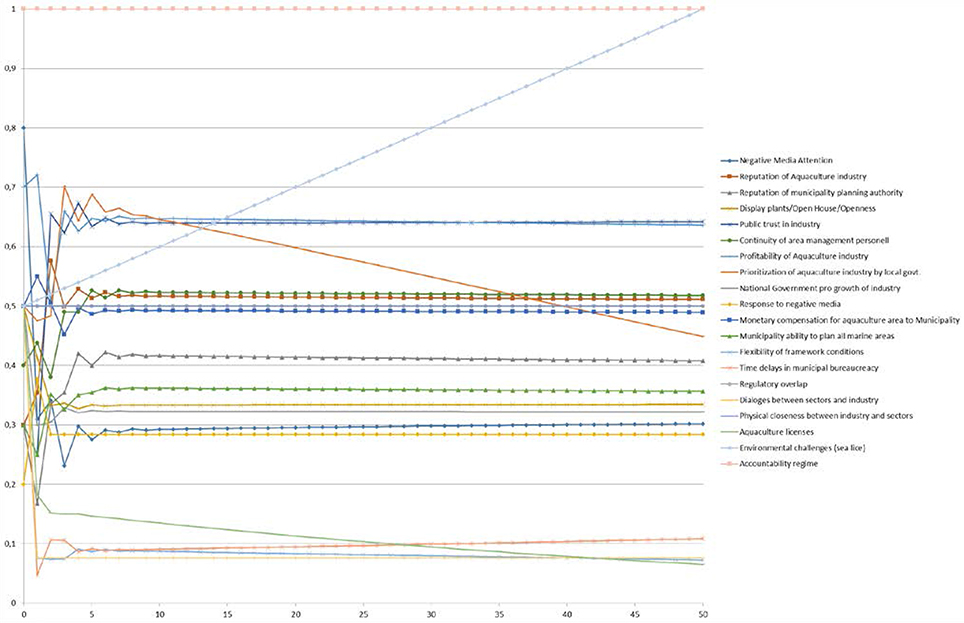
Figure 8. Scenario 2, with accountability kept at 1 (hardest) and environmental challenges increasing from 0.5 to 1 over the period.
Scenario 1 (Figure 7) shows the transmitter Accountability Regime moving from 0 to 1 over a 50 years period and how it then in turn affects the other variables. The numbers are to be interpreted qualitatively, in that they do not represent real numbers. With 0, we mean a situation in which there is the lowest possible accountability regime for the aquaculture industry in Norway, and 1 is where it is the conceptually highest possible accountability regime. We start by looking at the variables that will increase over time relative to the increase in hard accountability. We see for instance that with an increase in accountability, the public trust in the industry also increases. We can therefore see that even the perception of the industry and the sector representatives demonstrate that they too are aware that public perception is intimately linked to accountability. We also see that harder accountability will lead to less negativity over time. This also holds true for the reputation of the municipal planners. The reputation of the industry is also expected to increase (in a positive direction) with increased accountability. This variable started at a fairly low 0.3-value, and is expected over 50 years to be at just over 0.51 at that time—which is still not great, but at least it is an average value. The profitability of the industry, however, is expected to decline under this scenario. However, it is still at around 0.65 after 50 years, which is also above average profit. Negative media attention is also expected to decline rather dramatically over the time period, and in accordance with increasing accountability. However, the topics this group brought up as critical for good governance of the aquaculture industry, namely increased flexibility and dialogues between sector and industry, representing “soft” accountability, are declining equally as fast as hard accountability is increasing.
In Scenario 2 (Figure 8) we decided to play with the environmental challenges transmitters and explore what the perceptions are of the stakeholders relative to the industry if these challenges were to continue rising in the future to a maximum level after 50 years. Given that in scenario 1, hard accountability led to future scenarios in which the public trust increased in line with the hard accountability, we decided to keep accountability at the top tier for this scenario. An immediate effect that we notice under this scenario, however, is that even though accountability is high, the group perception was still that it would lead to aquaculture no longer being prioritized by the local government. They also expected that this would lead to fewer licenses being granted for aquaculture nationally. Because of the accountability being so high they also foresaw that negative media attention would stabilize fairly soon at around 0.3, and much lower than the current perception (0.8). All other variables would in fact stabilize, or only decrease at a very slow rate, despite the environmental problems actually continuing to increase steadily. This includes the reputation of the aquaculture industry—which would not decrease despite the environmental conditions (sea lice) increasing steadily. In fact, over the period of 50 years, the reputation would in fact increase from 0.3 to 0.5, something we attribute to the high accountability regime in this scenario.
Discussion and Conclusion
In the current article, we have explored the use of Systems Thinking and FCMs to develop stakeholder-driven future scenarios. These can be important instruments as policy tools within the context of the Norwegian salmon aquaculture industry. The function of developing future scenarios is in many cases (including here) to aid managers and industry in their quest to evaluate and select strategies for the future by exploring all options and being prepared for possible conflicts that may arise under certain scenarios. A methodological approach that helps achieve this outcome is to involve stakeholders in developing these future scenarios related to their system. We argue that when stakeholder-driven scenarios are used as a method of policy planning, managers get presented with several fundamentally different future perspectives to consider when planning policy (Postma and Liebl, 2005). These perspectives illustrate different probabilities, driven by stakeholder input, and are most reliable from the vantage point of that given stakeholder group. Granted, Dator's Laws of the Future (Dator, 2007) states that the future can never actually be studied, since it in fact does not yet exist. However, developing future scenarios as a tool for decision support in policymaking is about exploring the ideas about the future, or different stakeholders' images thereof, rather than the future directly. Alternative and preferred futures can, and should thus be forecasted, envisioned, invented and evaluated on an ongoing basis.
In this study, the objective was to explore whether the aquaculture industry would prefer a scenario in which the negative publicity in the Norwegian media would decline, even if it negatively affected the close dialogues the industry has in many areas today. Our goal was to test whether their perceptions of accountability, in terms of how stringent the rules are followed by the enforcing agents, would affect (hypothetically) the negative media attention associated with growth in the aquaculture industry. We did this by first holding a participatory workshop with a set of stakeholders that included both industry and other sector managers, as well as the municipality and the regional government. During this workshop, we found among others that all the stakeholders at the workshop, including the managers, already did experience that media had a negative impact on the aquaculture industry. The results also demonstrated that they were aware that the reputation of the industry in the public was critical if the industry wanted municipalities to set aside areas for aquaculture in the municipal area plans, and that negative media attention affected this. The stakeholders however still emphasized that the most logical and preferential route of future collaborations lay in more dialogues between the management sectors, regional and local government and the industry, e.g., the idea of soft accountability. They argued that this collaboration could be helpful as they could work together to solve environmental problems.
Using the conceptual map and the associated narratives from the workshop, we translated the findings into FCMs. Based on the weighing of variables we then developed future scenarios run using a MatLab script. Though the number of scenarios we could have run are innumerable, we chose to demonstrate the efficacy of the methodology by highlighting two variables for two different scenarios. We first ran Scenario 1, with the variable for accountability moving from 0 (lowest possible accountability “hardness”) to 1 (hardest possible accountability regime) over the course of 50 years. Environmental challenges (sea lice) were kept at a constant 0.5 in this scenario, indicating they are “normal” the entire period, and in that case, they would not be affecting public opinion more than “normal” for the entire period. We did this because we wanted to emphasize the effects of the Accountability variable, to see the effect of changes in hardness specifically on negative media. Afterwards, we ran Scenario 2, where we kept the accountability variable constant at 1 (hardest) and Environmental challenges increasing from 0.5 to 1 over the period. Here too, we kept the other variables at “normal” ranges, so that we could see whether or not hard accountability would matter if environmental challenges kept rising in spite of it.
When running Scenario 1, we saw that rising accountability from soft to hard over 50 years would directly affect the necessity of dialogues and flexibility desired by the aquaculture industry and the other sectors alike. This threw the dialogue variable into sharp decline alongside with negative media attention, which would also decline. This would happen simultaneously with the local government prioritizing aquaculture more relative to other industries, despite their not being in closer dialogue with the industry or allowing for more flexibility to account for the rapid changes in technological advancement of the industry. Perhaps because of this lack of dialogue and appearance of closeness between management and industry, the public trust in the industry also increases in the same period. The bottom line was that the future scenarios demonstrated that more accountability would lead to more leniency with the all-important area-planners in the municipality and more public trust—two things that were of utmost importance to the stakeholders to achieve. However, the cost of this trust and legitimacy and leniency in area planning would be more hard accountability, and that would surpass their wish for more soft accountability, such as the possibility for more informal dialogue within the governance regime.
As such, we then wanted to test if that indeed was all that was needed for the industry to grow, according to their own perceptions. We did this by keeping the accountability at an all-time high in the second scenario analysis, at 1 for the entire period of 50 years into the future (the highest possible). This would indicate a strict regime of no differences between regions. We varied the variable on Environmental challenges (sea lice specifically) from 0.5 to 1 over 50 years, reflecting more and more challenges to the environment because of the industry in this scenario—but that the regulations were standardized (accountability at 1) and as such, should still provide legitimacy in the process for the industry. Recall that in Scenario 1, the environmental challenges were kept stable at the “normal” (0.5) value. In this second scenario, the results showed that because of the hard accountability regime, the negative media attention would stabilize at fairly low levels (0.3) within a few years. This indicated that in the perceptions of the stakeholders, the hardness of accountability is critical for the reputation of the industry and lower rates of negative media attention. However, we also saw that even though hard accountability was taken care of, the willingness of the local government to prioritize the industry decreased along with environmental impact increasing. In addition, this decline never stabilized, demonstrating that for the municipal government (and the perceptions of the entire workshop), the environmental challenges were of utmost importance when deciding what to plan for in municipal marine areas. The scenario also showed that the number of licenses granted from the national government would also decline with declining environmental conditions.
The combined results of the conceptual mapping, narrative analysis, fuzzy cognitive mapping and scenario analysis were interesting in that the analysis mirrored the expectations from the theoretical vantage point, though they were nevertheless contrary to the common perception of the group. The presumption prior to this study, as well as the perceptions of the stakeholders, was that the aquaculture industry is highly dependent on a good public reputation and trustworthiness from the public in order to have growth and development in the sector. Also, if central politicians and administrators sometimes had dual roles as both regulators and owners in the Norwegian aquaculture industry, the general public expected that this could result in biased regulations (Guldseth, 2010). We expected that the trustworthiness and legitimacy of the responsible authorities would then be questioned, leading to a carrousel of negative media attention and a lack of public trust. This would be critical for the industry to have municipal goodwill to obtain access to marine space. The results of the scenario analysis showed that, irrespective of hard or soft accountability, the joint perceptions of the workshop group was that the environmental challenges of the aquaculture industry would have to stabilize or decline for hard accountability to have any effect.
This article contributes to the literature on accountability theory, as well as the expanding field of participatory modeling. The central paradigm of the latter is the integration of data based on information and knowledge from the workshops, with software engineers who can translate the information to mathematical models. The importance in this work lies in the flexibility of the methodology, and the ease with which the users can test different scenarios, and immediately see the effects variables have on each other. This is different from earlier work on scenario development, using Bayesian Belief Networks, where the connections between variables were more difficult to see immediately (Tiller et al., 2013). The findings obtained with this participatory modeling technique contribute to our theoretical framework also. Recall that the key vehicle of public trust in governance is transparency through regimes of accountability, whereby an actor, in this case the aquaculture industry in Norway, is subject to observations and evaluations by different sectors and managers (Frink and Klimoski, 2004). Theory suggests that the harder the accountability regime, the more legitimate the industry is considered, which was held true in this study based on the findings of Scenario 1. However, we also found in Scenario 2 that though this held true for the public perception, it was not the case if regulations still did not ensure a decline in the environmental challenge for which they were created in the first place.
Combining social sciences participatory workshop results with mathematical modeling could potentially be developed into a functional interface that could form part of a management toolkit. Under this scenario, the manager could choose the variables that are of most importance in a given case and test it against a number of future scenarios. A valuable next step on this path would be to bring the results from the scenario analysis back to the stakeholders for validation of the results and use their feedback to fine tune the model more closely to their perceptions.
Ethics Statement
NSD, Norwegian Centre for Research Data. The study is exempt given complete anonymity of the human subjects in accordance with the NSD (Norweigan Centre for Research Data), http://www.nsd.uib.no/nsd/english/pvo.html. Participants receive a letter informing them about the project, that it is voluntary, completely anonymous, and that they are free to withdraw from the workshop at any time. This is in accordance with NSD regulations.
Author Contributions
RT is the corresponding author, and in collaboration with TT, prepared and planned the interview guides and the process. She alone facilitated the workshop, but TT did a number of in-depth interviews related to this case but part of another article. They also collaborate on the STARR project, where this article is one of the deliverables. JD and KV worked on the systems dynamic modeling of the fuzzy cognitive mapping and wrote entire sections on this methodology in the paper.
Conflict of Interest Statement
The authors declare that the research was conducted in the absence of any commercial or financial relationships that could be construed as a potential conflict of interest.
Acknowledgments
The authors would like to acknowledge the Research Council of Norway (RCN) for their financial support of the STARR (Sustainable aquaculture—regulation and reputation) project (grant # 234139). Financial aid from the European Commission (OCEAN-CERTAIN, FP7-ENV-2013-6.1-1: no.: 603773) is also gratefully acknowledged.
Footnotes
1. ^A stakeholder is, according to literature, “…any group or individual who can affect or is affected by the achievement of the organization's objectives” (Freeman, 2010).
2. ^For a detailed account of the Norwegian governance system, we refer to Tiller et al. (2015).
3. ^Open access marine areas used by the general public and governed by municipalities. The latter plan for the exclusive rights to use these public marine spaces for commercial, recreational, or environmental purposes to name a few.
4. ^The values are not “real” numbers, but rather values on a scale from 0 to 1 where zero is the lowest possible value and one is the highest possible value.
References
Aarset, B., and Jakobsen, S.-E. (2009). Political regulation and radical institutional change: the case of aquaculture in Norway. Mar. Pol. 33, 280–287. doi: 10.1016/j.marpol.2008.07.006
Aarset, B., Jakobsen, S.-E., Audun, I., and Geir Grundvåg, O. (2005). Lovverk, Teknologi og Etableringsbetingelser i Norsk Havbruk: Fase II (2005:3). Norges Handelshøyskole, Institute for Reserch in Economics and Business Administration (SNF). Available online at: http://hdl.handle.net/11250/165213
Abdallah, P. R., and Sumaila, U. R. (2007). An historical account of Brazilian public policy on fisheries subsidies. Mar. Pol. 31, 444–450. doi: 10.1016/j.marpol.2007.01.002
Axelrod, R. (2015). Structure of Decision: The Cognitive Maps of Political Elites. Princeton, NJ: Princeton University Press.
Bannister, R. J., Valdemarsen, T., Hansen, P. K., Holmer, M., and Ervik, A. (2014). Changes in benthic sediment conditions under an Atlantic salmon farm at a deep, well-flushed coastal site. Aquacult. Environ. Interact. 5, 29–47. doi: 10.3354/aei00092
BeLue, R., Carmack, C., Myers, K. R., Weinreb-Welch, L., and Lengerich, E. J. (2012). Systems thinking tools as applied to community-based participatory research: a case study. Health Educ. Behav. 39, 745–751. doi: 10.1177/1090198111430708
Bergsteiner, H. (2011). Accountability Theory Meets Accountability Practice. Bingley: Emerald Group Publishing.
Biernacki, P., and Waldorf, D. (1981). Snowball sampling: problems and techniques of chain referral sampling. Sociol. Methods Res. 10, 141–163. doi: 10.1177/004912418101000205
Börjeson, L., Höjer, M., Dreborg, K.-H., Ekvall, T., and Finnveden, G. (2006). Scenario types and techniques: towards a user's guide. Futures 38, 723–739. doi: 10.1016/j.futures.2005.12.002
Botterhuis, L., van der Duin, P., de Ruijter, P., and van Wijck, P. (2010). Monitoring the future. Building an early warning system for the Dutch Ministry of Justice. Futures 42, 454–465. doi: 10.1016/j.futures.2009.11.030
Bredehoeft, J. (2005). The conceptualization model problem—surprise. Hydrogeol. J. 13, 37–46. doi: 10.1007/s10040-004-0430-5
Cunningham, L. (2005). “Assessing the contribution of aquaculture to food security: a survey of methodologies,” in FAO Fisheries Circular No. 1010 (Rome: FAO).
Dator, J. (2007). What Futures Studies Is, and Is Not. Hawaii Research Center for Futures Studies, University of Hawaii. Available online at: http://futures.hawaii.edu/publications/futures-studies/WhatFSis1995.pdf
De Jouvenel, H. (2000). A brief methodological guide to scenario building. Technol. Forecast. Soc. Change 65, 37–48. doi: 10.1016/S0040-1625(99)00123-7
Douvere, F. (2008). The importance of marine spatial planning in advancing ecosystem-based sea use management. Mar. Pol. 32, 762–771. doi: 10.1016/j.marpol.2008.03.021
Elliott, J. (2005). Using Narrative in Social Research: Qualitative and Quantitative Approaches. London: Sage.
Ervik, A., Aure, J., and Hansen, P. (2007). “How much aquaculture can the norweigan coast tolerate?” in Aquaculture – Production of Aquatic Organisms (2000–2005): Aquaculture Research: From Cage to Consumption, eds M. Thomassen, R. Gudding, B. Norberg, and L. Jørgensen (Oslo: The Fishery and Aquaculture Research Fund (FHF)), 338, Available online at: http://www.forskningsradet.no/prognett-havbruk/Nyheter/New_book_on_the_knowledge_status_of_Norwegian_aquaculture_research/1226994286959&lang=en
FAO (2014). The State of World Fisheries and Aquaculture 2014: Opportunities and Challenges. Food and Agriculture Organization of the United Nations. Available online at: http://www.fao.org/3/a-i3720e.pdf
FAO Fisheries Aquaculture Department (2010). The State of World Fisheries and Aquaculture 2010. Rome: Food and Agriculture Organization of the United Nations.
FAO Fisheries Aquaculture Department (2012). The State of World Fisheries and Aquaculture 2012. Rome: Food and Agriculture Organization of the United Nations.
Flood, R. L. (2010). The relationship of ‘systems thinking’ to action research. Syst. Pract. Action Res. 23, 269–284. doi: 10.1007/s11213-010-9169-1
Foran, J. A., Carpenter, D. O., Hamilton, M. C., Knuth, B. A., and Schwager, S. J. (2005). Risk-based consumption advice for farmed Atlantic and wild Pacific salmon contaminated with dioxins and dioxin-like compounds. Environ. Health Perspect. 113, 552–556. doi: 10.1289/ehp.7626
Ford, J. S., and Myers, R. A. (2008). A global assessment of salmon aquaculture impacts on wild salmonids. PLoS Biol. 6:e33. doi: 10.1371/journal.pbio.0060033
Forrester, J. W. (1994). System dynamics, systems thinking, and soft OR. Syst. Dyn. Rev. 10, 245–256. doi: 10.1002/sdr.4260100211
Freeman, R. E. (2010). Strategic Management: A Stakeholder Approach, 2nd - First Published under the Pitman Publishing Imprint in 1984 Edn. New York, NY: Cambridge University Press.
Frink, D. D., and Klimoski, R. J. (2004). Advancing accountability theory and practice: introduction to the human resource management review special edition. Hum. Resour. Manag. Rev. 14, 1–17. doi: 10.1016/j.hrmr.2004.02.001
Garcia, S. M., and Rosenberg, A. A. (2010). Food security and marine capture fisheries: characteristics, trends, drivers and future perspectives. Philos. Trans. R. Soc. B Biol. Sci. 365, 2869–2880. doi: 10.1098/rstb.2010.0171
Government.no (2002). Coastal Zone Management in Norway. Government. Available online at: http://www.regjeringen.no/en/archive/Bondeviks-2nd-Government/ministry-of-the-environment/Veiledninger-og-brosjyrer/2002/t-1389_coastal_zone_management/2.html?id=232388
Gray, S. A., Gray, S., De Kok, J. L., Helfgott, A. E. R., O'Dwyer, B., Jordan, R., et al. (2015). Using fuzzy cognitive mapping as a participatory approach to analyze change, preferred states, and perceived resilience of social-ecological systems. Ecol. Soc. 20, 11. doi: 10.5751/ES-07396-200211
Guldseth, E. (2010). Salmon and Salmon Farming: Conflictual Reality Descriptions (In Norwegian: Laks og Lakseoppdrett: I Brytningen Mellom Virkelighetsbeskrivelser). Masters, Department of Sociology and Political Science, NTNU.
Helfrich, N. D., and Schade, W. (2008). “Bringing distributed software development to SD modelling with vensim,” in The 2008 International Conference of the System Dynamics Society (Athens).
Hinchman, L. P., and Hinchman, S. (1997). Memory, Identity, Community: The Idea of Narrative in the Human Sciences. Albany, NY: Suny Press.
Hites, R. A., Foran, J. A., Carpenter, D. O., Hamilton, M. C., Knuth, B. A., and Schwager, S. J. (2004). Global assessment of organic contaminants in farmed salmon. Science 303, 226–229. doi: 10.1126/science.1091447
Hovland, E. (2014). “Havbruksnæringen i krise 1989–1991,” in Bind V: Over den Leiken Ville Han rå - Norsk Havbruksnærings Historie, eds A. Haaland, B. Hersoug, E. Hovland, N. Kolle, D. Møller, and G. Nævdal (Oslo: Fagbokforlaget), 215–247.
Ibrahim, M. M., Fjære, E., Lock, E.-J., Naville, D., Amlund, H., Meugnier, E., et al. (2011). Chronic consumption of farmed salmon containing persistent organic pollutants causes insulin resistance and obesity in mice. PLoS ONE 6:e25170. doi: 10.1371/journal.pone.0025170
Impson, S. (2011). The blue food revolution. Sci. Am. 304, 54–61. doi: 10.1038/scientificamerican0211-54
Islam, M. S. (2014). Confronting the Blue Revolution: Industrial Aquaculture and Sustainability in the Global South. Toronto, ON: University of Toronto Press.
Jørgensen, L. L., and Nilssen, E. M. (2011). “The invasive history, impact and management of the red king crab Paralithodes camtschaticus off the coast of Norway,” in The Wrong Place - Alien Marine Crustaceans: Distribution, Biology and Impacts, eds B. S. Galil, P. F. Clark, and J. T. Carlton (Dordrecht: Springer Netherlands), 521–536.
Kahn, H., and Wiener, A. J. (1967). The Year 2000: A Framework for Speculation on the Next Thirty-Three Years. New York, NY: MacMillan.
Kahn, H., and Wiener, A. J. (1968). The Year 2000: A Framework for Speculation on the Next Thirty-Three Years. New York, NY: Macmillan; Hudson Institute.
Kok, K. (2009). The potential of Fuzzy Cognitive Maps for semi-quantitative scenario development, with an example from Brazil. Glob. Environ. Change 19, 122–133. doi: 10.1016/j.gloenvcha.2008.08.003
Kontogianni, A. D., Papageorgiou, E. I., and Tourkolias, C. (2012). How do you perceive environmental change? Fuzzy Cognitive Mapping informing stakeholder analysis for environmental policy making and non-market valuation. Appl. Soft Comput. 12, 3725–3735. doi: 10.1016/j.asoc.2012.05.003
Kosko, B. (1986). Fuzzy cognitive maps. Int. J. Man Mach. Stud. 24, 65–75. doi: 10.1016/S0020-7373(86)80040-2
Kristóf, T. (2006). Is it possible to make scientific forecasts in social sciences? Futures 38, 561–574. doi: 10.1016/j.futures.2005.09.004
Lan, T.-S., Lan, Y.-H., Chen, K.-L., Chen, P.-C., and Lin, W.-C. (2013). A study of developing a system dynamics model for the learning effectiveness evaluation. Math. Prob. Eng. 2013:298621. doi: 10.1155/2013/298621
Lem, A., Bjorndal, T., and Lappo, A. (2014). “Economic analysis of supply and demand for food up to 2030 – special focus on fish and fishery products,” in FAO Fisheries and Aquaculture Circular No. 1089: FIPM/C1089 (En) (Rome: Food and Agriculture Organization of the United Nation).
Liu, Y., Olaf Olaussen, J., and Skonhoft, A. (2011). Wild and farmed salmon in Norway—a review. Mar. Pol. 35, 413–418. doi: 10.1016/j.marpol.2010.11.007
Lovdata.no (2004). “Lov om matproduksjon og mattrygget mv. (matloven),” in LOV-2003-12-19-124 (Helse- og Omsorgsdepartementet). Available online at: https://goo.gl/HjbFMF
Lovdata.no (2010). “Lov om dyrevelferd,” in LOV-2009-06-19-97 (Landbruks- og matdepartementet). Available online at: https://goo.gl/Lddja2
Meiner, A. (2010). Integrated maritime policy for the European Union—consolidating coastal and marine information to support maritime spatial planning. J. Coast. Conserv. 14, 1–11. doi: 10.1007/s11852-009-0077-4
MentalModeler (2015). What is Mental Modeler? Available online at: http://www.mentalmodeler.org/
Merriam-Webster (2012). “Scenario,” in Merriam-Webster. Available online at: http://www.merriam-webster.com/dictionary/scenario
Ministry of Trade Industry Fisheries (2007). Strategy for a Competitive Norwegian Aquaculture Industry. Available online at: http://www.regjeringen.no/en/dep/nfd/documents/reports-and-plans/Plans/2007/strategy-for-a-competitive-norwegian-aqu.html?id=478970
Ministry of Trade Industry Fisheries (2013). Facts about Fisheries and Aquaculture 2013. Available online at: http://www.regjeringen.no/en/dep/nfd/documents/Handbooks-and-brochures/2013/facts-about-fisheries-and-aquaculture-20.html?id=733532
Ministry of Trade Industry Fisheries (2014). Meld. St. 16 (2014-2015) Forutsigbar og Miljømessig Bærekraftig Vekst i Norsk Lakse- og Ørretoppdrett. Det Kongelige Nærings- og Fiskeridepartement. Available online at: https://www.regjeringen.no/nb/dokumenter/meld.-st.-16-2014-2015/id2401865/?docId=STM201420150016000DDDEPIS&ch=1&q=laks%20distrikt&redir=true&ref=search&term=laks%20distrikt:Regjeringen.no
Olafsen, T., Winther, U., Olsen, Y., and Skjermo, J. (2012). Value Creation Based on Productive Oceans in 2050 The Royal Norwegian Society of Sciences and Letters (DKNVS). Norwegian Academy of Technological Sciences (NTVA).
Osmundsen, T. C., and Finne, H. (2014). Modell for Samhandling og Forvaltning i Regional Marin Sektor – en veileder (Engl: Model for Cooperation and Management in Regional Marine Sectors – a Guideline). NTNU Samfunnsforskning AS. Available online at: http://www.fornymar.no/Gjennomforing/Documents/Fornymar_Rapport_15.pdf
Osmundsen, T., Størkersen, K., and Fenstad, J. (2012). “I storm og stille – havbruksbedriften som næringsaktør og politisk aktivist i norsk kystsoneforvaltning,” in Kampen om Plass på Kysten: Interesser og Utviklingstrekk i Kystsoneplanleggingen, eds B. Hersoug and J. P. Johnsen (Oslo: Universitetsforlaget), 224.
Pedersen, H. (2006). Hva Må vi Gjøre for å Sikre Lys i Husan? “What Do We Have to Do to Ensure That Homes Have Lights On?”. Minister of Fisheries and Coastal Affairs; Ministry of Fisheries and Coastal Affairs. Available online at: http://www.regjeringen.no/en/dep/fkd/Whats-new/Speeches-and-articles/minister/helga_pedersen/2006/hva-ma-vi-gjore-for-a-sikre-lys-i-husan.html?id=113908
Planportal Vestfold (2014). Regionale Myndigheters Rolle. Tønsberg: Vestfold Fylkeskommune. Available online at: https://www.vfk.no/Planportalen/Samhandling/Rollefordelingen/Regionale-myndigheters-rolle/
Porter, T. M. (1996). Trust in Numbers: The Pursuit of Objectivity in Science and Public Life. Princeton, NJ: Princeton University Press.
Postma, T. J. B. M., and Liebl, F. (2005). How to improve scenario analysis as a strategic management tool? Technol. Forecast. Soc. Change 72, 161–173. doi: 10.1016/S0040-1625(03)00152-5
Regjeringen Stoltenberg II (2005). Plattform for Regjeringssamarbeidet Mellom Arbeiderpartiet, Sosialistisk Venstreparti og Senterpartiet 2005-09. Available online at: http://www.regjeringen.no/upload/kilde/smk/rap/2005/0001/ddd/pdfv/260512-regjeringsplatform.pdf (Accessed March 12).
Research Council of Norway (2014). Sustainable Aquaculture - Regulation and Reputation. HAVBRUK2 - Stort Program for Havbruksfors.
Richardsen, R., and Bull-Berg, H. (2016). Nasjonal Betydning av Sjømatnæringen - En Verdiskapningsanalyse Med Data Fra 2014 (In English: National Importance of the Seafood Industry - A Value Added Analysis with Data From 2014). A 27705. Trondheim: SINTEF Fisheries and Aquaculture.
Sandberg, M. G., Henriksen, K., Aspaas, S., Bull-Berg, H., and Johansen, U. (2014). “Value creation and employment in the Norwegian seafood industry in 2012 - a multiplier effect analysis (in Norwegian),” in Value Creation and Employment in the Norwegian Seafood Industry: Multiplier Effect Analysis (Trondheim: SINTEF Fisheries and Aquaculture, SINTEF Technology and Society).
Sandelowski, M. (1995). Sample size in qualitative research. Res. Nurs. Health 18, 179–183. doi: 10.1002/nur.4770180211
Schnaars, S. P. (1987). How to develop and use scenarios. Long Range Plann. 20, 105–114. doi: 10.1016/0024-6301(87)90038-0
Senge, P. M. (1990). The Fifth Discipline: The Art and Practice of the Learning Organization. New York, NY: Doubleday/Currency.
Sørtrøndelag Fylkeskommune (2010). Kystsoneplan. Available online at: https://www.stfk.no/no/Tjenester/Plan_klima_og_Miljo/Kystsoneplan/
Statistics Norway (2009). Construction in the Coastal Zone. Available online at: https://www.ssb.no/statistikkbanken/selectvarval/define.asp?SubjectCode=01&ProductId=01&MainTable=Rd1405Aa&contents=Kystlinje1&PLanguage=1&Qid=0&nvl=True&mt=1&pm=&SessID=3647404&FokusertBoks=&gruppe1=KommNyeste&gruppe2=Hele&gruppe3=Hele&aggreg1=NO&VS1=Kommun&VS2=Kystlinjetype&VS3=&CMSSubjectArea=natur-og-miljo&KortNavnWeb=strandsone&StatVariant=&Tabstrip=INFO&checked=true
Sterman, J. D. (2000). Business Dynamics: Systems Thinking and Modeling for a Complex World, Vol. 19. Boston: Irwin/McGraw-Hill Boston.
Swift, T. (2001). Trust, reputation and corporate accountability to stakeholders. Busin. Ethics 10, 16–26. doi: 10.1111/1467-8608.00208
Taranger, G. L., Karlsen, Ø., Bannister, R. J., Glover, K. A., Husa, V., Karlsbakk, E., et al. (2015). Risk assessment of the environmental impact of Norwegian Atlantic salmon farming. ICES J. Mar. Sci. 72, 997–1021. doi: 10.1093/icesjms/fsu132
Tetlock, P. E. (1999). “Accountability theory: mixing properties of human agents with properties of social systems,” in Shared Cognition in Organizations: The Management of Knowledge, eds L. L. Thompson, J. M. Levine, and D. M. Messick (Mahwah, NJ: Lawrence Erlbaum Associates Publishers), 117–137.
Thorvaldsen, T., Holmen, I. M., and Moe, H. K. (2015). The escape of fish from Norwegian fish farms: causes, risks and the influence of organisational aspects. Mar. Pol. 55, 33–38. doi: 10.1016/j.marpol.2015.01.008
Tiller, R. G. (2008). The Norwegian system and the distribution of claims to redfeed. Mar. Pol. 32, 928–940. doi: 10.1016/j.marpol.2008.01.008
Tiller, R. G., Svalestuen, Y., Öztürk, P., and Tidemann, A. (2015). Simulating stakeholder behavior in a marine setting: Integrated coastal zone planning and the influential power of selected stakeholders in Frøya, Norway. Front. Mar. Sci. 2:90. doi: 10.3389/fmars.2015.00090
Tiller, R., Brekken, T., and Bailey, J. (2012). Norwegian aquaculture expansion and Integrated Coastal Zone Management (ICZM): simmering conflicts and competing claims. Mar. Pol. 36, 1086–1095. doi: 10.1016/j.marpol.2012.02.023
Tiller, R., Gentry, R., and Richards, R. (2013). Stakeholder driven future scenarios as an element of interdisciplinary management tools; the case of future offshore aquaculture development and the potential effects on fishermen in Santa Barbara, California. Ocean Coast. Manag. 73, 127–135. doi: 10.1016/j.ocecoaman.2012.12.011
Tiller, R. G., Richards, R., Salgado, H., Strand, H., Moe, E., and Ellis, J. (2014). Assessing stakeholder adaptive capacity to salmon aquaculture in Norway. Consilience 11, 62–96. doi: 10.7916/D8697371
Tveterås, R., and Asche, F. (2011). “En kunnskapsbasert fiskeri- og havbruksnæring,” in Et Kunnskapsbasert Norge (Ministry of Trade, Industry and Fisheries). Available online at: http://www.regjeringen.no/upload/FKD/Vedlegg/Rapporter/2011/EKN_Rapport_Sjomatnaringen.pdf
United Nations (2014). Concise Report on the World Population Situation in 2014. Department of Economic and Social Affairs Population Division. Available online at: http://www.un.org/en/development/desa/population/publications/pdf/trends/Concise%20Report%20on%20the%20World%20Population%20Situation%202014/en.pdf
van Notten, P. (2006). “Scenario development: a typology of approaches,” in Think Scenarios, Rethink Education (Paris: OECD Publishing), 69–92. doi: 10.1787/9789264023642-6-en
van Vliet, M., Kok, K., and Veldkamp, T. (2010). Linking stakeholders and modellers in scenario studies: the use of Fuzzy Cognitive Maps as a communication and learning tool. Futures 42, 1–14. doi: 10.1016/j.futures.2009.08.005
Vensim (2015). Vensim Software. Available online at: http://vensim.com/vensim-software; http://www.mentalmodeler.org/
Keywords: aquaculture, Atlantic salmon, public perception, accountability, fuzzy cognitive mapping, scenario development, stakeholder
Citation: Tiller RG, De Kok J-L, Vermeiren K and Thorvaldsen T (2017) Accountability as a Governance Paradox in the Norwegian Salmon Aquaculture Industry. Front. Mar. Sci. 4:71. doi: 10.3389/fmars.2017.00071
Received: 26 May 2016; Accepted: 28 February 2017;
Published: 28 March 2017.
Edited by:
Marty Riche, Florida Atlantic University, USAReviewed by:
Valeria Mamouridis, Institut de Ciències del Mar (CSIC), SpainAnne Marie G. O'Hagan, University College Cork, Ireland
Copyright © 2017 Tiller, De Kok, Vermeiren and Thorvaldsen. This is an open-access article distributed under the terms of the Creative Commons Attribution License (CC BY). The use, distribution or reproduction in other forums is permitted, provided the original author(s) or licensor are credited and that the original publication in this journal is cited, in accordance with accepted academic practice. No use, distribution or reproduction is permitted which does not comply with these terms.
*Correspondence: Rachel G. Tiller, cmFjaGVsLnRpbGxlckBzaW50ZWYubm8=