 Tanya Churilova1*
 Vyacheslav Suslin2
 Olga Krivenko1
 Tatiana Efimova1Nataliia Moiseeva1Vladimir Mukhanov1Liliya Smirnova1
- 1A.O. Kovalevsky Institute of Marine Biological Research, Sevastopol, Russia
- 2Department of Ocean Dynamics, Marine Hydrophysical Institute, Sevastopol, Russia
Standard NASA ocean color algorithm OC4 was developed on the basis of ocean optical data and while appropriate for Case 1 oceanic waters could not be adequately applied for the Black Sea waters due to its different bio-optical properties. OC4 algorithm is shown to overestimate chlorophyll concentration (Chl-a) in summer and underestimate Chl-a during early spring phytoplankton blooms in the Black Sea. For correct conversion of satellite data to Chl-a, primary production and other indicators regional algorithms should be developed taking into account bio-optical properties of the Black Sea waters. Light absorption by phytoplankton pigments– aph(λ) have been measured in open sea and shelf Black Sea waters in different seasons since 1998. It was shown that the first optical depth was located within the upper mixed layer (UML) for most of the year with the exception of the spring when seasonal stratification was developing. As a result spectral features of water leaving radiance were determined by optical properties of the UML. Significant seasonal differences in Chl-a specific light absorption coefficients of phytoplankton within UML have been revealed. These differences were caused by adaptive changes of composition and intracellular pigment concentration due to variable environment conditions–mainly light intensity. Empirical relationships between aph(λ) and Chl-a were derived by least squares fitting to power functions for different seasons. Incorporation of these results will refine the regional ocean color models and provide improved and seasonally adjusted estimates of chlorophyll a concentration, downwelling radiance and primary production in the Black Sea based on satellite data.
Introduction
Visible spectral radiometric data are used widely to assess water productivity (Saba et al., 2011) and to study effect of climate change on ocean productivity (Behrenfeld et al., 2006). Optical scanners of Sea-viewing Wide Field-of-view Sensor (SeaWiFS), MEdium Resolution Imaging Spectrometer (MERIS), Moderate Resolution Imaging Spectroradiometer aboard the Terra and Aqua satellites (MODIS-Aqua/Terra) measure water leaving radiance at several spectral bands (RRS) (Feldman and McClain, 2013). The spectral distribution of RRS is influenced by particulate scattering and absorbance of solar radiance by all in-water optically active components: phytoplankton, non-algal particles (NAP), colored dissolved organic matter (CDOM) and pure water (Kirk, 1994). Light absorption by particles (ap(λ)), phytoplankton (aph(λ)), NAP (aNAP(λ)) and CDOM (aCDOM(λ)) have been studied in different regions of the global ocean since the 80-s (Hoepffner and Sathyendranath, 1992; Bricaud et al., 1995, 1998; Cleveland, 1995; Babin et al., 2003) to develop algorithms for assessment of water productivity based on remote sensing. Inherent optical properties (IOPs) vary throughout the world ocean. Due to high variability in light absorption and scattering by optically active components, the world ocean needs to be subdivided into various provinces based on regional IOPs, and their features could be used to improve remote-sensing algorithms for each province (Hoepffner and Sathyendranath, 1992; Lutz et al., 1996; Suzuki et al., 1998). Originally the standard NASA algorithm could be applied if there was a high correlation between aph(λ) and absorption by colored dissolved and suspended organic matter (aCDM(λ)) (Morel and Prieur, 1977). Although NASA standard algorithms are continually being updated (O'Reilly et al., 2000), the latest versions (OC4 for SeaWiFS, and OC3M for MODIS-Aqua /Terra) do not provide an adequate assessment of chlorophyll a concentration (Chl-a) in the Black Sea waters (Suslin and Churilova, 2016) which belong to the Case 2 (Suslin et al., 2007). Berthon et al. (2008) underlined that important uncertainties for the retrieval of marine products like Chl-a still persisted in areas (including the Black Sea) where relatively high CDOM absorption and optically active water constituents CDOM and NAP do not co-vary in a predictable manner with Chl-a.
For correct conversion of optical scanner signals into water productivity indices regional algorithms need to be developed taking into account bio-optical properties of the Black Sea. The assessment of the Chl-a needs to derive aph(λ) from total light absorption by all optically active components and then estimate Chl-a based on relationship between aph(λ) and Chl-a. This relationship is also required for development of regional algorithms of downwelling radiance and primary production by spectral approach. Early versions of the regional bio-optical algorithms (Suslin et al., 2008; Churilova et al., 2009; Churilova and Suslin, 2010) were based on limited amount of bio-optical data available. The bio-optical properties of the Black Sea (namely aph(λ), aNAP(λ) and aCDOM(λ)) have been studied since 1995 in open and coastal waters of the Black Sea (Churilova, 2001; Churilova and Berseneva, 2004; Churilova et al., 2004; Chami et al., 2005; Berthon et al., 2008; Dmitriev et al., 2009). Variability in aph(λ) spectral distributions and coefficient values in coastal (Churilova and Berseneva, 2004; Chami et al., 2005; Dmitriev et al., 2009) and open waters (Churilova et al., 2004; Berthon et al., 2008) have been demonstrated but seasonal variability in Chl-a specific phytoplankton light absorption coefficients remains not known in details. The bio-optical data measured in the deep waters of the Black Sea from 2011 to 2015 will be examined in this study.
The aim of the current research is to analyze seasonal variability of relationship between phytoplankton light absorption coefficients and chlorophyll a concentrations in upper mixed layer (UML) of the Black Sea and derive season-specific modeling parameters.
Materials and Methods
Sampling
Bio-optical measurements were carried out during 7 cruises of RV “Professor Vodyanitsky” in different seasons during 2011–2015 in the deep-water areas (deeper 100 m isobath) of Black Sea (Table 1, Figure 1). Water samples were collected at 5–7 depths within euphotic zone with 10 liter Niskin bottles of CTD/rosette system MARK-III (Neil Brown Ocean Sensors, Inc) or SBE-911plus (Sea Bird Electronics). Sampling depths were chosen based on water transparency by Secchi disc depth (Zs), as well as temperature and salinity profiles measured by CTD system. The euphotic zone (Zeu), determined as penetration depth for 1% of photosynthetically available radiance (PAR), was calculated based on the light (I) attenuation with depth (z) (Kirk, 1994):
where Kd–light attenuation coefficient on average for both euphotic layer and for visible light waves (400–700 nm). Zeu was calculated based on the Equation (1):
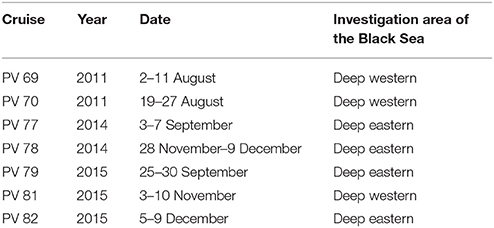
Table 1. Information about scientific cruises of RV Professor Vodyanitsky (PV) in the Black Sea.
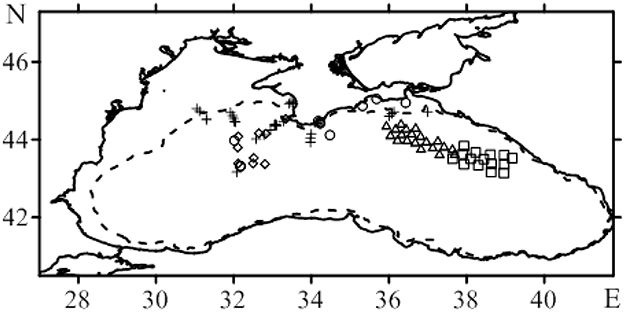
Figure 1. Map of bio-optical stations in the scientific cruises on RV Professor Vodyanitskiy (PV) in the Black Sea: o 69 (crosses), 70 (circles), 77 (square), 78 (square, triangles), 79 (triangles), 81 (rhombs), 82 (triangles). The dotted line defines the 100 m isobath.
Values of Kd were estimated based on the relationship between Kd and Zs obtained for the Black Sea (Vedernikov, 1989). Average light intensity in the UML (PARUML) was estimated in accordance with (Babin et al., 1996):
where PAR(0)–PAR at the sea surface, data from Suslin et al. (2015), Zuml–UML depth was determined using temperature difference criterion (0.5°C) and mean water temperature at 0–3 m as reference level. Optical depth (ζ) of Zuml was assessed using Kd calculated based on Zs (Vedernikov, 1989).
Pigment Analysis
For chlorophyll and phaeopigment concentration analysis 1–2 L water samples were gently vacuum filtered (<25 kPa) onto 25 mm diameter Whatman GF/F glass fiber filters. Filters were wrapped in an aluminum foil and stored in a liquid nitrogen until analysis on a laboratory. Filters were placed in 5 ml of 90% acetone in a 10 ml glass centrifuge tube, then were treated with vibration for 20 s using a vibration mixer (FALK Falc instruments, Italy), extracted at 5°C or below, for at least 10 h and then centrifuged. The above procedure was repeated using an additional 5 ml of 90% acetone for a more complete extraction of phytoplankton pigments. The second extraction of the pigments contributed 15% on average to total concentration values. The extracts were then analyzed for pigment content by spectrophotometric method (Lorenzen, 1967; Jeffrey and Humphrey, 1975) using spectrophotometer Lambda 35 (Perkin Elmer). Proportion of non-photosynthetic pigments in the total phytoplankton pigment content (NPP) was determined in accordance with relationship between environmental light condition (PAR) and NPP proposed by Babin et al. (1996).
Phytoplankton Light Absorption
Optical densities of particulate matter were determined by the filter pad technique (“wet filter technique”) (Yentsch, 1962; Mitchell and Kiefer, 1988). aph(λ) was determined by the difference between ap(λ) and aNAP(λ):
Values of aph(λ) were obtained from optical densities after correction for differential scattering (setting the mean absorption between 740 and 750 nm to zero) and for the path length amplification factor, converting decimal to natural logarithms, taking into account the volume filtered and the filter area of filtration, and subtracting aNAP(λ) (Churilova, 2001). The sample optical densities were measured from 350 to 750 nm on Perkin Elmer Lambda 35 spectrophotometer equipped with an integrating sphere. aNAP(λ) values were experimentally determined using the chemical (bleaching by NaClO solution) method (Tassan and Ferrari, 1995). The path length amplification factor (beta-correction) was estimated applying the quadratic equation described by Mitchell (1990). To get Chl-a specific light absorption coefficients of phytoplankton () the values of aph(λ) (m−1) were divided by the sum of chlorophyll a and phaeopigments concentrations (Chl-a) (mg m−3). Relationships between aph(λ) and Chl-a were derived by least squares fitting to power functions for visible spectral domain 400–700 nm with 1 nm resolution.
Phytoplankton
Identification of phytoplankton species (micro- and nano-size fractions), counting of cells and cell size measurements were performed with transmission microscope Ergaval (Carl Zeiss Jena) using Naumann chamber. Water samples (2–5 L) were concentrated by inverse filtration method using nuclepore filters with 1 μm pore diameter. The concentrated samples were fixed with a solution (4% final concentration) of 25 g paraformaldehyde dissolved in 100 ml of hot (80°C) 25% glutaraldehyde, clarified with few drops of 1 N NaOH solution. Cells were sized and its volumes were assessed using geometrical figures (sphere, ellipsoid or cylinder) corresponding to the cell shapes. Phytoplankton analysis was conducted only at selected stations in August 2011, September 2014 and December 2014, 2015.
In August 2011, September 2014 and December 2014, 2015 flow cytometric analysis was performed by flow cytometer Cytomics FC 500 (Beckman Coulter, USA) equipped with a single-phase argon laser (488 nm) (Marie et al., 1999; Schapira et al., 2010). For all detected particles phycoerythrin fluorescence emission (575 nm), and chlorophyll fluorescence emission (675 nm) were measured. The samples were fixed with formaldehyde (final concentration 2%) immediately after the sampling, then the samples were frozen in liquid nitrogen (−80°C) and stored at −20°C until analysis in the laboratory. The cytometer measurements were calibrated by the addition of a known concentration of the Fluorospheres Flow-CheckTM (Beckman Coulter). Cytometric data were analyzed using CXP software (Beckman Coulter).
Results
Chlorophyll a Concentration
Chl-a in surface layer of the deep water regions of the Black Sea were low in a summer. In the deep western part of the sea in August 2011 (Figure 1) Chl-a in the UML were in a range 0.15–0.30 mg·m−3. At this time, seasonal thermocline was well developed with maximum of temperature gradient 3.3 ± 1.1°C m−1 at the 12 ± 2.3 m depth, where optical depth (ζ) was 1.5 ± 0.42 (Table 2). In August water transparency was high. Values of Zs and Kd were 16 ± 2.1 m and 0.12 ± 0.013 m−1, correspondingly. Zeu values were 37 ± 4.0 m. Vertical Chl-a profiles were characterized by rather homogeneous Chl-a distribution within UML and deep Chl-a maximum (DCM) located near the bottom of the euphotic zone with Chl-a values 5–10 times higher than in the UML (Figure 2). In the surface layer of the deep eastern part of the Black Sea in September 2014 and 2015 (Figure 1) Chl-a values (0.21–0.35 mg·m−3) were very similar to these measured in summer. In September maximum temperature gradient (4.3 ± 1.2°C m−1) and its location (9.5 ± 2.7 m with ζ = 1.1 ± 0.40) were similar to those observed in the summer. Vertical Chl-a distribution was similar to that observed in August (Figure 2), but with less variability in Chl-a: Chl-a concentration in the DCM was 3 times higher than in the UML in comparison with 5–10 times differences in August. Water transparency in the August and September was comparable (Zs = 16 ± 1.4 m; Kd = 0.12 ± 0.0073 m−1; Zeu = 38 ± 2.6 m).
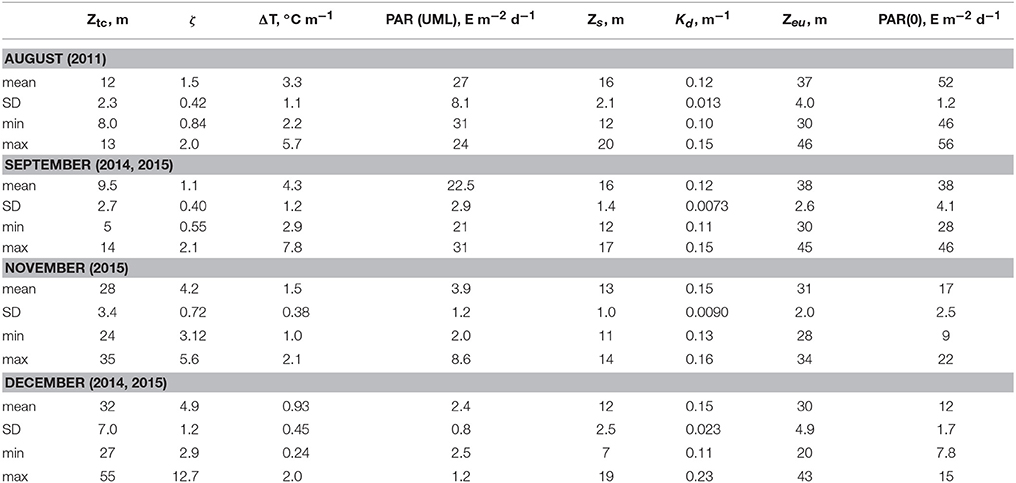
Table 2. Hydrophysical characteristics: maximum temperature gradient (ΔT) and depth (Ztc)/optical depth (ζ) of its location; Secchi disc depth visibility (Zs); euphotic zone (Zeu); diffuse attenuation coefficient for downwelling irradiance over the Zeu (Kd); photosynthetically availably radiance incident on the Black Sea surface [PAR(0)]and averaged over upper mixed layer [PAR(UML)].
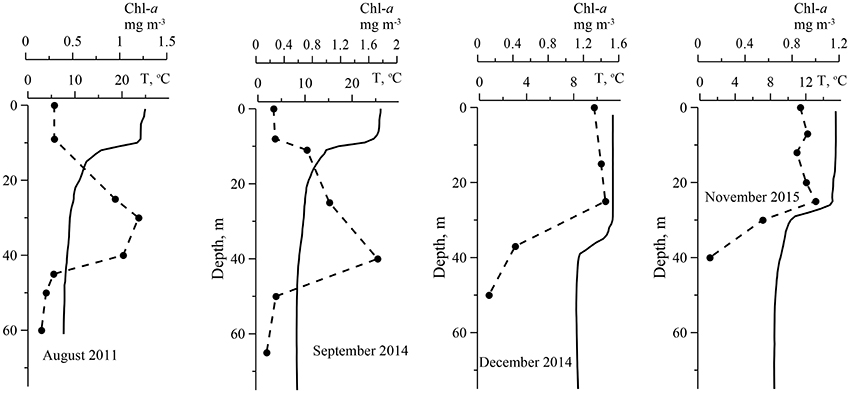
Figure 2. Examples of vertical profiles of temperature (T, line) and the sum of chlorophyll a and phaeopigments concentrations (Chl-a, circles) in the deep water of the Black Sea in different time.
In the western deep part of the Black Sea in the late autumn (November 2015) the seasonal thermocline was substantially destructed. It resulted in an enlargement of the UML (28 ± 3.4 m), which become ~3 times deeper than in the summer (Figure 2). Chl-a in the surface layer in November 2015 varied from 0.54 to 1.4 mg m−3 with less transparency (Zs = 13 ± 1.0 m; Kd = 0.15 ± 0.009 m−1) (Table 2). Maximum temperature gradient (1.5 ± 0.38°C m−1) was located at the optical depth of 4.2 ± 0.72. Consequently, Zeu (31 ± 2.0 m) was close to UML depth. Chl-a was distributed homogeneously within UML and decreased sharply in thermocline (Figure 2). Thus, vertical pigment distribution in November contrasted with that in summer, when seasonal thermocline divided euphotic zone into two quasi isolated layers with different environments. In fact, in late autumn phytoplankton was present in UML only. In December 2014 and 2015 in surface layer of eastern deep water part of the Black Sea (Figure 1) Chl-a varied from 1.0 to 2.0 mg m−3 (1.3 ± 0.25 mg m−3). UML was 32 ± 7.0 m. Vertical distribution of Chl-a was homogeneous within UML similar to Chl-a profiles observed in western waters in November 2015. In December Zs and Kd were equal to November 2015 data (12 ± 2.5 m and 0.15 ± 0.023 m−1, correspondingly). Maximum temperature gradient was 0.93 ± 0.45°C m−1 and located at optical depths of 4.9 ± 1.2 (Table 2). Consequently, in December euphotic zone (30 ± 4.9 m) occurred within UML as it was observed in November. In both December and November phytoplankton was present within UML only.
Phytoplankton
In August 2011 in UML of western deep waters of the Black Sea phytoplankton was dominated by dinoflagellates. Wet biomass of phytoplankton was 540 ± 310 mg·m−3 on average. Assuming intracellular organic carbon (C) content at 10% of wet biomass, C to Chl-a ratio (C/Chl-a) was 145 ± 76 mg mg−1. Biomass of photosynthetic picoplankton was 2.7 ± 0.46 mg·m−3 on average. The contribution of picoplankton to total phytoplankton biomass was <1%. In September 2014 phytoplankton biomass in UML was assessed at selected stations. Wet biomass was ~450 mg m−3. The phytoplankton was dominated mainly (50–70%) by dinoflagellates Gymnodinium spp (Gymnodinium fungiforme and Gymnodinium paululum). C/Chl-a ratio was ~110 mg mg−1. Photosynthetic picoplankton biomass was equal 1.7 ± 1.0 mg·m−3 on average and its contribution to total phytoplankton biomass was <1%. In December 2014 and 2015 wet phytoplankton biomass in UML varied from 190 to 430 mg m−3. In 2014 Proboscia alata dominated (by biomass) in phytoplankton community. In 2015 phytoplankton was represented mainly by large diatoms Pseudosolenia calcar-avis with cell volume 19000–83000 μ m3. C/Chl-a ratio was ~25–40 mg mg−1. In December 2014 and 2015 biomass of photosynthetic picoplankton was 11.0 ± 4.9 and 13.0 ± 4.4 mg·m−3 on average correspondingly, and picoplankton contribution to total phytoplankton biomass was ~5%.
Phytoplankton Light Absorption
Phytoplankton light absorption spectra measured in UML are presented on Figure 3. To examine the relationship between aph(λ) and Chl-a in the UML results were grouped into 2 datasets: (1) summer dataset that included results from August 2011, September 2014, 2015; (2) winter dataset with results from November 2014, December 2014 and 2015 (Table 1). September 2014, 2015 was considered part to the summer season, due to persistence of strong seasonal stratification with typical “summer” type of vertical distribution of pigments. November 2015 was considered part of winter, because of water column structure similarity to that in December 2014 and 2015. In November depths of UML and euphotic zone were close and all phytoplankton was present within UML as it was in December.
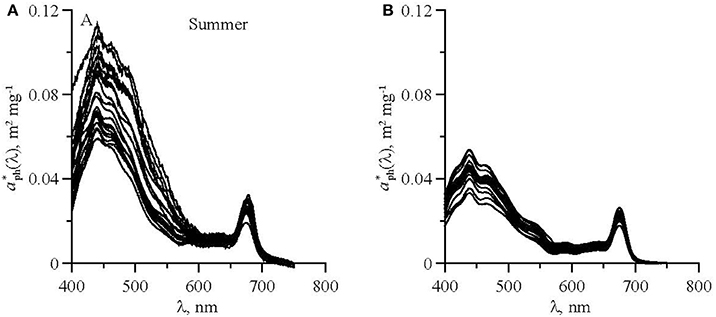
Figure 3. Chl-a specific phytoplankton light absorption coefficients in upper mixed layer of the Black Sea in summer (A) and winter (B).
In the aph(λ) spectra two main peaks were observed: in blue (near 440 nm) and red (near 678 nm) spectrum domains (Figure 3). The seasonal differences in the phytoplankton light absorption were manifested in both spectral shapes and values of chlorophyll a specific coefficients. In the summer were relatively high in the blue spectrum domain. Ratio between blue and red peaks (R) was 3.4 (± 0.61) on average in summer, which was significantly higher than in winter (2.2 ± 0.45) (Figure 3). In both winter and summer R values decreased if Chl-a increased. The variations of aph(λ) as a function of Chl-a are shown in Figure 4 at two wavelengths (~440 and 678 nm) corresponding to the blue and red peaks of the spectra. To describe the relationship between aph(λ) and Chl-a a power function was used (Figure 4):
where A(λ)–spectral coefficient, which is equal to in case when Chl-a equal to 1 mg m−3.
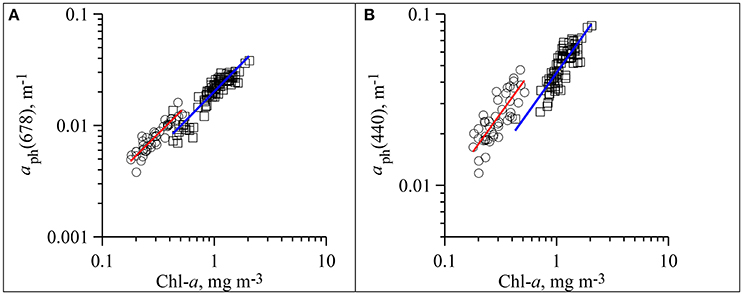
Figure 4. Dependence of phytoplankton light absorption coefficients at red (aph(678)) (A) and blue (aph(440)) (B) peaks of spectra on the sum of chlorophyll a and phaeopigments concentrations (Chl-a) in upper mixed layer of the Black Sea in summer (circles, red line of fitting) and winter (squares, blue line of fitting).
For two data sets following fit equations were obtained (Figure 4):
(1) In summer:
(2) In winter:
To infer aph(λ) spectral distribution from Chl-a relationship between these parameters needs to be determined for entire visible spectrum (400–700 nm). Based on two empirical data sets the aph(λ) vs Chl-a dependencies were parameterized using Equation (5) for summer and winter. The results of the parameterization performed from 400 to 700 nm with 1 nm spectral resolution are presented in Figure 5 and in Tables 3, 4. It is evident that values are higher in summer than those in winter (Figure 3). This seasonal difference is more pronounced in the blue spectrum domain. For summer phytoplankton the value of A(λ) coefficient at 440 nm is about twice higher than that for winter.
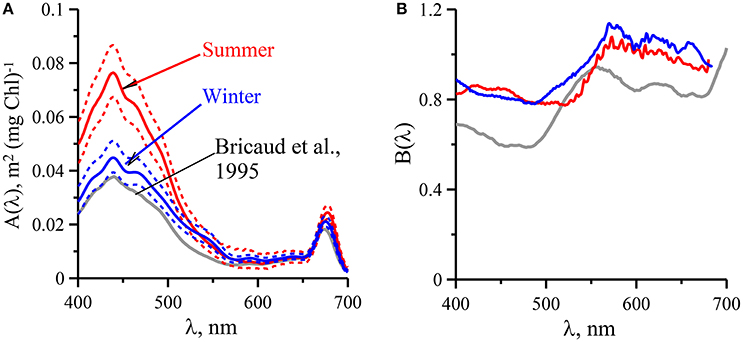
Figure 5. Spectral values of the constants A(λ) (A) and B(λ) (B) obtained when fitting the variations of phytoplankton light absorption (aph(λ)) vs. the sum of chlorophyll a and phaeopigments concentration (Chl-a) to power laws of the form : for upper mixed layer of the Black Sea in summer (red lines) and winter (blue lines) with comparison with data (gray lines) follow in Bricaud et al. (1995).
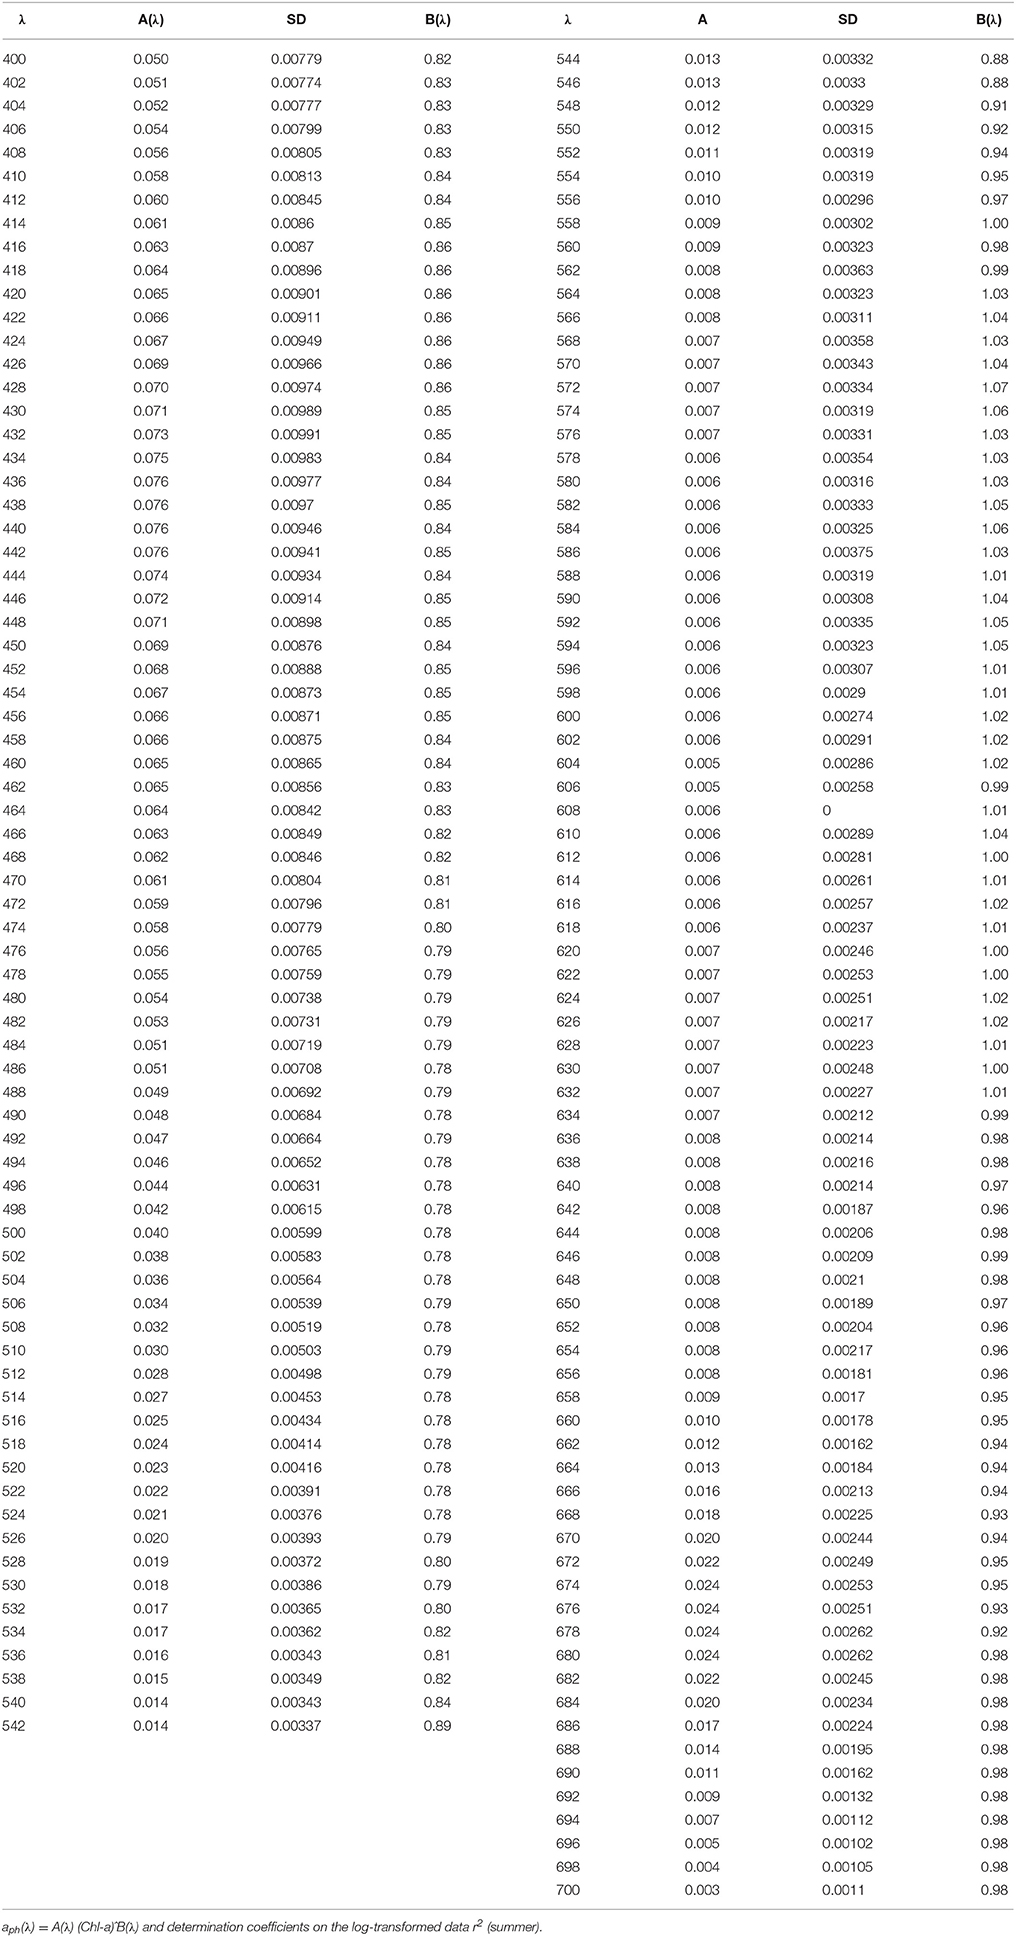
Table 3. Spectral values of the constant obtained when fitting the variations of aph(λ) vs. the (chlorophyll a + phaeopigment) concentration (Chl-a) to power laws of the form.
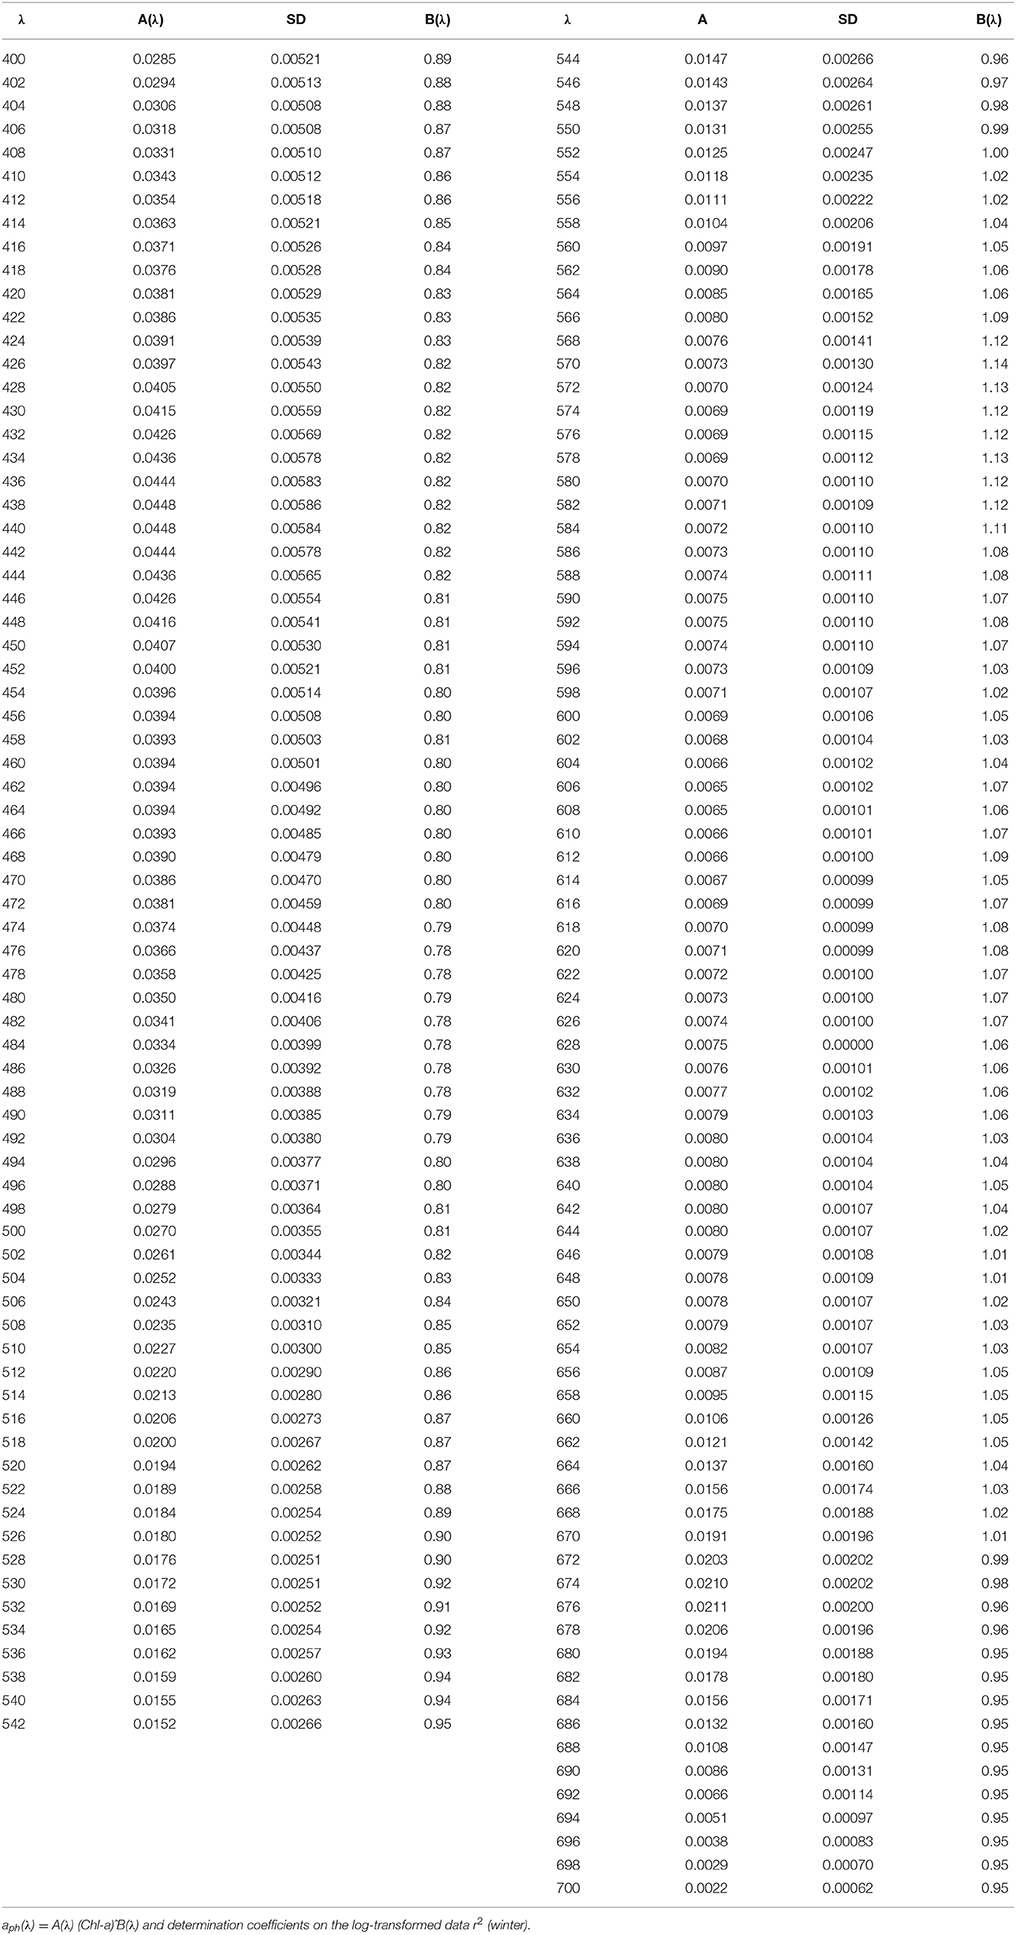
Table 4. Spectral values of the constant obtained when fitting the variations of aph(λ) vs. the (chlorophyll a + phaeopigment) concentration (Chl-a) to power laws of the form.
Photosynthetically available radiance incident on the Black Sea surface [PAR(0)] varied seasonally (Suslin et al., 2015). In August and September PAR(0) was on average 52 ± 1.2 and 38 ± 2.6 E m−2 d−1 correspondingly (Table 2). In November and December PAR(0) was 17 ± 2.5 and 12 ± 1.7 E m−2 d−1, which were about 3 times lower than those in warm months. PAR in UML depends not only on PAR(0) but also on water transparency and ratio between ZUML and Zeu. In winter, waters were less transparent than in summer. Moreover, UML was comparable with Zeu in winter while in summer ZUML was located between first and second optical depths. As results PAR in UML differed more (~10 times) between summer and winter in comparison with seasonal dynamics of PAR(0) (Table 2). PAR in UML was equal in August and September 27 ± 8.1 and 23 ± 2.9 E m−2 d−1, correspondingly (Table 2). In November and December PAR in UML was equal 3.9 ± 1.2 and 2.4 ± 0.8 E m−2 d−1, correspondingly (Table 2).
Discussion
The first optical depth which determines water leaving radiance spectral patterns (Gordon and McGlunev, 1975) detectable by remote scanners is located within the UML in the deep open waters of the Black Sea. It should be noted that Kd averaged over the euphotic zone was used in our assessment. However, domination of CDOM in total light absorption in the Black Sea results in sharply decreasing Kd values with depth. In the subsurface layer Kd values were estimated to be ~1.6 times higher than mean Kd for euphotic zone (Churilova et al., 2009). Therefore, in our assessment Zuml was underestimated by using average Kd. In fact, it gives more reasonable conclusion about location of the first optical depth within UML. Consequently, bio-optical properties of the UML in the Black Sea determine remotely sensed optical signals and could be used for development and refining of the regional models of productivity indicators.
Analysis of the link between phytoplankton light absorption coefficients and chlorophyll a concentration revealed seasonal differences in UML (Figures 3, 4 and Tables 3, 4) which were related to difference of values between summer and winter. The difference was more pronounced in the blue spectrum domain (Figure 3). In summer values of parameterization coefficient A(λ) relevant to red and blue peaks were on average 15 and 70% higher than those for winter (Figure 5), respectively. Seasonal differences in normalized (on Chl-a) phytoplankton light absorbance capacity were related to strong changes in environmental conditions in UML, mainly due to the averaged PAR within UML (Figure 6). Observed seasonal dynamics of (UML) and euphotic zone in the deep open waters of the Black Sea are consistent with intraannual changes of these parameters (Zuml and Zeu) in the Black Sea outlined earlier (Ivanov and Belokopytov, 2011; Agirbas et al., 2014).
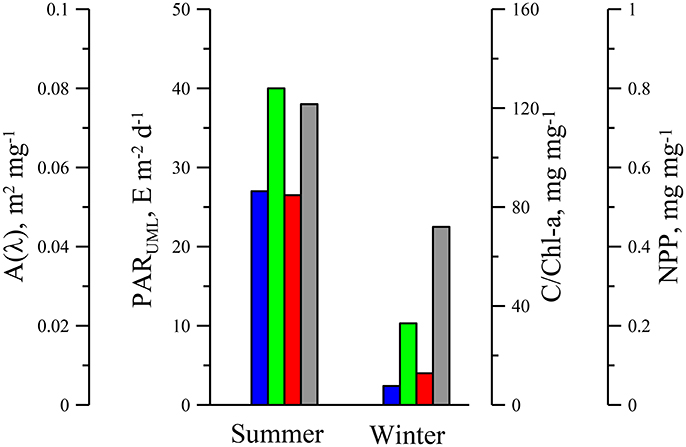
Figure 6. Photosynthetically available radiance in upper mixed layer (PARUML, blue bars), carbon to chlorophyll a ratio (C/Chl-a, green bars), share of non-photosynthetic photoprotective pigments (NPP, red bars) in total pigments and coefficient [A(440), gray bars] in phytoplankton light absorption parameterization fulfilled with power equation aph(λ) = A(λ)(Chl-a)B(λ) for upper mixed layer in the Black Sea in summer and winter.
In winter [PAR(0)] decreased but the ratio between ZUML and Zeu increased in comparison with summer. As the result in winter average light field within UML decreased in almost 10-fold in comparison with PARUML in summer. Seasonal changes of environmental conditions in UML caused ~5–7 fold variability in C/Chl-a ratio between winter and summer. Observed C/Chl-a variability agrees with a change of intracellular concentration of chlorophyll a (MacIntyre et al., 2002; Behrenfeld et al., 2005) due to physiological acclimation of algae cultures and phytoplankton to light intensity decreased in the same range as PAR varied in the UML of the Black Sea. Intracellular pigment concentration defines degree of pigment packaging, which in turn effects on (Morel and Bricaud, 1981; Bidigare et al., 1990; Hoepffner and Sathyendranath, 1991; Kirk, 1994; Fujiki and Taguchi, 2002). In the current research it was shown that and C/Chl-a were significantly less in winter than values of those parameters in summer, which were relevant to “pigment packaging” effected on at red peak (~678 nm) where light quanta are absorbed by chlorophyll a and phaeopigments only (Jeffrey et al., 1997). At shorter wavelengths (in blue spectrum domain) seasonal variation in was more pronounced than at red wavelengths (Figure 3). In the blue part of the spectrum besides chlorophyll a, other accessory pigments absorb light quanta (Bidigare et al., 1990; Jeffrey et al., 1997) which lead to “smoothing” of spectra due to accessory pigment “packaging” if Chl-a specific absorption coefficients are considered. Ratio of accessory pigment-to-Chl-a changes due to photoacclimation of algae (MacIntyre et al., 2002; Grant and Louda, 2010), which is related mainly to photoprotective (i.e., non-photosynthetic) pigments (NPP). In review of photoacclimation of different microalgae taxons it was shown that ~order increase of light intensity resulted in ~3–4 times increase of photoprotective xanthophyll to Chl-a ratio on average (Figure 9 in MacIntyre et al., 2002). Investigations of phytoplankton accessory pigments variability have demonstrated that photoprotective pigments tend to be greater in the surface low Chl-a waters at latitudes where radiance incident on the sea surface is relatively high (Stuart et al., 1998; Barlow et al., 2004; Sathyendranath et al., 2005). Variability of R (aph(440) /aph(678)) was shown to be correlated with NPP to Chl-a ratio (Lutz et al., 2003). Altogether the increase of is related to low Chl-a waters with lower intracellular concentrations of pigments, and a greater proportion of photoprotective pigments occurred in stratified, high light, nutrient-limited regions (Bricaud et al., 1995; Cleveland, 1995; Aguirre-Hernandez et al., 2004). In general these results are in a good agreement with the Black Sea observations. Although in current research pigment composition was not analyzed, but rough assessment of NPP (share of photoprotective pigments in total weight all pigments) based on dependence of NPP on light intensity (Babin et al., 1996) showed that NPP in UML was ~5 times higher in summer in comparison with NPP in winter (Figure 6).
Seasonal phytoplankton succession observed is typical for the deep-water ecosystem of the Black Sea (Georgieva, 1993; Berseneva et al., 2004; Mikaelyan et al., 2005). In general biomass of the phytoplankton consists of Bacillariaphyceae, Dinophyceae, and Prymnesiophyceae (presented mainly by coccolithophores). Two-weekly monitoring at fixed stations in the western deep-water part of the Black Sea showed a change in phytoplankton species composition within an year (Berseneva et al., 2004): in general diatoms were dominating in winter and in yearly spring “blooms,” dinoflagellates and coccolithophores were prevailing in the community in summer. Coccolithophores “bloom” in May-June.
Shift in species dominating in phytoplankton community is attributed with changes in size and shape of the cells. Cells size effects on pigment package within the cells which results in decreasing of due to self-shading of pigments within large cells (Morel and Bricaud, 1981; Sosik and Mitchell, 1994; Fujiki and Taguchi, 2002). In different ocean regions variability in the was related with change in phytoplankton species composition and cell size (Bricaud et al., 1995; Cleveland, 1995; Millan-Nunez et al., 2004). Package effect caused by cell size is detected by decreasing of (Fujiki and Taguchi, 2002) because at shorter wavelengths is affected by accessory pigments as well. Values of decreased in winter by ~15% compared with summer due to both C/Chl-a and phytoplankton variability (Figures 3, 5) although the large diatoms (Pseudosolenia calcar-avis) were dominated in phytoplankton community.
The cells of Pseudosolenia calcar-avis have cylindrical shape unlike dinoflagellates, cells of which are closer to the ellipsoid. Volume of Pseudosolenia calcar-avis cell exceeds ~2 orders of magnitude the volume of the dinoflagellates (Gymnodinium spp) cells. However, in the case of the cylindrically shaped cells the large volume is not critical for the cell's capacity to absorb light. The light absorption capacity of cylindrically shaped cells is determined by the diameter of their section (Kirk, 1976). Therefore, despite the difference in the cell volume optically significant size of cylindrical diatoms (10–30 μm) was similar to that of dinoflagellates (10–40 μm). Consequently, in this case the effect of the size (volume) of the cells on the degree of pigment packaging is not as significant as in the case of large spherical cells (Morel and Bricaud, 1981). It explains weak (~15%) seasonal difference in observed in the Black Sea (Figure 5).
Conclusions
Seasonal differences in chlorophyll-a specific phytoplankton light absorption coefficients are caused by annual dynamics in environmental conditions in the (UML) and adaptive response of algae cells/population (via variation of pigment composition and concentration in the cell) and of phytoplankton community (via shift in phytoplankton species composition with attributed changes in size and shape of cell). Consequently, parameterization of the relationship between phytoplankton light absorption coefficients and chlorophyll a concentration proceeded for different seasons (summer and winter) will allow to refine the regional algorithm of Chl-a assessment based on remote sensing (Suslin and Churilova, 2016). Because in the Black Sea light absorption by dissolved organic matter there is relatively high and not correlated with phytoplankton absorption or chlorophyll a concentration regional Chl-a algorithm requires splitting of light absorption into aph(λ) and aCDM(λ) (Suslin and Churilova, 2016) and then Chl-a is retrieved from the aph(λ) at 490 nm. Relationships between Chl-a and aph(λ) obtained for the summer and winter conditions in the Black Sea differ by coefficients A(λ) in power equation, but coefficients B(λ) are practically the same (Figure 5). Consequently, values of A(λ) coefficient define the seasonal difference in retrieval of Chl-a based on aph(λ). Values of A(λ) at 490 nm are equal 0.048 and 0.031 m2 mg−1 correspondently for summer and winter conditions in UML of the Black Sea (Tables 3, 4). For instance, using the summer relationship between Chl-a and summer aph(490) values one can get Chl-a equal to 0.2–0.3 mg m−3, but using the winter link between these parameters or link obtained for different regions of the world ocean (Bricaud et al., 1995) one gets Chl-a equal to 0.36–0.53 or to 0.34–0.55 mg m−3. Consequently, the retrieved Chl-a values become almost twice lower if one takes into account the Black Sea summer conditions and relevant relationship between aph(λ) and Chl-a. Undoubtedly accuracy of splitting of light absorption into aph(λ) and aCDM(λ) also affect the accuracy of Chl-a assessment (Suslin and Churilova, 2016).
Moreover, seasonal difference in links between aph(λ) and Chl-a could provide more correct assessment of downwelling radiance and primary production in the Black Sea using spectral approaches (Churilova et al., 2016). However, it should be noted that application of the obtained aph(λ) parametrization is limited by the rather narrow range of Chl-a, which was measured in the deep waters. The relatively narrow range of Chl-a caused the high values of B(λ) coefficients in comparison of those obtained based on numerical data measured in different regions of World Ocean with Chl-a covering the range 0.02–25 mg m−3 (Figure 5; Bricaud et al., 1995).
The parameterization obtained based on bio-optical data measured in deep waters is unlikely to be correct for coastal waters. Coastal waters may differ from deep waters in nutrient availability, transparency and turbulence. These different environmental conditions would results in change of intracellular pigment concentration and phytoplankton species composition which in turn effect on . In this regard since 2014 bio-optical properties have been investigated in the Crimean coastal waters in different seasons. These new data will be merged with summer results measured before (Churilova and Berseneva, 2004; Dmitriev et al., 2009) and then analyzed to determine the seasonality in aph(λ) parameterization.
Author Contributions
TC, idea, management and writing. VS, mathematical proceeding and interpretation data. OK, contribution to the discussion. TE, chlorophyll and absorption measurements, calculations. NM, chlorophyll and absorption measurements, calculations. VM, phytoplankton data analysis. LS, phytoplankton species identification.
Funding
The work presented in this paper was carried out in the framework of RF state task according to plan of scientific research of the AO. Kovalevsky Institute of Marine Biological Research (theme # 0828-2014-0016) and of the Marine Hydrophysical Institute (theme # 0827-2014-0011). The work was partially supported by RFBR (project 17-05-00113).
Conflict of Interest Statement
The authors declare that the research was conducted in the absence of any commercial or financial relationships that could be construed as a potential conflict of interest.
The reviewer BB and handling Editor declared their shared affiliation, and the handling Editor states that the process nevertheless met the standards of a fair and objective review.
Acknowledgments
The authors are very thankful to ESA and PML for invitation us to attend the workshop “Color and Light in the Ocean (CLEO)” held at ESRIN, Frascati, Italy on 6-8 September, 2016. The authors would like to thank the reviewers for their helpful and constructive comments that greatly contributed to improving the paper. The authors thank very much ESA for covering of the article processing charges.
References
Agirbas, E., Feyzioglu, A. M., and Kopuz, U. (2014). Seasonal changes of phytoplankton chlorophyll a, primary production and their relation in the continental shelf area of the South Eastern Black Sea. Turk. J. Fish. Aquat. Sci. 14, 713–726. doi: 10.4194/1303-2712-v14_3_14
Aguirre-Hernandez, E., Gaxiola-Castro, G., Najera-Martınez, S., Baumgartner, T., Kahru, M., and Mitchell, B. G. (2004). Phytoplankton absorption, photosynthetic parameters, and primary production off Baja California: summer and autumn 1998. Deep-Sea Res. II. 51, 799–816. doi: 10.1016/j.dsr2.2004.05.015
Babin, M., Morel, A., Claustre, H., Bricaud, A., Kolber, Z., and Falkowski, P. (1996). Nitrogen- and iraadiance- dependent variations of maximum quantum yield of carbon fixation in eutrophic, mesotrophic and oligotrophic marine systems. Deep-Sea Res. I. 43, 1241 – 1272. doi: 10.1016/0967-0637(96)00058-1
Babin, M., Stramski, D., Ferrari, G. M., Claustre, H., Bricaud, A., Obolensky, G., et al. (2003). Variations in the light absorption coefficients of phytoplankton, non-algal particles, and dissolved organic matter in coastal waters around Europe. J. Geophys. Res. 108, 3211. doi: 10.1029/2001jc000882
Barlow, R. G., Aiken, J., Moore, G. F., Holligan, P. M., and Lavender, S. (2004). Pigment adaptations in surface phytoplankton along the eastern boundary of the Atlantic Ocean. Mar. Ecol. Prog. Ser. 281, 13–26. doi: 10.3354/meps281013
Behrenfeld, M. J., Boss, E., Siegel, D. A., and Shea, D. M. (2005). Carbon-based ocean productivity and phytoplankton physiology from space. Global Biogeochem. Cycles 19:GB1006. doi: 10.1029/2004GB002299
Behrenfeld, M. J., O'Malley, R. T., Siegel, D. A., McClain, C. R., Sarmiento, J. L., Feldman, G. C., et al. (2006). Climate-driven trends in contemporary ocean productivity. Nature 444, 752–755. doi: 10.1038/nature05317
Berseneva, G., Churilova, T., and Georgieva, L. (2004). Seasonal variability in pigment concentration, taxonomic structure of phytoplankton community in western part of the Black Sea. Oceanology 44, 211–219.
Berthon, J.-F., Mélin, F., and Zibordi, G. (2008). “Ocean Color remote sensing of the optically complex european seas,” in Remote Sensing of the European Seas, eds V. Barale and M. Gade (Dordrecht: Springer Science-Business Media), 35–52.
Bidigare, R. R., Ondrusek, M. E., Morrow, J. H., and Kiefer, D. A. (1990). In vivo absorption properties of algal pigments. Ocean Opt. X. 1302, 290–302. doi: 10.1117/12.21451
Bricaud, A., Babin, M., Morel, A., and Claustre, H. (1995). Variability in the chlorophyll-specific absorption coefficients of natural phytoplankton: analysis and parameterization. J. Geophys. Res. 100, 13321–13332. doi: 10.1029/95JC00463
Bricaud, A., Morel, A., Babin, M., and K., Allali, H. (1998). Claustre Variations of light absorption by suspended particles with chlorophyll a concentration in oceanic (case 1) waters: analysis and implications for bio-optical models. J. Geophys. Res. 103, 31033–31044.
Chami, M., Shybanov, E. B., Churilova, T. Y., Khomenko, G. A., Lee, M. E. G., Martynov, O. V., et al. (2005). Optical properties of the particles in the Crimea coastal waters (Black Sea). J. Geophys. Res. 110, 1–17. doi: 10.1029/2005JC003008
Churilova, T. (2001). Light absorption by phytoplankton and detritus in the Black Sea in spring. Oceanology 41, 687–695.
Churilova, T., and Berseneva, G. (2004). Absorption of light by phytoplankton, detritus, and dissolved organic substances in the coastal region of the Black Sea (July–August 2002). Phys. Oceanogr. 14, 221–233. doi: 10.1007/s11110-005-0016-3
Churilova, T., Berseneva, G., and Georgieva, L. (2004). Variability in bio-optical characteristics of phytoplankton in the Black Sea. Oceanology 44, 192–204.
Churilova, T., and Suslin, V. (2010). “Parameterization of light absorption by all in-water optically active components in the Black Sea: Impact for underwater irradiance and primary production modeling,” in Coastal to Global Operational Oceanography: Achievements and Challenges, Proceedings of the Fifth International Conference on EuroGOOS, (Exeter, UK).
Churilova, T., Suslin, V., Krivenko, O., Efimova, T., and Moiseeva, N. (2016). Spectral approach to assessment of phytoplankton photosynthesis rate in the black sea based on satellite. Methodological aspects of the regional model development. J. Siberian Federal Univ. 4, 367–384.
Churilova, T., Suslin, V., and Sosik, H. M. (2009). A spectral model of underwater irradiance in the Black Sea. Phys. Oceanogr. 19, 366–378. doi: 10.1007/s11110-010-9060-8
Cleveland, J. S. (1995). Regional models for phytoplankton absorption as a function of chlorophyll a concentration. J. Geophys. 100, 333–344.
Dmitriev, E. V., Khomenko, G., Chami, M., Sokolov, A. A., Churilova, T. Y., and Korotaev, G. K. (2009). Parameterization of light absorption by components of seawater in optically complex coastal waters of the Crimea Peninsula (Black Sea). Appl. Opt. 48, 1249–1261. doi: 10.1364/AO.48.001249
Feldman, G. C., McClain, C. R. (2013). Ocean Color Web SeaWiFS Reprocessing 2010.0, MODIS-Terra Reprocessing 2013.0, MODIS-Aqua Reprocessing 2013.1, MERIS Reprocessing 2012.0, NASA Goddard Space Flight Center. eds N. Kuring and S. W. Bailey. Available online at: http://oceancolor.gsfc.nasa.gov/cms/
Fujiki, T., and Taguchi, S. (2002). Variability in chlorophyll a specific absorption coefficient in marine phytoplankton as a function of cell size and irradiance. J. Plankton Res. 24, 859–874. doi: 10.1093/plankt/24.9.859
Georgieva, L. V., (1993). “Species composition and dynamics of phytoplankton,” in Plankton of the Black Sea, ed V. E. Zaika (Kiev: Naukova Dumka), 31–55.
Gordon, H. R., and McGlunev, W. R. (1975). Estimation of the depth of sunlight penetration in the sea for remote sensing. Appl. Opt. 14, 413–416. doi: 10.1364/AO.14.000413
Grant, C. S., and Louda, J. W. (2010). Microalgal pigment ratios in relation to light intensity: implications for chemotaxonomy. Aquat. Biol. 11, 27–138, doi: 10.3354/ab00298
Hoepffner, N., and Sathyendranath, S. (1991). Effect of pigment composition on absorption properties of phytoplankton. Mar. Ecol. Prog. Ser. 73, 11–23. doi: 10.3354/meps073011
Hoepffner, N., and Sathyendranath, S. (1992). Bio-optical characteristics of coastal waters: absorption spectra of phytoplankton and pigment distribution in the western North Atlantic. Limnol. Oceanogr. 37, 1660–1679. doi: 10.4319/lo.1992.37.8.1660
Ivanov, V. A., and Belokopytov, V. N. (2011). Oceanography of the Black Sea. National Academy of Science of Ukraine. (Sevastopol: ECOSI-Gidrofizika), 211.
Jeffrey, S. W., and Humphrey, G. F. (1975). New spectrophotometric equations for determining chiorophylls a, b, c1 and c2 in higher plants, algae and phytoplankton. Biochem. Physiol. Pflanzen. 167, 191–197. doi: 10.1016/S0015-3796(17)30778-3
Jeffrey, S. W., Mantoura, R. F. C., and Wright, S. W. (eds). (1997). Phytoplankton Pigments in Oceanography: Guidelines to Modern Methods. Paris: UNESCO publishing.
Kirk, J. T. O. (1976). A Theoretical analysis of the contribution of algae cells to the attenuation of light within natural waters. III. Cylindrical and spheroidal cells. New Phytol. 77, 341–358. doi: 10.1111/j.1469-8137.1976.tb01524.x
Kirk, J. T. O. (1994). Light and Photosynthesis in Aquatic Ecosystems. New York, NY: Cambridge University Press.
Lorenzen, C. J. (1967). Determination of chlorophyll and pheopigments: spectrophotometric equations. Limnol. Oceanogr. 12, 343–346. doi: 10.4319/lo.1967.12.2.0343
Lutz, V. A., Sathyendranath, S., and Head, E. J. H. (1996). Absorption coefficient of phytoplankton: regional variations in the North Atlantic. Mar. Ecol. Prog. Ser. 135, 197–213. doi: 10.3354/meps135197
Lutz, V. A., Sathyendranath, S., Head, E. J. H., and Li, W. K. W. (2003). Variability in pigment composition and optical characteristics of phytoplankton in the Labrador Sea and the Central North Atlantic. Mar. Ecol. Prog. Ser. 260, 1–18. doi: 10.3354/meps260001
MacIntyre, H. L., Kana, T. M., Anning, J., and Geider, R. (2002). Photoacclimation of photosynthesis irradiance response curves and photosynthetic pigments in microalgae and cyanobacteria. J. Phycol. 38, 17–38. doi: 10.1046/j.1529-8817.2002.00094.x
Marie, D., Partensky, F., Vaulot, D., and Brussaard, C. P. D. (1999). “Enumeration of phytoplankton, bacteria and viruses in marine samples,” in Current Protocols in Cytometry Supplement 10, eds J. P. Robingson, Z. Darzynkiewicz, P. N. Dean, A. Orfao, P. Rabinovitch, C. C. Stewart et al. (New York, NY: John Wiley and Sons Inc.), 11.11.1–11.11.15.
Mikaelyan, A. S., Pautova, L. A., Pogosyan, S. I., and Sukhanova, I. N. (2005). Summer bloom of Coccolothophorids in the Northeastern Black Sea. Oceanology 45, S127–S138.
Millan-Nunez, E., Sieracki, M. E., Millan-Nunez, R., Lara-Lara, J. R., and Gaxiola-Castro, G. C. C. (2004). Trees Specific absorption coefficient and phytoplankton biomass in the southern region of the California Current. Deep-Sea Res. II. 51, 817–826. doi: 10.1016/j.dsr2.2004.05.023
Mitchell, B. G. (1990). “Algorithms for determining the absorption coefficient of aquatic particulates using the quantitative filter technique (QFT),” in Ocean Optics X. ed R. Spinrad (Washington, DC: SPIE Bellingham). 137–148.
Mitchell, B. G., and Kiefer, D. A. (1988). Chlorophyll a specific absorption and fluorescence excitation spectra for light limited phytoplankton. Deep-Sea Res. 35, 639–663. doi: 10.1016/0198-0149(88)90024-6
Morel, A., and Bricaud, A. (1981). Theoretical results concerning light absorption in a discrete medium, and application to specific absorption of phytoplankton. Deep-Sea Res. 28, 1375–1393. doi: 10.1016/0198-0149(81)90039-X
Morel, A., and Prieur, L. (1977). Analysis of variations in ocean color. Limnol. Oceanogr. 22, 709–722. doi: 10.4319/lo.1977.22.4.0709
O'Reilly, J. E., Maritorena, S., O'Brien, M. C., Siegel, D. A., Toole, D., Menzies, D., et al. (2000). “SeaWiFS Postlaunch Calibration and Validation Analyses, Part 3,” in NASA Technical Memorandum. 2000-206892, Vol. 11. eds S. B. Hooker and E. R. Firestone (Greenbelt, MD: NASA Goddard Space Flight Center), 49.
Saba, V. S., Friedrichs, M. A. M., Antoine, D., Armstrong, R. A., and Asanuma, I. M. J. (2011). An evaluation of ocean color model estimates of marine primary productivity in coastal and pelagic regions across the globe. Biogeosciences. 8, 489–503. doi: 10.5194/bg-8-489-2011
Sathyendranath, S., Stuart, V., Platt, T., Bouman, H., Ulloa, O., and Maass, H. (2005). Remote sensing of ocean color: towards algorithms for retrieval of pigment composition. Indian J. Mar. Sci. 34, 333–340.
Schapira, M., Buscot, M. J., Pollet, T., Leterme, S. C., and Seuront, L. (2010). Distribution of picophytoplankton communities from brackish to hypersaline waters in a South Australian coastal lagoon. Saline Syst. 6, 2–16. doi: 10.1186/1746-1448-6-2
Sosik, H. M., and Mitchell, B. G. (1994). Effects of temperature on growth, light absorption and quantum yield in Dunaliella tertiolecta (Chlorophyceae). J. Phycol. 30, 833–840. doi: 10.1111/j.0022-3646.1994.00833.x
Stuart, V., Sathyendranath, S., Platt, T., Maass, H., and Irwin, B. D. (1998). Pigments and species composition of natural phytoplankton populations: effect on the absorption spectra. J. Plankton Res. 20, 187–217. doi: 10.1093/plankt/20.2.187
Suslin, V., and Churilova, T. (2016). The Black Sea regional algorithm of separation of light absorption by phytoplankton and colored detrital matter using ocean color scanner's bands from 480-560 nm. Int. J. Remote Sens. 37, 4380–4400. doi: 10.1080/01431161.2016.1211350
Suslin, V. V., Churilova, T. Y., and Sosik, H. M. (2008). The SeaWiFS algorithm of chlorophyll a in the Black Sea. Mor. Ekol. Zh. 7, 24–42.
Suslin, V. V., Korolev, S. N., Kucheryaviy, A. A., Churilova, T., and Ya Krivenko, O. V. (2015). “Photosynthetically available radiation on surface of the Black Sea based on ocean color data,” in Proceedings SPIE 9680, 21st International Symposium Atmospheric and Ocean Optics: Atmospheric Physics, (Bellingham, WA).
Suslin, V. V., Suetin, V. S., Korolev, S. N., and Kucheryaviy, A. A. (2007). “Use of SeaWiFS data to estimate water optical properties of the Black Sea,” in Proceedings SPIE 6615, Current Research on Remote Sensing, Laser Probing, and Imagery in Natural Waters, (Bellingham, WA).
Suzuki, K., Kishino, M., Sasaoka, K., Saitoh, S. I., and Saino, T. (1998). Chlorophyll-specific absorption coefficients and pigments of phytoplankton off sanriku, Northwestern North Pacific. J. Oceanogr. 54, 517–526. doi: 10.1007/BF02742453
Tassan, S., and Ferrari, G. (1995). An alternative approach to absorption measurements of aquatic particles retained on filters. Limnol. Oceanogr. 40, 1358–1368. doi: 10.4319/lo.1995.40.8.1358
Vedernikov, V. I. (1989). “Primary production and chlorophyll in the Black Sea in summer and fall,” in Struktura i Produktsionnye Kharakteristiki Planktonnykh Soobshchestv: Sbornikh Nauchnykh Rabot, eds M. E. Vonogradov and M. V. Flint (Moscow: Nauka), 65–83.
Keywords: phytoplankton, light absorption, parameterization, chlorophyll a concentration, upper mixed layer, the Black Sea
Citation: Churilova T, Suslin V, Krivenko O, Efimova T, Moiseeva N, Mukhanov V and Smirnova L (2017) Light Absorption by Phytoplankton in the Upper Mixed Layer of the Black Sea: Seasonality and Parametrization. Front. Mar. Sci. 4:90. doi: 10.3389/fmars.2017.00090
Received: 29 December 2016; Accepted: 15 March 2017;
Published: 04 April 2017.
Edited by:
Shubha Sathyendranth, Plymouth Marine Laboratory, UKCopyright © 2017 Churilova, Suslin, Krivenko, Efimova, Moiseeva, Mukhanov and Smirnova. This is an open-access article distributed under the terms of the Creative Commons Attribution License (CC BY). The use, distribution or reproduction in other forums is permitted, provided the original author(s) or licensor are credited and that the original publication in this journal is cited, in accordance with accepted academic practice. No use, distribution or reproduction is permitted which does not comply with these terms.
*Correspondence: Tanya Churilova, dGFueWEuY2h1cmlsb3ZhQGdtYWlsLmNvbQ==