 Jacob Asher
 Ivor D. Williams2
- 1Joint Institute for Marine and Atmospheric Research, University of Hawaii at Manoa, Honolulu, HI, USA
- 2Coral Reef Ecosystem Program, Ecosystem Sciences Division, Pacific Islands Fisheries Science Center, National Oceanic and Atmospheric Administration, Honolulu, HI, USA
- 3Department of Environment and Agriculture, Curtin University, Perth, WA, Australia
Mesophotic coral ecosystem (MCE) research has increased considerably in recent years, as MCEs may provide partial insulation from the effects of climate change, localized anthropogenic stressors, and may dampen fishing pressures for target species depleted in shallower waters. However, few studies have examined coral reef fish assemblages and functional groups across shallow water to mesophotic depth gradients. In the Main Hawaiian Islands, we investigated coral reef fish communities between 0 and 100 m using baited remote underwater stereo-video. While significant community shifts were detected when transitioning from shallow water to mesophotic depths, relative abundance and species richness remained highest between 0 and 30 m. Mobile invertivores and generalist macropiscivores were exceptions, recording higher abundance and richness values in deeper waters. Depth, habitat complexity, and percent cover of unconsolidated sediment and macroalgae were the main reef fish community drivers in multivariate regression and distance-based linear models. Finally, several target species were more abundant and/or larger in deeper waters, suggesting stock assessment and resource management strategies are incomplete without the incorporation of mesophotic portions of stocks.
Introduction
Until recently, research, monitoring, and management of coral reef fishes primarily relied on data collected using underwater visual censuses on open-circuit scuba between 0 and 30 m (herein denoted as “shallow water” in the context of this study). However, many fishes present in shallow water habitats are depth-generalists, able to reside in “mesophotic” depths of 30–150 m or more (Thresher and Colin, 1986; Ginsburg, 2007; Brokovich et al., 2008; Kahng et al., 2010; Slattery et al., 2011; Bridge et al., 2013; Bejarano et al., 2014). In addition, while not fully protected from environmental or biological disturbance events, mesophotic coral ecosystems (“MCEs”) may be partially shielded from some of the influences impacting shallow water coral reefs, and serve as population reservoirs for depth-generalists targeted by fishers in 0–30 m depths (Glynn, 1996; Riegl and Piller, 2003; Bak et al., 2005; Lesser et al., 2009; Bongaerts et al., 2010; Slattery et al., 2011; Kane et al., 2014; Lindfield et al., 2014, 2016; Tenggardjaja et al., 2014; Baker et al., 2016). Conversely, while shallow water coral reefs and associated habitats (e.g., pavement or rubble flats) may shelter depth-restricted specialist fishes incapable of inhabiting deeper depths, MCEs and other deep-water mesophotic benthic habitats (“MBHs”) can likewise host distinct communities and species of reef fishes not found in 0–30 m depths, with depth, habitat type, structural complexity, and biotic cover acting in concert with geographic extent and oceanographic drivers to structure assemblages and functional-level groupings (Thresher and Colin, 1986; Beukers and Jones, 1998; Brokovich et al., 2008; MacNeil et al., 2009; Harvey et al., 2013; Komyakova et al., 2013; Jankowski et al., 2015; Andradi-Brown et al., 2016; Heyns-Veale et al., 2016; Rosa et al., 2016). As a result, limitations of many marine science research programs include missing portions of reef fish populations that are utilizing deeper habitats, or omitting species of potential conservation or management importance that are restricted to mesophotic depths. However, despite increased mesophotic research over the past two decades and the potential importance of these systems, Pacific MCEs remain understudied and relatively unassessed in comparison with their shallower counterparts (Bridge et al., 2013; Kahng et al., 2014).
Historic mesophotic research in the Main Hawaiian Islands (“MHI”) has primarily focused on exploration (Brock and Chamberlain, 1968; Strasburg et al., 1968), surveys of specific taxa or target species (Grigg, 2004; Kahng and Grigg, 2005; Tenggardjaja et al., 2014), habitat and zone characterization (Locker et al., 2010; Rooney et al., 2010; Blyth-Skyrme et al., 2013; Costa et al., 2015; Veazey et al., 2016), spatially focused investigations, e.g., host reef fish assemblages inhabiting mesophotic black coral (Antipathes) patches and deep artificial reefs (Grigg, 1965; Moffitt et al., 1989; Boland and Parrish, 2005), or the effects of localized environmental variables and depth-delineated reef fish functional groupings (Kane and Tissot, 2016). While Fukunaga et al. (2016) characterized reef fish assemblages, functional groups, and endemism patterns holistically across shallow water to mesophotic gradients in the Northwestern Hawaiian Islands (NWHI), similar investigations in the MHI remains comparatively sparse.
To a large degree, the lack of MCE research and monitoring, in comparison with shallow water coral reef ecosystems, has been due to logistical, technical, and financial constraints associated with the use of technical mixed-gas or closed circuit rebreather (CCR) diving and the use advanced remote sampling technologies, e.g., submersibles (Pyle, 1996, 2000; Kahng et al., 2010). The advent of baited remote underwater stereo-video (stereo-BRUVs, herein denoted as “BRUVS”) represents an alternative, cost-effective approach that has been increasingly used to assess MCE reef fish populations (Pearson and Stevens, 2015; Lindfield et al., 2016). Here, we analyzed BRUVS data collected from 107 sites around the MHI, with the objective of characterizing changes in reef fish community structure from shallow water to mesophotic depths. We focus on changes to overall reef fish assemblages and functional-level partitions along depth gradients and their relationships to a range of habitat variables (Boland et al., 2011; Kane and Tissot, 2016). We also explore the potential for mesophotic depth-refugia of reef fish target species (those subjected to commercial or recreational fishing extraction) and whether relative abundance of endemic species or the proportion of the fish community they make up changes with depth (Kane et al., 2014; Fukunaga et al., 2016; Kosaki et al., 2016).
Materials and Methods
Ethics Statement: Stereo-Video Sampling of Reef Fishes
This project was conducted under the Papahānaumokuākea Marine National Monument Research Permit no. PMNM-2013-018-M1, and meets the requirements of NOAA Administrative Order (NAO) Series 216-6, Environmental Review Procedures, Sections 5.05 and 6.03c.3 (a) for Categorical Exclusions (CE) for Research Programs (PIFSC-20120038) for survey activities in the Main Hawaiian Islands. Additional research clearance was granted by the National Environmental Policy Act (NEPA), Programmatic Environmental Assessment for Research Activities Conducted by the Coral Reef Ecosystems Program (CREP), Pacific Islands Fisheries Science Center (PIFSC), 2010–2015. Stereo-camera deployments conducted from 2012 to 2014 were completed under the University of Western Australia (UWA) animal ethics permit no. RA/3/100/1204 and the Curtin University animal ethics permit AEC-2014-09, in adherence to provisions contained within the Australian Code of Practice for the Care and Use of Animals for Scientific Purposes. All experimental stereo-video sampling protocols were approved in accordance with NOAA PIFSC CREP, UWA, and Curtin University research guidelines, permitting agencies, and/or animal ethics review committees as described above.
Survey Area
The MHI consist of eight volcanic islands with a resident human population of over 1.4 million people (census.hawaii.gov), stretched across a 650 km SE-NW gradient between 19°N, 155°W to 22°′N, 160°10′W.
Sites located around Oahu, Maui, Molokai, Lanai were surveyed during two NOAA research expeditions in September and October 2012, and by shore-based small boat sampling efforts around Oahu in November 2013 (Figure 1).
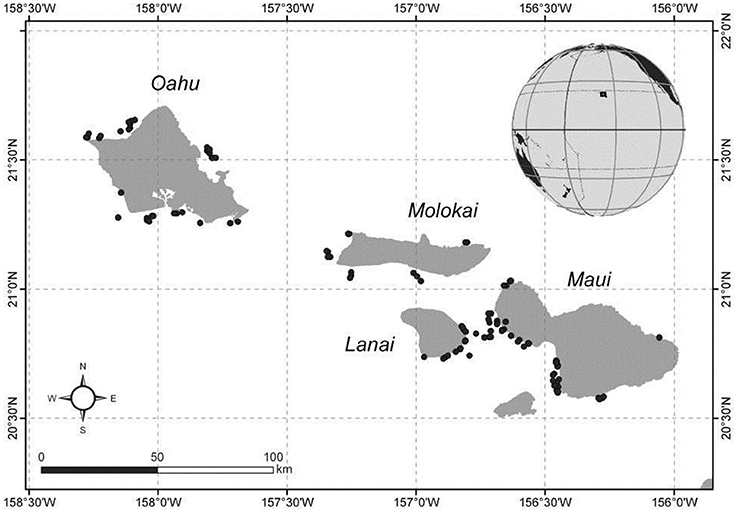
Figure 1. Stereo-BRUVs survey locations in the Main Hawaiian Islands. Dark circles indicate individual BRUVS deployment sites.
Sampling Design
BRUVS are a widely-used fishery-independent technology, able to generate information on relative abundance and length-distributions of demersal fishes (Harvey and Shortis, 1995, 1998). For this study, shallow water BRUVS sites between 0 and 30 m were a randomly selected subset of locations that had previously been surveyed by divers on SCUBA as part of routine monitoring surveys conducted by NOAA Coral Reef Ecosystem Program (CREP, Heenan et al., 2014). Sites between 30 and 100 m were randomly selected from a pool of 500 × 500 m grid cell center points constrained within 100 m contour lines of each island. These sites were at least 500 m apart to reduce the likelihood of bait plume overlaps and stratified into three depth bins (30–53, 53–76, 76–100 m); however, the two deeper bins were combined post hoc (53–100 m, “lower mesophotic”) due to low hard-bottom sampling frequencies at those depths (“depth,” fixed: 3 levels, shallow water, upper mesophotic, lower mesophotic).
Because the goal was to compare hard-bottom habitats, grid cells containing >35% unconsolidated sediment derived from multibeam backscatter data (Pacific Islands Benthic Habitat Mapping Center, 2006, 2007, 2009) were excluded from the survey domain. However, at many of the deeper deployment sites, bottom type information was not available or was inaccurate and thus many of those deployments were on what appeared to be 100% unconsolidated sediment (i.e., sand flats). While not targeted in this study, these sites were included in analyses with the addition of a two-level fixed factor (“habitat”: hard-bottom vs. unconsolidated sediment).
Each BRUVS was deployed for a 60 min sampling period (Watson et al., 2005; Bernard and Götz, 2012), using ~800 g of Pacific saury/Japanese sanma (Cololabis saira) pulped into a wire mesh basket 1.2 m in front of the stereo-cameras. We selected C. saira because it is locally available and functionally similar to the more commonly used pilchard (Sardinops sagax), as both are oily soft-fleshed fishes widely used by fishers as attractants. Pilchards have been shown to be an appropriate bait for studies using BRUVS (Cappo et al., 2007; Harvey et al., 2012, 2013; Walsh et al., 2016), and although we recognize that the type of bait used will have some impact on survey outcomes, evidence suggests BRUVS surveys remain relatively robust to the bait used (Dorman et al., 2012; Ghazilou et al., 2016). While more work in this area would be desirable, overall we believe that C. saira is likely to be a suitable general attractant, and one that provides scope for highly meaningful comparison with the majority of other BRUVS studies to date.
Stereo-cameras were placed on a base bar mounted 0.7 m apart inside a galvanized steel roll-bar frame, inwardly converged at 8° and covering ~51 m2 when identifying reef fishes ≤7 m distance from BRUVS (Harvey et al., 2007). Any individual fishes observed >7 m from BRUVS were omitted from annotation and analysis. Lastly, data from two shallow water (0–30 m) sites were discarded as nutrient outflows and runoff reduced in-water visibility to <7 m.
Analysis
Data Processing
Each BRUVS consisted of a paired Sony handycams that were calibrated using CAL™ software (www.seagis.com.au; Seager, 2008) according to standard protocols before and after each data collection effort (Harvey and Shortis, 1998; Shortis and Harvey, 1998). Following completion of field sampling, stereo-video files were reviewed with species annotated to the lowest possible taxonomic level using the program EventMeasure-Stereo™(Seager, 2008).
The MaxN metric was used as the basis for abundance estimation (Ellis and Demartini, 1995; Willis and Babcock, 2000; Willis et al., 2000), and fork-length measurements were taken for a subset of target species at the time of MaxN. All species annotations were reviewed prior to data analysis, with quality control completed by one analyst to retain consistency (Wilson et al., 2007).
Group Classification
Fish species sampled by BRUVS in the MHI were assigned to functional group categories, as described in Harvey et al. (2007) and Bernard and Götz (2012), based on dietary, behavioral, and morphological traits. The NOAA PIFSC CREP MHI reef fish database (Heenan et al., 2014), and FishBase, ver. 11/2014 (Froese and Pauly, 2014) served as primary classification sources, with a subset of species assignments cross-checked against functional classifications generated from isotopic analyses (Bradley et al., 2015). The nine functional groupings were: herbivores, planktivores, mobile invertivores, sessile invertivores, corallivores, omnivores, and lower-level piscivores. Sessile macropiscivores were additionally defined as a functional group encompassing large-bodied eel species belonging to Muraenidae and Ophichthidae, while generalist macropiscivores incorporated all large-bodied, roving predators following guidelines as specified in Friedlander and DeMartini (2002). These included the snapper Aprion virescens, non-planktivorous jacks, barracuda, and sharks (i.e., apex predators). Fishes that could only be identified to family or genus level were binned into groupings based on the NOAA PIFSC CREP classification system (Heenan et al., 2014).
Species encountered during this study were further categorized as a) target species–being those with >450 kg yr−1 of landings between 2000 and 2010, based on information obtained from local commercial and recreational (Marine Recreational Information Program) catch reports analyses in the MHI (Stamoulis et al., 2016). Targets species identified as being below a sustainability threshold, i.e., potentially overfished with spawning potential ratio <30%, (Nadon et al., 2015) were additionally flagged within each respective functional group; and b) Hawaiian endemics, i.e., species found solely in the Hawaiian Archipelago and Johnston Atoll (DeMartini and Friedlander, 2004; Randall, 2007; Wagner et al., 2014). Additional details describing group assignments are given in Supplementary Materials, Table S1.
A total of 75 fish could not be identified even to family level, and were excluded from analysis. However, they only constituted between 0.5 (0–30 m hard-bottom) and 4% (30–53 m, unconsolidated sediment) of total abundance.
Habitat and Environmental Drivers
A number of habitat and environmental variables were gathered for each site: depth (obtained from attached depth-gages; habitat complexity was rated on a five-point scale, with 1 = no vertical relief to 5 = high vertical relief (Wilson et al., 2007; Ayotte et al., 2015); and percent cover of coral, macroalgae, turf, crustose coralline, and sand were visually estimated from BRUVS imagery. The metrics “distance from shore” and “distance from nearest boat ramp” were also derived for each site using ArcGIS, version 10.3 (http://www.esri.com/software/arcgis).
Statistical Analyses
All statistical analyses described below were conducted using PRIMER version 7.0.11 with the PERMANOVA+ add-on (Anderson et al., 2008; Clarke et al., 2014; Clarke and Gorley, 2015), unless otherwise specified.
Both univariate and multivariate tests, and subsequent community and functional group inferences between depth and habitat strata, should be treated with caution as a result of asymmetric hard-bottom vs. unconsolidated sediment sampling. In particular, while the small number of unconsolidated sediment surveys between 0 and 30 m (2) and 30–53 m (5) were included in statistical testing and graphics displays, they could only be peripherally interpreted. Similarly, while the primary focus remains centered around hard-bottom reef fish communities, conclusions derived from sites between 53 and 100 m (10), in comparison to shallow water (40) and upper mesophotic (24) hard-bottom strata, were limited.
Univariate Tests
All univariate statistical tests used pair-wise permutational analysis of variance (permutational ANOVA, Anderson et al., 2008) based on Euclidean distance-based matrices with Type III sums of squares. Total abundance (summed MaxN) and species richness (summed total species, S) were calculated at community, functional, and endemic group levels across depth and habitat strata using untransformed, univariate datasets. Monte Carlo P-values were utilized for small sample sizes, i.e., where there were fewer than 100 permutations (Anderson et al., 2008).
Community Assemblage and Functional Group Structure
A canonical analysis of principal components (CAP; Anderson and Willis, 2003) was used as a global test to assess structural differences in overall fish assemblages and the precision of factored depth and habitat categories. A “leave-one-out” allocation and cross-validation test (Lachenbruch and Mickey, 1968; Anderson et al., 2008) was generated to identify misclassification errors and measure the accuracy of depth and habitat assignments, with the number of axes (m) chosen by plotting the residual sum of squares. Pearson rank correlation values >0.4 were used to visualize associations between individual species and canonical axes.
A permutational multivariate analysis of variance (PERMANOVA) was further used to assess multivariate differences in the overall reef fish community (Anderson and Walsh, 2013), with pair-wise tests completed post hoc to assess significance levels between the six potential depth-habitat combinations, with p-values obtained using permutation tests (9,999 permutations) for each individual term in the model and Monte Carlo P-values employed if tests had fewer than 100 permutations (Anderson et al., 2008). Community abundance data was log(x+1) transformed to down-weight more abundant species prior to generating a Bray-Curtis dissimilarity matrix, which is appropriate for statistical tests utilizing abundance information (Faith et al., 1987). Metric multidimensional scaling ordinations (mMDS) of total reef fish assemblages, major functional group communities, and endemic group centroids were generated in order to further visualize relationships between communities and increasing depths and varying habitat strata. These were standardized and transformed via Index of Association (Whittaker, 1960) and clustered along the y-axis using a Type III SIMPROF analysis with a complementary cophenetic correlation coefficient to assess clustering accuracy between pair-wise distances (Sokal and Rohlf, 1962) and ordered along the x-axis according to depth and habitat categories. Unlike the more commonly used nonmetric multidimensional scaling (nMDS), which are 2-D ordinations generated from (dis)similarities on a monotonic scale of distances (Clarke et al., 2014), mMDS retains linear inter-point distances versus ranks of distances and may be more reliable when the number of group centroids is low. Finally, shade plots (heat maps) of the four most numerically abundant functional groups were plotted, with species summed, standardized, and transformed using protocol as described for mMDS plots (see above) and ordered along the x-axis according to depth and habitat categories. For mobile invertivores, only those species contributing to ≥20% abundance were depicted in graphic visualizations (i.e., excluding species which, for every site, account for <20% of its total abundance) due to the disproportionately high number of species encountered in this functional group.
Length-Based Estimates
Fork-lengths of all generalist macropiscivores and stock-assessment targets were collected at the time of MaxN. Non-parametric kernel density estimates (KDEs) were used to approximate length frequency distributions between shallow water and pooled mesophotic zones following the approach used by Langlois et al. (2012), with a minimum requirement of 10 individuals measured per strata. KDE bandwidths were selected using Sheather-Jones assignment protocol (Sheather and Jones, 1991) via the function dpik in the package KernSmooth in the R statistical program version 3.3.0 (Wand and Jones, 1995; Wand and Ripley, 2011).
Habitat and Environmental Linkages
A principal components analysis (PCA) was used to evaluate and distinguish differences between normalized habitat variables along depth and habitat categories. Variation was depicted along the first two principal axes, with environmental vectors indicating strength and direction.
Two complementary models assessed the influence of environmental drivers, distance to boat ramp, and distance from shore on reef fish assemblage structures. A multivariate regression tree (MRT) followed the approach described by Borcard et al. (2011) and Lindfield et al. (2016) using the R package mvpart (De'Ath, 2007) with MRTs primarily acting as predictive (vs. explanatory) models. Prior to MRT generation, relative abundance data were first Hellinger-transformed, which is an approach well-suited for species abundance datasets, granting lower weights to rare species (Legendre and Gallagher, 2001) and multiple zero counts (Rao, 1995). Optimal tree size was generated from 100 model runs, with the model selection output based on the highest cross-validated predictive accuracy. The labdsv package and indval function used to generate subsequent species indicator values from the Dufene and Legendre Index (DLI; Dufrene and Legendre, 1997; Borcard et al., 2011), with the top 10 (maximum) species that recorded a significant difference (p < 0.05) listed in order of decreasing DLI values for each MRT leaf output. The subsequent distance-based linear model (DSTLM) and distance-based redundancy analysis (dbRDA) were generated in PERMANOVA+ (Anderson et al., 2008) as a matching explanatory model, using normalized environmental variables, a Bray-Curtis dissimilarity matrix of log(x+1) transformed community abundance data, and based off the modified Aikaike's Information Criterion (AICc) and BEST procedure.
Results
A total of 5,583 fish belonging to 36 families were recorded over 107 BRUVS sites (Figure 1). Herbivores, planktivores, and mobile invertivores were the largest components of fish assemblages (Figure 2 and Figure S1), ranging between 86–93% of total abundance and 74–82% of species richness at hard-bottom sites, and 77–83% abundance and 59–79% of species richness at unconsolidated sediment sites, depending on depth. Remaining groups constituted between 0.5–4% of total abundance per depth-habitat combination, with the exception of piscivores (8%, 53–100m unconsolidated sediment sites, Figure S5B) and generalist macropiscivores (9–15% at unconsolidated sediment sites in upper and lower mesophotic zones, Figure 8D). We therefore focused analysis on the three prominent functional groups, along with generalist macropiscivores.
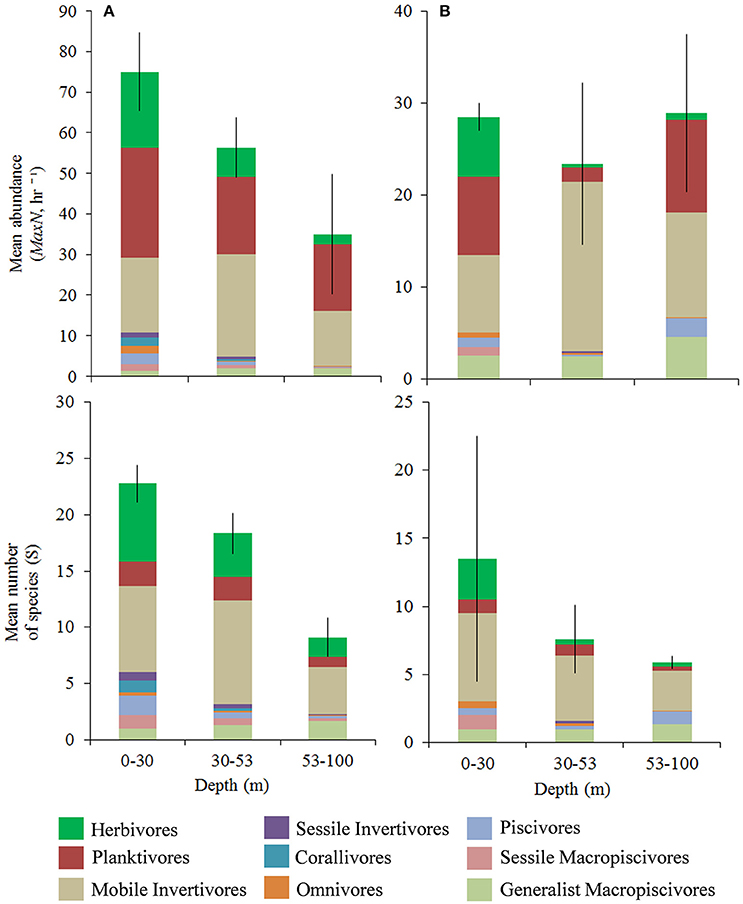
Figure 2. Mean trophic group relative abundance (mean MaxN, hr −1 ± SE) and species richness (mean S). (A) Hard-bottom, (B) 100% unconsolidated sediment. Different colors within bars indicate trophic assignments. Differing scales between hard-bottom vs. unconsolidated sediment sites.
Univariate Analysis
While community abundance and species richness measures consistently declined with depth (Figure 3), univariate permuational ANOVAs revealed no significant differences between shallow water and upper mesophotic hard-bottom sites; however, differences (pooled MaxN, all pair-wise tests <0.01; species richness, all pair-wise tests < 0.001) were noted between those strata and both habitat types in the lower mesophotic zone (Figure 4).
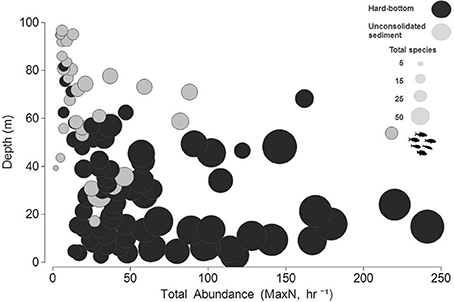
Figure 3. Bubble plot of total, untransformed relative abundance estimates (MaxN, hr−1) in relation to depth and species richness (total species, S).
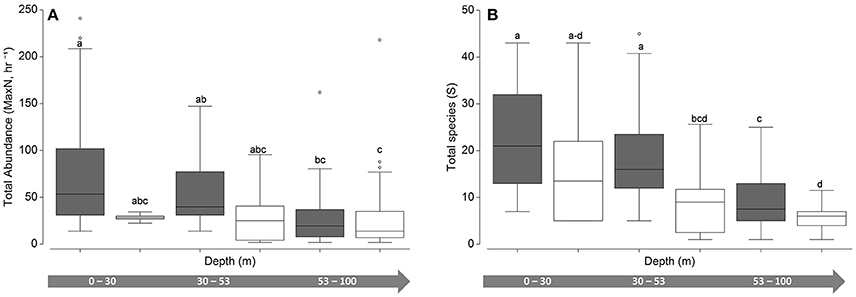
Figure 4. Univariate boxplots of untransformed (A) pooled relative abundance (Total MaxN, hr−1) and (B) species richness (total species, S). Columns sharing the same letter do not differ significantly at the 95% confidence level based on PERMANOVA pair-wise tests. Dark boxes indicate hard bottom, white boxes indicate unconsolidated sediment.
Univariate patterns varied within each primary functional group (Figures 5, 6). Herbivore abundance and richness measures generally declined with depth and when in soft bottom strata (all metrics p < 0.05) where herbivores were scarce. In contrast, univariate planktivore abundance, and richness tests detected no significant differences among hard-bottom strata, even though planktivores constituted a greater proportion of overall reef fish communities in the lower mesophotic zone irrespective of habitat type (Figure S1). Mobile invertivores were represented by more species than any other functional group encountered and were significantly more abundant and species-rich in 30–53 m hard-bottom sites than all other assessed strata (all p < 0.05, except for sparsely sampled unconsolidated sediment sites in shallow water and upper mesphotic zones). Generalist macropiscivore abundance was significantly higher between shallow water hard-bottom vs. lower mesophotic unconsolidated sediment sites; however, there were no differences in species richness between any assessed strata.
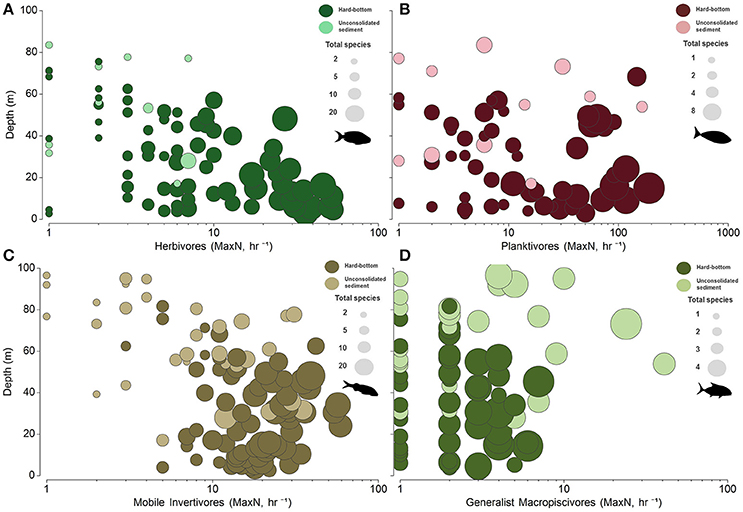
Figure 5. Bubble plots of untransformed relative abundance (MaxN, hr−1) in relation to depth and species richness (total species, S) for (A) herbivores, (B) planktivores, (C) mobile invertivores, and (D) generalist macropiscivores. x-axis abundance estimates displayed on a log scale.
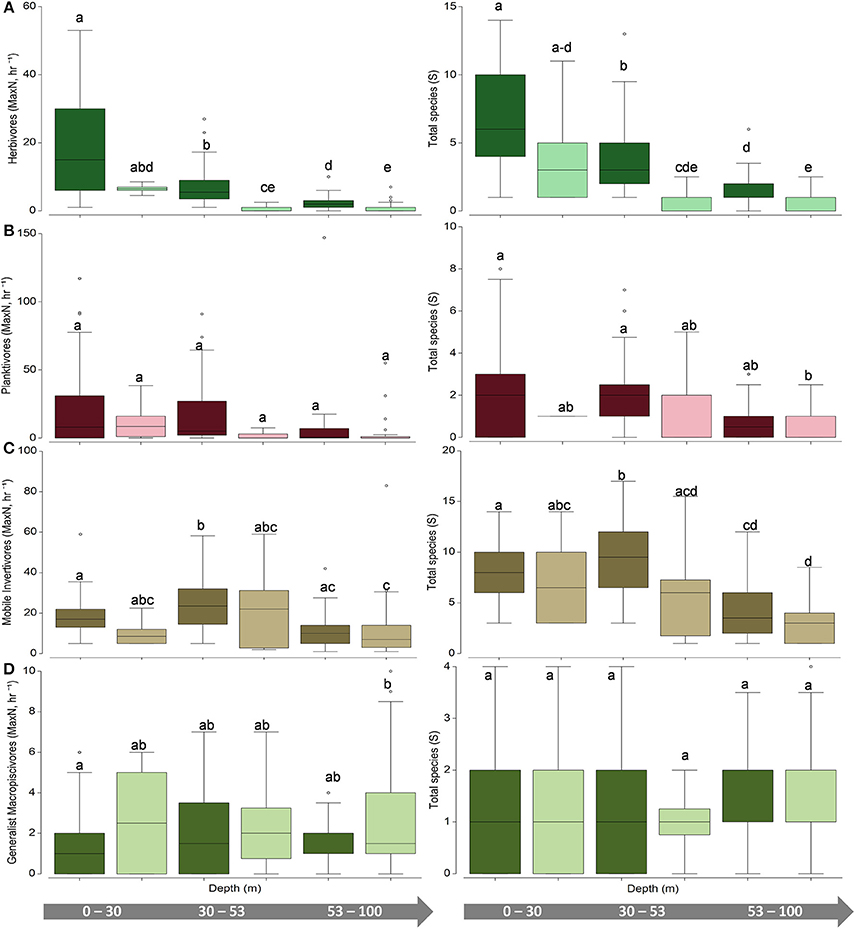
Figure 6. Univariate boxplots of (left) untransformed pooled total abundance (MaxN, hr−1) and (right) species richness (total species, S) for (A) herbivores (B) planktivores (C) mobile invertivores (D) generalist macropiscivores. Columns sharing the same letter do not differ significantly at the 95% confidence level based on PERMANOVA pair-wise tests. Dark boxes indicate hard bottom, light boxes indicate unconsolidated sediment.
Outputs from less common functional groups analyses (sessile invertivores, corallivores, omnivores, lower level piscivores, sessile macropiscivores) are documented in further detail in Figures S4, S5. In brief, sessile invertivores, corallivores, and sessile macropiscivores were most prevalent in 0–30 m depths on hard-bottom strata, quickly dropping in abundance, and richness between 30 and 53 m and were largely absent in the deepest strata. Omnivores were similarly most prevalent and speciose in shallow water and upper mesophotic zones, but were almost exclusively limited to unconsolidated sediments. Finally, piscivores tended to also show declining richness and abundance with depth in hard bottom strata, but had relatively high richness and abundance at deeper mesophotic soft-bottom strata, largely attributed to relatively high abundance of Fistularia commersonii and Synodontidae spp.
Multivariate Assemblage
The canonical analysis of principal coordinates (CAP; Figure 7A) confirmed changes in overall reef fish assemblages among depth and habitat strata (global PERMANOVA, depth Pseudo-F = 3.8827, p = 0.0001; habitat Pseudo-F = 4.4216, p = 0.0001), with δ2 = 0.88 recorded along the first principal axis and δ2 = 0.63 along the second principal axis over m = 21 principal coordinate axes, and considerable depth and habitat community separation, albeit with overlaps between site groups. The estimation of misclassification error indicated high allocation success (78%), with 0–30 m and 30–53 m hard-bottom reef fish assemblages recording the highest percentage of correct assignments (83–84%) and the majority of classification errors occurring between the two (Table S2).
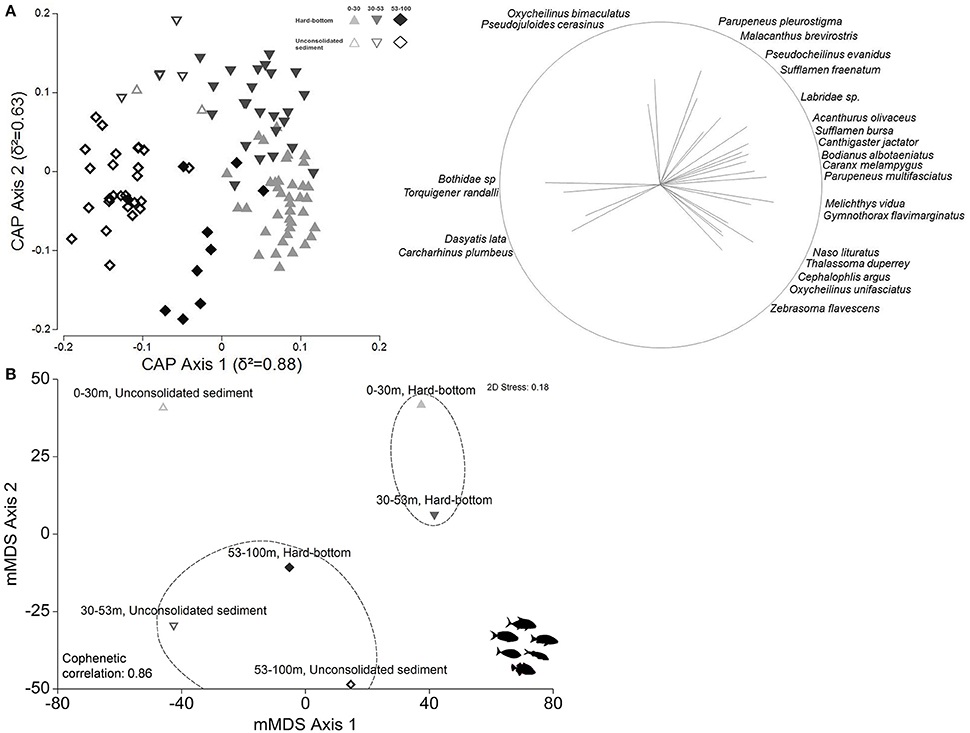
Figure 7. (A) Canonical analysis of principal coordinates ordination (CAP) of first two principal axes depicting relationships between reef fish assemblage and depth-habitat categories. Pearson's correlations (≥0.4) of fish species listed, with strength indicated by vector length and direction. (B) Metric multidimensional scaling (mMDS) plots of group centroids generated from overall reef assemblage. Dashed lines indicate SIMPROF groups.
The mMDS likewise showed a higher degree of community similarity (Figure 7B), with several shared species contributing to within-group similarities (Table S3), and lower overall SIMPER dissimilarity measures (80.40) between shallow water and upper mesophotic hard-bottom sites vs. all compared other strata; however, significant differences in community composition (PERMANOVA pair-wise tests, all p = 0.0001, Table S3) were detected between hard-bottom substrates in all three depth zones, along with sites located in lower mesophotic sand flats. When compared to the shallow water zone, hard-bottom substrates in the upper mesophotic zone had higher abundances of several herbivores (e.g., Acanthurus olivaceus), planktivores (Naso hexacanthus), and mobile invertivores (Oxycheilinus bimaculatus, Parupeneus pleurostigma), but lower abundances of other planktivores (Melichthys niger, Naso brevirostris) and mobile invertivores (Thalassoma duperrey), with the majority of these species becoming scarce or completely absent beyond 53 m. Additional details on community differences are provided in Table S3.
Among the four prevalent functional assemblages, herbivores and mobile invertivores were notable for the clustering of hard-bottom, shallow water and upper mesophotic group centroids within respective mMDS SIMPROF ellipses (Figures S2A,C) as a result of considerable species overlaps (Figures 8A,C). Both retained associated species clusters of shallow water specialists, along with depth-generalists (found between shallow water and upper mesophotic zones, or across all depth zones) in the context of this study; however, with the exception of Centropyge potteri, (which is known to also inhabit 0–30 m), no herbivores were found exclusively in mesophotic strata. This contrasted with a number of mobile invertivore species (e.g., Coris ballieui, Parupeneus chrysonemus, Iniistius umbrilatus), of which several were found at higher abundances at lower mesophotic, unconsolidated sediment sites.
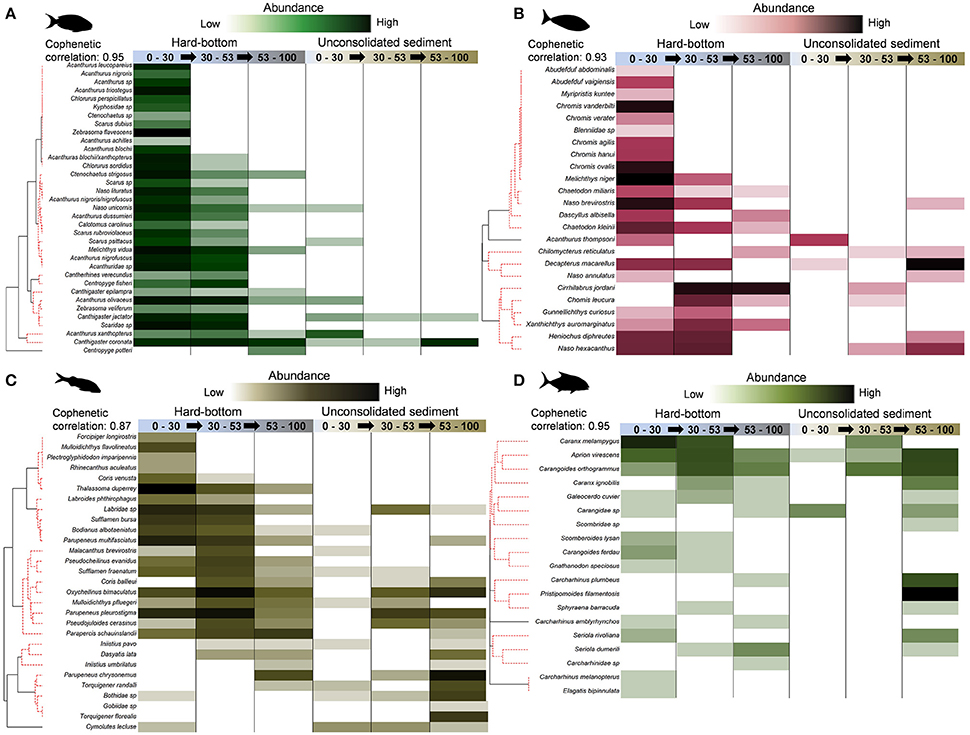
Figure 8. Shade plots for (A) herbivores, (B) planktivores, (C) mobile invertivores (subset of species recording ≥20% contributions), (D) generalist macropiscivores. SIMPROF groups depictured along red, dashed lines in y-axis dendrograms.
There were no discernible patterns for planktivores within mMDS SIMPROF groupings (Figure S2B), although hard-bottom shallow water and upper mesophotic group centroids had the lowest cophenetic correlation distance (52.8; 45% similarity) in comparison with all other pairings. Similar to mobile invertivores, planktivore communities (Figure 8B) sampled by BRUVS were characterized by species encountered exclusively between 0 and 30 m (e.g., Abudefduf abdominais, Chromis vanderbilti), depth generalists (e.g., N. brevirostris, M. niger), and mesophotic specialists (e.g., Cirrhilabrus jordani, Chromis leucura). Like planktivores, generalist macropiscivores had a low cophehetic distance value (37.4; 45% similarity) between shallow water and upper mesophotic hard-bottom centroids, but registered no significant SIMRPOF profiles (Figure S2D). While several abundant species were present in multiple strata (e.g., Carangoides orthogrammus), others appeared constrained by depth (Carcharhinus melanopterus, Carcharhinus plumbeus) and/or habitat (e.g., Pristipomoides filamentosis). Other fishery targeted generalist macopiscivores are discussed in “target species” (see below).
Length-Based Estimates
Only three target species (N. hexacanthus, N. brevirostris, and Caranx melampygus Figures 9A–C) were recorded in sufficient numbers to conduct comparisons of length distributions between shallow water and pooled mesophotic depth strata. Among those species, there were no significant differences in standardized length distributions between shallow water and mesophotic strata, i.e., no indication of skewing or kurtosis biases between depth strata (Langlois et al., 2012), and thus it was appropriate to compare mean lengths. N. brevirostris and C. melampygus mean lengths were significantly larger in mesophotic compared to shallow depths (Figure 9, all p < 0.001), contrasting with N. hexacanthus, which were larger in 0–30 m (p < 0.001).
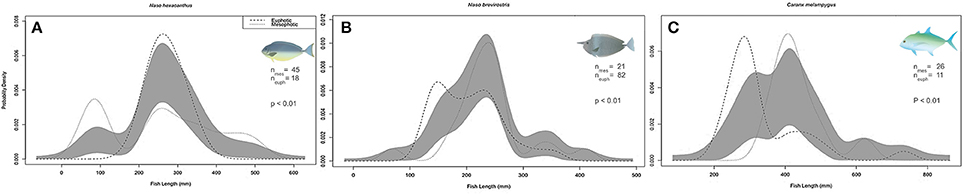
Figure 9. Comparison of (A) Naso hexacanthus, (B) Naso brevirostris, and (C) Caranx melampygus kernel density estimate (KDE) probability functions measured at shallow (SPC, 0–30 m) and mesophotic depths (30–100 m) using mean bandwidths. Gray bands indicate one standard error (SE) to either side of the null model, indicating no differences between the KDEs of each depth strata. N, number of fish; p, permutation tests to determine significance between depth-constrained length distributions.
Target Species
A total of 1,163 fishes belonging to 31 target species, as identified from recreational and commercial catch data, were encountered during BRUVS surveys (13 herbivores, 2 planktivores, 6 mobile invertivores, 2 piscivores, 8 generalist macopiscivores; Figures 10A,B). Of the six “fishery depleted” species, only Acanthurus blochii was recorded exclusively in the euphotic zone (Figure 10A).
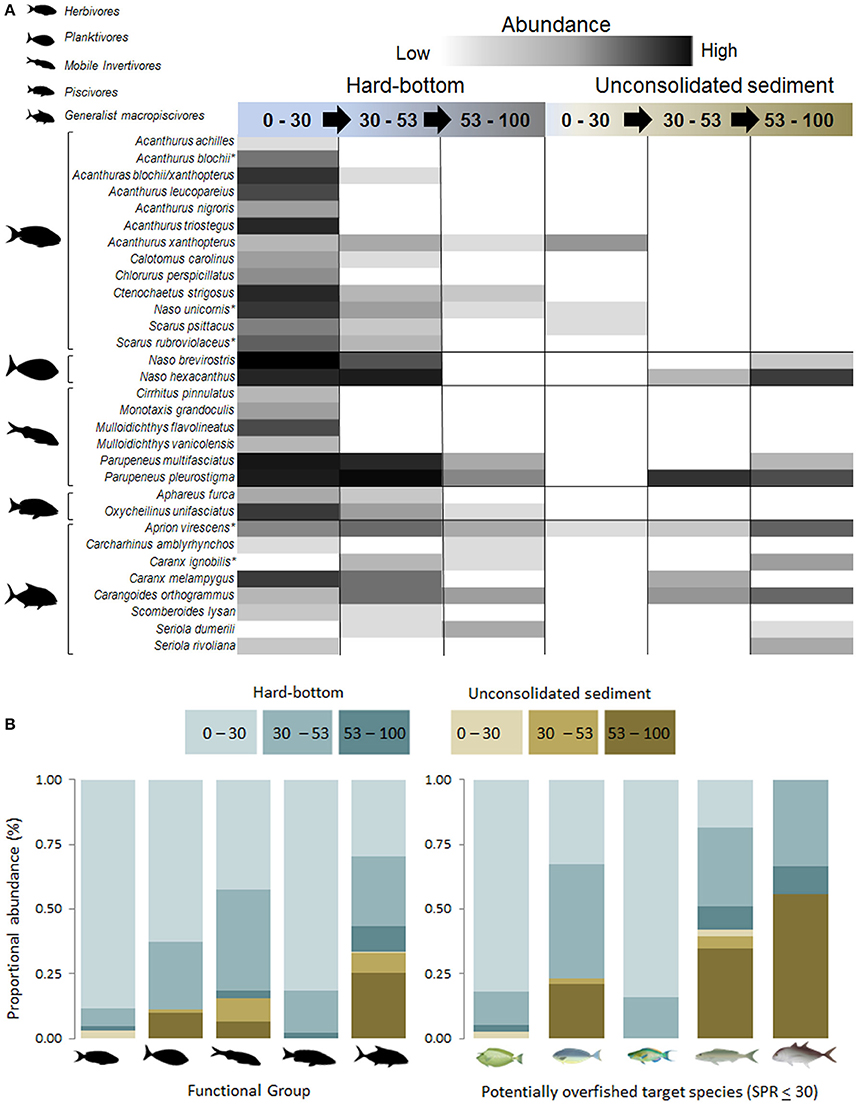
Figure 10. (A): Shade plot of target species subject to extractive (fishing) pressures of ≥450 kg yr−1 over a 10 year period (Stamoulis et al., 2016). Relative abundance ranked from low (light gray) to high (dark gray, and ordered from shallow water to mesophotic depths along hard-bottom substrate and unconsolidated sampling sites. *Indicate species with spawning potential ratios ≤30 (Nadon et al., 2015). (B) Proportional relative abundance of functional groups subjected to extractive fishing pressures. Lower right panel: proportional abundance of target species with spawning potential ratio values ≤30. From left to right: Naso unicornis, Naso hexacanthus, Scarus rubroviolaceus, Aprion virescens, and Caranx ignobilis.
Similar to univariate and multivariate trends reported earlier, target herbivorous species were scarce at depths greater than 30 m (Figure 10). In contrast, patterns in targeted planktivore abundance varied among species with N. brevirostris more abundant in 0–30 m and N. hexacanthus more abundant in deeper water. Generalist macropiscivore depth distributions varied widely between depth-specialists (e.g., Seriola dumerili) and generalists (most species). The two fishery-depleted macropiscivores were similarly variable, with A. virescens occupying multiple depths and habitat strata, whereas Caranx ignobilis was exclusively recorded at mesophotic hard-bottom and unconsolidated sediments sites.
Endemism
In total, 32 endemic species were recorded during surveys (Table S1), constituting between 18 and 20% of total abundance between 0 and 30 and 30–53 m, and 29% in 53–100 m, driven largely by increases in abundance of the schooling planktivore C. jordani and mobile invertivore P. chrysonemus in the lower meosphotic. No significant decreases in total abundance of endemics were detected between strata outside of 53–100 m unconsolidated sediment habitats (Table S3, Figure S3B). However, endemic richness was highest in shallow waters (18% of overall species richness), declining to 13% in 30–53 and 53–100 m, with all pair-wise tests showing significant values (p < 0.05) among hard-bottom substrates. Endemic communities had significant SIMPROF groupings (Figure S3C) and species overlaps (Figure S3D) between shallow water and upper mesophotic strata (e.g., Chaetodon multicinctus, Canthigaster jactator). Finally, 35% of the endemic species were recorded exclusively in ≤30 m, 26% in >30 m, with the remaining 39% exhibiting overlapping distributions between shallow water and one or both mesophotic depth zones.
Habitat Characterization and Environmental Linkages
The principal component analysis (PCA) showed 63% of total variation was explained by the first two principal axes. Increased hard coral cover and habitat complexity between overlapping, hard-bottom shallow water and upper mesophotic sites contrasted against deeper, lower complexity sites hosting increased unconsolidated sediment (sand) cover. Macroalgae were orthogonal to the first principal axis, increasing along the second principal axis in-part as a result of Halimeda sp. meadows (≥45% biotic cover) encountered in the Maui-Nui sampling region (60% of total sampling sites between 30 and 53 m; 30% of sites between 30 and 100 m; Figure S6).
Examination of the multivariate regression revealed habitat complexity, depth, and percent cover of unconsolidated sediment and macroalgae to be the principal environmental variables structuring reef fish assemblages (Figure 11). The MRT assigned 23% of full model assemblage variation parsed into five separate species groups, with the first major node-split separating a small number of mobile invertivore and generalist macropiscivore species likely to be found at deep, benthic-depauperate sand flats with greater than 91% unconsolidated sediment cover (21 sites). The subsequent habitat complexity node-split at 2.5 aligned with a combination of herbivores (Melichthys vidua, Naso lituratus, Zebrasoma flavescens), the planktivore M. niger, several mobile invertivores (T. duperrey, Parupeneus multifasciatus, Sufflamen bursa), the sessile macropiscivore (moray Gymnothorax flavimarginatus), and two piscivorous species (Cephalopholis argus, oxycheilinus unifasciatus) indicative of groupings synonymous with more structurally developed, hard-bottom substrates encountered in shallow water and/or upper mesophotic zones (32 sites). Finally, reef fish communities inhabiting lower complexity habitats (<2.5) were further split at 53.6 m, with shallow water and upper mesophotic sites (35) largely defined by a small group of mobile invertivores and the herbivore Cantigaster jactator, while deeper sites were further delineated by macroalgal cover largely attributed to Halimeda sp. meadows encountered in the Maui-Nui region. Both terminal leaves were largely dominated by mobile invertivores, planktivores, and generalist macropiscivore species. It is important to note that placement of MRT indicator species at a particular tree location does not imply site restriction, as many were found in an array of depths, substrate types, and survey sites resulting in 77% of assemblage variation remaining unexplained; however, DLI species assignments serve as encounter predictors given particular benthic characteristics.
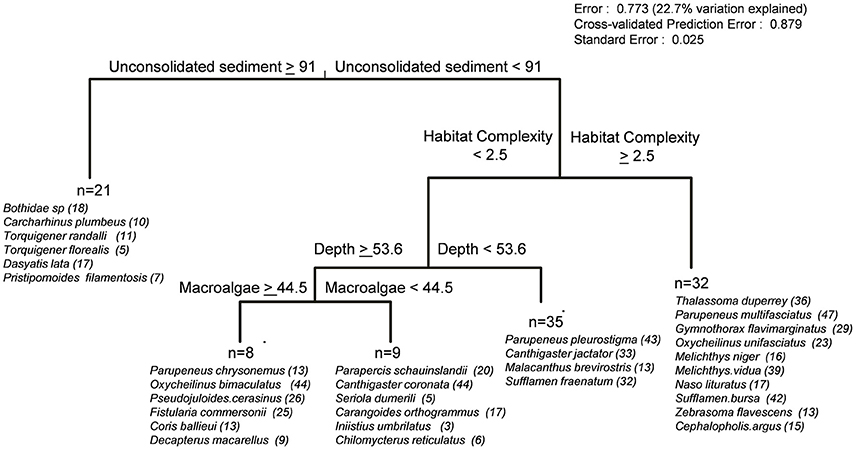
Figure 11. Multivariate regression tree illustrating relative abundance of reef fishes in relation to continuous environmental variables. Significant indicator species (p < 0.05, maximum number of 10 species per leaf) are listed in order of decreasing DLI values, along with the number of sites where a species was encountered.
The DISTLM-dbRDA ordination similarly accounted for 23.5% of the total variation with the same environmental variables listed as the MRT, along with the addition of hard-coral as a contributing environmental covariate. Additional details are described in Figure S7.
Discussion
This study provides the first in situ BRUVS assessment of reef fish communities across shallow water to mesophotic zones in the main Hawaiian Islands. Depth, habitat complexity, macroalgal cover, and unconsolidated sediment acted as influential reef fish assemblage drivers. While a variety of other potential environmental co-contributors, ranging from temperature, hydrodynamics, and sedimentation could also affect the distribution of organisms in mesophotic depths, these remain unaddressed in the scope of this work (Locker et al., 2010; Kahng et al., 2014).
Community shifts similar to patterns observed in other tropical (e.g., Red Sea, Marshall Islands, Puerto Rico, Honduras) and sub-tropical ecosystems, (e.g., South Africa, NWHI), included declines in herbivore abundance with depth, even in mesophotic habitats hosting high levels of macroalgal cover (Thresher and Colin, 1986; Feitoza et al., 2005; Brokovich et al., 2010; Bejarano et al., 2014; Kane et al., 2014; Andradi-Brown et al., 2016; Fukunaga et al., 2016). While planktivore relative abundance and richness measures were relatively similar across depth strata (Figure 6B), their proportional abundances was highest in the lower mesophotic zone (Figure S1), aligning with depth-based planktivore density and/or biomass peaks recorded in other mesophotic studies (Thresher and Colin, 1986; Feitoza et al., 2005; Fukunaga et al., 2016).
The decline of herbivores outside of shallow waters, and increased numbers of mobile invertivores in the upper mesophotic zone, indicate possible shifts in benthic primary productivity sources and compels additional nutrient cycling research between depth and habitat strata (Hilting et al., 2013; Fukunaga et al., 2016). In addition, while isotopic evidence suggests predators remain heavily reliant on resources between 0 and 30 m acting as nutrient conduits to mesophotic depths (Meyer et al., 2001; Wetherbee et al., 2004; Papastamatiou et al., 2006, 2015; Hilting et al., 2013), marked increases in schooling mobile invertivores (e.g., goatfishes) and planktivores (e.g., C. jordani, Decapterus macarellus) may serve as deep-water prey-bases for predators in the MHI (Smith and Parrish, 2002). As with schooling behaviors observed on Halimeda meadows (see below), potential prey species were observed seeking shelter in algal canopies or retreating to hard-bottom interstitial spaces during transits by generalist macropiscivores—particularly jacks and A. virescens—within the BRUVS frame of view (J. Asher, pers. obs.).
Of particular interest were mesophotic sand flats and lower-complexity hard-bottom habitats which hosted extensive calcareous Halimeda meadows, which generally harbored more limited reef fish communities in comparison with more structurally complex habitats. The abundance of mobile invertivores (70% of total community), rather than herbivores, was noted in these areas as Halimeda are relatively unpalatable to most herbivorous reef fishes (Lewis, 1985; Spalding, 2012). We observed generalist macropiscivores foraging in these habitats Figures 12B–D), with individuals or small-mixed groups of C. melampygus, C. orthogrammus, Caranx ignobilis, and/or A. virescens seen transiting though Halimeda meadows, typically with prey species fleeing or seeking shelter in algal canopies (J. Asher, pers. obs). Juvenile tiger sharks (Galecerdo cuvier) were also observed transiting along Halimeda sp. meadows, indicating possible habitat use as part of their generalist approach to feeding on a wide variety of potential prey items (Werry et al., 2014). Finally, juvenile bottom-fish P. filamentosis (9–30 cm) were also seen schooling in mesophotic Halimeda meadows in the Maui-Nui region in as little as 54 m, suggesting that those habitats may be foraging or refuge areas used by bottom-fish, prior to ontogenic migration into deeper habitats upon maturity.
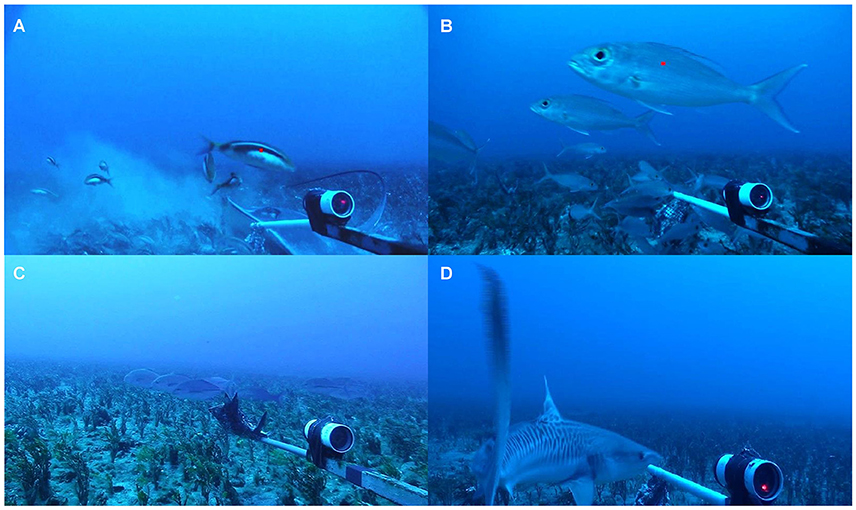
Figure 12. Videographic frame-grabs of mesophotic Halimeda sp. meadows sampled in the Maui-Nui complex. (A) School of Parupeneus chrysonemus and solitary Dasyatis lata feeding on bait bag contents, (B) mixed school of Caranx melampygus and Carangoides orthogrammus, (C) juvenile Pristipomoides filamentosis (bottom-fish), (D) juvenile Galecerdo cuvier.
Despite the apparent linkages maintained by depth-generalists, particularly those inhabiting shallow water and upper mesophotic strata, (Tenggardjaja et al., 2014; Papastamatiou et al., 2015), community linkages and species movements between strata are still largely uncharacterized in the MHI. This remains an important focus for future MHI research, particularly for those species subject to high fishing pressures around human population centers. The majority (70%) of target species were encountered in mesophotic depths, including all but one of the species where there is strong evidence of fishery depletion based on shallow water surveys (Figure 10), albeit with the majority of species having lower overall mesophotic abundance levels than in 0–30 m. Generalist macropiscivores, which remain one of the more susceptible groups to fishing pressures, had ~50% greater abundance on hard-bottom substrates in the upper mesophotic zone compared to shallow water. Higher mesophotic abundances of some groups, and changes in predator communities is a potential indicator of depth refugia (Thresher and Colin, 1986; Bejarano et al., 2014; Andradi-Brown et al., 2016; Lindfield et al., 2016), particularly for the fishery-depleted target species that were more abundant in mesophotic depths (e.g., A. virescens, Caranx ignobilis, Figures 8D, 10), or for redatory species with larger mesophotic body sizes (e.g., C. melampygus, Figure 9C). Given that assessments of MHI reef fish stock exploitation rates and annual catch assignments remain largely constrained to fishery-independent, open-circuit diver depths (i.e., ≤30 m) or fisheries-dependent, commercial catch/recreational survey data obtained from indeterminate depths (Nadon et al., 2015), the use of BRUVS serves as a promising, shallower compliment to the deep-water camera system (BotCam) utilized for Hawaiian bottom fish stock assessments (Merritt et al., 2011). Finally, additional research parsing depth refugia vs. ontogeny effects in structuring reef fish communities would be beneficial, as larger-sized mesophotic planktivores (Figure 9B) could be attributed to ontogenic migrations (Andradi-Brown et al., 2016) and may be less prone to mesophotic predation in lower-complexity habitats that do not provide adequate shelter to more vulnerable size classes.
Mesophotic reef fish community breaks have been proposed at ~60 m (Slattery et al., 2011; Fukunaga et al., 2016), with community, functional group, and assessed environmental structural outputs generally supporting this premise. However, community compositions were largely distinct between shallow water and upper mesophotic zones, indicating the potential for depth-based refugia may be limited to depth-generalists and not depth-zone specialists, e.g., specific mobile invertivores and generalist macropiscivores that are equally, if not more abundant in 30–53 than in <30 m, with the possibility of refugia further declining when transitioning to more comparably depauperate lower mesophotic communities. While mesophotic reef fish communities may provide meaningful refugia for some species, shallow-water specialists are clearly unlikely to be able to benefit in that way (Fukunaga et al., 2016). Conversely, given that many MHI depth generalists decline when transitioning from shallow water to mesophotic systems seen here and in other studies (Pyle et al., 2016), mesophotic reef fish communities affected by hypothetical biological impacts (e.g., lionfish invasions in the Atlantic) or anthropogenic perturbations (e.g., dredging) may end up reliant on shallow water systems for repopulation. Outside of a small number of species investigations (e.g., Chromis verater), the movements of fish larvae between shallow water and mesophotic strata remains largely unknown and remains an important focus for future research (Tenggardjaja et al., 2014).
MCEs in the NWHI appear to be reservoirs of extremely high levels of endemic biodiversity (Kane et al., 2014; Kosaki et al., 2016). In our study, BRUVS showed comparable MHI shallow water and upper mesophotic endemism levels as those documented by underwater visual census surveys in <30 m in the MHI (Randall, 1998; DeMartini and Friedlander, 2004; Pyle et al., 2016). However, declines in proportionate abundance (excluding two schooling species) and richness (Figures S3B–E) in the lower mesophotic zone conflict with patterns of those seen during technical dive surveys in the NWHI and submersible/technical dive surveys in the MHI. This may be attributed, in part, to these studies targeting specific habitats, e.g., hard-bottom, structurally complex slopes and ledges (Kane et al., 2014; Kosaki et al., 2016) or the Leptoseris sp. beds in the Maui-Nui region known to host large, localized endemic populations of fishes. In contrast our MHI mesophotic BRUVS surveys tended to sample mostly lower complexity habitats, e.g., low-lying aggregate Montipora reefs, rubble flats, and sand flats, which appear to be the most common habitats in those depths at our study locations.
Results from BRUVS surveys in the Main Hawaiian Islands should be interpreted with several caveats. Largely as a byproduct of the incomplete bathymetric data, the majority of lower-mesophotic deployments occurred on 100% unconsolidated sediment (27 sites), with only 10 sites sampling hard-bottom habitats (aggregate reef, aggregate patch reefs, consolidated rubble flats). None of our deeper sites were of the, in some places extensive, 90 m+ Leptoseris coral communities that have been shown to host rich reef fish communities in the Maui-Nui region (Costa et al., 2015). As a result, several functional groups (e.g., corallivores) were largely absent in our surveys outside of 53 m, although we know they can be abundant in some habitats.
As with all underwater visual censuses, BRUVS rare subject to possible sampling biases. These include the potential inflation of density estimates due to fish being drawn from outside visible sampling areas, unknown areas of attraction as a byproduct of variable bait plume dispersion, alteration of fish behaviors, competitive exclusion, and/or preferential sampling of predator and scavenger populations with corresponding reductions to other functional groups (Harvey et al., 2007; Colton and Swearer, 2010; Dorman et al., 2012). However, comparisons between baited and unbaited camera stations have shown that while carnivore and scavenger abundances tend to increase in the presence of bait, no commensurate changes are typically detected in herbivore or omnivore abundances (Watson et al., 2005; Harvey et al., 2007). The lack of bait-induced declines among non-carnivorous functional groups could be explained by possible “sheep effects,” whereby species not directly attracted to bait plumes are attracted to the feeding activities of others around BRUVS, or conspecific social attraction behaviors (Watson et al., 2005, 2010; Harvey et al., 2007; Dorman et al., 2012). Finally, underwater sampling visibility was, in general, much higher than the required BRUVS sampling minimum (7 m), even in mesophotic depths to 100 m. While the authors detected no depth-associated, functional group or species-level behavior alterations as a result of reduced light attenuation in deeper strata, coral reef fishes are known to exhibit behavioral shifts in response to varying light levels, which merits additional consideration for future mesophotic research (Rickel and Genin, 2005).
Mesophotic reefs remain infrequently explored throughout the Indo-Pacific region and likely still host numerous undiscovered fish species (Pyle, 2001). While shallow water and upper mesophotic reef fish communities are highly connected, these zones have their own distinct functional group assemblages, becoming even more dissimilar in lower depths. In light of anthropogenic and climate-based pressures in shallower waters, coupled with substantial data-gaps for the many reef fish species present in both shallow water and mesophotic habitats, there is a strong need to continue research into depth zone connectivity, along with species and life-stage distributions, in order to develop appropriate and comprehensive coral reef resource management strategies.
Author Contributions
JA, IW, and EH conceived and designed the experiments. JA performed field experiments, analyzed the data, wrote the main manuscript, and prepared all figures unless otherwise specified. JA and EH contributed materials and analysis tools. All authors reviewed the manuscript.
Funding
Funding for ship time, support staff, and field materials/consumables was provided by the National Oceanic and Atmospheric Administration (NOAA), National Marine Fisheries Service, Pacific Islands Fisheries Science Center (PIFSC) Director's Office, the Ecosystem Sciences Division, Science Operations Division, and the Fisheries Research and Monitoring Division. Funding for camera equipment was provided by the University of Western Australia and Curtin University. Videographic processing and analysis were funded by an IPRS/APA Scholarship, the NOAA Coral Reef Conservation Program, the NOAA PIFSC Ecosystem Sciences Division, Science Operations Division, and the Pacific Young Scientists Opportunity Program. All funders had no role in study design, data collection and analysis, decision to publish or preparation of the manuscript.
Conflict of Interest Statement
The authors declare that the research was conducted in the absence of any commercial or financial relationships that could be construed as a potential conflict of interest.
Acknowledgments
Scientific equipment, logistics, and funding support was provided by the University of Western Australia (UWA), Curtin University, NOAA PIFSC Coral Reef Ecosystem Program (CREP), NOAA Coral Reef Conservation Program, NOAA PIFSC Science Operations Division (SOD), and Papahānaumokuākea Marine National Monument. James Barlow, William Misa, Eric Mooney, and Louise Guiseffi from the NOAA PIFSC SOD, Dr. Benjamin Saunders from UWA, Marie Ferguson from the NOAA PIFSC CREP, and Mills Dunlap from the NOAA research vessel Oscar Elton Sette provided field assistance during data collection efforts. Special thanks go to the NOAA research vessels Hi'ialakai, Oscar Elton Sette, and the M/V Huki Pono. Hulali Kinilau, Karl Lindberg, and Andrew Gray assisted with videographic processing. Fish illustrations by Amanda Dillon, Figure 1 map by Tomoko Acoba (NOAA PIFSC CREP).
Supplementary Material
The Supplementary Material for this article can be found online at: http://journal.frontiersin.org/article/10.3389/fmars.2017.00098/full#supplementary-material
References
Anderson, M. J., and Walsh, D. C. (2013). PERMANOVA, ANOSIM, and the Mantel test in the face of heterogeneous dispersions: what null hypothesis are you testing? Ecol. Monogr. 83, 557–574. doi: 10.1890/12-2010.1
Anderson, M. J., and Willis, T. J. (2003). Canonical analysis of principal coordinates: a useful method of constrained ordination for ecology. Ecology 84, 511–525. doi: 10.1890/0012-9658(2003)084[0511:CAOPCA]2.0.CO;2
Anderson, M., Gourley, R. N., and Clarke, K. R. (2008). PERMANOVA+ for PRIMER: Guide to Software and Statistical Methods. Plymouth: PRIMER-E.
Andradi-Brown, D. A., Gress, E., Wright, G., Exton, D. A., and Rogers, A. D. (2016). Reef fish community biomass and trophic structure changes across shallow to upper-mesophotic reefs in the mesoamerican barrier reef, caribbean. PLoS ONE 11:e0156641. doi: 10.1371/journal.pone.0156641
Ayotte, P., McCoy, K., Heenan, A., Williams, I., and Zamzow, J. (2015). Coral Reef Ecosystem Program Standard Operating Procedures: Data Collection for Rapid Ecological Assessment Fish Surveys. Honolulu, HI: Pacific Islands Fisheries Science Center; National Marine Fisheries Service.
Bak, R. P., Nieuwland, G., and Meesters, E. H. (2005). Coral reef crisis in deep and shallow reefs: 30 years of constancy and change in reefs of Curacao and Bonaire. Coral Reefs 24, 475–479. doi: 10.1007/s00338-005-0009-1
Baker, E. K., Puglise, K. A., and Harris, P. T. (eds.). (2016). Mesophotic Coral Ecosystems — A Lifeboat for Coral Reefs? Nairobi; Arendal: The United Nations Environment Programme and GRID-Arendal, p. 98.
Bejarano, I., Appeldoorn, R., and Nemeth, M. (2014). Fishes associated with mesophotic coral ecosystems in La Parguera, Puerto Rico. Coral Reefs 33, 313–328. doi: 10.1007/s00338-014-1125-6
Bernard, A., and Götz, A. (2012). Bait increases the precision in count data from remote underwater video for most subtidal reef fish in the warm-temperate Agulhas bioregion. Mar. Ecol. Prog. Ser. 471, 235–252. doi: 10.3354/meps10039
Beukers, J. S., and Jones, G. P. (1998). Habitat complexity modifies the impact of piscivores on a coral reef fish population. Oecologia 114, 50–59. doi: 10.1007/s004420050419
Blyth-Skyrme, V. J., Rooney, J. J., Parrish, F. A., and Boland, R. C. (2013). Mesophotic coral ecosystems—potential candidates as essential fish habitat and habitat areas of particular concern. Pac. Isl. Fish. Sci. Cent. Natl. Mar. Fish. Sci. Cent. Admin. Rep. H-13–H-02.
Boland, R. C., and Parrish, F. A. (2005). A Description of Fish assemblages in the black coral beds off Lahaina, Maui, Hawaii. Pac. Sci. 59, 411–420. doi: 10.1353/psc.2005.0032
Boland, R. C., Parrish, F. A., and Rooney, J. J. (2011). “Fish Communities of the Mesophotic Ecosystems in the Hawaiian Archipelago. Page 1,” in American Society of Limnology and Oceanography. ASLO Aquatic Sciences Meeting (San Juan, Puerto Rico).
Bongaerts, P., Ridgway, T., Sampayo, E. M., and Hoegh-Guldberg, O. (2010). Assessing the ‘deep reef refugia' hypothesis: focus on Caribbean reefs. Coral Reefs 29, 309–327. doi: 10.1007/s00338-009-0581-x
Borcard, D., Gillet, F., and Legendre, P. (2011). Numerical Ecology with R. New York, NY: Springer Science and Business Media.
Bradley, C. J., Wallsgrove, N. J., Choy, C. A., Drazen, J. C., Hetherington, E. D., Hoen, D. K., et al. (2015). Trophic position estimates of marine teleosts using amino acid compound specific isotopic analysis. Limnol. Oceanogr. Methods 13, 476–493. doi: 10.1002/lom3.10041
Bridge, T. C., Hughes, T. P., Guinotte, J. M., and Bongaerts, P. (2013). Call to protect all coral reefs. Nat. Clim. Chang. 3, 528–530. doi: 10.1038/nclimate1879
Brock, V. E., and Chamberlain, T. C. (1968). A geological and ecological reconnaissance off western Oahu, Hawaii, principally by means of the research submarine “Asherah”. Pac. Sci. 22, 373–394.
Brokovich, E., Einbinder, S., Shashar, N., Kiflawi, M., and Kark, S. (2008). Descending to the twilight-zone: changes in coral reef fish assemblages along a depth gradient down to 65 m. Mar. Ecol. Prog. Ser. 371, 253–262. doi: 10.3354/meps07591
Brokovich, E., Ayalon, I., Einbinder, S., Segev, N., Shaked, Y., Genin, A., et al. (2010). Grazing pressure on coral reefs decreases across a wide depth gradient in the Gulf of Aqaba, Red Sea. Mar. Ecol. Prog. Ser. 399, 69–80. doi: 10.3354/meps08354
Cappo, M., De'ath, G., and Speare, P. (2007). Inter-reef vertebrate communities of the Great Barrier Reef Marine Park determined by baited remote underwater video stations. Mar. Ecol. Prog. Ser. 350, 209–221. doi: 10.3354/meps07189
Clarke, K. R., Gorley, R. N., Somerfield, P. J., and Warwick, R. M. (2014). Change in Marine Communities: An Approach to Statistical Analysis and Interpretation, 3rd Edn. Plymouth: PRIMER-E.
Colton, M. A., and Swearer, S. E. (2010). A comparison of two survey methods: differences between underwater visual census and baited remote underwater video. Mar. Ecol. Prog. Ser. 400, 19–36. doi: 10.3354/meps08377
Costa, B., Kendall, M. S., Parrish, F. A., Rooney, J., Boland, R. C., Chow, M., et al. (2015). Identifying suitable locations for mesophotic hard corals offshore of Maui, Hawaii. PLoS ONE 10:e0130285. doi: 10.1371/journal.pone.0130285
De'Ath, G. (2007). mvpart: Multivariate Partitioning. R Package Version 1.2-4. rpart by T. M. Therneau and B. Atkinson. R port of rpart by B. Ripley. Some routines from vegan by J. Oksanen.
DeMartini, E. E., and Friedlander, A. M. (2004). Spatial patterns of endemism in shallow-water reef fish populations of the Northwestern Hawaiian Islands. Mar. Ecol. Prog. Ser. 271, 281–296. doi: 10.3354/meps271281
Dorman, S. R., Harvey, E. S., and Newman, S. J. (2012). Bait effects in sampling coral reef fish assemblages with stereo-BRUVs. PLOS ONE 7:41538. doi: 10.1371/journal.pone.0041538
Dufrene, M., and Legendre, P. (1997). Species assemblages and indicator species: the need for a flexible asymmetrical approach. Ecol. Monogr. 67, 345–366. doi: 10.2307/2963459
Ellis, D. M., and Demartini, E. E. (1995). Evaluation of a video camera technique for indexing abundances of juvenile pink snapper, pristipomoides-filamentosus, and other hawaiian insular shelf fishes. Fish. Bull. 93, 67–77.
Faith, D. P., Minchin, P. R., and Belbin, L. (1987). Compositional dissimilarity as a robust measure of ecological distance. Vegetatio 69, 57–68. doi: 10.1007/BF00038687
Feitoza, B. M., Rosa, R. S., and Rocha, L. A. (2005). Ecology and zoogeography of deep-reef fishes in northeastern Brazil. Bull. Mar. Sci. 76, 725–742.
Friedlander, A. M., and DeMartini, E. E. (2002). Contrasts in density, size, and biomass of reef fishes between the Northwestern and the main Hawaiian Islands: the effects of fishing down apex predators. Mar. Ecol. Prog. Ser. 230, 253–264. doi: 10.3354/meps230253
Froese, R., and Pauly, D. (2014). FishBase. Version (11/2014). World Wide Web electronic publication. Available online at: http://www.fishbase.org
Fukunaga, A., Kosaki, R. K., Wagner, D., and Kane, C. (2016). Structure of mesophotic reef fish assemblages in the Northwestern Hawaiian islands. PLoS ONE 11:e0157861. doi: 10.1371/journal.pone.0157861
Ghazilou, A., Shokri, M., and Gladstone, W. (2016). Animal v. plant-based bait: does the bait type affect census of fish assemblages and trophic groups by baited remote underwater video (BRUV) systems? J. Fish Biol. 88, 1731–1745. doi: 10.1111/jfb.12935
Ginsburg, R. (2007). “Mesophotic coral reefs are the frontier of reef exploration and research.” in Proceedings of the 33rd Scientific Meeting of the Association of Marine Laboratories of the Caribbean (AMLC).
Glynn, P. W. (1996). Coral reef bleaching: facts, hypotheses and implications. Glob. Chang. Biol. 2, 495–509. doi: 10.1111/j.1365-2486.1996.tb00063.x
Grigg, R. W. (2004). Harvesting impacts and invasion by an alien species decrease estimates of black coral yield off Maui, Hawai'i. Pac. Sci. 58, 1–6. doi: 10.1353/psc.2004.0006
Harvey, E., and Shortis, M. (1995). A system for stereo-video measurement of sub-tidal organisms. Mar. Technol. Soc. J. 29, 10–22.
Harvey, E. S., and Shortis, M. R. (1998). Calibration stability of an underwater stereo-video system: implications for measurement accuracy and precision. Mar. Technol. Soc. J. 32, 3–17.
Harvey, E. S., Cappo, M., Butler, J. J., Hall, N., and Kendrick, G. A. (2007). Bait attraction affects the performance of remote underwater video stations in assessment of demersal fish community structure. Mar. Ecol. Prog. Ser. 350, 245–254. doi: 10.3354/meps07192
Harvey, E. S., Newman, S. J., McLean, D. L., Cappo, M., Meeuwig, J. J., and Skepper, C. L. (2012). Comparison of the relative efficiencies of stereo-BRUVs and traps for sampling tropical continental shelf demersal fishes. Fish. Res. 125, 108–120. doi: 10.1016/j.fishres.2012.01.026
Harvey, E. S., Cappo, M., Kendrick, G. A., and McLean, D. L. (2013). Coastal fish assemblages reflect geological and oceanographic gradients within an Australian zootone. PLoS ONE 8:e80955. doi: 10.1371/journal.pone.0080955
Heenan, A., Ayotte, P., Gray, A., Lino, K., McCoy, K., Zamzow, J., et al. (2014). Pacific Reef Assessment and Monitoring Program - Data Report - Ecological Monitoring 2012-2013 - Reef Fishes and Benthic Habitats of the Main Hawaiian Islands, American Samoa, and Pacific Remote Island Areas. Honolulu, HI: Pacific Islands Fisheries Science Center.
Heyns-Veale, E., Bernard, A., Richoux, N., Parker, D., Langlois, T., Harvey, E., et al. (2016). Depth and habitat determine assemblage structure of South Africa's warm-temperate reef fish. Mar. Biol. 163, 1–17. doi: 10.1007/s00227-016-2933-8
Hilting, A. K., Currin, C., A., and Kosaki, R. K. (2013). Evidence for benthic primary production support of an apex predator–dominated coral reef food web. Mar. Biol. 160, 1681–1695. doi: 10.1007/s00227-013-2220-x
Jankowski, M., Graham, N., and Jones, G. (2015). Depth gradients in diversity, distribution and habitat specialisation in coral reef fishes: implications for the depth-refuge hypothesis. Mar. Ecol. Prog. Ser. 540, 203–215. doi: 10.3354/meps11523
Kahng, S. E., and Grigg, R. W. (2005). Impact of an alien octocoral, Carijoa riisei, on black corals in Hawaii. Coral Reefs 24, 556–562. doi: 10.1007/s00338-005-0026-0
Kahng, S. E., Garcia-Sais, J. R., Spalding, H. L., Brokovich, E., Wagner, D., Weil, E., et al. (2010). Community ecology of mesophotic coral reef ecosystems. Coral Reefs 29, 255–275. doi: 10.1007/s00338-010-0593-6
Kahng, S., Copus, J., and Wagner, D. (2014). Recent advances in the ecology of mesophotic coral ecosystems (MCEs). Curr. Opin. Environ. Sustain. 7, 72–81. doi: 10.1016/j.cosust.2013.11.019
Kane, C., and Tissot, B. N. (2016). “Evaluation potential mechanisms underlying trophic assemblage shifts in reef fishes from shallow to mesophotic depths,” in Hawaii [abstract]. 13th International Coral Reef Symposium (Honolulu, HI).
Kane, C., Kosaki, R. K., and Wagner, D. (2014). High levels of mesophotic reef fish endemism in the Northwestern Hawaiian Islands. Bull. Mar. Sci. 90, 693–703. doi: 10.5343/bms.2013.1053
Komyakova, V., Munday, P. L., and Jones, G. P. (2013). Relative importance of coral cover, habitat complexity and diversity in determining the structure of reef fish communities. PLoS ONE 8:e83178. doi: 10.1371/journal.pone.0083178
Kosaki, R. K., Pyle, R. L., Leonard, J. C., Hauk, B. B., Whitton, R. K., and Wagner, D. (2016). 100% endemism in mesophotic reef fish assemblages at Kure Atoll, Hawaiian Islands. Mar. Biodiv. 1–2.
Lachenbruch, P. A., and Mickey, M. R. (1968). Estimation of error rates in discriminant analysis. Technometrics 10, 1–11. doi: 10.1080/00401706.1968.10490530
Langlois, T. J., Fitzpatrick, B. R., Fairclough, D. V., Wakefield, C. B., Hesp, S. A., McLean, D. L., et al. (2012). Similarities between line fishing and baited stereo-video estimations of length-frequency: novel application of kernel density estimates. PLoS ONE 7:e45973. doi: 10.1371/journal.pone.0045973
Legendre, P., and Gallagher, E. D. (2001). Ecologically meaningful transformations for ordination of species data. Oecologia 129, 271–280. doi: 10.1007/s004420100716
Lesser, M. P., Slattery, M., and Leichter, J. J. (2009). Ecology of mesophotic coral reefs. J. Exp. Mar. Biol. Ecol. 375, 1–8. doi: 10.1016/j.jembe.2009.05.009
Lewis, S. M. (1985). Herbivory on coral reefs: algal susceptibility to herbivorous fishes. Oecologia 65, 370–375. doi: 10.1007/BF00378911
Lindfield, S. J., McIlwain, J. L., and Harvey, E. S. (2014). Depth refuge and the impacts of SCUBA spearfishing on coral reef fishes. PLoS ONE 9:e92628. doi: 10.1371/journal.pone.0092628
Lindfield, S. J., Harvey, E. S., Halford, A. R., and McIlwain, J. L. (2016). Mesophotic depths as refuge areas for fishery-targeted species on coral reefs. Coral Reefs. 35, 125–137. doi: 10.1007/s00338-015-1386-8
Locker, S. D., Armstrong, R. A., Battista, T. A., Rooney, J. J., Sherman, C., and Zawada, D. G. (2010). Geomorphology of mesophotic coral ecosystems: current perspectives on morphology, distribution, and mapping strategies. Coral Reefs 29, 329–345. doi: 10.1007/s00338-010-0613-6
MacNeil, M. A., Graham, N. A., Polunin, N. V., Kulbicki, M., Galzin, R., Harmelin-Vivien, M., et al. (2009). Hierarchical drivers of reef-fish metacommunity structure. Ecology 90, 252–264. doi: 10.1890/07-0487.1
Merritt, D., Donovan, M. K., Kelley, C., Waterhouse, L., Parke, M., Wong, K., et al. (2011). BotCam: a baited camera system for nonextractive monitoring of bottomfish species. Fish. Bull. 109, 56–67.
Meyer, C. G., Holland, K. N., Wetherbee, B. M., and Lowe, C. G. (2001). Diet, resource partitioning and gear vulnerability of Hawaiian jacks captured in fishing tournaments. Fish. Res. 53, 105–113. doi: 10.1016/S0165-7836(00)00285-X
Moffitt, R. B., Parrish, F. A., and Polovina, J. J. (1989). Community Structure, biomass and productivity of deep-water artificial reefs in Hawaii. Bull. Mar. Sci. 44, 616–630.
Nadon, M. O., Ault, J. S., Williams, I. D., Smith, S. G., and DiNardo, G. T. (2015). Length-based assessment of coral reef fish populations in the main and northwestern Hawaiian islands. PLoS ONE 10:e0133960. doi: 10.1371/journal.pone.0133960
Pacific Islands Benthic Habitat Mapping Center (2006). 2005 EM300 and EM3002D Multibeam Sonar Data from Cruise Hi'ialakai HI-05-05 - Main Hawaiian Islands. Geospatial_Data_Presentation_Form: Generic Sensor Format (GSF) Digital Data. Honolulu, HI: Pacific Islands Benthic Habitat Mapping Center (PIBHMC); Coral Reef Ecosystem Division(CRED); Pacific Islands Fisheries Science Center (PIFSC); NOAA National Marine Fisheries Service (NMFS).
Pacific Islands Benthic Habitat Mapping Center (2007). EM300 and EM3002D Multibeam Sonar Data from Cruise Hi'ialakai HI-06-05 – Main Hawiian Islands. Geospatial_Data_Presentation_Form: Generic Sensor Format (GSF) Digital Data. Honolulu, HI: Pacific Islands Benthic Habitat Mapping Center (PIBHMC); Coral Reef Ecosystem Division(CRED); Pacific Islands Fisheries Science Center (PIFSC); NOAA National Marine Fisheries Service (NMFS).
Pacific Islands Benthic Habitat Mapping Center (2009). Reson 8101ER Multibeam Sonar Data from Cruise AHI0902 – Main Hawaiian Islands. Main Hawiian Islands. Geospatial_Data_Presentation_Form: Generic Sensor Format (GSF) Digital Data. Honolulu, HI: Pacific Islands Benthic Habitat Mapping Center (PIBHMC); Coral Reef Ecosystem Division(CRED); Pacific Islands Fisheries Science Center (PIFSC); NOAA National Marine Fisheries Service (NMFS).
Papastamatiou, Y. P., Wetherbee, B. M., Lowe, C. G., and Crow, G. L. (2006). Distribution and diet of four species of carcharhinid shark in the Hawaiian Islands: evidence for resource partitioning and competitive exclusion. Mar. Ecol. Prog. Ser. 320, 239–251. doi: 10.3354/meps320239
Papastamatiou, Y. P., Meyer, C. G., Kosaki, R. K., Wallsgrove, N. J., and Popp, B. N. (2015). Movements and foraging of predators associated with mesophotic coral reefs and their potential for linking ecological habitats. Mar. Ecol. Prog. Ser. 521, 155–170. doi: 10.3354/meps11110
Pearson, R., and Stevens, T. (2015). Distinct cross-shelf gradient in mesophotic reef fish assemblages in subtropical eastern Australia. MEPS 532, 185–196. doi: 10.3354/meps11351
Pyle, R. L., Boland, R., Bolick, H., Bowen, B. W., Bradley, C. J., Kane, C., et al. (2016). A comprehensive investigation of mesophotic coral ecosystems in the Hawaiian Archipelago. Peer J 4:e2475. doi: 10.7717/peerj.2475
Pyle, R. (1996). Exploring deep coral reefs: How much biodiversity are we missing? Glob. Biodivers. 6, 3–7.
Pyle, R. L. (2000). Assessing undiscovered fish biodiversity on deep coral reefs using advanced self-contained diving technology. Mar. Technol. Soc. J. 34, 82–91. doi: 10.4031/MTSJ.34.4.11
Pyle, R. L. (2001). B.P. Bishop Museum Exploration and Discovery: the Coral-Reef Twilight Zone, Fagatele Bay National Marine Sanctuary. Honolulu, HI: Bernice Pauahi Bishop Museum.
Randall, J. E. (1998). Zoogeography of shore fishes of the Indo-Pacific region. Zool. Stud. TAIPEI 37, 227–268.
Randall, J. E. (2007). Reef and shore fishes of the Hawaiian Islands. Sea Grant College Program, University of Hawaii.
Rao, C. R. (1995). A review of canonical coordinates and an alternative to correspondence analysis using Hellinger distance. Qüestiió 19, 23–63.
Rickel, S., and Genin, A. (2005). Twilight transitions in coral reef fish: the input of light-induced changes in foraging behaviour. Anim. Behav. 70, 133–144. doi: 10.1016/j.anbehav.2004.10.014
Riegl, B., and Piller, W. E. (2003). Possible refugia for reefs in times of environmental stress. Int. J. Earth Sci. 92, 520–531. doi: 10.1007/s00531-003-0328-9
Rooney, J., Donham, E., Montgomery, A., Spalding, H., Parrish, F., Boland, R., et al. (2010). Mesophotic coral ecosystems in the Hawaiian Archipelago. Coral Reefs 29, 361–367. doi: 10.1007/s00338-010-0596-3
Rosa, M. R., Alves, A. C., Medeiros, D. V., Coni, E. O. C., Ferreira, C. M., Ferreira, B. P., et al. (2016). Mesophotic reef fish assemblages of the remote St. Peter and St. Paul's Archipelago, Mid-Atlantic Ridge, Brazil. Coral Reefs 35, 113–123. doi: 10.1007/s00338-015-1368-x
Seager, J. (2008). SEAGIS CAL and Photomeasure stereo photogrametric calibration and analysis software. SEAGIS Pty Ltd.
Sheather, S. J., and Jones, M. C. (1991). A reliable data-based bandwidth selection method for kernel density estimation. J. R. Stat. Soc. Ser. B 683–690.
Shortis, M. R., and Harvey, E. S. (1998). Design and calibration of an underwater stereo-video system for the monitoring of marine fauna populations. Int. Arch. Photogramm. Remote Sens. 32, 792–799.
Slattery, M., Lesser, M. P., Brazeau, D., Stokes, M. D., and Leichter, J. J. (2011). Connectivity and stability of mesophotic coral reefs. J. Exp. Mar. Biol. Ecol. 408, 32–41. doi: 10.1016/j.jembe.2011.07.024
Smith, G., and Parrish, J. (2002). Estuaries as nurseries for the jacks Caranx ignobilis and Caranx melampygus (Carangidae) in Hawaii. Estuar. Coast. Shelf Sci. 55, 347–359. doi: 10.1006/ecss.2001.0909
Sokal, R. R., and Rohlf, F. J. (1962). The comparison of dendrograms by objective methods. Taxon 33–40. doi: 10.2307/1217208
Spalding, H. L. (2012). Ecology of mesophotic macroalgae and Halimeda kanaloana meadows in the main Hawaiian Islands. [Honolulu]: [University of Hawaii at Manoa],[August 2012].
Stamoulis, K. A., Poti, M., Delevaux, J. M. S., Donovan, M. K., Friedlander, A., and Kendall, M. S. (2016). “Chapter 4: Fishes - Reef Fish. 156–196,” in Marine Biogeographic Assessment of the Main Hawaiian Islands. Bureau of Ocean Energy Management and National Oceanic and Atmospheric Administration. OCS Study BOEM 2016-035 and NOAA Technical Memorandum NOS NCCOS 214, eds B. M. Costa and M. S. Kendall, p. 359.
Strasburg, D. W., Jones, E. C., and Iversen, R. T. (1968). Use of a small submarine for biological and oceanographic research. J. du Cons. 31, 410–426. doi: 10.1093/icesjms/31.3.410
Tenggardjaja, K. A., Bowen, B. W., and Bernardi, G. (2014). Vertical and horizontal genetic connectivity in chromis verater, an endemic damselfish found on shallow and mesophotic reefs in the hawaiian archipelago and adjacent johnston atoll. PLoS ONE 9:e115493. doi: 10.1371/journal.pone.0115493
Thresher, R. E., and Colin, P. L. (1986). Trophic structure, diversity and abundance of fishes of the deep reef (30–300m) at Enewetak, Marshall Islands. Bull. Mar. Sci. 38, 253–272.
Veazey, L. M., Franklin, E. C., Kelley, C., Rooney, J., Frazer, L. N., and Toonen, R. J. (2016). The implementation of rare events logistic regression to predict the distribution of mesophotic hard corals across the main Hawaiian Islands. Peer J 4:e2189. doi: 10.7717/peerj.2189
Wagner, D., Kosaki, R. K., Spalding, H. L., Whitton, R. K., Pyle, R. L., Sherwood, A. R., et al. (2014). Mesophotic surveys of the flora and fauna at Johnston Atoll, Central Pacific Ocean. Mar. Biodivers. Rec. 7:e68. doi: 10.1017/S1755267214000785
Walsh, A. T., Barrett, N., and Hill, N. (2016). Efficacy of baited remote underwater video systems and bait type in the cool-temperature zone for monitoring ‘no-take’ marine reserves. Mar. Freshw. Res. 68, 568–580. doi: 10.1071/MF15165
Wand, M., and Jones, M. (1995). Kernel Smoothing, Vol. 60 of Monographs on statistics and applied probability. Chapman and Hall, London.
Wand, M., and Ripley, B. (2011). KernSmooth: Functions for kernel smoothing for Wand and Jones (1995). R package version 2.23-15. Accessed 2016 July 1, Available online at: https://cran.r-project.org/web/packages/KernSmooth/index.html
Watson, D. L., Harvey, E. S., Anderson, M. J., and Kendrick, G. A. (2005). A comparison of temperate reef fish assemblages recorded by three underwater stereo-video techniques. Mar. Biol. 148, 415–425. doi: 10.1007/s00227-005-0090-6
Watson, D. L., Harvey, E. S., Fitzpatrick, B. M., Langlois, T. J., and Shedrawi, G. (2010). Assessing reef fish assemblage structure: how do different stereo-video techniques compare? Mar. Biol. 157, 1237–1250. doi: 10.1007/s00227-010-1404-x
Werry, J. M., Planes, S., Berumen, M. L., Lee, K. A., Braun, C. D., and Clua, E. (2014). Reef-fidelity and migration of tiger sharks, Galeocerdo cuvier, across the Coral Sea.
Wetherbee, B. M., Holland, K. N., Meyer, C. G., and Lowe, C. G. (2004). Use of a marine reserve in Kaneohe Bay, Hawaii by the giant trevally, Caranx ignobilis. Fish. Res. 67, 253–263. doi: 10.1016/j.fishres.2003.11.004
Whittaker, R. H. (1960). Vegetation of the Siskiyou mountains, Oregon and California. Ecol. Monogr. 30, 279–338. doi: 10.2307/1943563
Willis, T. J., and Babcock, R. C. (2000). A baited underwater video system for the determination of relative density of carnivorous reef fish. Mar. Freshw. Res. 51, 755–763. doi: 10.1071/MF00010
Willis, T. J., Millar, R. B., and Babcock, R. C. (2000). Detection of spatial variability in relative density of fishes: comparison of visual census, angling, and baited underwater video. Mar. Ecol. Prog. Ser. 198, 249–260. doi: 10.3354/meps198249
Keywords: mesophotic coral ecosystems, BRUVS, fish assemblages, functional groups, depth refugia, endemism, Main Hawaiian Islands
Citation: Asher J, Williams ID and Harvey ES (2017) Mesophotic Depth Gradients Impact Reef Fish Assemblage Composition and Functional Group Partitioning in the Main Hawaiian Islands. Front. Mar. Sci. 4:98. doi: 10.3389/fmars.2017.00098
Received: 24 December 2016; Accepted: 23 March 2017;
Published: 19 April 2017.
Edited by:
Jesus Ernesto Arias González, Cinvestav-IPN, MexicoReviewed by:
Richard L. Pyle, Bernice P. Bishop Museum, USAAldo Cróquer, Simón Bolívar University, Venezuela
Copyright © 2017 Asher, Williams and Harvey. This is an open-access article distributed under the terms of the Creative Commons Attribution License (CC BY). The use, distribution or reproduction in other forums is permitted, provided the original author(s) or licensor are credited and that the original publication in this journal is cited, in accordance with accepted academic practice. No use, distribution or reproduction is permitted which does not comply with these terms.
*Correspondence: Jacob Asher, amFjb2IuYXNoZXJAbm9hYS5nb3Y=