Abstract
Deep-sea areas characterized by the presence of polymetallic nodules are getting increased attention due to their potential commercial and strategic interest for metals such as nickel, copper, and cobalt. The polymetallic nodules occur in areas beyond national jurisdiction, regulated by the International Seabed Authority (ISA). Under exploration contracts, contractors have the obligation to determine the environmental baseline in the exploration areas. Despite a large number of scientific cruises to the central east Pacific Ocean, few published data on the macrofaunal biodiversity and community structure are available for the abyssal fields of the Clarion-Clipperton Fracture Zone (CCFZ). This study focused on the macrofaunal abundance, diversity, and community structure in three physically comparable, mineable sites located in the license area of Global Sea Mineral Resources N.V. (GSR), at ~4,500 m depth. A homogeneous but diverse macrofaunal community associated with the sediment from polymetallic nodule areas was observed at a scale of 10 to 100 s of km. However, slight differences in the abundance and diversity of Polychaeta between sites can be explained by a decline in the estimated flux of particulate organic carbon (POC) along a southeast-northwest gradient, as well as by small differences in sediment characteristics and nodule abundance. The observed homogeneity in the macrofaunal community is an important prerequisite for assigning areas for impact and preservation reference zones. However, a precautionary approach regarding mining activities is recommended, awaiting further research during the exploration phase on environmental factors structuring macrofaunal communities in the CCFZ. For instance, future studies should consider habitat heterogeneity, which was previously shown to structure macrofauna communities at larger spatial scales. Acknowledging the limited sampling in the current study, a large fraction (59–85%; depending on the richness estimator used and the macrofaunal taxon of interest) of the macrofaunal genus/species diversity from the habitat under study was characterized.
Introduction
For a long time, hard substrates were thought to be relatively uncommon in the deep sea, but they can occur in regions with recent volcanic activity (hydrothermal vents, mid-ocean ridges), in seeps with carbonate crust formation, in submarine canyons, on seamounts, or in areas with low sedimentation rates. The latter areas allow the development of polymetallic nodules: black spheroidal to discoïdal bodies composed mainly of manganese, iron, silicates and hydroxides, as well as trace metals such as nickel, copper, cobalt, and molybdenum, and rare earth elements (REE; Halbach et al., 1975; Halbach and Fellerer, 1980). Polymetallic nodules were first discovered in 1873 during the historic voyage of HMS Challenger. Researchers in the second half of the twentieth century, discovered that these nodules cover vast areas of the ocean floor below 4,000 m, with highest abundances in the Central Indian Basin (CIB), the Peru basin and especially the area in the equatorial Pacific Ocean off the west coast of Mexico, known as the Clarion-Clipperton Fracture Zone (CCFZ).
Mero (1965) was the first to recognize the potential commercial and strategic interest of the nodules, and in the near future, polymetallic nodules will likely be mined in order to meet growing demands of metals such as nickel, copper, and cobalt (Clark et al., 2013). The polymetallic nodules occur in areas beyond national jurisdiction in common heritage of mankind and are thus regulated by the International Seabed Authority (ISA; Wedding et al., 2015). Anno 2016, the ISA has allocated license areas for potential mining to 15 national and industrial groups of contractors, which are engaged in the assessment of the resources in the area and the environmental assessments prior to mining activities. On the 14th of March 2013, Global Sea Mineral Resources N.V. (GSR) was granted a license for the exploration of polymetallic nodules for a period of 15 years, for an area encompassing 76,728 km2 in the eastern part of the CCFZ.
Mining for polymetallic nodules will inevitably impact the fauna in the area, not only by removing the nodules themselves, but also by the resuspension and redeposition of sediments in an otherwise very stable habitat (Jumars, 1981; Ingole et al., 2001; Thiel et al., 2001). Therefore, as recommended by the ISA, prior to (test) mining it is important to determine the environmental baseline in the exploration area, to gain insight into natural processes such as dispersion and settling of particles and benthic faunal succession, and to gather other data that may make it possible to acquire the capability necessary to make accurate environmental impact predictions (ISA-LTC, 2013). Moreover, because the populations of fauna associated with polymetallic nodule areas will be subsets of meta-populations that interact through dispersal and colonization, it is important to know the degree of isolation of populations associated with the areas where nodules will be removed and whether a given population serves as a critical brood stock for other populations (ISA-LTC, 2013).
Previous studies have indicated that the presence of nodules influences the abundance, community composition, and distribution of meiofauna, macrofauna, and megafauna in the CCFZ (e.g., Mullineaux, 1987; Tilot, 2006; Veillette et al., 2007; Smith et al., 2008; Vanreusel et al., 2016). Moreover, at regional scales, polymetallic nodules enhance biodiversity of the deep-sea benthos (Smith et al., 2008). Regions exposed to nodule mining are therefore crucial areas from a biodiversity conservation point of view (Smith et al., 2008). Although some (mostly) negative experimental disturbance effects have been observed (Borowski and Thiel, 1998; Bluhm, 2001; Ingole et al., 2001; Radziejewska et al., 2001; Miljutin et al., 2011), predicting the impact of nodule mining on biodiversity remains difficult because of the poor ecological baseline knowledge of the area. Hence, in order to understand the possible impact of future mining of deep-sea mineral resources, knowledge of the fauna associated with areas of nodules is crucial. Despite the recently large number of scientific cruises to the central east Pacific Ocean, still very little is known of the macrofaunal biodiversity and community structure at the abyssal fields of the CCFZ (Paterson et al., 1998; Glover et al., 2002; Smith et al., 2008; Janssen et al., 2015) and almost no published data are available on the macrofaunal composition in the GSR license area (but see: Hecker and Paul, 1979; Wilson, 2016). The lack of biological data from the CCFZ and the deep sea in general is linked to its remoteness, the consequently high financial cost associated with deep-sea sampling, and difficulties in observing and sampling organisms.
To bridge this knowledge gap, we conducted a base line study collecting quantitative data on macrofaunal abundance, taxonomic composition, and diversity in the GSR license area, focusing on three sites with a high suitability for deep-sea mining. We hypothesize that (1) macrofaunal community composition does not vary over scales of 10 to 100 s of km, and (2) polymetallic nodule abundance, coverage, and volume do not structure the macrofaunal community in the GSR license area. In addition, we estimated the minimum number of samples required to detect the majority of the estimated species richness in nodule rich sediments of the GSR license area.
Materials and methods
Study area and sampling design
The biological and environmental sampling conducted during expedition GSRNOD15A served as a biological baseline study gathering data on the fauna and relevant environmental variables within the Global Sea Mineral Resources N.V. (GSR) license area, centered around 12–17° N, 122–129° W in the CCFZ. The CCFZ is located in the mesotrophic Pacific abyss, positioned between the eutrophic abyssal sediments around the equator and the oligotrophic sediments underlying the North Pacific central gyre. GSRNOD15A samples were collected from September 10th to October 19th 2015 aboard the RV “Mt. Mitchell” at depths varying from 4,470 to 4,569 m. Within the GSR license area, three 10 × 20 km sampling sites (B6S02, B4S03, and B4N01) located between ~60 and 270 km apart from each other (Figure 1) were selected based on the presence of polymetallic nodules and suitability for future deep-sea mining from (1) available ecological literature, (2) bathymetry and slope maps, and (3) backscatter intensity data (giving an indication of the potential presence of polymetallic nodules) collected during a previous expedition to the license area (August–September 2014). Although we lacked a comprehensive evaluation of the habitat heterogeneity covered by the selected sites, sites were expected to be as similar as possible with respect to bathymetry and slope.
Figure 1
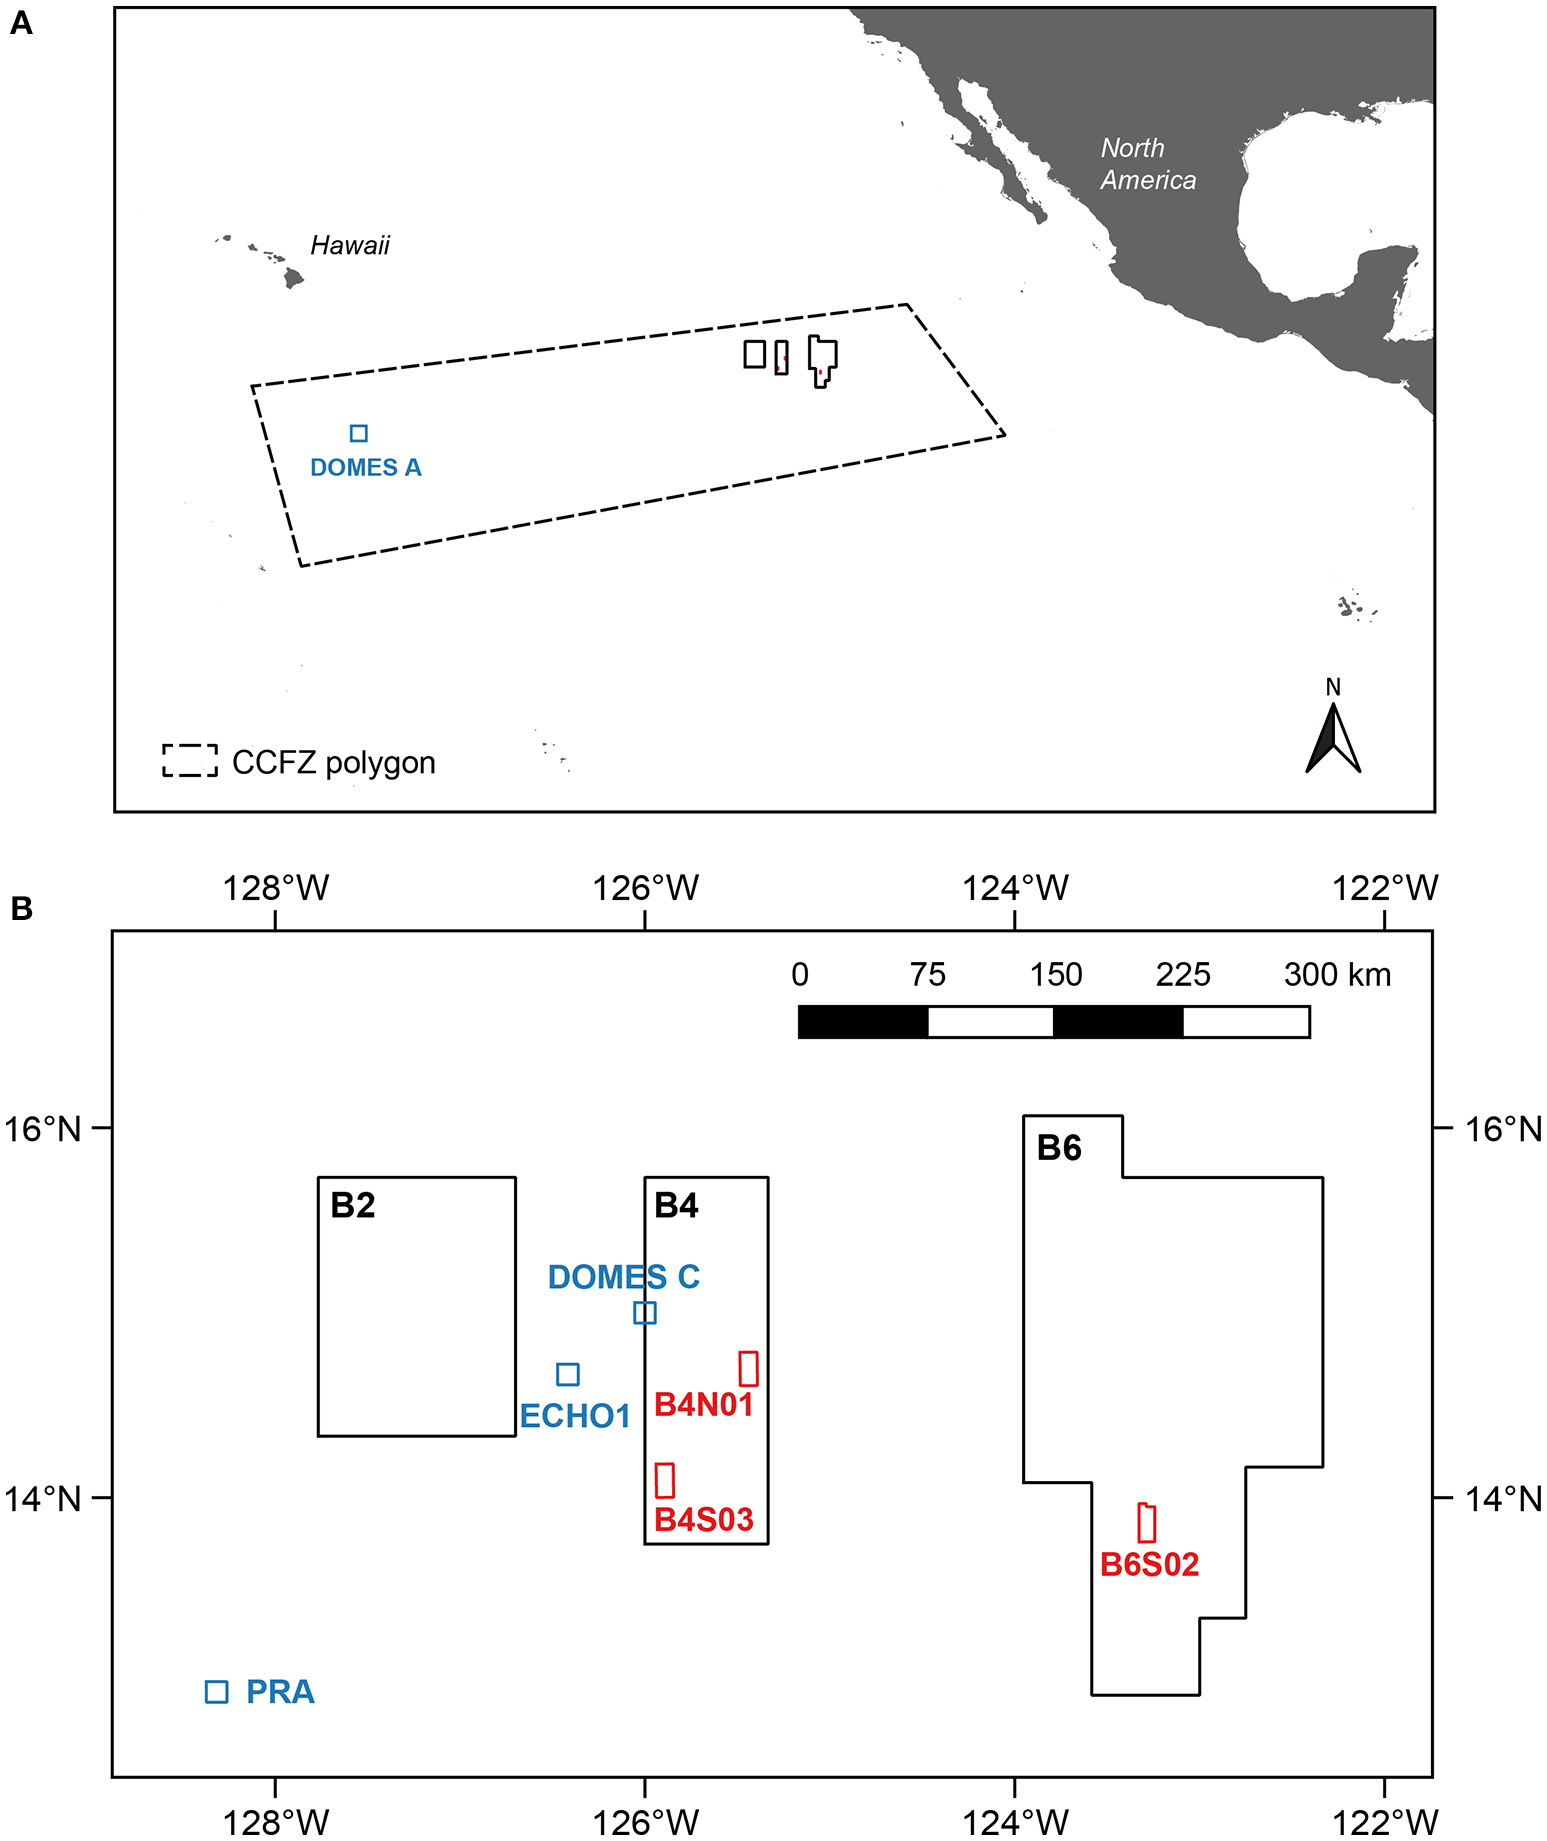
The central Equatorial Pacific indicating (A) the Global Sea Mineral Resources (GSR) license area located within the Clarion-Clipperton Fracture Zone (CCFZ) and (B) the three sites (B6S02, B4S03, and B4N01; red) sampled during expedition GSRNOD15A. The coordinates of the CCFZ polygon were based on the working definition of the CCFZ used by Glover et al. (2015). Other stations and sites in the CCFZ examined for macrofauna are indicated in blue.
Sampling strategy and sample analysis
In order to compare sampling sites, sediment environmental parameters (i.e., granulometry, sediment sorting coefficient and porosity, total organic matter, and total organic carbon and nitrogen) were measured from an undisturbed sediment core (internal diameter: 10 cm, depth: 0–10 cm), collected with a MC-800 multicorer (MUC) and replicated (n = 3) per site. The cores were processed in a cold lab container (4°C) and, following siphoning the overlying water off the sediment core, they were sliced per cm down to a depth of 10 cm. Subsequently, each slice was stored at −20°C until further analysis. At each site a minimum of three and a maximum of five boxcores were collected using a MK-III spade box corer (0.25 m2 surface, 0.6 m sediment depth; Table 1). As recommended by the ISA (2015), the surface area of the box cores was not subsampled but entirely preserved for macrofauna (metazoan organisms retained on a 300-μm mesh sieve) analysis. Upon recovery of the box corer, the overlying water was siphoned off in order to avoid resuspension of the surficial sediments and the associated fauna. Subsequently, the box core surface was photographed and all nodules were removed from the sediment surface, washed, and individually measured and weighed for further analysis. The overlying water and the washed nodule residue was pooled with sediment from the 0–3 cm layer and sieved through a 300-μm mesh size with cold (4°C) filtered sea water. The sieve residue was immediately bulk-fixed in pre-cooled (−20°C) 96% absolute EtOH and stored at −20°C. Every 3 to 5 h, the sample containers were carefully shaken to guarantee penetration of the EtOH through the sediment and prevent the water inside the samples from freezing (Riehl et al., 2014). After 24 h, the EtOH was decanted and replaced by new pre-cooled 96% absolute EtOH, to ensure a high EtOH concentration (Riehl et al., 2014). Subsequently, the samples were kept frozen (−20°C) until further analysis. Sediment from the 3–5 and 5–10 cm layers was sieved through a 300-μm mesh size with non-cooled filtered sea water. The sieve residues were bulk-fixed in 10% seawater-buffered formaldehyde for 48 h and subsequently preserved in 80% denatured EtOH until further processing.
Table 1
| Site | Deployment | Date | Depth (m) | Latitude | Longitude |
|---|---|---|---|---|---|
| B6S02 | BC011 | 21/09/2015 | 4549 | 13° 53′ 38.54″ N | 123° 17′ 49.34″ W |
| BC013 | 21/09/2015 | 4560 | 13° 53′ 17.45″ N | 123° 17′ 19.39″ W | |
| BC015 | 22/09/2015 | 4560 | 13° 52′ 59.66″ N | 123° 16′ 55.96″ W | |
| MUC001 | 23/09/2015 | 4526 | 13° 51′ 13.85″ N | 123° 15′ 18.46″ W | |
| MUC002 | 23/09/2015 | 4525 | 13° 51′ 14.89″ N | 123° 14′ 45.73″ W | |
| MUC003 | 24/09/2015 | 4522 | 13° 50′ 44.12″ N | 123° 15′ 9.32″ W | |
| B4S03 | BC018 | 27/09/2015 | 4501 | 14° 6′ 44.93″ N | 125° 52′ 17.29″ W |
| BC019 | 27/09/2015 | 4488 | 14° 7′ 3.65″ N | 125° 52′ 46.38″ W | |
| BC021 | 28/09/2015 | 4477 | 14° 6′ 15.66″ N | 125° 52′ 39.76″ W | |
| BC024 | 1/10/2015 | 4569 | 14° 3′ 20.07″ N | 125° 55′ 35.27″ W | |
| MUC004 | 29/09/2015 | 4490 | 14° 7′ 4.08″ N | 125° 52′ 44.76″ W | |
| MUC005 | 29/09/2015 | 4498 | 14° 6′ 45.14″ N | 125° 52′ 17.65″ W | |
| MUC006 | 29/09/2015 | 4470 | 14° 6′ 15.19″ N | 125° 52′ 41.84″ W | |
| B4N01 | BC026 | 4/10/2015 | 4509 | 14° 42′ 23.08″ N | 125° 27′ 40.25″ W |
| BC027 | 4/10/2015 | 4501 | 14° 42′ 22.86″ N | 125° 26′ 32.75″ W | |
| BC029 | 5/10/2015 | 4504 | 14° 42′ 22.90″ N | 125° 27′ 5.90″ W | |
| BC035 | 9/10/2015 | 4505 | 14° 38′ 50.82″ N | 125° 24′ 31.82″ W | |
| BC036 | 9/10/2015 | 4514 | 14° 40′ 17.40″ N | 125° 27′ 21.82″ W | |
| MUC007 | 6/10/2015 | 4509 | 14° 42′ 22.68″ N | 125° 27′ 39.13″ W | |
| MUC008 | 7/10/2015 | 4504 | 14° 42′ 22.79″ N | 125° 27′ 4.68″ W | |
| MUC009 | 7/10/2015 | 4501 | 14° 42′ 23.36″ N | 125° 26′ 31.34″ W |
Date, position and depth of the box core (BC) and multicore (MUC) deployments within the Global Sea Mineral Resources (GSR) license area located in the Clarion–Clipperton Fracture Zone (CCFZ).
In the laboratory, sediment samples were dried (60°C) and granulometry was analyzed by means of a Malvern Mastersizer hydro 2000 G. Measured granulometric variables were median grain size, sand (>63 μm), and mud (<63 μm) content, sediment sorting (a measure for the spread distance of the various grain sizes, quantified by the sediment sorting coefficient SC; Giere, 2009) and sediment porosity (measured as the difference in sediment weight before and after drying). The total amount of organic matter (TOM) was determined based on weight loss after combustion for 2 h at 500°C. Total organic carbon (TOC) and nitrogen (TN) were measured using a Flash 2000 NC Sediment Analyser of Interscience (Thermo scientific). Prior to analysis, the samples were acidified with 1% HCl to remove inorganic carbon. Nodule surface coverage was estimated from the photographs. The 0–3 cm bulk-fixed sediment samples were rinsed with chilled 99% denatured EtOH. The 3–5 cm and 5–10 cm bulk-fixed sediment samples were stained with 0.01% Rose Bengal and rinsed after 24 h. Sample residues were transferred to (chilled) sorting dishes and absolute EtOH (−20°C) was added. Using a Leica MZ16 stereomicroscope all macrofauna (including Nematoda, Copepoda, Ostracoda, and Kinorhyncha; which are generally not considered macrofauna) was sorted, counted and photographed with a Nikon DS-Fi2 camera. Polychaeta and Isopoda, two of the most abundant macrofaunal taxa in the CCFZ (e.g., Hessler and Jumars, 1974; Paterson et al., 1998; Glover et al., 2001), representing different functional and reproductive strategies, were identified to genus or species level wherever possible using original scientific literature, identification keys and expert knowledge. All other taxa were identified to order, class, or phylum level. Following identification, specimens were preserved separately in 2 ml vials containing cooled (−20°C) absolute EtOH in case of the 0–3 cm layers and 99% denatured EtOH in case of the 3–5 and 5–10 cm layers.
Data and statistical analyses
Because the assumptions of parametric statistical approaches were not fulfilled, differences in (1) the set of sediment environmental variables and (2) nodule parameters (i.e., nodule abundance, nodule surface coverage and nodule volume) between sites were investigated by means of a one-way permutational ANOVA (Permanova) in which “site” was a fixed factor with three levels (B6S02, B4S03, and B4N01). The analysis was based on a Euclidean distance resemblance matrix and performed on untransformed, normalized (for the sediment environmental variables) data. Where a significant effect was found, pair-wise tests between the sites were carried out. The Monte Carlo p-value (pMC) was reported instead of the permutation p-value (pPERM) if the number of possible permutations was <100 (Anderson et al., 2008). Although Permanova makes no explicit assumptions regarding the distribution of the data, a test for the homogeneity of multivariate dispersions was ran, using the PERMDISP routine. None of the PERMDISP tests was significant, indicating no differences in dispersion among the sites (Anderson et al., 2008). In addition, sediment environmental data was visualized by a Principal Coordinates Analysis (PCO; Anderson et al., 2008). Based on Spearman correlations, only variables that correlated >50% with one of the first two PCO axes were plotted.
The total macrofaunal community was investigated both at higher taxon and lower taxon level. Additionally, a detailed study of Polychaeta and Isopod (both at higher—i.e., family—, and lower—i.e., genus or species—taxon level) was performed. Prior to further analyses, macrofaunal abundances were standardized to individuals per m2. Differences in the macrofaunal taxon abundance N and biodiversity indices (taxon richness T, Shannon-Wiener diversity index H′, Pielou's evenness index J′ and the Hurlbert rarefaction index for 50 individuals ET50) between sites were tested with a one-way PERMANOVA based on a Euclidean distance resemblance matrix and performed on untransformed data. Similarly, differences in the relative abundance of the most dominant total macrofauna taxa, Polychaeta and Isopoda, were tested between sites. Except for the higher taxon richness T of Polychaeta, the total macrofauna and Hurlbert's rarefaction ET50 of higher taxa Polychaeta, and for the relative abundance of the isopod families Haploniscidae and Ischnomesidae, the PERMDISP tests were not significant for the factor “site,” indicating no differences in dispersion among the sites (Anderson et al., 2008).
Taxon-accumulation curves (TAC), plotting the cumulative number of taxa recorded as a function of the number of sites/samples studied, were produced by randomly adding sites/samples and repeating this procedure 9,999 times. Additionally, the Chao1, Jacknife2, and Bootstrap estimators were used to extrapolate the TAC's and estimate the total taxon richness in the GSR license area, as suggested by Magurran (2004). The minimum number of additional samples required to detect 95 and 100% of the estimated asymptonic taxon richness was calculated using the non-parametric method proposed by Chao et al. (2009). This statistically rigorous method uses the Chao1 nonparametric estimators of asymptotic taxon richness for abundance data. Differences in the faunal community compositions between sites were tested with a multivariate 1-factor PERMANOVA (and visualized by a PCO), which was based on Bray-Curtis resemblance matrices of fourth-root transformed macrofaunal abundance data. In case a significant effect was found, pair-wise tests among sites were carried out. According to the PERMDISP tests, the factor “site” showed no differences in dispersion (Anderson et al., 2008).
To investigate relationships between nodule parameters (i.e., nodule abundance, nodule surface coverage, and nodule volume) and macrofaunal abundance and diversity indices over all sites, Spearman-rank correlations were calculated. A significance level of p < 0.05 was used in all tests. All statistical analysis were conducted in the open source software R (version 3.3.1; R Development Core Team, 2015) and in PRIMER v6 with the PERMANOVA+ add-on software (Clarke and Gorley, 2006; Anderson et al., 2008).
Results
Sediment environmental variables
The set of sediment environmental variables differed significantly between sites (1-factor Permanova, pseudo-F(2, 6) = 5.828, pPERM = 0.005) and pair-wise tests showed that differences were significant between all three sites: B6S02-B4S03 (pMC = 0.0495), B6S02-B4N01 (pMC = 0.0096), B4S03-B4N01 (pMC = 0.0441). The PCO analysis graphically showed that the sediment environmental variables distinguished between the three sites (Figure 2). PCO axis 1 explained 57.7% of the variation inherent in the resemblance matrix and separated site B6S02 from sites B4S03 and B4N01. This separation resulted from the elevated median grain size, sand content and sediment porosity and the lower mud content and sorting coefficient in B6S02 compared to the other two sites (Table 2, Figure 2). PCO axis 2 explained 26.4% of the total variation and distinguished site B4N01 from site B6S02 and B4S03, which was due to the elevated content of TOM, TOC, and TN in B4N01 (Table 2, Figure 2).
Figure 2
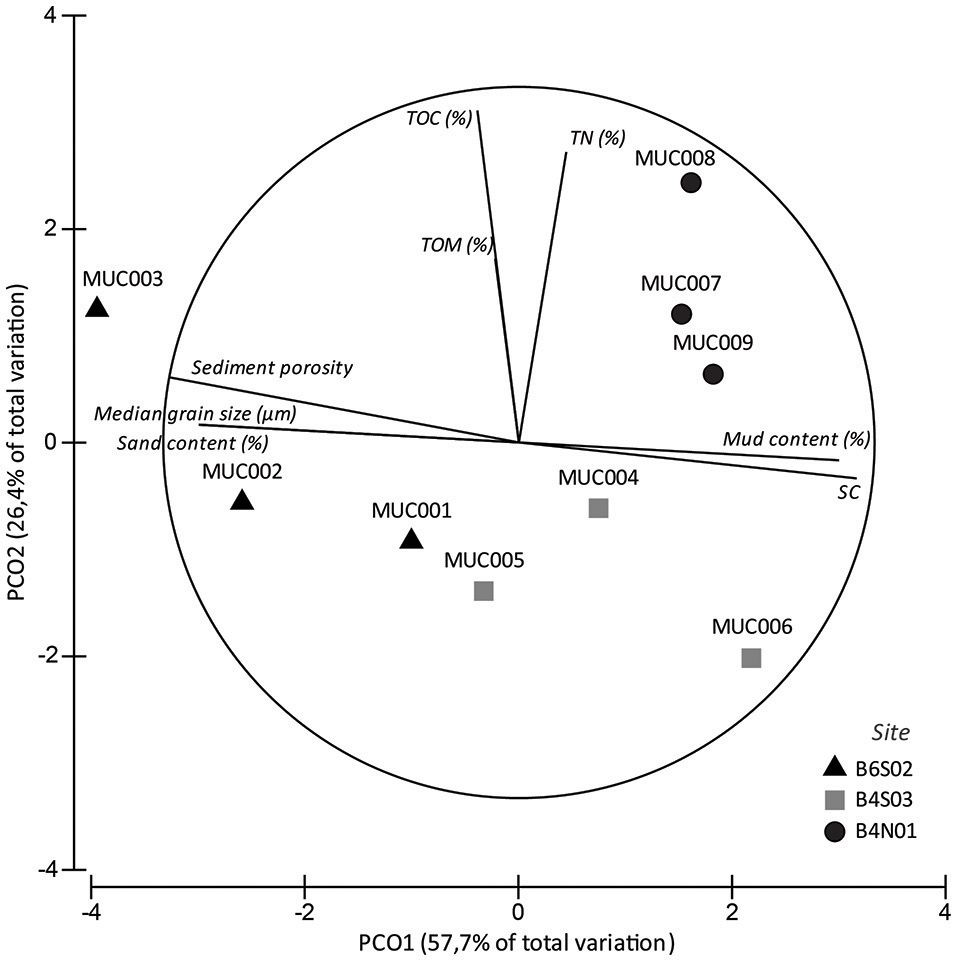
PCO analysis of the sediment environmental variables in sites B6S02, B4S03, and B4N01 based on Euclidean distance similarities of untransformed, normalized data. Vectors represent sediment variables correlating >50% (based on Spearman correlation coefficients) with one of the two PCO axes.
Table 2
| B6S02 | B4S03 | B4N01 | |
|---|---|---|---|
| SEDIMENT ENVIRONMENTAL VARIABLES | |||
| Median grain size (μm) | 18.5 ± 0.6 | 16.5 ± 0.5 | 15.8 ± 0.2 |
| Sand content (%) | 11.3 ± 0.6 | 8.5 ± 0.4 | 8.0 ± 0.4 |
| Mud content (%) | 88.7 ± 0.6 | 91.5 ± 0.4 | 92.0 ± 0.4 |
| SC | 1.25 ± 0.01 | 1.29 ± 0.02 | 1.30 ± 0.01 |
| Sediment porosity | 0.874 ± 0.006 | 0.858 ± 0.004 | 0.856 ± 0.004 |
| TOM (%) | 6.5 ± 0.1 | 6.6 ± 0.1 | 6.6 ± 0.1 |
| TOC (%) | 0.49 ± 0.02 | 0.41 ± 0.01 | 0.54 ± 0.02 |
| TN (%) | 0.17 ± 0.01 | 0.15 ± 0.004 | 0.21 ± 0.01 |
| TOC/TN | 3.53 ± 0.07 | 3.29 ± 0.17 | 3.03 ± 0.03 |
| POLYMETALLIC NODULE PARAMETERS | |||
| Nodule abundance (kg.m−2) | 27.33 ± 0.62 | 22.22 ± 2.41 | 19.30 ± 2.18 |
| Nodule surface coverage (%) | 31.11 ± 8.43 | 36.19 ± 2.95 | 39.34 ± 7.02 |
| Nodule volume (cm3) | 69.67 ± 13.68 | 92.63 ± 6.95 | 54.75 ± 7.90 |
Mean (±SE) sediment environmental variables and polymetallic nodules parameters for the three sites within the GSR license area.
Sediment data was derived from an undisturbed sediment core (Ø 10 cm, 0–10 cm deep) collected with a MC–800 multicorer (MUC) and replicated (n = 3) per site. The polymetallic nodule abundance, surface coverage and volume were derived from the box corer (BC) deployments (n = 3, 4, and 5 in sites B6S02, B4S03, and B4N01, respectively). SC, the sediment sorting coefficient (a measure for the spread distance of the various grain sizes); TOM, the total amount of organic matter; TOC, the total amount of organic carbon; TN, the total amount of nitrogen.
Polymetallic nodules
Of the nodule variables measured, only volume differed significantly between the sites (1-factor Permanova, pseudo-F(2, 9) = 4.873, pPERM = 0.039) and pair-wise tests showed a significantly higher mean nodule volume (±SE) in site B4S03 (92.63 ± 6.95 cm3) compared to site B4N01 (54.75 ± 7.90 cm3, pMC = 0.009; Table 2). Although not significantly different, mean nodule abundance (±SE) was lowest in site B4N01 (19.30 ± 2.18 kg.m−2), intermediate in site B4S03 (22.22 ± 2.41 kg.m−2) and highest in site B6S02 (27.33 ± 0.62 kg.m−2; Table 2). The mean nodule surface coverage (±SE) per site was 39.34 ± 7.02% in B4N01, 36.19 ± 2.95% in B4S03 and 31.11 ± 8.43% in B6N02 (Table 2).
Total macrofauna abundance, taxon diversity, and community composition
A total number of 7,028 macrobenthic organisms representing 100 different taxa were sampled inside the GSR license area, at the three sites (Supplementary Material 1). The average total macrofaunal abundance (±SE) in the 0–10 cm sediment layer was 604 ± 56 ind.m−2 at site B6S02, 627 ± 50 ind.m−2 at site B4S03 and 542 ± 66 ind.m−2 at site B4N01 and did not vary significantly among sites (1-factor Permanova, pseudo-F(2, 9) = 0.5756, pPERM = 0.60). In terms of abundance, the macrofaunal community was dominated by Nematoda (49.6%), Copepoda (15.8%), Polychaeta (12%), Tanaidacea (11.5%), Isopoda (2.8%), Ostracoda (1.4%), Amphipoda (1.3%), and Bivalvia (1.3%). The remaining taxa comprised 4.3% of total macrofaunal abundance. The relative abundances of the dominant taxa did not differ significantly between sites (1-factor Permanova, for all tests pPERM > 0.05). After exclusion of Nematoda, Copepoda, Ostracoda and Kinorhyncha (taxa generally construed as typical meiofauna taxa), the average total macrofaunal abundance (±SE) was 199 ± 15 ind.m−2 at site B6S02, 202 ± 22 ind.m−2 at site B4S03 and 186 ± 30 ind.m−2 at site B4N01 (Table 3). Similarly, differences in total macrofauna abundance between sites were not statistically significant (1-factor Permanova, pseudo-F(2, 9) = 0.1104, pPERM = 0.89; Table 3). The macrofaunal community excluding the meiofauna taxa was dominated by Polychaeta (36.1%), Tanaidacea (34.6%), Isopoda (8.6%), Amphipoda (3.9%), and Bivalvia (3.9%). The remaining taxa comprised 12.8% of the total macrofaunal abundance (Figure 3). Only the average relative abundance of Polychaeta [1-factor Permanova, pseudo-F(2, 9) = 9.9609, pPERM = 0.0089] and Tanaidacea (1-factor Permanova, pseudo-F(2, 9) = 4.5042, pPERM = 0.046) differed significantly among sites. Pair-wise comparisons showed a significantly lower relative abundance of Polychaeta (±SE) at B4N01 (29.1 ± 2.6%) compared to B6S02 (41.1 ± 2.1%; pMC = 0.018) and B4S03 (40.5 ± 1.5%; pMC = 0.0092), and a significantly lower relative abundance of Tanaidacea at B6S02 (22.3 ± 2.2%) compared to B4N01 (44.8 ± 3.1%; pMC = 0.0018).
Table 3
| Macrofauna group | B6S02 (n = 3) | B4S03 (n = 4) | B4N01 (n = 5) | Main Test | Pair–wise test (pMC) | ||||
|---|---|---|---|---|---|---|---|---|---|
| MS | Pseudo–F2, 9 | p PERM | B6S02–B4S03 | B6S02–B4N01 | B4S03–B4N01 | ||||
| TOTAL MACROFAUNA (EXCL. MEIOFAUNA) | |||||||||
| Taxon abundance N | 199 ± 15 | 202 ± 22 | 186 ± 30 | 302.40 | 0.1104 | 0.889 | – | – | – |
| Taxon richness T (low) | 27.3 ± 1.8 | 20.5 ± 2.5 | 20.2 ± 3.0 | 55.23 | 1.7849 | 0.231 | – | – | – |
| Shannon diversity index H′ (low) | 2.98 ± 0.08 | 2.46 ± 0.20 | 2.24 ± 0.13 | 0.52 | 5.6845 | 0.030 | 0.0853 | 0.0066 | 0.3604 |
| Pielou's eveness index J′ (low) | 0.903 ± 0.008 | 0.819 ± 0.036 | 0.757 ± 0.024 | 0.02 | 6.4891 | 0.024 | 0.1112 | 0.0047 | 0.1846 |
| Hurlbert rarefaction index ET50(low) | 21.2 ± 0.9 | 16.2 ± 1.5 | 15.5 ± 1.3 | 32.79 | 4.6238 | 0.047 | 0.0479 | 0.0196 | 0.7218 |
| POLYCHAETA | |||||||||
| Taxon abundance N | 83 ± 10 | 81 ± 6 | 54 ± 10 | 1090.40 | 3.3959 | 0.088 | – | – | – |
| Taxon richness T (high) | 12 ± 0 | 8.0 ± 0.3 | 8.8 ± 1.0 | 17.93 | 8.1515 | 0.015 | 0.0001 | 0.0475 | 0.2904 |
| Taxon richness T (low) | 14.0 ± 0.6 | 12.0 ± 1.2 | 10.4 ± 2.0 | 12.23 | 1.0669 | 0.383 | – | – | – |
| Shannon diversity index H′ (high) | 2.31 ± 0.04 | 1.80 ± 0.04 | 2.06 ± 0.10 | 0.23 | 8.9415 | 0.012 | 0.0006 | 0.1370 | 0.0578 |
| Shannon diversity index H′ (low) | 2.50 ± 0.02 | 2.34 ± 0.10 | 2.20 ± 0.18 | 8.74 × 10⁻² | 0.9914 | 0.408 | – | – | – |
| Pielou's eveness index J′ (high) | 0.930 ± 0.018 | 0.892 ± 0.011 | 0.961 ± 0.009 | 5.17 × 10⁻³ | 9.4171 | 0.006 | 0.1080 | 0.1320 | 0.0019 |
| Pielou's eveness index J′ (low) | 0.949 ± 0.016 | 0.948 ± 0.009 | 0.966 ± 0.012 | 4.66 × 10⁻⁴ | 0.8249 | 0.454 | – | – | – |
| Hurlbert rarefaction index ET50(high) | 11.8 ± 0.1 | 7.4 ± 0.3 | 8.8 ± 0.9 | 16.82 | 8.0310 | 0.014 | 0.0001 | 0.0502 | 0.2739 |
| Hurlbert rarefaction index ET50(low) | 13.7 ± 0.5 | 11.8 ± 1.2 | 10.3 ± 2.0 | 10.96 | 1.0364 | 0.398 | – | – | – |
| ISOPODA | |||||||||
| Taxon abundance N | 17 ± 4 | 18 ± 5 | 15 ± 4 | 9.60 | 0.1214 | 0.890 | – | – | – |
| Taxon richness T (high) | 3.7 ± 0.7 | 3.0 ± 0.4 | 3.0 ± 0.6 | 0.50 | 0.3553 | 0.778 | – | – | – |
| Shannon diversity index H′ (high) | 1.23 ± 0.16 | 0.98 ± 0.10 | 0.94 ± 0.26 | 8.81 × 10⁻² | 0.4727 | 0.693 | – | – | – |
| Pielou's eveness index J′ (high) | 0.972 ± 0.016 | 0.934 ± 0.054 | 0.970 ± 0.010 | 1.78 × 10⁻³ | 0.3798 | 0.922 | – | – | – |
| Hurlbert rarefaction index ET50(high) | 3.7 ± 0.7 | 3.0 ± 0.4 | 3.0 ± 0.6 | 0.50 | 0.3553 | 0.781 | – | – | – |
Overview of the calculated community descriptors (mean ± SE) and the 1–factor Permanova main and pair–wise tests for the total macrofauna, the Polychaeta, and the Isopoda communities of the three sites within the Global Sea Mineral Resources (GSR) license area.
N, taxon abundance (ind.m−2); T, taxon richness; H′, Shannon–Wiener diversity index; J′, Pielou's evenness index; and ET50, the Hurlbert rarefaction index for 50 individuals. Site was a fixed factor with three levels (B6S02, B4S03, and B4N01). Analysis were based on an Euclidian distance resemblance matrix and performed on untransformed data. In case of significant differences (p < 0.05) p-values are in bold. High, analysis on higher taxon (family) level; low, analysis on lower taxon (genus/species) level; pPERM, permutation p-value, pMC, Monte Carlo p-value.
Figure 3
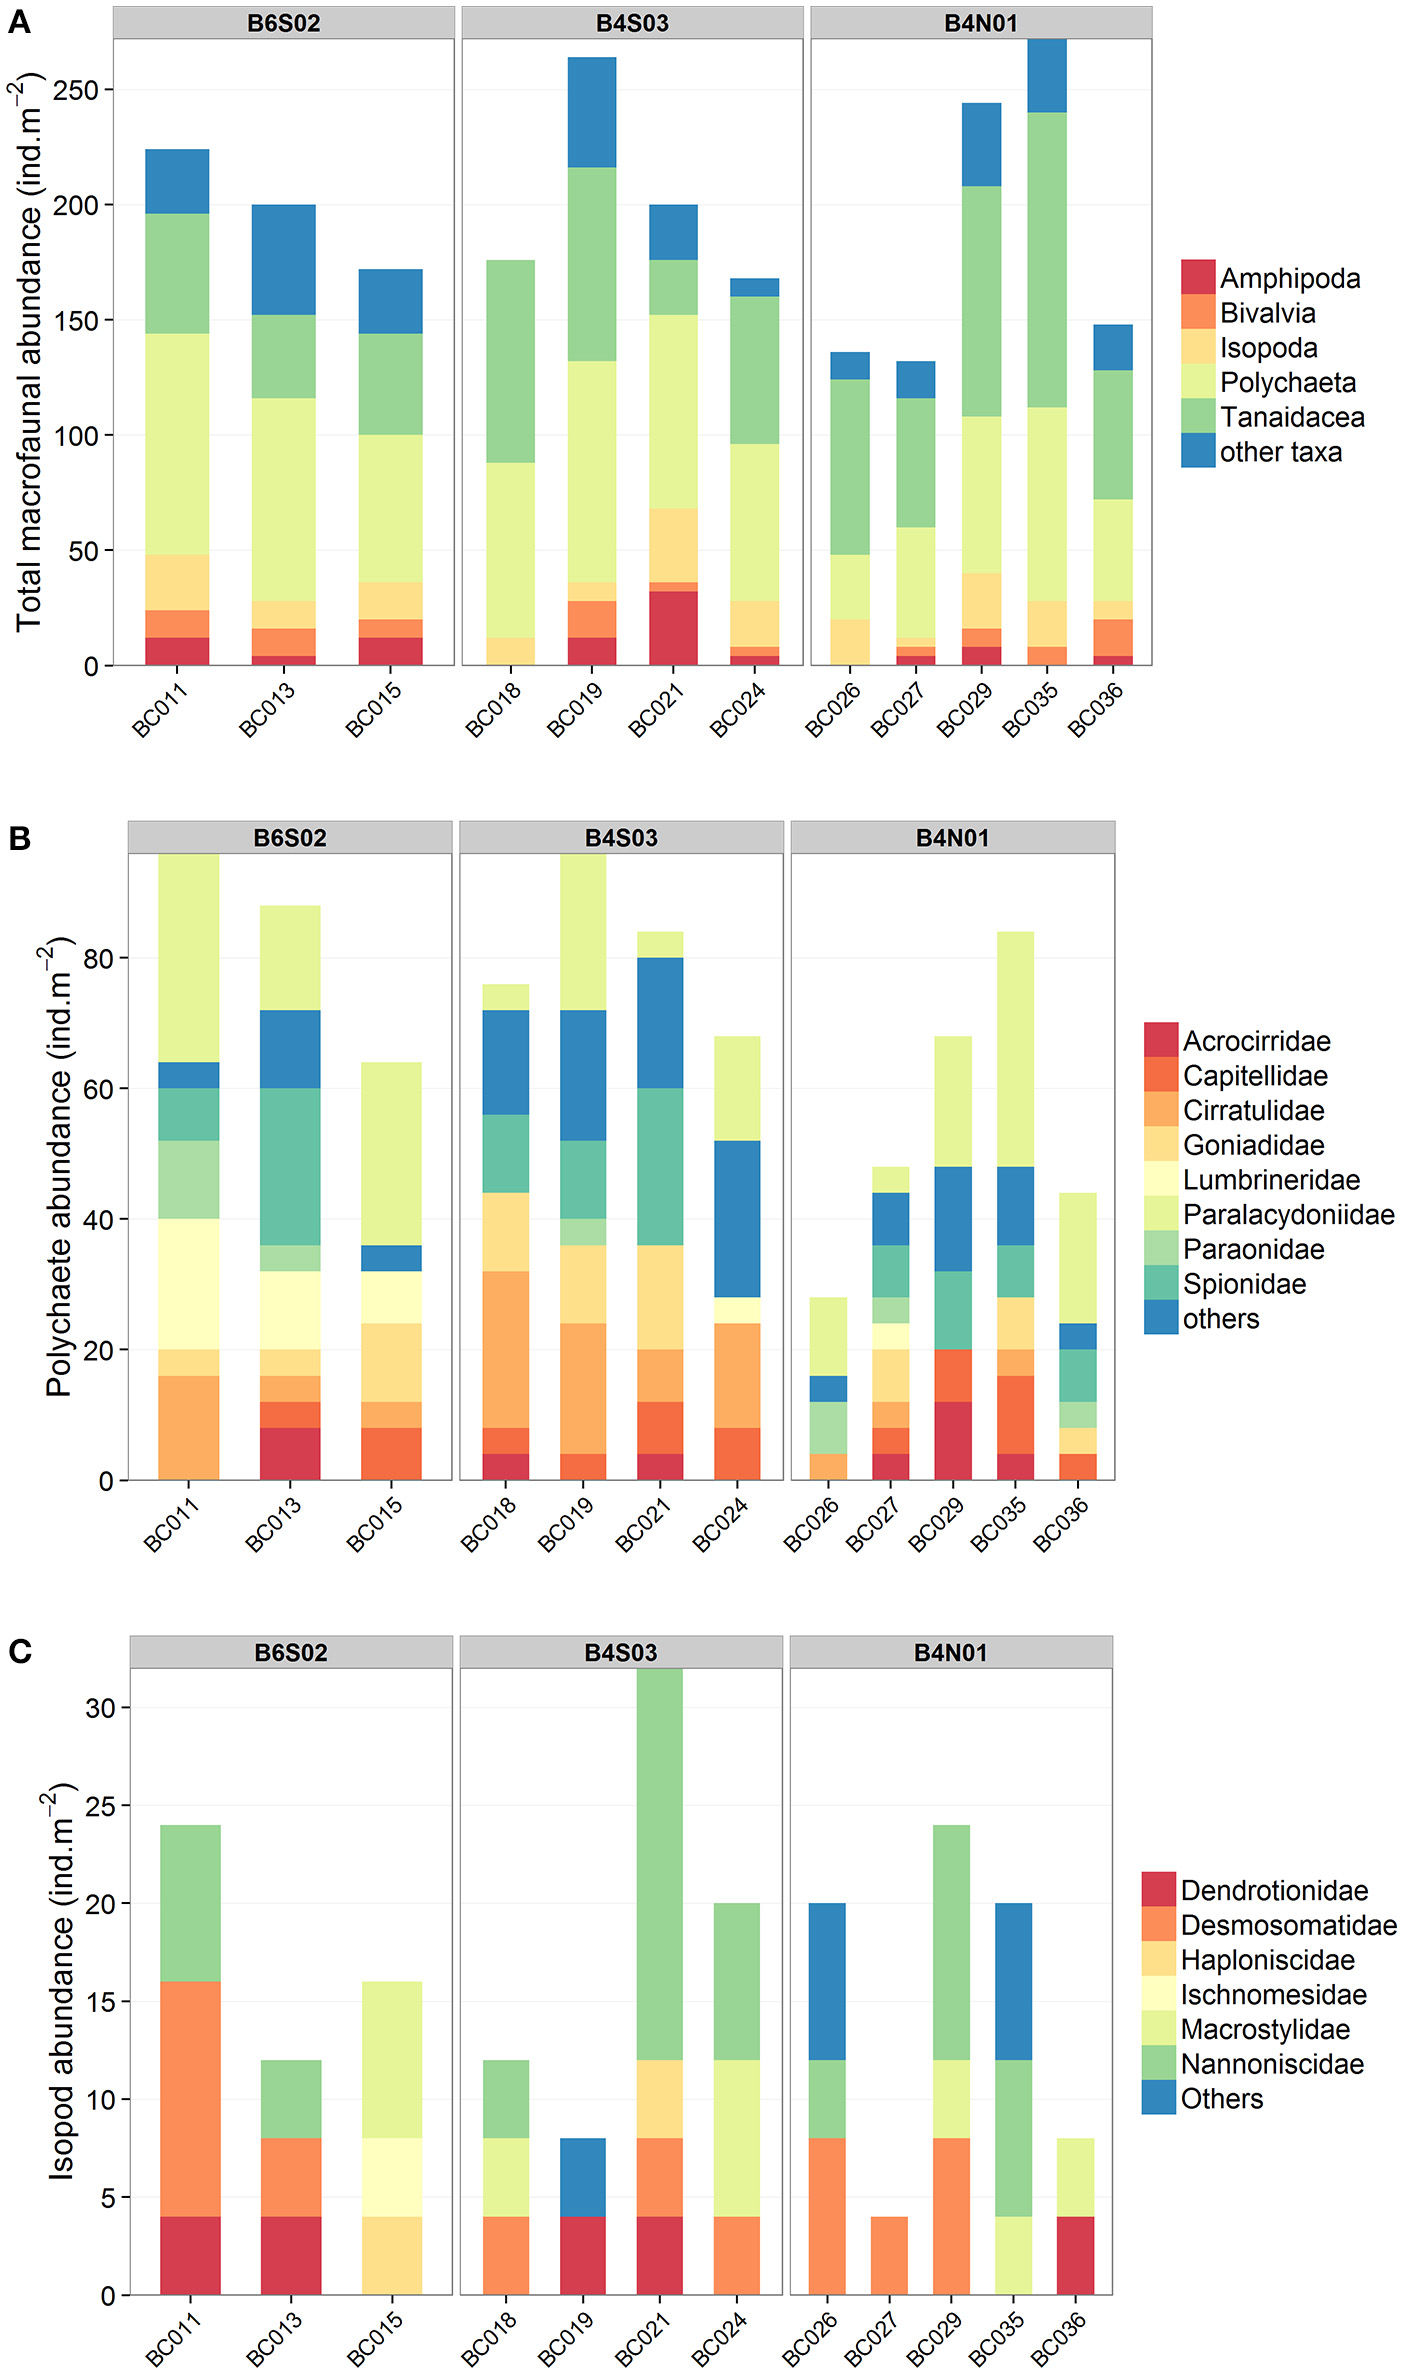
Macrofauna composition of the box cores (0–10 cm) taken at sites B6S02, B4S03, and B4N01 in the GSR license area. (A) Total macrofauna (higher taxon level). Nematoda, Copepoda, Ostracoda, and Kinorhyncha were not included since these taxa are generally construed as typical meiofauna taxa. Other taxa include Acari, Brachiopoda, Decapoda, Chaetognatha, Cumacea, Gastropoda, Mysida, Nemertea, Oligochaeta, Ophiuroidea, Priapulida, Pycnogonida, Scaphopoda, and Sipuncula. (B) Polychaeta (family level). Other families include Amphinomidae, Glyceridae, Magelonidae, Maldanidae, Nereididae, Nephtyidae, Opheliidae, Oweniidae, Phyllodocidae, Polynoidae, Sabellidae, Sigalionidae, Syllidae, Terebellidae, Trichobranchidae. (C) Isopoda (family level). Others include isopod specimens which could not be identified to the family level.
Taking into account all lower macrofaunal taxa (excluding meiofauna), Shannon-Wiener diversity H′, Pielou's evenness J′, and Hurlbert rarefaction ET50 were significantly affected by the factor “site” (Table 3). Pair-wise Permanova tests revealed that these three indices were significantly higher at B6S02 compared to B4N01, but not at B4S03 except for ET50. (Table 3). The number of macrofaunal taxa T did not differ between sites. However, only 32% of the taxa were shared among all three sites. When excluding meiofauna, 92 macrofaunal taxa (lowest identifiable taxon level) were identified in the GSR license area, of which 29% was shared between all sites. Taxon-accumulation curves suggest that 64 to 85% of the total number of lower macrofaunal taxa from the three sites in the sampling area had been identified (Figure 4). Bootstrap estimates of total number of macrofauna taxa were 106 and 108 with increasing number of sites and samples, respectively, whereas Chao1 estimated 135 and 135 taxa and Jacknife2 estimated 134 and 145 taxa, respectively. B6S02 had a higher number of observed taxa (Sobs) and a higher estimated total taxon richness (Chao1, Jacknife2, and Bootstrap) than B4S03 and B4N01 (Figure 5). The minimum number of additional samples required to encompass 100% of the taxon richness estimated by Chao1 is 123 samples, compared with 36 samples to encompass 95% of the estimated taxon richness.
Figure 4
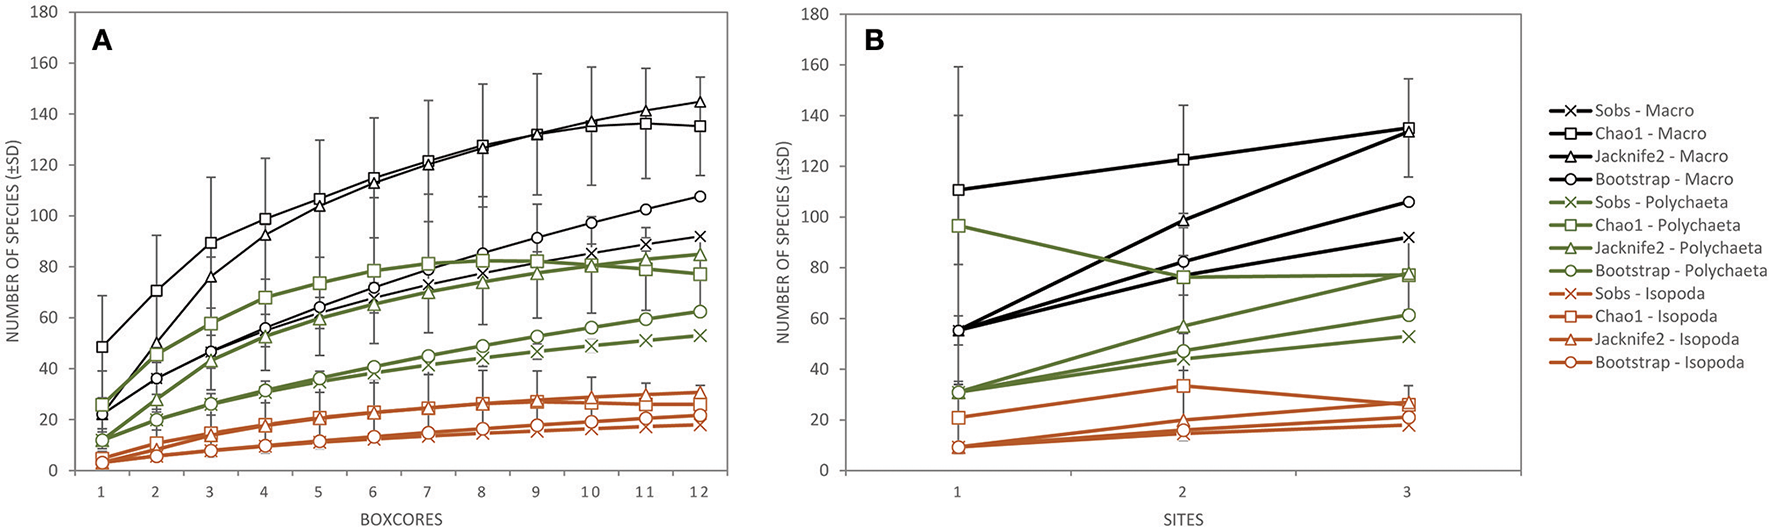
The total number of species observed (±SD; Sobs) and the total taxon richness estimates (Chao1 ± SD, Jacknife2, and Bootstrap) of the total macrofauna (excluding meiofauna; black), Polychaeta (genus/species level; green) and Isopoda (genus/species level; orange) as a function of (A) the number of box cores collected, and (B) the number of sites sampled during expedition GSRNOD15A in the GSR license area.
Figure 5
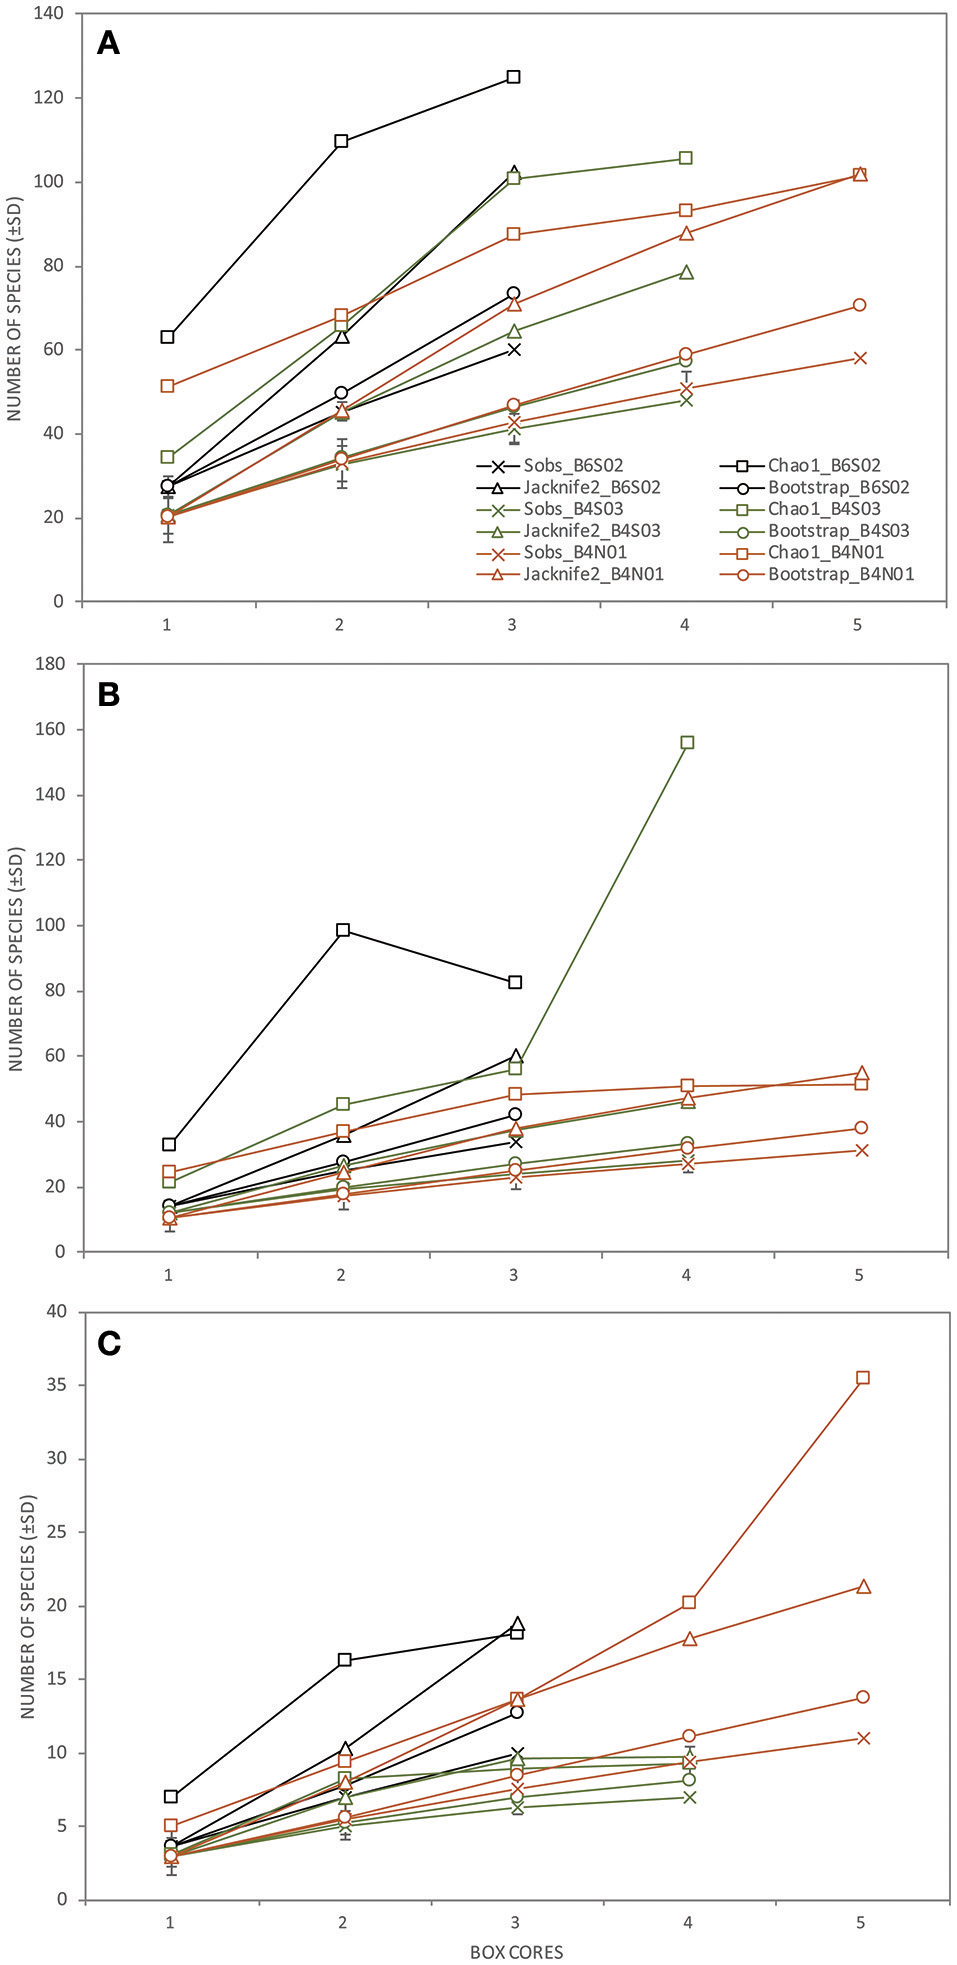
The total number of species observed (±SD; Sobs) and the total taxon richness estimates (Chao1, Jacknife2, and Bootstrap) of (A) the total macrofauna (excluding meiofauna; lowest taxon level), (B) Polychaeta (genus/species level), and (C) Isopoda (genus/species level) as a function of the number of box cores collected per station (B6S02: black, B4S03: green, B4N01: orange) sampled during expedition GSRNOD15A in the GSR license area.
Multivariate analysis revealed no site effect on macrofaunal community composition (1-factor Permanova, pseudo-F(2, 9) = 1.25, pPERM = 0.11; Supplementary Material 2). No statistically significant correlations between total macrofaunal abundance or lower taxon diversity indices (excluding meiofauna) and the polymetallic nodule parameters were observed (p > 0.05), except for a moderately strong, positive correlation between nodule abundance and H′ (rS = 0.69, p = 0.016) and ET50 (rS = 0.69, p = 0.017), respectively.
Polychaeta abundance, species diversity, and community composition
Polychaeta were the most abundant macrofauna in the study area. In total, 844 polychaetes, representing 53 taxa, were collected (Supplementary Material 1). The average polychaete abundance (±SE) was highest at B6S02 (83 ± 10 ind.m−2) and B4S03 (81 ± 6 ind.m−2), and lowest at B4N01 (54 ± 10 ind.m−2). The average polychaete abundance did not differ significantly among sites (1-factor Permanova, pseudo-F(2, 9) = 3.3959, pPERM = 0.088). The polychaete specimens represented 24 families, of which 8 families accounted for 74.4% of polychaete abundance: Spionidae (17.1% of the total abundance), Paraonidae (13.7%), Cirratulidae (12.3%), Goniadidae (9.5%), Capitellidae (7.6%), Lumbrineridae (5.7%), Acrocirridae (4.3%), and Paralacydoniidae (4.3%) (Figure 3). The remaining 25.6% of the total polychaete abundance belonged to less dominant families (see Supplementary Material 1). One-way Permanova revealed that the factor “site” affected the average relative abundance of Spionidae (pseudo-F(2, 9) = 7.8781, pPERM = 0.0066), Cirratulidae (pseudo-F(2, 9) = 5.4806, pPERM = 0.030), and Lumbrineridae (pseudo-F(2, 9) = 16.402, pPERM = 0.0065). Pair-wise comparisons showed a significantly higher relative abundance of Spionidae (±SE) in site B4S03 (25.2 ± 3.5%) compared to B6S02 (8 ± 2.9%, pMC = 0.015) and B4N01 (15.6 ± 2.3%, pMC = 0.047), a significantly higher relative abundance of Cirratulidae in B4S03 (21.4 ± 4.6%) compared to B4N01 (5.5 ± 2.7%, pMC = 0.016), and a significantly higher relative abundance of Lumbrineridae in B6S02 (15.7 ± 2.6%) compared to B4S03 (1.5 ± 1.5%, pMC = 0.0039) and B4N01 (1.7 ± 1.7%, pMC = 0.0031).
When calculated based on the genus/species level, none of the polychaete community descriptors were significantly affected by the factor “site,” whereas all four descriptors differed significantly between sites at the family level (Table 3). Pair-wise tests revealed that T, H′, and ET50 were significantly higher at B6S02 compared to B4S03, but not B4N01, except for T. J′ was significantly higher at B4N01 compared to B4S03 (Table 3). A total of 24 polychaete families occured in the GSR license area. According to taxon-accumulation curves, most (84–93%) of the polychaete families in the area were identified during GSRNOD15A. The total number of families with increasing number of samples was estimated at 26, 27, and 29 by Bootstrap, Chao1, and Jacknife2, respectively. At the genus or species level, 53 polychaete taxa were identified, however only 26% of these were shared among the three sites. Moreover, taxon-accumulation curves suggest that only part (62–85%) of the total taxon richness has been characterized (Figure 4). Bootstrap estimated that with increasing number of sites and samples there are, respectively, 61 and 63 polychaete taxa in the study area, whereas Chao1 estimated 77 and 77 taxa and Jacknife2 estimated 78 and 85 taxa, respectively. B6S02 had a higher number of observed polychaete taxa (Sobs) and a higher estimated total taxon richness (Jacknife2 and Bootstrap) than B4S03 and B4N01. However, based on the Chao1 estimator, site B4S03 had higher total taxon richness than sites B6S02 and B4N01 (Figure 5). The minimum number of additional samples required to encompass 100% of the taxon richness estimated by Chao1 is 76 samples, while 24 samples are required to encompass 95% of the estimated taxon richness.
Multivariate analysis revealed no site effect on polychaete community composition (1-factor Permanova, pseudo-F(2, 9) = 1.085, pPERM = 0.37; Supplementary Material 3). Polychaete abundance was significantly and positively correlated with nodule abundance (rS = 0.61, p = 0.036). No other statistically significant correlations between the lower or higher polychaete taxon diversity indices and the polymetallic nodule parameters were observed (p > 0.05).
Isopoda abundance, species diversity and community composition
Regarding Isopoda, a total of 200 organisms representing 18 different taxa were sampled in the GSR license area (Supplementary Material 1). All belonged to the superfamily Janiroidea. The average isopod abundance (±SE) was 17 ± 4 ind.m−2 at B6S02, 18 ± 5 ind.m−2 at B4S03, and 15 ± 4 ind.m−2 at B4N01 and did not differ significantly between sites (1-factor Permanova, pseudo-F(2, 9) = 0.1214, pPERM = 0.89). In terms of abundance, 90% of the Isopoda belonged to six different families: Nannoniscidae (34% of the total isopod abundance), Desmosomatidae (24%), Macrostylidae (16%), Dendrotionidae (10%), Haploniscidae (4%), and Ischnomesidae (2%) (Figure 3). Damaged isopod specimens which could not be identified to the family level comprised 10% of the total isopod abundance. Average relative abundance was not significantly affected by the factor “site” (1-factor Permanova, for all tests pPERM > 0.05) for any of the isopod families.
None of the isopod community descriptors (whether calculated based on genus/species level or family level) were significantly affected by the factor “site” (Table 3). Seven isopod families were identified in the GSR license area. Based on taxon-accumulation curves, Bootstrap estimated a total number of seven families, whereas Chao1 and Jacknife2 estimated eight families. Hence, isopod family diversity was largely captured (88–100%) by our samples. At the genus or species level, only 11% of the taxa were shared among the three sites, while 59–83% of the isopod taxon richness has been characterized: 18 taxa were observed, whereas Bootstrap estimated 21 and 22 taxa with increasing number of sites and samples, respectively, Chao1 estimated 26 and 26 taxa, respectively, and Jacknife2 27 and 31 taxa, respectively (Figure 4). In line with Polychaeta, when taking into account three boxcores, the number of observed isopod taxa (Sobs) and the estimated total taxon richness (Chao1, Jacknife2, and Bootstrap) was higher at B6S02 compared to B4S03 and B4N01 (Figure 5). The minimum number of additional samples required to encompass 100% of the taxon richness estimated by Chao1 is 54 samples, while 22 samples would be sufficient to encompass 95% of the estimated taxon richness.
Multivariate analysis revealed no site effect on isopod community composition (1-factor Permanova, pseudo-F(2, 9) = 0.9296, pPERM = 0.54; Supplementary Material 4). We found no statistically significant correlations between the isopod abundance or the lower or higher taxon diversity indices and the polymetallic nodule parameters (p > 0.05).
Discussion
The macrofauna community and habitat heterogeneity in the GSR license area
This study provides one of the first insights in the abundance, diversity, and community composition of macrofauna associated with nodule areas in the GSR license area in the CCFZ (but see: Hecker and Paul, 1979; Wilson, 2016). Although habitat differences between the sampling sites based on sediment environmental data was larger than expected based on bathymetry and slope maps, apparently they had no large impact on total macrofauna and polychaete abundances. However, total macrofaunal genus/species diversity as well as polychaete family diversity was significantly higher in the eastern side of the GSR license area (B6S02). Since we found no clear between-site difference in nodule parameters (estimated from a limited number of box core deployments), diversity differences might be driven by sediment related habitat differences and the flux of surface-produced particulate organic carbon (POC) to the seafloor. POC generally constitutes the main carbon and energy source in the deep sea and is assumed to be one of the main drivers of the distribution and composition of deep-sea benthic communities (Ruhl and Smith, 2004; Wei et al., 2010). Lutz et al. (2007) modeled seafloor POC flux based on water depth and seasonal variability in remote-sensed net primary productivity between 19 August 1997 and 24 June 2004. Gridded POC flux data from Lutz et al. (2007) was used to calculate the average annual seafloor POC flux for each of the GSR sites in ArcGIS 10.3 using the Zonal statistics tool. Based on the annual average POC flux, a latitudinal and longitudinal gradient characterized the GSR license area, with briefly increasing POC values from B4N01 (1.51 g Corg m−2 year−1) to B4S03 (1.56 g Corg m−2 year−1) to B6S02 (1.61 g Corg m−2 year−1). This increase in POC from the northwest to the southeast, along with changes in sediment environmental parameters, likely contributed to the significantly higher total macrofauna and polychaete taxon diversity at B6S02 compared to B4N01.
Similarly, Smith et al. (2008) reported a substantial decline in macrofauna, and especially polychaete abundance and diversity from the eastern French license area (IFREMER/AFRENOD east zone) and Kaplan site East to the western French license area (IFREMER/AFRENOD west zone) and Kaplan site West in the CCFZ. This decline likely results from a gradual decrease in the flux of POC from east to west (Smith and Demopoulos, 2003). Consequently, Smith et al. (2008) observed a large habitat difference between the western and eastern areas, with the western area characterized by higher substrate heterogeneity (Smith et al., 2008). In line with Smith et al. (2008), Hecker and Paul (1979), Wilson (2016), and Paterson et al. (1998) reported a decline in overall macrofauna and polychaete abundances from higher to lower productivity sites in the eastern equatorial Pacific. The trends observed in these studies are more pronounced than the findings reported here, which is probably due to the large distance between their sampling sites (~1,500, 2,800, 2,800, and 2,500 km, respectively), and hence a potentially high degree of habitat heterogeneity at broader spatial scales in the northeast Pacific abyss.
In general, macrofaunal abundance, diversity, and community composition were similar between sites in the GSR license area, implying that the macrofaunal community associated with polymetallic nodule areas is, at least at scales of 10 to 100 s of km, somewhat homogeneous. This finding is in line with results from a megafauna study suggesting that the deep-sea megafauna in the eastern CCFZ (dominated for 63.5% by sessile morphotypes) may be relatively homogenous on scales of 1 to 100 s of km (Amon et al., 2016). However, small differences in estimated seafloor POC flux, nodule abundance and sediment environmental variables among sites, might contribute to slight differences in macrofaunal abundance and diversity observed in the GSR license area.
Comparison with other studies in the area
Nematoda, Copepoda, Ostracoda, and Kinorhyncha are often considered typical meiofaunal taxa and are therefore generally not included in macrofauna studies. To enable comparison of macrofaunal abundances in our samples from the GSR license area with other nodule-bearing sites in the Pacific (Hessler and Jumars, 1974; Snider et al., 1984; Borowski and Thiel, 1998) and the Indian Ocean (Ingole et al., 2001), macrofauna abundances were determined both including and excluding the typical meiofauna taxa.
Excluding typical meiofaunal taxa, macrofaunal abundances observed in our study (average: 195 ind.m−2, range: 132–272 ind.m−2) fell within the lower to middle range of macrofaunal abundances reported for other nodule-bearing sites (Figure 6). The only other macrofaunal study that did not omit typical meiofauna taxa was that of Ingole et al. (2001), and the average macrofauna abundance (336 ind.m−2) these authors reported was lower than the macrofaunal abundance including meiofauna in our study (average: 586 ind.m−2, range: 380–712 ind.m−2; Figure 6). The macrofauna at the Pacific MPG-I site (Snider et al., 1984) and at the PRA site (a region set aside and excluded from mining as a stable reference area; Wilson, 2016) exhibited aberrantly high abundance (≥1,000 ind.m−2), relative to other areas (Figure 6). Only Polychaeta and Isopoda were identified to the lowest possible taxon level, however, 100 different macrofauna taxa were identified from 12 box cores in the GSR license area. Hessler and Jumars (1974) collected 108 macrofaunal species in 10 box cores at the CLIMAX II site in the oligotrophic central North Pacific, compared to 381 macrofaunal species reported for the more productive DOMES sites in the eastern Equatorial Pacific (Hecker and Paul, 1979). Because different taxonomic resolutions and sampling efforts limit comparisons of taxon richness between this study and other macrofauna studies conducted at abyssal nodule sites, caution is recommended regarding the interpretation of the results.
Figure 6
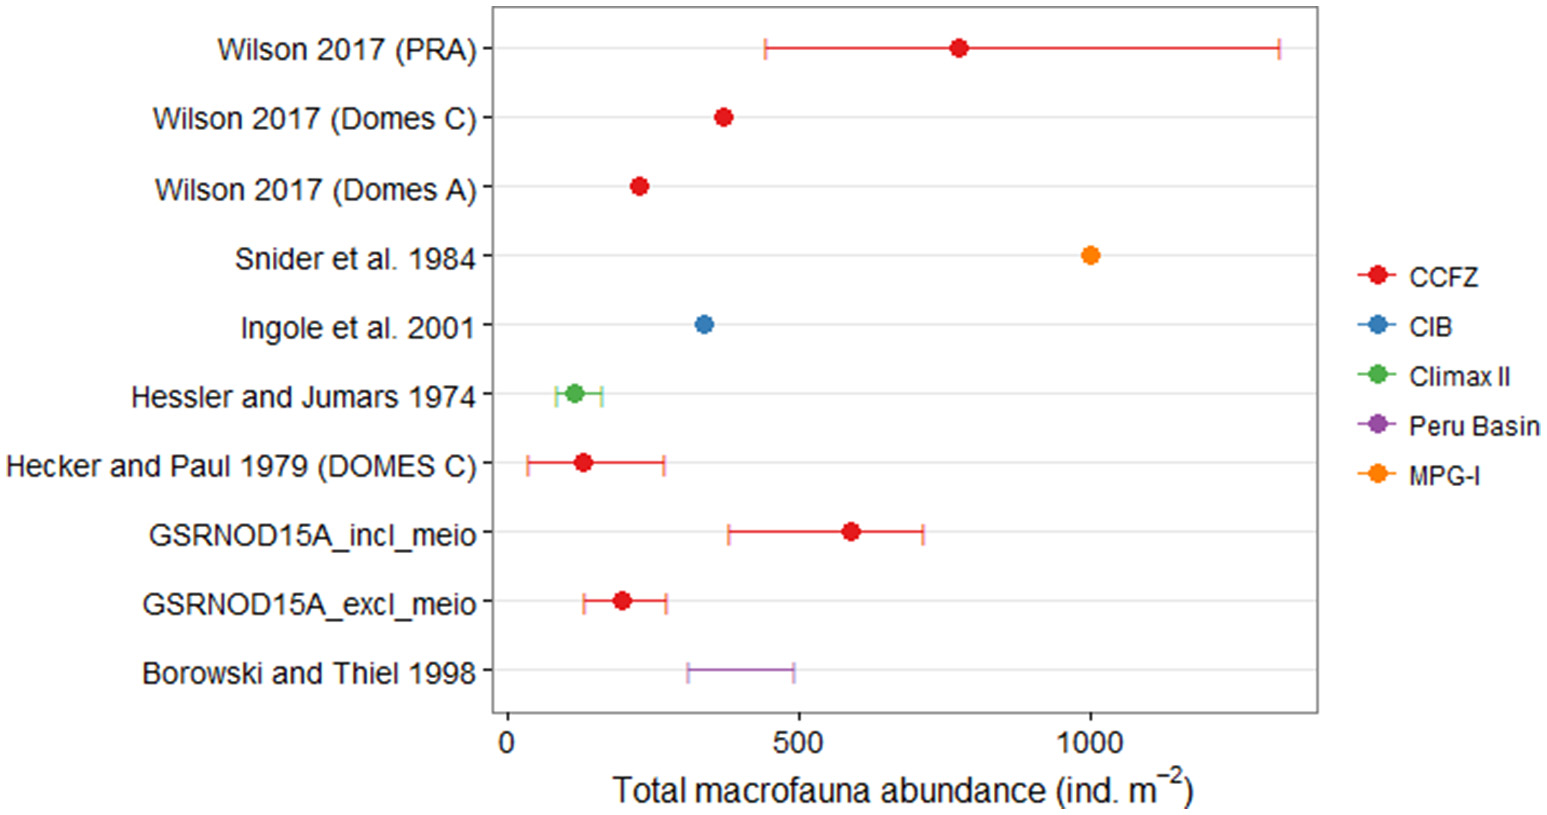
Comparison of the average macrofauna abundances (ind.m−2) and the abundance range (if available) between the current study (GSRNOD15A) and other macrofauna studies conducted at abyssal nodule sites. For the current study, abundances are reported for all macrofauna taxa both including and excluding typical meiofauna taxa (i.e., nematodes, copepods, ostracods, and kinorhynchs). Colors indicate the studied areas. The macrofauna study of Ingole et al. (2001) was the only one, besides this study, that involved typical meiofauna taxa. CCFZ, Clarion-Clipperton Fracture Zone; CIB, Central Indian Ocean Basin. Locations of the CCFZ macrofauna studies mentioned here are show in Figure 1.
Polychaetes were the predominant macrofaunal taxon at the nodule-bearing MPG-I (Snider et al., 1984) and CLIMAX II sites (Hessler and Jumars, 1974) in the northeast Pacific, and in nodule fields of the South Pacific (Borowski and Thiel, 1998; predisturbance conditions) and the Central Indian Ocean (Ingole et al., 2001; predisturbance conditions). Similarly, polychaetes comprised a considerable fraction (21–44%) of macrofaunal abundances in the GSR license area. Polychaete abundances in the PRA site (situated within zone A1 of the GSR license area), were elevated compared to the ECHO/DOMES C site (located in zone A3 of the GSR concession area; Paterson et al., 1998; Glover et al., 2002; Wilson, 2016), which likely results from the more productive waters in which PRA is located (Wilson, 2016). The polychaete taxon richness in the GSR license area (53 taxa identified) is higher than in the oligotrophic CLIMAX II site (46 species; Hessler and Jumars, 1974), slightly lower than the 69 species identified during the Kaplan project (Smith et al., 2008), and only half as high as the number of species in the DOMES A (104 species), PRA (100 species), and ECHO (113 species) sites (Paterson et al., 1998). The sampling intensity in the latter studies varied between 10 (CLIMAX II) and 47 (DOMES A) box core samples per site, and thus was much higher than in our study.
Comparison with other nodule-bearing sites revealed somewhat low macrofaunal abundance and taxon diversity in the GSR license area. The polychaetes and isopods sampled from the GSR license area were identified to lower taxonomical levels. However, identification of all macrofauna to a lower taxonomical level, preferably to species, would be required to fully characterize biogeographical patterns in the CCFZ (ISA, 2015). Despite the limited sampling in our study (12 box cores), we characterized a large fraction (59–85%) of the macrofaunal genus/species diversity (depending on the richness estimator used and the macrofauna taxon of interest) belonging to this specific habitat type (i.e., nodule rich sediments). However, a more realistic picture of macrofaunal abundance and diversity in the habitat type under study requires more extensive sampling (e.g., increasing the number of deployments per site; Grassle, 1991) as indicated by the higher than observed species diversity estimates. Previous studies have shown that most species in the deep-sea macrofauna are rare (Grassle and Maciolek, 1992). Rare species have to be considered in any ecological study or management plan appreciating the overall importance of local-scale ecological interactions (Gage, 2004). Because rare species may represent transient propagules of populations well established elsewhere (Gage, 2004), they represent key elements of the ecosystem when considering colonization of previously disturbed (e.g., mined) habitats. The additional sampling effort necessary to capture all the estimated taxa in this study ranged from 5.47 (Isopoda) to 11.28 (total macrofauna) times the original sampling size (i.e., ranging from 66 to 135 box cores). Chao et al. (2009) suggest using the 95% fraction because it would encompass most taxa, with more realistic sampling objectives. The effort needed to reach this 95% fraction is substantially lower, ranging from 2.82 (Isopoda) to 3.96 (total macrofauna) times the original sample size (i.e., ranging from 34 to 46 box cores). This estimate of the number of replicates applies only to the specific habitat type. A more realistic view on abundance and species richness will have to consider habitat heterogeneity in the GSR license area. However, most abyssal studies never reach this number of quantitative replicates [e.g., in the CCFZ, Hecker and Paul (1979) collected 8 box cores in DOMES C, Paterson et al. (1998) collected 15 box cores from the ECHO site, Wilson (2016) report 16 boxcores from the PRA site and 50 boxcores from DOMES A (of which 24 in November 1977 and 26 in May 1978), and Smith et al. (2008) collected 13, 7, and 4 box cores in sites Kaplan East, Central and West, respectively]. Hence, as pointed out by Wilson (2016), capturing all species is unrealistic because of the logistics of processing large numbers of samples; working with smaller numbers of samples and using estimation techniques will therefore have to suffice.
Implications for management
Notwithstanding differences in the sediment environmental variables and the POC flux to the seafloor, we observed a homogeneous macrofaunal community associated with polymetallic nodule areas over spatial scales of 10 to 100 s of km. This observed homogeneity in the macrofaunal community might dampen the expected mining impact on macrofaunal diversity at small scales through recovery from adjacent, unimpacted areas, however, a precautionary approach is recommended because of the large uncertainty in the spatial and temporal scale and intensity of deep-sea mining activities (Wedding et al., 2015). Therefore, prior to investigating the impact of (test) mining and the potential selection of protection zones, a better understanding of regional habitat heterogeneity and associated fauna should be achieved. In order to estimate this ecological variability in the area, habitat mapping is required (Cordes et al., 2016). Indeed, the macrofaunal community might be structured by differences in habitat heterogeneity between areas suited for mining and areas that are not mineable, such as differences in seabed slope and nodule parameters, which were not taken into account in our study. If the turnover of species between areas characterized by considerable slope (e.g., ≥3%) and relatively flat areas are found to be small, slope areas can be designated as preservation reference zones, preserving portions of diverse habitats and associated macrofaunal biodiversity, and ecosystem functioning.
Conclusion
One of the first insights in the abundance, diversity, and community composition of macrofauna associated with nodule areas in the GSR license area in the CCFZ is provided.
A homogeneous but diverse macrofaunal community associated with the sediment from polymetallic nodule areas was observed at a scale of 10 to 100 s of km.
Differences in the abundance and diversity of Polychaeta among sites can be explained by a decline in the estimated flux of POC along a southeast-northwest gradient, as well as by small differences in sediment characteristics and nodule abundance.
Despite the limited sampling in our study (12 box cores), we characterized a large fraction (59–85%) of the macrofaunal genus/species diversity belonging to the habitat type under study (i.e., nodule rich sediments).
A more realistic view on abundance and species richness will have to consider habitat heterogeneity in the GSR license area.
Statements
Author contributions
Conceived and designed the sampling design: EP and AV. Performed the sampling: EP and LC. Processed the samples: BD, TR, and PB. Analyzed the data: BD. Wrote the paper: BD, EP, TR, PB, and AV.
Acknowledgments
The authors would like to thank the captain and the crew of the RV “Mt. Mitchell,” François Charlet (GSR), Tom De Wachter (GSR), Niels Viaene (Marine Biology Research Group, UGent), Freija Hauquier (Marine Biology Research Group, UGent), Alison Proctor (OFG), Phil and Tony Wass (OFG), and Nick Eloot (G-TEC) for their help during the GSRNOD14A and/or GSRNOD15A expeditions. Dirk Van Gansbeke, Niels Viaene and Bart Beuselinck are acknowledged for their help during sample processing. Also thanks to Tomas Dahlgren and Craig Smith for their valuable advice regarding on-board sample processing or storage, and to Lenaick Menot (IFREMER) for facilitating the polychaete identifications in Brest. Tom De Smet was thanked for improving the language of the manuscript. The environmental baseline survey in the GSR license area is supported by a service arrangement between Global Sea Mineral Resources N.V and Ghent University.
Conflict of interest
The authors declare that the research was conducted in the absence of any commercial or financial relationships that could be construed as a potential conflict of interest.
Supplementary material
The Supplementary Material for this article can be found online at: http://journal.frontiersin.org/article/10.3389/fmars.2017.00103/full#supplementary-material
References
1
Amon D. J. Ziegler A. F. Dahlgren T. G. Glover A. G. Goineau A. Gooday A. J. et al . (2016). Insights into the abundance and diversity of abyssal megafauna in a polymetallic-nodule region in the eastern Clarion-Clipperton Zone. Sci. Rep.6:30492. 10.1038/srep30492
2
Anderson M. J. Gorley R. N. Clarke K. R. (2008). PERMANOVA+ for PRIMER: Guide to Software and Statistical Methods. Plymouth: PRIMER-E.
3
Bluhm H. (2001). Re-establishment of an abyssal megabenthic community after experimental physical disturbance of the seafloor. Deep Sea Res. II Top. Stud. Oceanogr.48, 3841–3868. 10.1016/S0967-0645(01)00070-4
4
Borowski C. Thiel H. (1998). Deep-sea macrofaunal impacts of a large-scale physical disturbance experiment in the Southeast Pacific. Deep Sea Res. II Top. Stud. Oceanogr.45, 55–81. 10.1016/S0967-0645(97)00073-8
5
Chao A. Colwell R. K. Lin C.-W. Gotelli N. J. (2009). Sufficient sampling for asymptotic minimum species richness estimators. Ecology90, 1125–1133. 10.1890/07-2147.1
6
Clark A. L. Coock Clark J. Pintz S. (2013). Towards the Development of a Regulatory Framework for Polymetallic Nodule Exploitation in the Area. Kingston: International Seabed Authority.
7
Clarke K. R. Gorley R. N. (2006). Primer V6: User Manual/Tutorial. Plymouth, UK: PRIMER-E.
8
Cordes E. E. Jones D. O. Schlacher T. A. Amon D. J. Bernardino A. F. Brooke S. et al . (2016). Environmental impacts of the deep-water oil and gas industry: a review to guide management strategies. Front. Environ. Sci.4:58. 10.3389/fenvs.2016.00058
9
Gage J. D. (2004). Diversity in deep-sea benthic macrofauna: the importance of local ecology, the larger scale, history and the Antarctic. Deep Sea Res. II Top. Stud. Oceanogr.51, 1689–1708. 10.1016/j.dsr2.2004.07.013
10
Giere O. (2009). Meiobenthology. Berlin, Heidelberg: Springer Berlin Heidelberg. Available online at: http://link.springer.com/10.1007/978-3-540-68661-3 (Accessed October 21, 2016).
11
Glover A. Dahlgren T. G. Wiklund H. Smith C. R. (2015). An end-to-end DNA taxonomy methodology for biodiversity survey in the central Pacific abyssal plain. J. Mar. Sci. Eng.4:2. 10.3390/jmse4010002
12
Glover A. Paterson G. Bett B. Gage J. Sibuet M. Sheader M. et al . (2001). Patterns in polychaete abundance and diversity from the Madeira Abyssal Plain, northeast Atlantic. Deep Sea Res. Part Oceanogr. Res. Pap.48, 217–236. 10.1016/S0967-0637(00)00053-4
13
Glover A. G. Smith C. R. Paterson G. L. J. Wilson G. D. F. Hawkins L. Sheader M. (2002). Polychaete species diversity in the central Pacific abyss: local and regional patterns, and relationships with productivity. Mar. Ecol. Prog. Ser.240, 157–170. 10.3354/meps240157
14
Grassle J. F. (1991). Deep-sea benthic biodiversity. Bioscience41, 464. 10.2307/1311803
15
Grassle J. F. Maciolek N. J. (1992). Deep-sea species richness: regional and local diversity estimates from quantitative bottom samples. Am. Nat.139, 313–341. 10.1086/285329
16
Halbach P. Fellerer R. (1980). The metallic minerals of the Pacific Seafloor. GeoJournal4, 407–421. 10.1007/BF01795925
17
Halbach P. Özkara M. Hense J. (1975). The influence of metal content on the physical and mineralogical properties of pelagic manganese nodules. Miner. Deposita10, 397–411. 10.1007/bf00207897
18
Hecker B. Paul A. Z. (1979). Abyssal community structure of the benthic infauna of the eastern equatorial Pacific: DOMES Sites, A, B, and C, in Marine Geology and Oceanography of the Pacific Manganese Nodule Province, eds BischoffJ. L.PiperD. Z.(Springer US), 287–308. Available online at: http://link.springer.com/chapter/10.1007/978-1-4684-3518-4_8 (Accessed October 8, 2014).
19
Hessler R. R. Jumars P. A. (1974). Abyssal community analysis from replicate box cores in the central North Pacific. Deep Sea Res. Oceanogr. Abstr.21, 185–209. 10.1016/0011-7471(74)90058-8
20
Ingole B. S. Ansari Z. A. Rathod V. Rodrigues N. (2001). Response of deep-sea macrobenthos to a small-scale environmental disturbance. Deep Sea Res. II Top. Stud. Oceanogr.48, 3401–3410. 10.1016/S.0967-0645(01)00048-0
21
ISA . (2015). Deep sea macrofauna of the Clarion-Clipperton Zone (CCZ) Taxonomic Standardization Workshop, Uljin, The Republic of Korea, 23–30 November 2014. Jamaica: International Seabed Authority.
22
ISA-LTC (2013). ISBA/19/LTC/8.Kingston: International Seabed Authority - Legal and Technical Commision.
23
Janssen A. Kaiser S. Meißner K. Brenke N. Menot L. Martínez Arbizu P. (2015). A reverse taxonomic approach to assess macrofaunal distribution patterns in abyssal pacific polymetallic nodule fields. PLoS ONE10:e0117790. 10.1371/journal.pone.0117790
24
Jumars P. A. (1981). Limits in predicting and detecting benthic community responses to manganese nodule mining. Mar. Min.3, 213–229.
25
Lutz M. J. Caldeira K. Dunbar R. B. Behrenfeld M. J. (2007). Seasonal rhythms of net primary production and particulate organic carbon flux to depth describe the efficiency of biological pump in the global ocean. J. Geophys. Res. Oceans112:C10011. 10.1029/2006jc003706
26
Magurran A. (2004). Measuring Biological Diversity. Oxford: Blackwell Publishing.
27
Mero J. L. (1965). The Mineral Resources of the Sea. New York, NY: Elsevier.
28
Miljutin D. Miljutina M. Arbizu P. M. Galéron J. (2011). Deep-sea nematode assemblage has not recovered 26 years after experimental mining of polymetallic nodules (Clarion-Clipperton Fracture Zone, Tropical Eastern Pacific). Deep Sea Res. Oceanogr. Res. Pap.58, 885–897. 10.1016/j.dsr.2011.06.003
29
Mullineaux L. S. (1987). Organisms living on manganese nodules and crusts: distribution and abundance at three North Pacific sites. Deep Sea Res. Oceanogr. Res. Pap.34, 165–184. 10.1016/0198-0149(87)90080-X
30
Paterson G. L. Wilson G. D. Cosson N. Lamont P. A. (1998). Hessler and Jumars (1974) revisited: abyssal polychaete assemblages from the Atlantic and Pacific. Deep Sea Res. II45, 225–251. 10.1016/S.0967-0645(97)00084-2
31
Radziejewska T. Rokickia-Praxmajer J. Stoyanova V. (2001). IOM BIE Revisited: Meiobenthos at the IOM BE Site 5 Years after the Experimental Disturbance. Szczecin: International Society of Offshore and Polar Engineers.
32
R Development Core Team (2015). R: A Language and Environment for Statistical Computing. Vienna: R Foundation for Statistical Computing. Available obnline at: http://www.R-project.org
33
Riehl T. Brenke N. Brix S. Driskell A. Kaiser S. Brandt A. (2014). Field and Laboratory Methods for DNA studies on deep-sea isopod crustaceans. Pol. Polar Res.35, 203–224. 10.2478/popore-2014-0018
34
Ruhl H. A. Smith K. L. (2004). Shifts in deep-sea community structure linked to climate and food supply. Science305, 513–515. 10.1126/science.1099759
35
Smith C. Demopoulos W. R. (2003). The deep Pacific ocean floor, in Ecosystems of the World, ed TylerP. A.(Amsterdam: Elsevier), 179–218.
36
Smith C. R. Paterson G. Lambshead J. Glover A. Rogers A. Gooday A. et al . (2008). Biodiversity, Species Ranges, and Gene Flow in the Abyssal Pacific Nodule Province: Predicting and Managing the Impacts of Deep Seabed Mining.Kingston: International Seabed Authority.
37
Snider L. J. Burnett B. R. Hessler R. R. (1984). The composition and distribution of meiofauna and nanobiota in a central North Pacific deep-sea area. Deep Sea Res. Oceanogr. Res. Pap.31, 1225–1249.
38
Thiel H. Schriever G. Ahnert A. Bluhm H. Borowski C. Vopel K. (2001). The large-scale environmental impact experiment DISCOL—reflection and foresight. Deep Sea Res. II Top. Stud. Oceanogr.48, 3869–3882. 10.1016/S0967-0645(01)00071-6
39
Tilot V. (2006). Biodiversity and Distribution of the Megafauna. Vol. 1: the Polymetallic Nodule Ecosystem of the Eastern Equatorial Pacific Ocean. Paris: UNESCO.
40
Vanreusel A. Hilario A. Ribeiro P. A. Menot L. Arbizu P. M. (2016). Threatened by mining, polymetallic nodules are required to preserve abyssal epifauna. Sci. Rep.6:26808. 10.1038/srep26808
41
Veillette J. Juniper S. K. Gooday A. J. Sarrazin J. (2007). Influence of surface texture and microhabitat heterogeneity in structuring nodule faunal communities. Deep Sea Res. Oceanogr. Res. Pap.54, 1936–1943. 10.1016/j.dsr.2007.06.012
42
Wedding L. M. Reiter S. M. Smith C. R. Gjerde K. M. Kittinger J. N. Friedlander A. M. et al . (2015). Managing mining of the deep seabed. Science349, 144–145. 10.1126/science.aac6647
43
Wei C.-L. Rowe G. T. Escobar-Briones E. Boetius A. Soltwedel T. Caley M. J. et al . (2010). Global patterns and predictions of seafloor biomass using random forests. PLoS ONE5:e15323. 10.1371/journal.pone.0015323
44
Wilson G. D. F. (2016). Macrofauna abundance, species diversity and turnover at three sites in the Clipperton-Clarion Fracture Zone. Mar. Biodivers.10.1007/s12526-016-0609-8. [Epub ahead of print].
Summary
Keywords
polymetallic nodules, macrofauna, deep sea, CCFZ, biodiversity, community structure, deep-sea mining
Citation
De Smet B, Pape E, Riehl T, Bonifácio P, Colson L and Vanreusel A (2017) The Community Structure of Deep-Sea Macrofauna Associated with Polymetallic Nodules in the Eastern Part of the Clarion-Clipperton Fracture Zone. Front. Mar. Sci. 4:103. doi: 10.3389/fmars.2017.00103
Received
26 January 2017
Accepted
27 March 2017
Published
11 April 2017
Volume
4 - 2017
Edited by
Ricardo Serrão Santos, University of the Azores, Portugal
Reviewed by
Andrew R. Thurber, Oregon State University, USA; Paul Snelgrove, Memorial University of Newfoundland, Canada
Updates
Copyright
© 2017 De Smet, Pape, Riehl, Bonifácio, Colson and Vanreusel.
This is an open-access article distributed under the terms of the Creative Commons Attribution License (CC BY). The use, distribution or reproduction in other forums is permitted, provided the original author(s) or licensor are credited and that the original publication in this journal is cited, in accordance with accepted academic practice. No use, distribution or reproduction is permitted which does not comply with these terms.
*Correspondence: Bart De Smet badsmet.desmet@ugent.be
This article was submitted to Deep-Sea Environments and Ecology, a section of the journal Frontiers in Marine Science
Disclaimer
All claims expressed in this article are solely those of the authors and do not necessarily represent those of their affiliated organizations, or those of the publisher, the editors and the reviewers. Any product that may be evaluated in this article or claim that may be made by its manufacturer is not guaranteed or endorsed by the publisher.