 Paraskevi Pitta1*
 Maria Kanakidou2
 Nikolaos Mihalopoulos2,3
 Sylvia Christodoulaki1,2Panagiotis D. Dimitriou1,4Constantin Frangoulis1
 Antonia Giannakourou5Margarita Kagiorgi1
 Anna Lagaria1Panagiota Nikolaou2
 Nafsika Papageorgiou1
 Stella Psarra1Ioulia Santi1,4
 Manolis Tsapakis1
 Anastasia Tsiola1,4
 Kalliopi Violaki2
 George Petihakis1
- 1Hellenic Centre for Marine Research, Institute of Oceanography, Heraklion, Greece
- 2Chemistry Department, University of Crete, Heraklion, Greece
- 3Institute for Environment and Sustainable Development, National Observatory of Athens, Athens, Greece
- 4Biology Department, University of Crete, Heraklion, Greece
- 5Hellenic Centre for Marine Research, Institute of Oceanography, Athens, Greece
The effect of episodicity of Saharan dust deposition on the pelagic microbial food web was studied in the oligotrophic Eastern Mediterranean by means of a mesocosm experiment in May 2014. Two different treatments in triplicates (addition of natural Saharan dust in a single-strong pulse or in three smaller consecutive doses of the same total quantity), and three unamended controls were employed; chemical and biological parameters were measured during a 10-day experiment. Temporal changes in primary (PP) and bacterial (BP) production, chlorophyll a (Chl a) concentration and heterotrophic bacteria, Synechococcus and mesozooplankton abundance were studied. The results suggested that the auto- and hetero-trophic components of the food web (at least the prokaryotes) were enhanced by the dust addition (and by the nitrogen and phosphorus added through dust). Furthermore, a 1-day delay was observed for PP, BP, and Chl a increases when dust was added in three daily doses; however, the maximal values attained were similar in the two treatments. Although, the effect was evident in the first osmotrophic level (phytoplankton and bacteria), it was lost further up the food web, masked under the impact of grazing exerted by predators such as heterotrophic flagellates, ciliates and dinoflagellates. This was partly proved by two dilution experiments. This study demonstrates the important role of atmospheric deposition and protist grazing when evaluating the effect on oligotrophic systems characterized by increased numbers of trophic levels.
Introduction
Atmospheric deposition is an important source of macro-nutrients and micro-trace metals to the ocean (Jickells et al., 2005; Mahowald et al., 2008). In high-nutrient low-chlorophyll (HNLC) areas, dust deposition provides iron to the ocean surface and therefore stimulates phytoplankton growth rate and ocean productivity (Martin, 1990; Jickells et al., 2005; Boyd et al., 2007). In low-nutrient low-chlorophyll (LNLC) areas, dust deposition also affects the productivity and function of the ecosystem through the simultaneous input of phosphate and iron (Blain et al., 2004; Mills et al., 2004; Marañón et al., 2010).
The Eastern Mediterranean is a typical LNLC environment. The low nutrient concentrations, caused by the lack of large rivers in the eastern basin and deteriorated by the Mediterranean anti-estuarine circulation, together with the nitrate:phosphate (N:P) ratio in the deep layers of ca. 28:1, far in excess of the Redfield ratio of 16:1, result in a P-limited system (Krom et al., 1991, 2005a; Kress and Herut, 2001). After the winter-spring bloom period and during the summer (warm) stratification period, inorganic nutrient concentrations are extremely low in the surface layers. A Lagrangian experiment in the Levantine Sea suggested bacterioplankton limitation by phosphorus (P) and phytoplankton co-limitation by nitrogen (N) & P in the summer (Krom et al., 2005b; Pitta et al., 2005; Thingstad et al., 2005; Zohary et al., 2005). A mesocosm experiment, conducted in the Cretan Sea during late summer, using a comparable, in terms of nutrient content, but different water mass, supported these findings (Pitta et al., 2016). However, N-limitation of primary production (Lagaria et al., 2011) and N & P co-limitation of heterotrophic prokaryote growth (Tanaka et al., 2011) have also been found during summer time in the Levantine Basin during microcosm experiments, although the ratio N:P in both dissolved and particulate organic fractions suggested P starvation.
The Mediterranean Sea receives one of the highest inputs of atmospheric dust in the contemporary ocean throughout the year, mainly from the Sahara Desert (20–50 × 106 tons yr−1, Guerzoni et al., 1999). Therefore, during the warm stratification period of limited nutrient availability, Saharan dust is not only a significant but the dominant supplier of inorganic nutrients and trace metals to the surface layers of the Eastern Mediterranean. A lot is known about the mineralogical composition, the transformation during Aeolian transportation and the chemical fate of the Saharan dust in the surface layers of the Mediterranean Sea (Guerzoni et al., 1999; Desboeufs et al., 2014). However, the effect of dust deposition on the biological productivity and function of the surface pelagic ecosystem have been much less studied. To fill this knowledge gap, both microcosm and mesocosm experiments were performed.
Microcosm experiments, conducted at both the Western and the Eastern Mediterranean, have provided a lot of information on biological processes and biomass; however, the results of these experiments are very fragmented. For instance, a microcosm experiment conducted in Blanes Bay, Spain, in May 2006, resulted in an increased bacterial abundance and production and in altered bacterial diversity (Lekunberri et al., 2010; Romero et al., 2011) but, in terms of phytoplankton, it produced increases only in autotrophic nanoflagellates (Romero et al., 2011). Two microcosm experiments conducted in August 2003 and 2006, using water from the DYFAMED station, reported increases in primary production (Bonnet et al., 2005) and bacterial abundance and respiration (Pulido-Villena et al., 2008). Only one microcosm experiment, conducted earlier (May 2002) in the Eastern Mediterranean, provides information on both biomass and rates of the auto- and hetero-trophic components of the food web as well as on P uptake and, at the same time, on larger grazers such as pelagic ciliates (Herut et al., 2005).
Although, providing valuable information in many aspects, all microcosm experiments suffer from a main drawback, which is the experimental volume; microcosms are usually small-volume (<10 or a few tens of liters) bottles. For this reason, only the lower trophic food web can be studied; no results can be obtained on zooplankton because the natural zooplankton density is too low. Furthermore, the duration of microcosm experiments cannot easily exceed 2–3 days so only the short-scale effects may be studied. Finally, modern molecular techniques requiring large sampling volumes cannot be used.
One way to overcome these difficulties is to perform mesocosm experiments, i.e., large-volume experimental set ups which allow hypothesis testing under replicated, controlled, and repeatable conditions as close as possible to the natural environment. Two large-scale in situ mesocosm experiments took place in the Western Mediterranean, in 2008 and 2010, in order to study the effect of Saharan dust on the pelagic environment. The available information on the biological processes from these two experiments comes from four publications that focus on either the autotrophic (Giovagnetti et al., 2013; Ridame et al., 2014) or the heterotrophic (Laghdass et al., 2011; Pulido-Villena et al., 2014) component of the food web. During the 2008 experiment, a single-dose dust addition resulted in a 2-fold increase in the Chl a concentration (Laghdass et al., 2011) but the heterotrophic bacterial abundance was not affected; total and active bacterial community clustered according to the sampling time points but independently of treatment. During the 2010 experiment, during which dust was added in two doses, the results were more or less similar regarding the heterotrophic component (Pulido-Villena et al., 2014). As far as the autotrophic component is concerned, Giovagnetti et al. (2013) showed differential responses of different size fractions to the dust addition, with picophytoplankton increasing mainly after the first seeding while the second addition led to an increase in both pico- and nano/microphytoplankton.
However, there is very scarce or no information published on biological productivity, either primary (in only Ridame et al., 2014) or bacterial production. In addition, the impact of grazing was only studied as far as heterotrophic flagellates are concerned; the effect of larger grazers such as pelagic ciliates is missing, even though ciliates constitute one of the major grazing groups in the oligotrophic Mediterranean (Pitta et al., 2001). The effect of dust addition on meso-zooplankton is also missing. Finally, often phytoplankton is examined only in relation to nutrient availability and heterotrophs only in relation to grazing although it is well-known that very complex trophic relationships characterize the microbial food web, especially in oligotrophic environments with resource scarcity.
In order to study the effect of Saharan dust on the oligotrophic Eastern Mediterranean, two mesocosm experiments were performed in Crete, in 2012 and 2014. To our knowledge, these are the first experiments that studied the biological response of the entire pelagic food web while, at the same time, a lot of attention was given to the chemical changes occurring after the dust addition. During the 2012 experiment, the addition of either natural pure Saharan dust or mixed aerosol (desert dust and polluted particles) into the ultra-oligotrophic environment of the Eastern Mediterranean in a single pulse resulted in a net response of both the auto- and the hetero-trophic components (Tsagaraki et al., in review).
The 2014 mesocosm experiment, presented here, studied the effect of dust deposition on the entire pelagic microbial food web of the Eastern Mediterranean when added in multiple, successive dust pulses. It is widely recognized that dust deposition is highly episodic, generally occurring in either single, strong events during which a large quantity of dust is added to the ocean surface within a very short time-scale of hours, or in repetitive, smaller events during which small quantities of dust are added into the sea repetitively, over a number of days (Vincent et al., 2016 and references therein). The 2012 mesocosm experiment was a simulation of the former case while the 2014 experiment was a comparison of both cases. To our knowledge, these two experiments are the first mesocosm studies in which naturally collected aerosols, not dust analogs, were used in the Mediterranean.
In May 2014, during a 10-day experiment, daily sampling allowed the disclosure of the rapid biological processes of a highly oligotrophic environment when nutrients are offered via dust. All groups, from viruses through bacteria, phytoplankton, and protozoa to zooplankton were examined in terms of abundance, production, and/or community composition.
The goals of this experiment were (1) to estimate the influence of dust addition on the microbial food web of the Eastern Mediterranean, (2) to investigate whether the quantity and episodicity of dust addition influence the dynamics of different components of the food web in terms of abundance and/or production, and (3) to examine the role of grazing of microzooplankton on different fractions of phytoplankton and also on the way the impact of dust addition on the lower food web is finally perceived.
Materials and Methods
Mesocosm Experimental Design and Sampling
A mesocosm experiment took place in May 2014 at the mesocosm facility of HCMR CRETACOSMOS (http://cretacosmos.eu) in Crete, Greece, in the framework of the project ADAMANT. To fill the mesocosms, 27 m3 of water were collected on the 8th and 9th of May aboard the R/V Philia from a site five nautical miles off the north coast of Crete (35° 24.957 N, 25° 14.441 E). Sub-surface water from 10 m depth was pumped into several 1 m3 high-density polyethylene (HDPE) barrels by means of a submersible water pump. All equipment had been previously aged for at least 1 week with tap water; subsequently, in order to avoid contamination in the highly oligotrophic conditions prevailing in this environment, all equipment used, including the HDPE barrels, were washed with HCl (10%) and rinsed three times with de-ionized water. After filling, the 1 m3 barrels were shipped to the Heraklion harbor and then transported by truck to the mesocosm facility on the north coast of Crete, 15 km east of Heraklion. From the filling of the barrels on board to their final arrival at HCMR, on average, transport took 2 h; during this time, the water temperature inside the barrels was kept unchanged by constantly pouring sea water on the barrels. Upon arrival at the mesocosm facility, the water was gravity-poured into nine mesocosms (polyethylene bags, 1.32 m diameter) of 3 m3 each. Special care was taken to divide the water equally from each of the 1 m3 barrels among all nine mesocosms in order to ensure homogeneity of initial conditions. The mesocosms were submerged in a 150 m3 concrete tank, with running surface sea water that kept the temperature stable throughout the experiment, at the levels prevailing at the site and depth from which water was collected (20 ± 0.5°C). Each mesocosm was covered by a two-layered lid which protected it from atmospheric deposition and also mimicked the light conditions at 10 m depth from where the water was pumped. Once the filling of mesocosms was completed, the water was left overnight.
The experiment started on the day after (May 10th, Day 0). Two different dust treatments were tested in triplicate mesocosms. In the first treatment (hereafter referred to as SA: single addition), Saharan dust was added only once, on the first day of the experiment (May 10th, Day 0). Four grams of natural Saharan dust collected in Crete and Cyprus (see below) were added in each of the three SA mesocosms, this quantity representing a concentration of 1.3 mg L−1. In the second treatment (hereafter referred to as RA: repetitive addition), the same total quantity as for SA but divided into three doses, was added to each of the three RA mesocosms, on the first 3 days of the experiment (May 10th, 11th, and 12th, Days 0, 1, and 2, respectively); details on the quantities of dust added are shown in Table 1. Three more mesocosms were used as the Control, where no addition was performed (hereafter referred to as Cnt). The dust addition by weight (in both treatments) is considered representative of a realistic dust deposition event of 0.7 g m−2 day−1 (Gerasopoulos et al., 2006; Ternon et al., 2010).
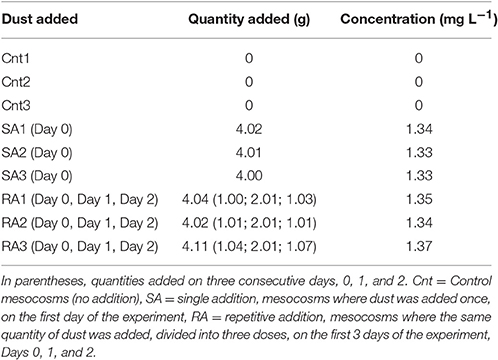
Table 1. Quantity and concentration of dust added to mesocosms, in SA (Day 0) and RA (Days 0, 1, 2).
Mixing in the mesocosms was achieved by light bubbling using a PVC tube of diameter 4 cm, creating an airlift from just above the bottom of the mesocosms and releasing the water and bubbles under the surface to avoid damaging the delicate planktonic organisms. All mesocosms were sampled daily throughout the 10-day experiment. Samples were taken by means of silicon tubes, permanently placed in all nine mesocosms, which directed the water to sampling carboys by creating a light suction using a large-volume syringe. All nine silicon tubes and sampling carboys were previously aged, washed with HCl (10%) and rinsed three times with de-ionized water. They were also washed and rinsed three times with de-ionized water before every daily sampling.
Dilution Experiment
The growth rate of different phytoplankton groups and the grazing mortality exerted by microzooplankton in the Cnt and the SA treatment were measured on Days 2 and 4 by the dilution technique (Landry and Hassett, 1982), following the protocols of Landry et al. (2003). The dilution series was prepared using unfiltered seawater at 25, 50, 75, and 100%. The particle-free seawater was prepared from 10 L of water collected from the three Cnt replicates, which was then mixed and filtered by gravity through 0.2 μm capsules (Pall Corporation). The filtered water was put into 2 L polycarbonate bottles, which were then gently filled with unfiltered water (collected from the Cnt or the SA mesocosms) and incubated in the large concrete tank under the same conditions as the mesocosms for 24 h. All bottles and tubes used in the experiment were washed with 10% HCl and deionized water and rinsed with the incubated seawater. Samples for measuring Synechococcus, pico-eukaryote and autotrophic flagellate abundance were taken at T0, from the unfiltered water, and at the termination of the experiment.
The apparent prey growth rate (AGR) was estimated using the equation: AGR (day−1) = ln (Ct/C0)/t, where Ct and C0 are the final and initial concentrations of the prey organisms, respectively, and t is the time of incubation [day]. AGR was estimated for both pico- and nano-size fractions. The rates of growth and grazing mortality were calculated by the linear regression of AGR vs. the dilution factor. The absolute value of the slope of the regression is the grazing rate m (day−1) and ordinal intercept (y-intercept) of the regression is the growth rate μ in the absence of grazing (day−1; Landry and Hassett, 1982; Landry et al., 2003).
Dust Collection
The dust samples used for the mesocosm experiment were collected weekly or on a dust-event basis over a period of more than a year (October 2012–March 2014) from the East Mediterranean (Crete and Cyprus). Figure 1A presents the temporal distribution of the collected dust dry deposition. Overall, 83% of the total dust mass added was collected in Heraklion, Crete (35% was collected during an intensive dust event period from 1 to 9 June 2013), and the remaining 17% was collected in Larnaca, Cyprus. These dry deposition samples were mixed, homogenized by stirring and chemically characterized for nutrients and metals before being added in the mesocosms.
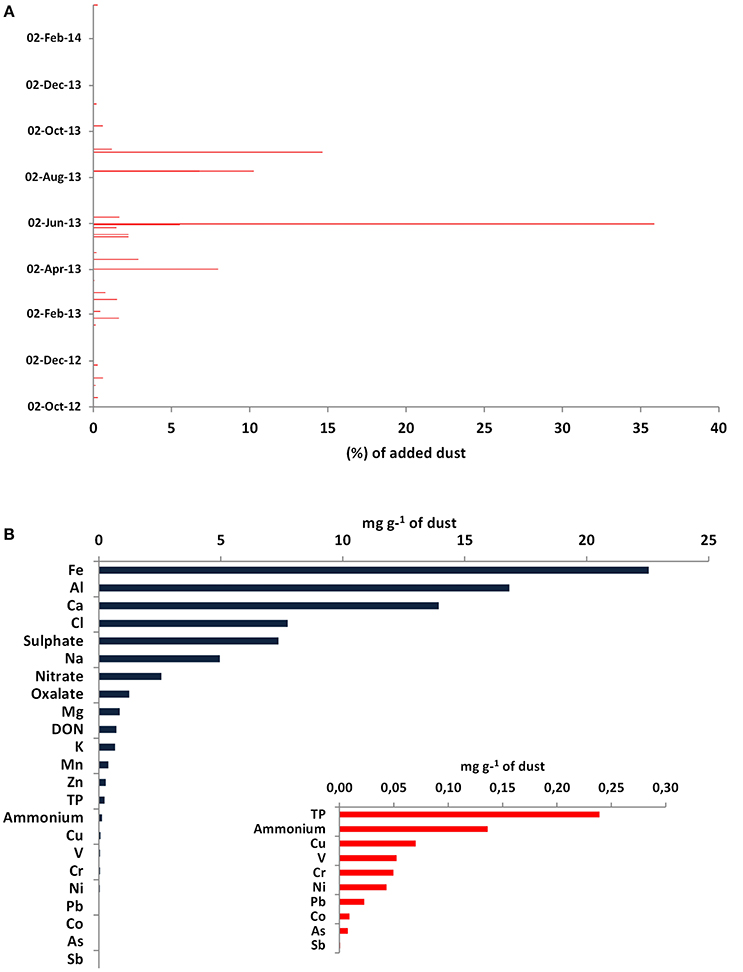
Figure 1. (A) Temporal distribution of the collected dust deposition samples in Crete and Cyprus during a 1-year period (October 2012–November 2013). The dates correspond to the end of the dust collections, while the x axis represents the percentage contribution of each dust sample (in mass) to the total mass of the added dust, (B) Chemical characterization of the dust used in the mesocosm experiment. Only 8% of the dust mass was characterized.
Chemical Analyses of Dust
Anions/Cations
A Dionex AS4A-SC column with ASRS-300 4 mm suppressor in auto-suppression mode of operation was used for the analysis of anions (Cl−, Br−, , , , C2) in aerosol extractions. All the anions were determined with isocratic elution at 1.5 mL min−1 of Na2CO3/NaHCO3 eluent. For the cations (Na+, , K+, Mg2+, and Ca2+), a CS12-SC column was used with a CSRS-300 4 mm suppressor. Separation was achieved under isocratic conditions with MSA (20 mM) eluent at a flow rate of 1.0 mL min−1. The reproducibility of the measurements was >2% and the detection limit was about 1 ppb for both anions and cations. Mean blank values were 5–10 ppb for Na+; Ca2+ and <3 ppb for the rest of the main anions and cations. Details on the chromatographic conditions are reported in Bardouki et al. (2003).
Metals (Al, V, Cr, Mn, Fe, Co, Ni, Cu, Zn, As, Sb, Pb) and Total Phosphorus (TP)
Metals and TP in the dust were measured by acid digestion with concentrated nitric acid (puriss. p.a., Fluka Prod. No. 84380) under controlled conditions [Berghof Microwave System-2, Teflon vessels (DAP—60 K, 60 mL/40 bar)]. After cooling at room temperature, the digested solution was transferred to an acid-cleaned polyethylene container and stored in the freezer. The obtained solutions were analyzed by an Inductively Coupled Argon Plasma Optical Emission Spectrometer (ICP-OES), which uses an Echelle optical design and a Charge Injection Device (CID) solid-state detector (iCAP 6000 spectrometer by Thermo). Recoveries obtained with the use of certified reference materials (MESS-3) ranged from 90.0 to 104.1% (Paraskevopoulou et al., 2015).
Water Soluble Organic Carbon (WSOC) and Total Dissolved Nitrogen (TDN)
A total organic carbon (TOC)/total nitrogen (TN) analyser (Model TOC-VCSH/CSN Analyser, Shimadzu) was used to determine the WSOC and TDN in the dust. A portion of the dust was extracted with ultra-pure Milli-Q water using an ultrasonic bath (15 min × 3 times). The extracts were filtered with a disc filter [polyethersulfone membrane (PES) filters, 0.45 μm pore size diameter] to remove suspended particles and injected into the analyser, according to the protocol described in Miyazaki et al. (2011).
Water-Soluble Organic Nitrogen (WSON)
WSON was determined by subtracting Inorganic Nitrogen (and ) from the Total Dissolved Nitrogen (TDN).
Chemical Analyses in Sea Water Samples
Total Organic Carbon (TOC) Analysis
TOC concentration was measured by the high-temperature catalytic oxidation method with a total organic carbon (TOC) analyser (Model TOC-VCSH/CSN Analyser, Shimadzu), according to protocol described in Sempéré et al. (2002). Prior to analysis, sea water samples (20 mL) were transferred in glass vials (pre-combusted at 450°C for 6 h) and acidified with 20 μL H3PO4 (85%).
Particulate Metals (Fe, V, Cr, Ni) and Particulate Total Phosphorus (TP-Particulate)
Particulate metals (Fe, V, Cr, Ni), including TP-particulate, in sea water samples were measured by acid digestion of GFF filters (pre-combusted at 450°C for 6 h) with concentrated nitric acid (puriss. p.a., Fluka Prod. No. 84380) following the protocol described above for metal analysis.
Total Dissolved Nitrogen (TDN) and Dissolved Organic Nitrogen (DON)
A total nitrogen (TN) analyser (Model TOC-VCSH/CSN Analyser, Shimadzu) was used to determine the total dissolved nitrogen (TDN) in sea water samples, according to Miyazaki et al. (2011). Prior to analysis, sea water samples (1,000 mL) were filtered with a GFF filter (pre-combusted at 450°C for 6 h) and the extracts were injected into the analyser. The concentration of DON was determined by subtracting inorganic nitrogen ( and ) from the total dissolved nitrogen (TDN).
Total Dissolved Phosphorus (TDP)
Total dissolved phosphorus (TDP) concentrations were measured by autoclave-assisted persulfate oxidation followed by the standard phosphomolybdenum blue method by using a10-cm quartz cell, according to the protocol described in Lin et al. (2012). Prior to analysis, 1,000 mL of each sea water sample were filtered with a GFF filter (pre-combusted at 450°C for 6 h).
Inorganic Nutrients, Particulate Organic C and N
Water samples were analyzed daily for phosphate according to the MAGIC method (Rimmelin and Moutin, 2005), for silicate, nitrite, and nitrate according to Strickland and Parsons (1972), and for ammonium according to Ivancic and Degobbis (1984). The detection limits were 0.8 nM for phosphate, 0.017 μM for nitrate, 0.019 μM for ammonium, and 0.025 μM for silicate.
Particulate organic carbon (POC) and nitrogen (PON) were determined using a Perkin Elmer 2,400 CHN Elemental Analyser according to the procedure described by Hedges and Stern (1984).
Chlorophyll a
Concentration of size-fractionated chlorophyll a (Chl a) was measured daily in all mesocosms according to Holm-Hansen et al. (1965). In the present study, only total Chl a concentrations are presented. For methodology and details on size-fractionation values, see Lagaria et al. (2017, this SI).
Primary and Bacterial Production
Primary production (PP) was measured daily in all mesocosms, using the 14C incorporation method of Steemann-Nielsen (1952). In the present study, only total PP values are presented. For methodology and details on size-fractionation values, see Lagaria et al. (2017, this SI).
Bacterial production (BP) was estimated by the 3H-leucine method (Kirchman et al., 1986) as modified by Smith and Azam (1992). For each mesocosm, SA, RA, and Cnt samples (1.5 mL) in duplicate were incubated with a mixture of L-[4,5 3H]-leucine (Perkin Elmer, 115 Ci msol−1) and non-radioactive leucine to a final concentration of 20 nM. Samples were incubated for 2 h in the dark at in-situ temperature, after which they were fixed and treated following the micro-centrifugation protocol (Smith and Azam, 1992), as described in detail by Van Wambeke et al. (2008). In brief, incubations were terminated after 2 h by the addition of trichloroacetic acid (TCA). Samples were then centrifuged at 16,000 × g and the resulting cell pellet was washed twice with 5% TCA and with 80% ethanol. Incorporation of 3H- leucine into the TCA-insoluble fraction was measured by liquid scintillation counting (Packard Tri-Carb 4000TR) after resuspension of the cell pellet in a scintillation cocktail (Ultima-Gold). Bacterial production was calculated according to Kirchman (1993), from 3H-leucine incorporation rates. Duplicate incubations had an analytical error of <10%. Concentration kinetics optimization was also performed to ensure that the bacterial growth was not limited by the concentration of leucine.
Chlorophyll-normalized production was calculated for phytoplankton (by dividing primary production by Chl a) and Specific Growth Rate (SGR) for bacteria (by dividing bacterial production by bacterial biomass).
Plankton Abundances
Viruses, Heterotrophic Bacteria, Cyanobacteria, Autotrophic Pico-Eukaryotes
The abundance of viruses, heterotrophic bacteria, cyanobacteria Synechococcus spp. and autotrophic pico-eukaryotes was obtained by flow cytometric analyses on a daily basis. A FACSCalibur™ was used (Becton Dickinson), equipped with an air-cooled laser at 488 nm and standard filters. Milli-Q water was used as sheath fluid. Samples were run at high speed for 1 min for viral and heterotrophic bacteria counts and for 3 min for cyanobacterial counts and pico-eukaryotes. Multifluorescence beads (1 μm, Polysciences) were used as an internal standard of fluorescence at all runs. The exact flow rate of high speed performance was measured on a daily basis. Abundance was then calculated using the acquired cell counts and the respective flow rate. All flow cytometry data were acquired with the CellQuest Pro package (Becton Dickinson).
Samples (2 mL) for viral and heterotrophic bacteria counts were fixed and processed according to Brussaard (2004) and Marie et al. (1999), respectively. Briefly, fixation was achieved with 0.2 μm pre-filtered 25% glutaraldehyde at 0.5% final concentration. Samples were then kept at 4°C for ~20 min, deep frozen in liquid nitrogen and finally stored at −80°C until enumeration. For viral counts, samples were thawed at room temperature and then diluted in Tris-EDTA buffer (TE, 10 mM Tris and 1 mM EDTA, pH = 8) in order to achieve a flow rate of between 100 and 700 events s−1. Freshly-made TE was autoclaved and 0.2 μm filtered immediately prior to dilution. Staining was conducted with SYBR Green I nucleic acid dye (Molecular Probes) at a final dilution 5 × 10⁻⁵ of the stock solution and then incubated for 10 min at 80°C. Viruses were grouped into three groups according to their SYBR Green I fluorescence intensity (low, medium, and high DNA content). For heterotrophic bacteria counts, samples were thawed at room temperature and stained with SYBR Green I nucleic acid dye at a final dilution 4 × 10⁻⁴ of the stock solution. The stained samples were incubated for 10 min in the dark. Heterotrophic bacteria were grouped into two groups according to their SYBR Green I fluorescence intensity (low and high DNA content).
Cyanobacteria Synechococcus spp. and autotrophic pico-eukaryotes were counted fresh, without fixation and staining steps, using their characteristic autofluorescence chlorophyll/phycoerythrin signals.
Abundance data were converted into C biomass using 20 fg C cell−1 for heterotrophic bacteria (Lee and Fuhrman, 1987) and 250 fg C cell−1 for Synechococcus (Kana and Glibert, 1987). The biovolume of autotrophic pico-eukaryotes was calculated assuming they are spherical with diameter 1.7 μm. Biovolumes were then converted into C biomass using 183 fg C μm−3 (Caron et al., 1995).
Auto- and Hetero-Trophic Flagellates
Samples (20 mL) for flagellate counting were collected daily until Day 3 and every other day afterwards, fixed with glutaraldehyde (final concentration, 1%), and kept in the dark at 4°C. Flagellate cells were concentrated to ca. 10 mL on a 25 mm diameter, 0.8 μm pore-sized black polycarbonate filter, stained with 4′6-diamidino-2-phenylindole (DAPI: 1 μg mL−1) for 10 min, and finally collected on the filter (Porter and Feig, 1980). The filters were mounted on slides and stored frozen (−20°C). Autotrophic and heterotrophic flagellates (AF, HF) were examined on at least 50 fields at 1,000×, using UV and blue excitations under an Olympus BX60 epifluorescence microscope. All cells were sized and divided into five categories (2–3, 3–5, 5–7, 7–10, >10 μm) using an ocular micrometer in at least 50 fields.
Formulas of approximate geometric shapes were used to calculate the biovolume of heterotrophic flagellates (W2 L π/6 where L and W are the measured length and width of the cell, respectively). Biovolumes were converted into C biomass using 183 fg C μm−3 (Caron et al., 1995).
Microplankton (Diatoms, Coccolithophores, Dinoflagellates, and Ciliates)
Samples for diatom, coccolithophore, and dinoflagellate enumeration were collected on Days 0, 2, 4, 6, and 9, fixed with alkaline Lugol's solution (2% final concentration), and stored at 4°C until counting. For the analysis, 100 mL samples were left to sediment for 24 h (Utermöhl, 1958) and then observed under an Olympus IX70 inverted microscope. Organisms larger than 10 μm were distinguished into diatoms, dinoflagellates, coccolithophores, and other flagellates, and identified down to genus or species level where possible.
Samples for ciliate enumeration were collected daily until Day 3, and every other day afterwards, fixed with acid Lugol's solution (2% final concentration), and stored at 4°C until counting. For the analysis, 100 mL samples were left for 24 h sedimentation and examined using an Olympus IX70 inverted microscope, equipped for phase contrast, at 150× magnification. Ciliates were distinguished into loricate species (hereafter referred to as tintinnids, order Tintinnida) and aloricate ones (hereafter referred to as aloricates, further distinguished into size-classes, orders Oligotrichida, and Choreotrichida) and identified down to genus or species level where possible. Ciliate cell sizes were measured by means of image analysis and converted into biovolumes by approximation to the nearest geometric shape from measurements of cell length and width. Biovolumes were converted into C biomass using 190 fg C μm−3 (Putt and Stoecker, 1989).
Mesozooplankton
The total abundance (ind m−3) and biomass (mg C m−3) of metazoans were determined at the start and termination of the mesocosm experiment. The initial stock of metazoans was measured by filtering, through a 45 μm net, water pumped from 10 m depth (collected as described above, to fill the barrels for the mesocosms). At the end of the experiment, the content of each of the mesocosms was also filtered through the 45 μm net. All samples were preserved with a 4% buffered-formaldehyde seawater solution (Postel et al., 2000). A known fraction of each sample was scanned on a flatbed scanner at 4,800 dpi then image analysis was completed using the software Image-pro plus, processing similarly to Frangoulis et al. (2016). In each fraction, 1,000–2,000 organisms were identified and measured. Organisms <100 μm were not identifiable when looking at the images, therefore in the following text, “mesozooplankton” corresponds to the captured metazoans >100 μm. The sizes of metazoans were converted to carbon based on literature size-carbon relationships (Alcaraz and Calbet, 2003).
Statistical Analysis
The quality of the mesocosm replication during the experiment was evaluated based on the coefficient of variation (CV = Standard deviation/average) of several variables (Chl a, primary, and bacterial production, etc.).
A repeated measures ANOVA (RM-ANOVA) was used to compare the values of the variables between the Cnt, SA, and RA mesocosms. The grouping factor was the Cnt vs. SA, RA mesocosms, and “experimental day” (Day 0–9) was treated as a repeated measure, i.e., treatment was considered the between-subjects factor and “experimental day” the within-subjects factor. Subsequently, the post-hoc Tukey test was employed for comparison of each variable between different dust additions.
On individual experimental days, one-way analysis of variance (1Way-ANOVA) was used to compare variables between the Cnt, SA and RA. Following the 1Way-ANOVA, significance of differences was checked by means of Tukey's HSD test.
Results
Characterization of Dust Particles Used in the Mesocosm Experiment
Only a small fraction (about 8%) of the dust sample was characterized chemically, with a prevalence of Fe, Al, and Ca with percentage contributions of 2, 2, and 1%, respectively, and minor contributions by Co, As, and Sb (Figure 1B). As shown in Table 2, dust presented a high N:P ratio of ca. 29.
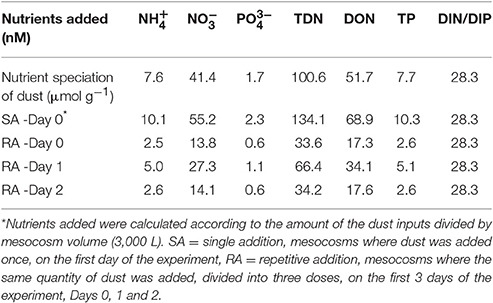
Table 2. Concentrations and speciation of Phosphorus and Nitrogen added with dust.
SA (Single Addition) represented a strong dust deposition event of 3 g m−2 day−1 while in terms of nutrient content, TDN and TP, it corresponds to daily deposition fluxes of 294.9 μmol N m−2 d−1 and 22.7 μmol P m−2 day−1, respectively, which are typical for an intense single-day dust event. The deposition fluxes of inorganic nutrients (DIN and ) were estimated at 143.5 μmol N m−2 day−1and 5.0 μmol P m−2 day−1, respectively, with a DIN/DIP atomic ratio 28.7, which is higher than the Redfield N:P analogy of 16.
RA (Repetitive Addition) was equivalent to three sequential dust events with deposition fluxes of 0.7, 1.5, and 0.8 g m−2 day−1. The additions corresponded to deposition fluxes for TDN of 74.7, 147.6, and 76.0 μmol N m−2, respectively, and for TP of 5.7, 11.3, and 5.8 μmol P m−2, respectively. The additions corresponded to per-event deposition fluxes of DIN equal to 36.3, 71.8, and 37.0 μmol N m−2 and of , equal to 1.3, 2.5, 1.3 μmol P m−2, respectively.
Results from the Mesocosm Experiment
Throughout the experiment, replication between the mesocosms of each treatment (within treatment replication) was good. The coefficient of variation (CV = standard deviation/average) between the replicate mesocosms ranged, on average, between 3 and 22% for Chl a, 3 and 22% for primary production, 1 and 31% for bacterial production, 1 and 9% for heterotrophic bacteria counts, and 2 and 15% for Synechococcus counts.
All results are presented as average values followed by the standard deviation (SD) of three replicates.
Inorganic Nutrients
The initial concentration of inorganic nutrients in the water used to fill the mesocosms was 62 ± 22 nM DIN (dissolved inorganic nitrogen) and 6 ± 0.9 nM DIP (dissolved inorganic phosphorus). The content of the natural dust added was 65.4 nM DIN and 2.3 nM DIP; in other words, by adding dust into the treated mesocosms (SA and RA), the initial DIN and DIP concentration increased 2- and 1.3-fold, respectively, while the N:P ratio changed from ca. 10:1 to ca. 16:1.
During the first 2 days of the experiment, DIN concentration ranged from 44 to 82 nM in the Cnt and 47–87 nM in the RA treatment, while it slightly increased from 21 to 116 nM in the SA treatment (Figure 2A). After Day 2, DIN concentration increased 2.2-fold in both SA and RA until they reached the highest values (135 ± 19 nM) on Day 7 and 4, respectively, after which concentration decreased in all mesocosms.
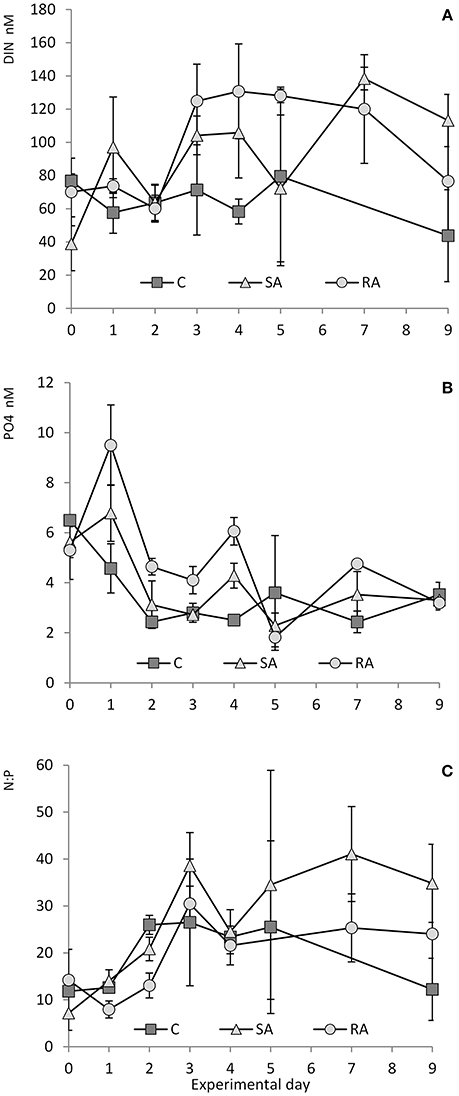
Figure 2. (A) Concentration of DIN (dissolved inorganic nitrogen), (B) concentration of PO4, and (C) N:P ratio throughout the mesocosm experiment. Cnt = Control mesocosms (no addition), SA = single addition, mesocosms where dust was added once, on the first day of the experiment, RA = repetitive addition, mesocosms where the same quantity of dust was added, divided into three doses, on the first 3 days of the experiment, Days 0, 1, and 2. Data are mean ± SD of 3 replicates. (A,B) are from Lagaria et al. (2017), this SI, mod.
Phosphates presented a different pattern (Figure 2B). From Day 0 to Day 1, PO4 concentration increased by 1.2-fold in SA and by 1.8-fold in RA (highest values reached in RA, 9.5 ± 1.61 nM PO4), then it sharply decreased until Day 2, after which it remained stable at low levels. In the Cnt, PO4 concentration decreased 2.7-fold on the first 2 days, after which it remained steadily low (<4 nM) throughout the experiment.
Starting from a N:P ratio of ca. 10:1 in the water used to fill the mesocosms, (Figure 2C) N:P increased to reach values close to the Redfield ratio on Day 1, then it attained maximum values, much higher than Redfield, on Day 3 (39:1 in SA, 30:1 in RA, and 27:1 in Cnt). Then it decreased but remained at levels higher than Redfield until the end of the experiment (34:1 in SA, 24:1 in RA, and 20:1 in Cnt).
Silicate concentration did not vary throughout the experiment [0.81 ± 0.03 μM Si(OH)4, data not shown].
Particulate Organic Nitrogen, Phosphorus, and Carbon
The concentration of particulate organic nitrogen (PON) increased by 1.5 times from Day 0 (0.29 ± 0.04 μM) to Day 9 (0.45 ± 0.3 μM) in both treatments and the Cnt. No significant differences were found between SA, RA, and Cnt (RM-ANOVA, P > 0.05; Figure 3A).
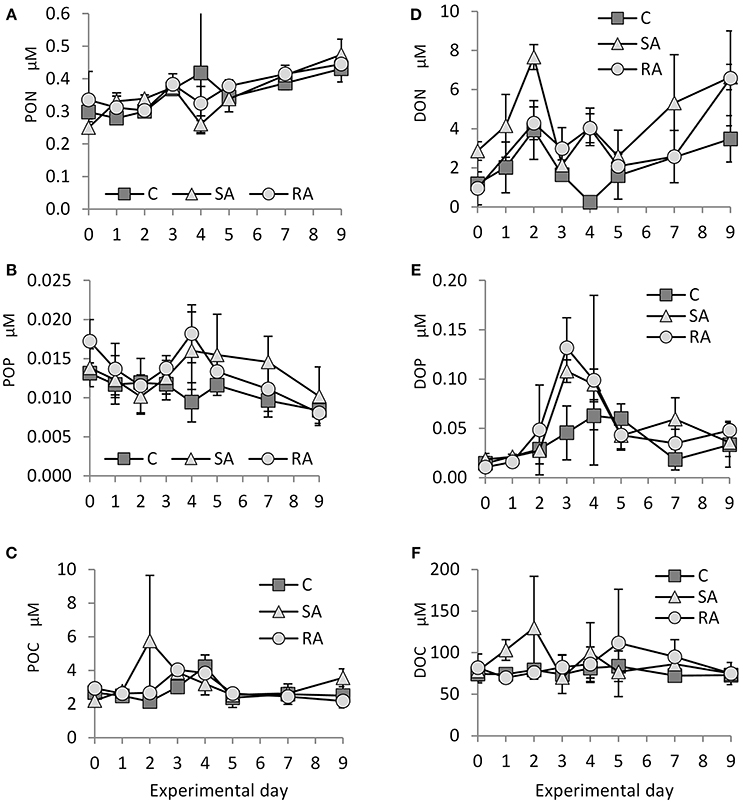
Figure 3. Concentration of (A) PON (particulate organic nitrogen), (B) POP (particulate organic phosphorus), (C) POC (particulate organic carbon), (D) DON (dissolved organic nitrogen), (E) DOP (dissolved organic phosphorus), and (F) DOC (dissolved organic carbon) throughout the mesocosm experiment. Cnt = Control mesocosms (no addition), SA = single addition, mesocosms where dust was added once, on the first day of the experiment, RA = repetitive addition, mesocosms where the same quantity of dust was added, divided into three doses, on the first 3 days of the experiment, Days 0, 1, and 2. Data are mean ± SD of three replicates.
Starting from 0.014 ± 0.002 μM on Day 0, particulate organic phosphorus (POP) concentration decreased to 0.009 ± 0.002 μM on Day 9 in the Cnt, SA, and RA (Figure 3B). On Day 4, it reached maximum values in RA (0.018 ± 0.004 μM) and SA (0.016 ± 0.005 μM). No significant differences were found between the two treatments and the Cnt nor between the treatments (RM-ANOVA, P > 0.05) due to high variability of values.
From 2.2 ± 0.27 μM on Day 0, particulate organic carbon (POC) reached maximum values on Day 2 in SA (5.8 ± 3.89 μM), Day 3 in RA (4.0 ± 0.24 μM), and Day 4 in Cnt (4.2 ± 0.69 μM; Figure 3C). No significant differences were found between the two treatments and the Cnt, nor between the treatments (RM-ANOVA, P > 0.05).
Dissolved Organic Nitrogen, Phosphorus, and Carbon
Dissolved organic nitrogen (DON) concentration varied a lot during the experiment (Figure 3D). Starting from a value of 1.7 ± 1.25 μM, DON concentration initially peaked on Day 2 in SA (7.7 ± 0.64 μM) and RA (4.9 ± 0.86 μM), then it fluctuated until the end of the experiment. In the Cnt, there was also a peak on Day 2 (3.9 ± 1.51 μM), followed by a decrease until Day 4 and a second, smaller increase until Day 9. Due to the high variability of values, significantly higher DON concentration was found only on Day 2 between SA and the rest of the mesocosms (1Way-ANOVA, P < 0.01).
Dissolved organic phosphorus (DOP) concentration showed an important increase until Day 3 in both SA and RA treatments (Figure 3E, 0.11 ± 0.01 μM in SA and 0.13 ± 0.03 μM in RA compared to 0.015 ± 0.006 μM on Day 0), then it decreased until Day 5 and remained at this level (0.04 ± 0.01 μM) until the end of the experiment. DOP concentration was significantly higher in SA and RA compared to Cnt on Day 3 (1Way-ANOVA, P < 0.01); however, SA and RA did not differ between them (1Way-ANOVA, P > 0.05). The Cnt mesocosms also presented an increase in DOP concentration, although much smaller; DOP peaked on Day 4 (0.06 ± 0.01 μM) and then it dropped to the same levels as the amended mesocosms.
Only in the SA treatment did dissolved organic carbon (DOC) concentration present an important increase on Day 2 (129.9 ± 61.9 μM) compared to Day 0 (78.04 ± 6.04 μM), then it returned to initial levels; in contrast, it remained stable in the Cnt and RA throughout the experiment (Figure 3F); RA showed an increase in DOC concentration only on Day 5 compared to the rest of mesocosms. However, variability was high in many cases and treatments did not differ significantly between them (1Way-ANOVA, P > 0.05).
Primary Production and Bacterial Production
Soon after the addition of dust, there was a 2-fold increase in primary production (PP) in both treatments compared to the Cnt, in which PP did not change throughout the experiment (Figure 4A). PP reached the same maximum levels at both treatments. For details on PP, see Lagaria et al. (2017, this SI).
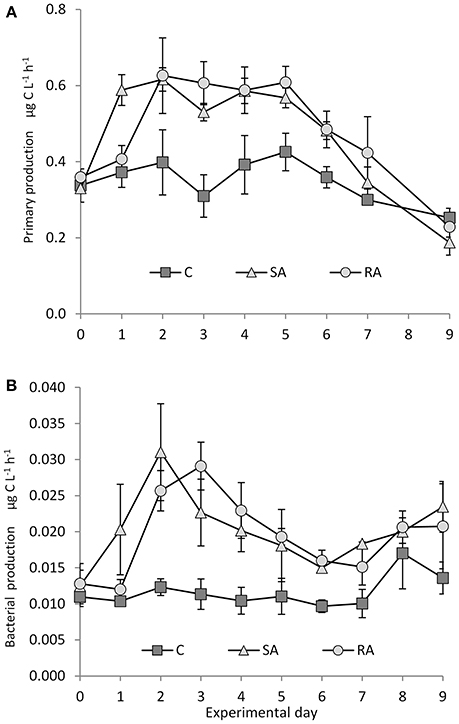
Figure 4. (A) Primary and (B) bacterial production during the mesocosm experiment. Cnt = Control mesocosms (no addition), SA = single addition, mesocosms where dust was added once, on the first day of the experiment, RA = repetitive addition, mesocosms where the same quantity of dust was added, divided into three doses, on the first 3 days of the experiment, Days 0, 1, and 2. Data are mean ± SD of 3 replicates. (A) is from Lagaria et al. (2017), this SI, mod.
Throughout the experiment, bacterial production was significantly higher in both treatments compared to the Cnt (RM-ANOVA, P < 0.01), which remained unchanged (Figure 4B). In the SA mesocosms, BP peaked on Day 2 (31.03 ± 6.72 ng C L−1 h−1), reaching a 2-fold increase, then it declined continuously to reach minimum values by Day 6 (but higher than Cnt). In RA, similar maximum BP values were attained but with a time lag of 1 day. They were then followed by a decrease until Day 7.
Chlorophyll a
From a low value on Day 0 (0.04 ± 0.004 μg L−1), total Chl a concentration significantly increased after the addition of dust in SA and RA compared to Cnt (RM-ANOVA, P < 0.01), by 1.7 times in the SA on Day 2 and by 1.6 times in the RA mesocosms on Day 4 (Figure 5). Chl a increased first in SA while RA followed with a time lag of 1 day; however, the maximum values attained were similar. For details on Chl a, see Lagaria et al. (2017, this SI).
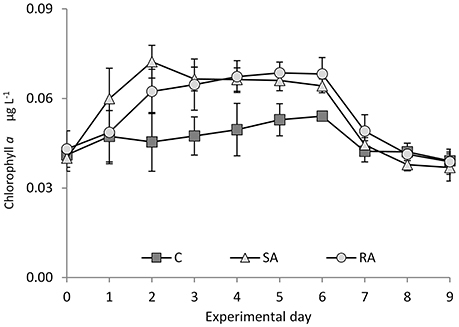
Figure 5. Chlorophyll a concentration during the mesocosm experiment. Cnt = Control mesocosms (no addition), SA = single addition, mesocosms where dust was added once, on the first day of the experiment, RA = repetitive addition, mesocosms where the same quantity of dust was added, divided into three doses, on the first 3 days of the experiment, Days 0, 1, and 2. Data are mean ± SD of three replicates. This Figure is from Lagaria et al. (2017), this SI, mod.
Autotrophs
Synechococcus spp. (Syn) density doubled on Day 3 in SA (2.18 × 10⁴ ± 1.02 × 10³ cells mL−1) and on day 4 in RA (2.24 × 10⁴ ± 2.5 × 10³ cells mL−1) and was significantly higher in both dust treatments than in the Cnt until the end of the experiment (RM-ANOVA, P < 0.01, Figure 6A). No significant difference was found between the two treatments (RM-ANOVA, P > 0.05). Synechococcus abundance did not change in the Cnt mesocosms throughout the experiment.
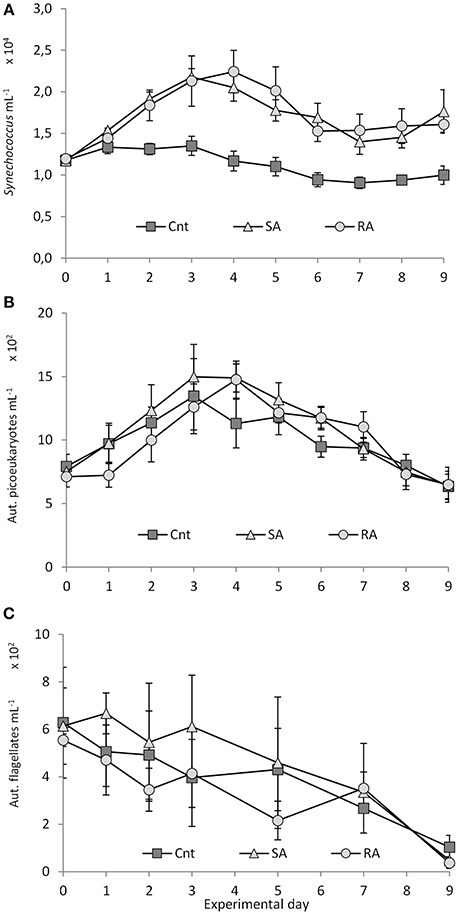
Figure 6. (A) Synechococcus, (B) pico-eukaryote, and (C) autotrophic flagellate abundances during the mesocosm experiment. Cnt = Control mesocosms (no addition), SA = single addition, mesocosms where dust was added once, on the first day of the experiment, RA = repetitive addition, mesocosms where the same quantity of dust was added, divided into three doses, on the first 3 days of the experiment, Days 0, 1, and 2. Data are mean ± SD of three replicates. This Figure is from Lagaria et al. (2017), this SI, mod.
Pico-eukaryote (Peuk) density presented a 2-fold increase in SA and RA until Days 3 and 4, respectively (time lag of 1 day between SA and RA), and then it declined until the end of the experiment (Figure 6B). No differences were found between the treatments and the Cnt (RM-ANOVA, P > 0.05).
Autotrophic flagellate (AF) abundance, starting from initial values of 599 ± 105 cells mL−1, decreased in RA and the Cnt until the end of the experiment, whereas in SA it remained stable during the first 4 days, after which it declined (Figure 6C). No differences were found between the treatments and the Cnt (RM-ANOVA, P > 0.05). Autotrophic flagellates were dominated by the 3–5 μm fraction (53 ± 14%) while the 2–3 μm fraction contributed 17 ± 12% to total abundance. For more details on autotrophs, see Lagaria et al. (2017, this SI).
Diatoms and coccolithophores were found only sporadically throughout the experiment; their abundances averaged 40 ± 38 cells L−1 for diatoms and 31 ± 17 cells L−1 for coccolithophores (data not shown).
Heterotrophs
Virus density declined 1.2-fold from Day 0 to Day 3 in Cnt, SA, and RA (Figure 7A). After Day 3, it reached maximal values on Day 4 in RA (5.0 × 10⁶ ± 1.8 × 10⁵ viruses mL−1) and on Day 7 in SA (5.0 × 10⁶ ± 4.7 × 10⁵ viruses mL−1) while it remained unchanged in the Cnt. There were significant differences only between SA and the Cnt (RM-ANOVA, P < 0.05).
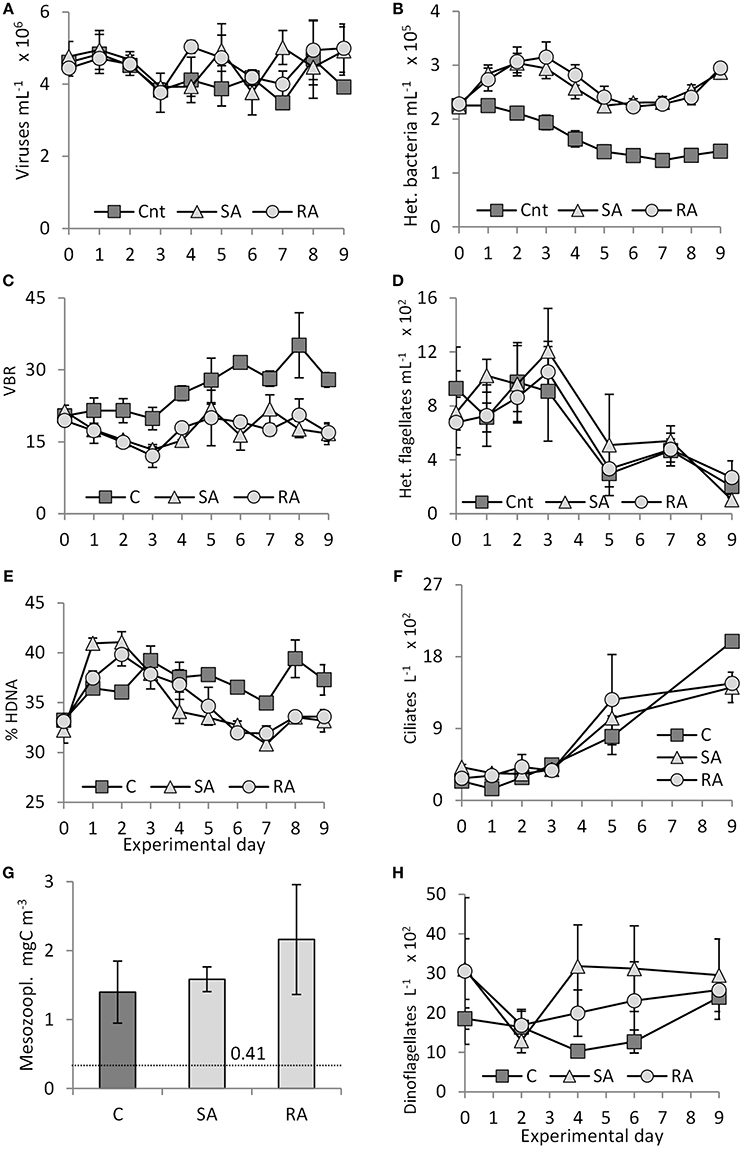
Figure 7. (A) Virus abundance, (B) heterotrophic bacterial abundance, (C) Virus to bacteria ratio (VBR), (D) heterotrophic flagellate abundance, (E) percentage of High DNA bacteria (HDNA), (F) ciliate abundance, (G) mesozooplankton biomass on the last day of the experiment (dashed line indicates mesozooplankton biomass (0.41 mgC m−3) in the field, at the start of the experiment), and (H) dinoflagellate abundance during the mesocosm experiment. Cnt = Control mesocosms (no addition), SA = single addition, mesocosms where dust was added once, on the first day of the experiment, RA = repetitive addition, mesocosms where the same quantity of dust was added, divided into three doses, on the first 3 days of the experiment, Days 0, 1, and 2. Data are mean ± SD of three replicates.
Heterotrophic bacteria density was significantly higher in both treatments compared to the Cnt throughout the experiment (RM-ANOVA, P < 0.01). Starting from an initial density of 2.3 × 10⁵ ± 0.03 × 10⁵ cells mL−1, heterotrophic bacteria reached a peak (1.4 times higher than in the Cnt) on Days 2 and 3 in the SA and RA treatments, respectively, then they declined until Day 5, after which they remained constant at initial levels until Day 7 and then increased again (Figure 7B). No significant difference was found between the two treatments (RM-ANOVA, P > 0.05). Density in the Cnt decreased all along the experiment and on Day 9 it was 1.6-fold lower than on Day 0.
In Cnt, starting from 20 ± 1, VBR (Viruses to Bacteria Ratio, a measure of the viruses' relative significance compared to bacteria) showed similar values until Day 3 (Figure 7C) and then a continuous increase until the end of the experiment (28 ± 2 on Day 9). In contrast, in SA and RA, VBR declined to 13 ± 2 until Day 3 and then returned to initial values, oscillating around 19 ± 3 until Day 9. VBR did not differ between SA and RA treatments (RM-ANOVA, P > 0.05); however, values in the Cnt were significantly higher than both treatments (RM-ANOVA, P < 0.01).
Until Day 2 for SA and RA and Day 3 for Cnt, there was an increase in the % contribution of High DNA content (HDNA) bacteria, but the increase was steeper in both treatments compared to Cnt (41% in SA, 40% in RA, 36% in Cnt, starting from 33%, Figure 7E). After Day 3, the % of HDNA bacteria stabilized in Cnt whereas, in SA and RA, it sharply declined to values lower than Cnt, at least until Day 7, after which it increased again.
From 785 ± 130 cells mL−1 on Day 0, heterotrophic flagellate (HF) density increased 1.6-fold in both treatments until Day 3, after which it declined to values lower than the initial ones until the end of the experiment (Figure 7D). No significant differences were found between the treatments (RM-ANOVA, P > 0.05); however, the increase in RA followed the one in SA. In the Cnt, HF density remained unchanged until Day 3, after which it declined. In both treatments and the Cnt, heterotrophic flagellates were dominated by the pico-fraction (44 ± 13%), and the 2–3 μm fraction contributed 19 ± 9% to total abundance.
Starting from a low density at the beginning of the experiment (310 ± 86 cells L−1), ciliate abundance showed an increasing pattern in both treatments and the Cnt (Figure 7F); especially after Day 3, the increase was sharper. Finally, after 9 days of the experiment, higher densities were reached in the Cnt mesocosms (1,990 ± 71 cells L−1) than in the SA (1,415 ± 191 cells L−1) and the RA (1,465 ± 78 cells L−1) mesocosms (1Way-ANOVA, P < 0.01). Only on Days 1 and 5 was ciliate abundance higher in both treatments compared to the Cnt.
Dinoflagellate abundance varied a lot (around 2,200 ± 550 cells L−1) in the treatments and the Cnt (Figure 7H). Both treatments started from a higher density compared to the Cnt. Interestingly, in both treatments, density showed a remarkable decrease on Day 2, after which it increased to reach maximum values on Day 4 and Day 9 for the SA and RA treatments, respectively.
Mesozooplankton biomass had increased in all mesocosms by the end of the experiment compared to the field-initial values (Figure 7G), by 3.4, 3.9, and 5.3 times in the Cnt, SA, and RA, respectively. When comparing between treatments, RA showed significantly higher biomass compared to the Cnt (1Way-ANOVA, P < 0.05) by 1.5 times. The mean size of the animals, 20% of which were nauplii and the remainder small-sized juvenile copepods, was around 400 μm. There were no carnivorous species so the mortality can be considered as non-predatory.
Heterotrophy vs. Autotrophy (H/A)
The picoplankton fraction of the food web (heterotrophic bacteria, cyanobacteria Synechococcus, and pico-eukaryotes) was heterotrophic at the beginning of the experiment (Figure 8A). The heterotrophic-to-autotrophic biomass ratio was 1.53 ± 0.028 on Day 0 and progressively decreased to reach equilibrium between auto- and heterotrophs (1.02 ± 0.07) on Days 4 and 5 in SA and RA, respectively. Then it increased again toward heterotrophy until the end of the experiment. Although, no differences were found between the Cnt and the treatments, or between the treatments (RM-ANOVA, P > 0.05), SA and RA mesocosms were characterized by a relatively faster relaxation of heterotrophy to approach balanced conditions compared to the Cnt, and then a sharper increase of the ratio and return toward heterotrophy.
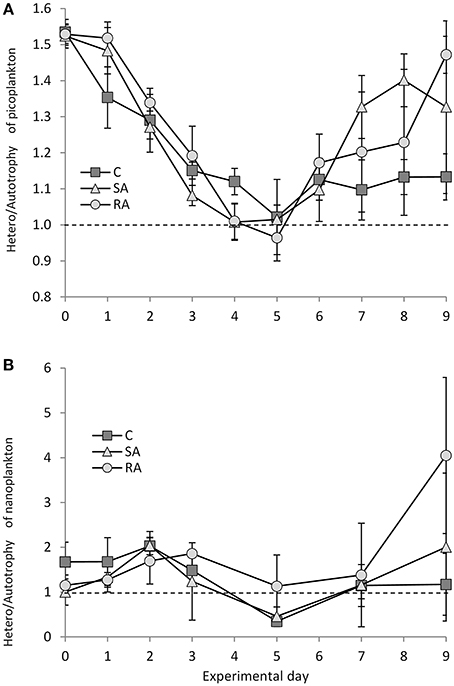
Figure 8. Ratio of heterotrophic to autotrophic biomass for (A) pico-plankton and (B) nano-plankton during the mesocosm experiment. Cnt = Control mesocosms (no addition), SA = single addition, mesocosms where dust was added once, on the first day of the experiment, RA = repetitive addition, mesocosms where the same quantity of dust was added, divided in three doses, on the first 3 days of the experiment, Days 0, 1, and 2. Data are mean ± SD of three replicates. Dashed line indicates balance between autotrophic and heterotrophic biomass.
The nanoplankton fraction behaved differently compared to picoplankton (Figure 8B); starting from equilibrium between auto- and heterotrophs on Day 0, increasing heterotrophy was observed until Days 2 (2.04 ± 0.31) and 3 (1.86 ± 0.002) in SA and RA, respectively, after which the ratio H/A decreased until autotrophy was reached in SA and the Cnt on Day 5. Then, equilibrium was reached in Cnt while SA returned to heterotrophy by Day 9. In RA, the ratio turned around equilibrium after Day 3 and reached a high degree of heterotrophy on Day 9; however, the variability was high.
Chlorophyll-Normalized Production and Bacteria Specific Growth Rate
Chlorophyll-normalized production showed a decreasing trend throughout the experiment (Figure 9A) whereas an increasing trend was observed for the specific bacterial growth rate (Figure 9B). No significant difference was found between all treatments for phytoplankton (RM-ANOVA, P > 0.05), whereas some variation (not significant though) was found for bacteria during the first 2 days of the experiment; bacteria seemed to grow faster in SA compared to RA and Cnt.
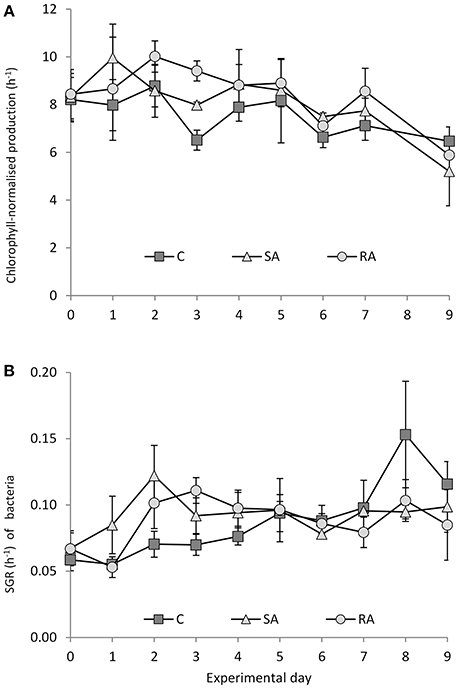
Figure 9. (A) Chlorophyll-normalized production and (B) specific growth rate of bacteria during the mesocosm experiment. Cnt = Control mesocosms (no addition), SA = single addition, mesocosms where dust was added once, on the first day of the experiment, RA = repetitive addition, mesocosms where the same quantity of dust was added, divided into three doses, on the first 3 days of the experiment, Days 0, 1 and 2. Data are mean ± SD of 3 replicates. (A) is from Lagaria et al. (2017), this SI, mod.
Growth Rate (μ) and Grazing Mortality (m)
The response of net growth rate of pico- and nano-autotrophs to dust addition (SA), calculated as μ, was variable on Day 2 (Figure 10A): only picoplankton cells (Syn and Peuk) showed a positive growth (0.61 and 0.18 day−1, respectively) compared to the Cnt. Grazing rates, calculated as m, increased by 2-fold for AF and Syn after dust addition (0.59 and 0.3 day−1, respectively, Figure 10B) and decreased 2-fold for Peuk (0.13 day−1). On Day 4, only Peuk continued to show positive growth, similarly in all treatments and higher than on Day 2 (1.2 day−1), whereas their grazing rates were 2-fold lower in the dust treatment compared to the Cnt (0.23 day−1). On the contrary, the AF grazing rate was more or less similar to Day 2 in all treatments although slightly increased by 1.3-fold in the dust-treated mesocosms (0.48 day−1).
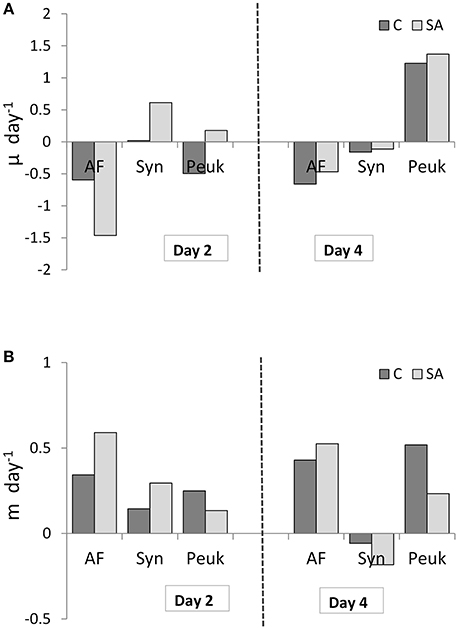
Figure 10. (A) Net growth rate (μ) and (B) grazing mortality (m) of autotrophic flagellates (AF), Synechococcus (Syn) and pico-eukaryotes (Peuk) on Days 2 and 4 as measured by means of dilution experiments in Cnt = Control mesocosms (no addition) and SA = single addition mesocosms (where dust was added once, on the first day of the experiment).
Discussion
Impact of Dust Addition on Biological Productivity and Biomass
The impact of Saharan dust deposition on the pelagic food web was studied in the Eastern Mediterranean. The effect of the episodicity of the phenomenon was studied in a mesocosm experiment by simulating two patterns of dust deposition events, both encountered in nature: (1) a single, strong event, or “dust storm,” during which a large quantity of dust is added once into the surface layers of the sea vs. (2) repetitive events during which smaller quantities of dust are added to the sea over a longer time period. The dust addition was representative of a realistic dust deposition event in the area according to Gerasopoulos et al. (2006) and Ternon et al. (2010).
Just 1–2 days after the addition of dust to the amended mesocosms, both the autotrophic and heterotrophic components of the microbial food web presented a positive response compared to the Cnt mesocosms. Independently of the way dust was added, i.e., either in a single strong pulse (SA) or in three repetitive smaller pulses (RA), primary and bacterial productions significantly increased and so did the Chl a concentration, the densities of heterotrophic bacteria, and autotrophic cyanobacteria, the mesozooplankton biomass at the end of the experiment and the concentration of dissolved organic N and P on specific days. Phytoplankton production responded first, followed by bacterial production. The quantitative response to the dust addition did not differ between the two treatments; in other words, it was independent of the way dust was added.
Although, the quantity of nutrients added through the dust was very low (66 nM N and 2 nM P), it resulted in a considerable % increase of the initial nutrient concentration (2-fold increase for N and 1.3-fold for P) due to the oligotrophic conditions prevailing in the area. As a result, the food web replied with an increase of 2-fold for PP and BP, 1.6-fold for Chl a concentration, 1.4-fold for heterotrophic bacteria and 1.9-fold for cyanobacterial abundance.
This response is an indication that phytoplankton and heterotrophic bacteria were N or N and P co-limited prior to dust addition. With an initial N:P ratio of ca. 10, the system seemed to be N-limited. At the same time, the N:P ratio of dust added was ca. 29; in other words, dust transported a disproportionately high load of N relative to P in the amended mesocosms. Thus, during the first 2 days of the experiment and due to the N-deficit, the DIN added with the dust was directly taken up, so there was not a considerable increase in the DIN pool; in contrast, the added phosphate was not instantly taken up. It presented elevated values 2 day after the additions then was totally taken up within 3 days in all mesocosms. Excess N added to the system was released again after Day 3 in the form of recycled DIN, presenting significant increases in both SA and RA mesocosms, presumably resulting in P-limited conditions, as also seen by the N:P ratio during the experiment.
The increase in heterotrophic bacterial production and abundance may be explained by the addition of P through the added dust. The response of bacteria to P-addition in the Eastern Mediterranean has been seen during a Lagrangian experiment (Krom et al., 2005b; Pitta et al., 2005; Thingstad et al., 2005) and verified during a mesocosm experiment (Pitta et al., 2016). On the other hand, the increase in the autotrophic production and biomass may be attributed to the simultaneous addition of N and P through the added dust since phytoplankton has been found to be N and P-co-limited in the area (Zohary et al., 2005; Pitta et al., 2016).
The clear and significant response of both auto- and heterotrophs to dust addition, observed during the present mesocosm experiment, was also evident during the first dust-addition mesocosm experiment conducted in Crete in May, 2012 (Tsagaraki et al., in review). In that experiment, the same quantity of dust was added, and resulted in similar increases in phytoplankton and heterotrophic bacteria to our experiment. The results of these two experiments may be considered a solid indication of the influence of Saharan dust on the microbial food web of the oligotrophic Eastern Mediterranean.
However, these results partly differ from the findings of the DUNE mesocosm experiments conducted in the Western Mediterranean (Laghdass et al., 2011; Giovagnetti et al., 2013; Guieu et al., 2014; Pulido-Villena et al., 2014; Ridame et al., 2014) and from some of the results of the microcosm experiments performed in the Mediterranean (Bonnet et al., 2005; Herut et al., 2005; Pulido-Villena et al., 2008; Lekunberri et al., 2010; Romero et al., 2011), the Atlantic (Marañón et al., 2010) and the South China Sea (Guo et al., 2012, 2013).
During the DUNE experiments, bacterial abundance was not affected by dust addition (Laghdass et al., 2011; Pulido-Villena et al., 2014). As far as phytoplankton is concerned, pico- vs. nano- and micro-size fractions behaved differently after two consecutive wet dust additions (Giovagnetti et al., 2013). Interestingly, Ridame et al. (2014) reported a significant stimulation of PP and Chl a after wet dust deposition but no changes after dry deposition; they explained these results by the lack of nitrate in the dry deposition events. In contrast, in the two mesocosm experiments conducted in Crete (the present one, and the one reported in Tsagaraki et al., in review), dry dust addition resulted in a net and important increase in both PP and Chl a although, indeed, nitrate concentration was low in the dust added (Figure 1B). Our results agree more with several microcosm experiments conducted in Blanes Bay, Spain (Lekunberri et al., 2010; Romero et al., 2011), at the DYFAMED station (Bonnet et al., 2005; Pulido-Villena et al., 2008), at the Cyprus Gyre (Herut et al., 2005), and in the Atlantic (Marañón et al., 2010), where, in most of the cases, both auto- and hetero-trophs were favored after dust addition.
Effect of the Episodicity of Dust Deposition or “How Dust is Added”
Despite the similarities of the system's response to the two dust treatments, some differences were also observed.
In SA, which received the strong dust pulse, PP, BP, and to a lesser extent Chl a, started to increase from the first day and presented maxima on Day 2. In RA, however, which received the three smaller dust pulses, a delay of 1 day was observed in the increase of PP and BP and of 2 days in the case of Chl a. Nevertheless, the maximal values of these parameters were similar to SA.
In contrast to the production rates, there was not any time lag between SA and RA regarding bacterial and cyanobacterial abundances. Both bacterial and cyanobacterial abundances peaked and then decreased in the same time period in both treatments. However, bacteria presented a significant increase on Day 1 while cyanobacteria on Day 2. This was also observed by Tsagaraki et al. (in review) and is an indication that bacteria out-competed cyanobacteria for nutrients.
Interestingly, in both dust treatments, the values of PP and Chl a concentration remained at high levels, at least until Days 5 and 6, respectively, whereas BP sharply decreased immediately after its peak on Days 2 and 3. In fact, phytoplankton biomass was characterized by different fractions in different periods of the experiment; Synechococcus (picoplankton) peaked first and larger-than-2 μm cells (nanoplankton) followed. According to Lagaria et al. (2017, this SI), Synechococcus were related to P, which was taken up until Day 3, whereas larger cells to N, which remained at a higher concentration after P exhaustion.
Impact of Dust Addition on Larger Organisms and Food Web Interactions
While the response to dust addition was clearly reflected on PP, BP, Chl a concentration and cyanobacterial and heterotrophic bacterial densities, there was not any effect on the trophic levels further up the food web; the dynamics of autotrophic flagellates and also of the grazers such as heterotrophic flagellates, ciliates, dinoflagellates, even of viruses, did not follow an obvious pattern and the difference between treatments and Cnt was lost. These results indicate that nutrient addition fueled primary and bacterial production at the beginning. The size class that significantly responded first was picoplankton, both auto- and hetero-trophic. Subsequently, grazing processes played a role in the regulation of the populations recently built up.
The initial increase in % of HDNA bacteria in both SA and RA could indicate a change in bacterial community composition toward more active cells in the dust-treated mesocosms. This shift in bacterial community composition has also been reported in Guo et al. (2016, this SI) during the 2012 dust-addition experiment conducted in the same area. The increase in % of HDNA bacteria was followed by an increase in bacteria grazers, the heterotrophic flagellates which seem to have been the main factor causing the reduction of bacterioplankton abundance after Day 3; in fact, the decline of HDNA bacterial abundance was sharper in the treated mesocosms compared to Cnt. HF have been shown to graze selectively on active HDNA bacteria (Baltar et al., 2015). On the other hand, it seems that during the present study, viral infection was not important for bacteria mortality, since total virus abundance did not increase in the dust-treated mesocosms at any time during the experiment, not even when bacterial activity was at its highest; neither total nor LDNA viruses, assumed to be mostly bacteriophages, increased in abundance. In the 2012 Crete experiment, Tsiola et al. (2017, this SI) found that viral production rate did not increase when dust was added in the Eastern Mediterranean but, surprisingly, it was decreased. The authors attributed this finding to processes not synchronized to the viral production experiments, such as extensive lysis events occurred prior to sampling. During the DUNE-R experiment, Pulido-Villena et al. (2014) attributed the lack of increase in heterotrophic bacteria and HF abundance after dust addition to viral infection; however, viral rates were not measured. In the present experiment, although the increase of HF abundance followed that of their prey, heterotrophic bacteria, no difference was found between treatments and Cnt; at this point, our results agree with those of the DUNE-R experiment during which Pulido-Villena et al. (2014) reported no differences in terms of HF between dust-amended mesocosms and Cnt.
The increase in HF numbers was followed by a decline under the pressure of their own grazers, ciliates and dinoflagellates, which progressively increased after Day 2 and 3, respectively, until the end of the experiment. It is interesting to note that on the last day of the experiment, the ciliate abundance was higher in the Cnt than in the treatments; this could perhaps be attributed to a relaxation of grazing exerted on ciliates by mesozooplankton. Indeed, the mesozooplankton biomass, measured on the last day, was higher in the amended mesocosms compared to the Cnt. This biomass increase is not particularly big considering the size-developmental stage of the animals, the temperature and the absence of predatory mortality. The growth rate, estimated from the difference of biomass between the start and end of the 10-day long experiment, was normal. Even for the treatment with the highest biomass increase (RA), the growth rate was within the range of values at 20°C, under in situ food conditions, for small copepods constituted mostly by juvenile stages (Hirst and Bunker, 2003). This is valid even when considering the maximum non-predatory mortality reported in the Mediterranean (0.05 day−1, Frangoulis et al., 2011).
The results of this study allow us to conclude that on the very first days of the experiment, the osmotrophic populations were clearly favored by the N and P added through dust and built their populations; after that period, grazing pressures, exerted on multiple levels of the complex food web, masked the difference between the treated mesocosms and the Cnt. This masking of the impact of nutrient addition when moving away from the osmotrophic part of the food web has been observed in mesocosm experiments with nutrient additions (Pitta et al., 2016; Tsagaraki et al., in review). It may be related to the complex trophic relationships prevailing in the microbial food web, which become even more complex because of the occurrence of mixotrophic species in almost all functional groups.
The role of grazing in masking the effect of nutrient addition on parts of the food web, which was mainly assumed in previous experiments, was partly verified during the present study by the means of two dilution experiments. Grazing on AF and Synechococcus was found to be stimulated by dust addition compared to the Cnt (whereas this was not verified in the case of picoeukaryotes). This may have been the reason why no difference was found between SA and Cnt in terms of AF density. We may assume that similar masking effects have also taken place between other predators and prey, finally resulting in the impact of dust addition being visible again as the difference between amended mesocosms and Cnt, much further up the food web, on mesozooplankton, perhaps simply because grazers of mesozooplankton were absent from this particular experimental set-up.
Conclusions
Our data showed that independently of the way dust was added to the surface of the oligotrophic marine environment of the Eastern Mediterranean, either in a single strong pulse (SA) or in three repetitive smaller pulses (RA), both the autotrophic and heterotrophic components of the microbial food web presented a significant response. Both primary and bacterial productions showed a clear effect (2-fold increase), fuelled by nutrients (N and P) added via dust. Phytoplankton biomass as well as heterotrophic bacteria and cyanobacteria abundances also showed an important increase. Phytoplankton responded first, followed by bacterioplankton. When dust was added in three repetitive doses, the response presented a delay of 1 day; however, maximum values attained were similar in both treatments. The effect of dust addition was later lost in the intermediate trophic levels, masked by multiple grazing processes taking place in this complex multitrophic food web; until it was again visible in mesozooplankton, which presented a higher density in the dust-amended mesocosms.
Author Contributions
Planning of the original experimental design: PP, GP, SC, MKan, NM. Carrying out of experiment and sampling in the field: PP, IS, AT. Characterization of dust: KV, PN, MKan. Sea water chemical analyses: MT, KV, PN. Chlorophyll a concentration: NP, PD. Primary production: AL, SP. Bacterial production: AG. Virus, heterotrophic bacteria and Synochocococcus abundance and biomass: AT. Flagellate and ciliate counts: MKag. Mesozooplankton abundance and biomass: CF. Dilution experiment: PP, AG, NP, IS, AT, PD. Organizing the data set and calculating simple statistics: PP, AT. Organizing the operation of mesocosms and obtaining funding: PP, GP. Writing up manuscript: PP, AG, AL, SP, KV, MT.
Conflict of Interest Statement
The authors declare that the research was conducted in the absence of any commercial or financial relationships that could be construed as a potential conflict of interest.
Acknowledgments
This study was funded by the project ADAMANT—“Atmospheric deposition and Mediterranean sea water productivity” project (nr code/MIS: 383551), co-financed by the European Union (European Social Fund–ESF) and Greek national funds (Operational Program “Education and Lifelong Learning” of the National Strategic Reference Framework—NSRF, Research Funding Program: THALES). We wish to thank G. Piperakis for his inspired technical assistance throughout the experiment, D. Amanatidis for assistance during the mesocosm filling, S. Zivanovic and E. Dafnomili for assistance with chemical analyses, A. Konstantinopoulou, S. Diliberto, and D. Podaras for assistance during the experiment, S. Batziakas for support with zooplankton counting and N. Sekeris for his help with constructions and ideas for technical solutions. The captain and the crew of the R/V Philia are also thanked for their assistance during the transportation of water from the sea to the mesocosms. Finally, the two reviewers are thanked for their important contributions to the improvement of this manuscript.
References
Alcaraz, M., and Calbet, A. (2003). “Zooplankton ecology,” in Marine Ecology. Encyclopedia of Life Support Systems (EOLSS), eds C. Duarte and A. Lott Helgueras (Oxford: Developed under the Auspices of the UNESCO, Eolss Publishers), 295–318.
Baltar, F., Palovaara, J., Unrein, F., Catala, P., and Horňák, K., Šimek, K., et al. (2015). Marine bacterial community structure resilience to changes in protist predation under phytoplankton bloom conditions. ISME J. 10, 568–581. doi: 10.1038/ismej.2015.135
Bardouki, H., Liakakou, H., Economou, C., Sciare, J., Smolík, J., Ždímal, V., et al. (2003). Chemical composition of size resolved atmospheric aerosols in the Eastern Mediterranean during summer and winter. Atmos. Environ. 37, 195–208. doi: 10.1016/S1352-2310(02)00859-2
Blain, S., Guieu, C., Claustre, H., Leblanc, K., Moutin, T., Quéguiner, B., et al. (2004). Availability of iron and major nutrients for phytoplankton in the northeast Atlantic Ocean. Limnol. Oceanogr. 49, 2095–2104. doi: 10.4319/lo.2004.49.6.2095
Bonnet, S., Guieu, C., Chiaverini, J., Ras, J., and Stock, A. (2005). Effect of atmospheric nutrients on the autotrophic communities in a low nutrient, low chlorophyll system. Limnol. Oceanogr. 50, 1810–1819. doi: 10.4319/lo.2005.50.6.1810
Boyd, P. W., Jickells, T. D., Law, C. S., Blain, S., Boyle, E. A., Buesseler, K. O., et al. (2007). Mesoscale iron enrichment experiments 1993-2005: synthesis and future directions. Science 315, 612–617. doi: 10.1126/science.1131669
Brussaard, C. P. D. (2004). Optimization of procedures for counting viruses by flow cytometry. Appl. Environ. Microbiol. 70, 1506–1513. doi: 10.1128/AEM.70.3.1506-1513.2004
Caron, D. A., Dam, H. G., Kremer, P., Lessard, E. J., Madin, L. P., Malone, T. C., et al. (1995). The contribution of microorganisms to particulate carbon and nitrogen in surface waters of the Sargasso Sea near Bermuda. Deep-Sea Res. I 42, 943–972. doi: 10.1016/0967-0637(95)00027-4
Desboeufs, K., Leblond, N., Wagener, T., Bon Nguyen, E., and Guieu, C. (2014). Chemical fate and settling of mineral dust in surface seawater after atmospheric deposition observed from dust seeding experiments in large mesocosms. Biogeosciences 11, 5581–5594. doi: 10.5194/bg-11-5581-2014
Frangoulis, C., Grigoratou, M., Zoulias, T., Hannides, C. C. S., Pantazi, M., Psarra, S., et al. (2016). Expanding zooplankton standing stock estimation from meso- to metazooplankton: a case study in the N. Aegean Sea (Mediterranean Sea). Cont. Shelf Res. doi: 10.1016/j.csr.2016.10.004
Frangoulis, C., Skliris, N., Lepoint, G., Elkalay, K., Goffart, A., Pinnegar, J. K., et al. (2011). Importance of copepod carcasses versus faecal pellets in the upper water column of an oligotrophic area. Estuar. Coast. Shelf Sci. 92, 456–463. doi: 10.1016/j.ecss.2011.02.005
Gerasopoulos, E., Kouvarakis, G., Babasakalis, P., Vrekoussis, M., Putaud, J.-P., and Mihalopoulos, N. (2006). Origin and variability of particulate matter (PM10) mass concentrations over the Eastern Mediterranean. Atmos. Environ. 40, 4679–4690. doi: 10.1016/j.atmosenv.2006.04.020
Giovagnetti, V., Brunet, C., Conversano, F., Tramontano, F., Obernosterer, I., Ridame, C., et al. (2013). Assessing the role of dust deposition on phytoplankton ecophysiology and succession in a low-nutrient low-chlorophyll ecosystem: a mesocosm experiment in the Mediterranean Sea. Biogeosciences 10, 2973–2991. doi: 10.5194/bg-10-2973-2013
Guerzoni, S., Chester, R., Dulac, F., Herut, B., Loÿe-Pilot, M. D., Measures, C., et al. (1999). The role of atmospheric deposition in the biogeochemistry of the Mediterranean Sea. Prog. Oceanogr. 44, 147–190. doi: 10.1016/S0079-6611(99)00024-5
Guieu, C., Ridame, C., Pulido-Villena, E., Bressac, M., Desboeufs, K., and Dulac, F. (2014). Impact of dust deposition on carbon budget: a tentative assessment from a mesocosm approach. Biogeosciences 11, 5621–5635. doi: 10.5194/bg-11-5621-2014
Guo, C., Jing, H., Kong, L., and Liu, H. (2013). Effect of East Asian aerosol enrichment on microbial community composition in the South China Sea. J. Plankton Res. 35, 485–503. doi: 10.1093/plankt/fbt002
Guo, C., Xia, X., Pitta, P., Herut, B., Rahav, E., Berman-Frank, I., et al. (2016). Shifts in microbial community structure and activity in the ultra-oligotrophic Eastern Mediterranean Sea driven by Saharan Dust and European aerosol deposition. Front. Mar. Sci. 3:170. doi: 10.3389/fmars.2016.00170
Guo, C., Yu, J., Ho, T.-Y., Wang, L., Song, S., Kong, L., et al. (2012). Dynamics of phytoplankton community structure in the South China Sea in response to the East Asian aerosol input. Biogeosciences 9, 1519–1536. doi: 10.5194/bg-9-1519-2012
Hedges, J. I., and Stern, J. H. (1984). Carbon and Nitrogen determination of carbonate-containing solids. Limnol. Oceanogr. 29, 657–663. doi: 10.4319/lo.1984.29.3.0657
Herut, B., Zohary, T., Krom, M. D., Mantoura, R. F. C., Pitta, P., Psarra, S., et al. (2005). Response of East Mediterranean surface water to Saharan dust: on-board microcosm experiment and field observations. Deep Sea Res. 52, 3024–3040. doi: 10.1016/j.dsr2.2005.09.003
Hirst, A. G., and Bunker, A. J. (2003). Growth of marine planktonic copepods: global rates and patterns in relation to chlorophyll a, temperature, and body weight. Limnol. Oceanogr. 48, 1988–2010. doi: 10.4319/lo.2003.48.5.1988
Holm-Hansen, O., Lorenzen, C. J., Holmes, R. W., and Strickland, J. D. H. (1965). Fluorometric determination of chlorophyll. ICES J. Mar. Sci. 30, 3–15. doi: 10.1093/icesjms/30.1.3
Ivancic, I., and Degobbis, D. (1984). An optimal manual procedure for ammonia analysis in natural waters by the indophenol blue method. Water Res. 18, 1143–1147. doi: 10.1016/0043-1354(84)90230-6
Jickells, T. D., An, Z. S., Andersen, K. K., Baker, A. R., Bergametti, G., Brooks, N., et al. (2005). Global iron connections between desert dust, ocean biogeochemistry, and climate. Science 308, 67–71. doi: 10.1126/science.1105959
Kana, T., and Glibert, P. M. (1987). Effect of irradiances up to 2000 μE m-2 s-1 on marine Synechococcus WH 7803-I. Growth, pigmentation and cell composition. Deep Sea Res. 34, 479–516. doi: 10.1016/0198-0149(87)90001-X
Kirchman, D. L. (1993). “Leucine incorporation as a measure of biomass production by heterotrophic bacteria,” in Handbook of Methods in Aquatic Microbial Ecology, eds P. F. Kemp, B. F. Sherr, E. B. Sherr, and J. J. Cole (Lewis, IA: Lewis Publishers) 509–512.
Kirchman, D. L., Newell, S. Y., and Hodson, R. E. (1986). Incorporation versus biosynthesis of leucine: implications for measuring rates of protein syntheis and biomass production by bacteria in marine systems. Mar. Ecol. Prog. Ser. 32, 47–59. doi: 10.3354/meps032047
Kress, N., and Herut, B. (2001). Spatial and seasonal evolution of dissolved oxygen and nutrients in the Southern Levantine Basin (Eastern Mediterranean Sea): chemical characterization of the water masses and inferences on the N: P ratios. Deep Sea Res. I 48, 2347–2372. doi: 10.1016/S0967-0637(01)00022-X
Krom, M. D., Kress, N., Brenner, S., and Gordon, L. I. (1991). Phosphorus limitation of primary productivity in the eastern Mediterranean Sea. Limnol. Oceanogr. 36, 424–432. doi: 10.4319/lo.1991.36.3.0424
Krom, M. D., Thingstad, T. F., Brenner, S., Carbo, P., Drakopoulos, P., Fileman, T. W., et al. (2005b). Summary and overview of the CYCLOPS P addition Lagrangian experiment in the Eastern Mediterranean. Deep Sea Res. II 52, 3090–3108. doi: 10.1016/j.dsr2.2005.08.018
Krom, M. D., Woodward, E. M. S., Herut, B., Kress, N., Carbo, P., Mantoura, R. F. C., et al. (2005a). Nutrient cycling in the south east Levantine basin of the eastern Mediterranean: results from a phosphorus starved system. Deep Sea Res. II 52, 2879–2896. doi: 10.1016/j.dsr2.2005.08.009
Lagaria, A., Mandalakis, M., Mara, P., Papageorgiou, N., Pitta, P., Tsiola, A., et al. (2017). Phytoplankton response to Saharan dust depositions in the eastern Mediterranean Sea: a mesocosm study. Front. Mar. Sci. 3:287. doi: 10.3389/fmars.2016.00287
Lagaria, A., Psarra, S., Lefèvre, D., Van Wambeke, F., Courties, C., Pujo-Pay, M., et al. (2011). The effects of nutrient additions on particulate and dissolved primary production and metabolic state in surface waters of three Mediterranean eddies. Biogeosciences 8, 2595–2607. doi: 10.5194/bg-8-2595-2011
Laghdass, M., Blain, S., Besseling, M., Catala, P., Guieu, C., and Obernosterer, I. (2011). Effects of Saharan dust on the microbial community during a large in situ mesocosm experiment in the NW Mediterranean Sea. Aquat. Microb. Ecol. 62, 201–213. doi: 10.3354/ame01466
Landry, M. R., Brown, S. L., Neveux, J., Dupouy, C., Blanchot, J., Christensen, S., et al. (2003). Phytoplankton growth and microzooplankton grazing in high-nutrient, low-chlorophyll waters of the equatorial Pacific: community and taxon-specific rate assessment from pigment and flow cytometric analyses. J. Geophys. Res. 108:8142. doi: 10.1029/2000jc000744
Landry, M. R., and Hassett, R. P. (1982). Estimating the grazing impact of marine micro-zooplankton. Mar. Biol. 67, 283–288. doi: 10.1007/BF00397668
Lee, S., and Fuhrman, J. A. (1987). Relationships between biovolume and biomass of naturally derived marine bacterioplankton. Appl. Environ. Microbiol. 53, 1298–1303.
Lekunberri, I., Lefort, T., Romero, E., Vázquez-Domínguez, E., Romera-Castillo, C., Marrasé, C., et al. (2010). Effects of a dust deposition event on coastal marine microbial abundance and activity, bacterial community structure and ecosystem function. J. Plankton Res. 32, 381–396. doi: 10.1093/plankt/fbp137
Lin, P., Chen, M., and Guo, L. (2012). Speciation and transformation of phosphorus and its mixing behavior in the Bay of St. Louis estuary in the northern Gulf of Mexico. Geochim. Cosmochim. Acta 87, 283–298. doi: 10.1016/j.gca.2012.03.040
Mahowald, N. M., Baker, A. R., Bergametti, G., Brooks, N., Duce, R. A., Jickells, T. D., et al. (2008). Atmospheric global dust cycle and iron inputs to the ocean. Glob. Biogeochem. Cycles 19:GB4025. doi: 10.1029/2004GB002402
Marañón, E., Fernández, A., Mouri-o-Carballido, B., Martinez-Garcia, S., Teira, E., Cerme-o, P., et al. (2010). Degree of oligotrophy controls the response of microbial plankton to Saharan dust. Limnol. Oceanogr. 55, 2339–2352. doi: 10.4319/lo.2010.55.6.2339
Marie, D., Brussaard, C. P. D., Thyrhaug, R., Bratbak, G., and Vaulot, D. (1999). Enumerating of marine viruses in culture and natural samples by flow cytometry. Appl. Environ. Microbiol. 65, 45–52.
Martin, J. H. (1990). Glacial-interglacial CO2 change: the iron hypothesis. Paleoceanography 31, 1–13. doi: 10.1029/PA005i001p00001
Mills, M. M., Ridame, C., Davey, M., LaRoche, J., and Geider, R. J. (2004). Iron and phosphorus co-limit nitrogen fixation in the eastern tropical North Atlantic. Nature 429, 292–294. doi: 10.1038/nature02550
Miyazaki, Y., Kawamura, K., Jung, J., Furutani, H., and Uematsu, M. (2011). Latitudinal distributions of organic nitrogen and organic carbon in marine aerosols over the western North Pacific. Atmos. Chem. Phys. 11, 3037–3049. doi: 10.5194/acp-11-3037-2011
Paraskevopoulou, D., Liakakou, E., Gerasopoulos, E., and Mihalopoulos, N. (2015). Sources of atmospheric aerosol from long-term measurements (5 years) of chemical composition in Athens, Greece. Sci. Tot. Environ. 527–528, 165–178. doi: 10.1016/j.scitotenv.2015.04.022
Pitta, P., Giannakourou, A., and Christaki, U. (2001). Planktonic ciliates in the oligotrophic Mediterranean Sea: longitudinal trends of standing stocks, distributions and analysis of food vacuole contents. Aquat. Microb. Ecol. 24, 297–311. doi: 10.3354/ame024297
Pitta, P., Nejstgaard, J. C., Tsagaraki, T. M., Zervoudaki, S., Egge, J. K., Frangoulis, C., et al. (2016). Confirming the “Rapid phosphorus transfer from microorganisms to mesozooplankton in the Eastern Mediterranean Sea” scenario through a mesocosm experiment. J. Plankton Res. 38, 502–521. doi: 10.1093/plankt/fbw010
Pitta, P., Stambler, N., Tanaka, T., Zohary, T., Tselepides, A., and Rassoulzadegan, F. (2005). Biological response to P addition in the Eastern Mediterranean Sea. The microbial race against time. Deep Sea Res. II 52, 2961–2974. doi: 10.1016/j.dsr2.2005.08.012
Porter, K. G., and Feig, Y. S. (1980). The use of DAPI for identifying and counting of aquatic microflora. Limnol. Oceanogr. 25, 943–948. doi: 10.4319/lo.1980.25.5.0943
Postel, L., Fock, H., and Hagen, W. (2000). “Biomass and abundance,” in Zooplankton Methodology Manual, eds R. P. Harris, P. H. Wiebe, J. Lenz, H. R. Skjoldal, and M. Huntley (London: Academic Press), 83–192.
Pulido-Villena, E., Baudoux, A.-C., Obernosterer, I., Landa, M., Caparros, J., Catala, P., et al. (2014). Microbial food web dynamics in response to a Saharan dust event: results from a mesocosm study in the oligotrophic Mediterranean Sea. Biogeosciences 11, 5607–5619. doi: 10.5194/bg-11-5607-2014
Pulido-Villena, E., Wagener, T., and Guieu, C. (2008). Bacterial response to dust pulses in the western Mediterranean: implications for carbon cycling in the oligotrophic ocean. Glob. Biogeochem. Cycles 22:GB1020. doi: 10.1029/2007gb003091
Putt, M., and Stoecker, D. K. (1989). An experimentally determined carbon: volume ratio for marine “oligotrichous” ciliates from estuarine and coastal waters. Limnol. Oceanogr. 34, 1097–1103. doi: 10.4319/lo.1989.34.6.1097
Ridame, C., Dekaezemacker, J., Guieu, C., Bonnet, S., L'Helguen, S., and Malien, F. (2014). Contrasted Saharan dust events in LNLC environments: impact on nutrient dynamics and primary production. Biogeosciences 11, 4783–4800. doi: 10.5194/bg-11-4783-2014
Rimmelin, P., and Moutin, T. (2005). Re-examination of the MAGIC method to determine low orthophosphate concentration in seawater. Anal. Chim. Acta 548, 174–182. doi: 10.1016/j.aca.2005.05.071
Romero, E., Peters, F., Marrasé, C., Guadayol, O., Gasol, J. M., and Weinbauer, M. G. (2011). Coastal Mediterranean plankton stimulation dynamics through a dust storm event: an experimental simulation. Estuar. Coast. Shelf Sci. 93, 27–39. doi: 10.1016/j.ecss.2011.03.019
Sempéré, R., Panagiotopoulos, C., Lafont, R., Marroni, B., and Van Wambeke, F. (2002). Total organic carbon dynamics in the Aegean Sea. J. Mar. Syst. 33–34, 355–364. doi: 10.1016/S0924-7963(02)00066-0
Smith, D. C., and Azam, F. (1992). A simple, economical method for measuring bacterial protein synthesis rates in seawater using 3H-leucine. Mar. Microb. Food Webs 6, 107–114.
Steemann-Nielsen, E. (1952). The use of radio-active carbon (C14) for measuring organic production in the sea. J. Cons. Explor. Mer. 18, 117–140. doi: 10.1093/icesjms/18.2.117
Strickland, J. D., and Parsons, T. R. (1972). A practical handbook of seawater analysis. J. Fish. Res. Board Can. 167, 71–76.
Tanaka, T., Thingstad, T. F., Christaki, U., Colombet, J., Cornet-Barthaux, V., Courties, C., et al. (2011). Lack of P-limitation of phytoplankton and heterotrophic prokaryotes in surface waters of three anticyclonic eddies in the stratified Mediterranean Sea. Biogeosciences 8, 525–538. doi: 10.5194/bg-8-525-2011
Ternon, E., Guieu, C., Loÿe-Pilot, M.-D., Leblond, N., Bosc, E., Gasser, B., et al. (2010). The impact of Saharan dust on the particulate export in the water column of the NorthWestern Mediterranean Sea. Biogeosciences 7, 809–826. doi: 10.5194/bg-7-809-2010
Thingstad, T. F., Krom, M. D., Mantoura, R. F. C., Flaten, G. A. F., Groom, S., Herut, B., et al. (2005). Nature of phosphorus limitation in the ultraoligotrophic eastern Mediterranean. Science 309, 1068–1071. doi: 10.1126/science.1112632
Tsiola, A., Tsagaraki, M. T., Giannakourou, A., Nikolioudakis, N., Yucel, N., Herut, B., et al. (2017). Viruses and flagellates impact upon bacteria in the Eastern Mediterranean Sea after Saharan dust and polluted aerosol enrichment. Front. Mar. Sci. 3:281. doi: 10.3389/fmars.2016.00281
Utermöhl, H. (1958). Zur Vervollkommung der quantitativen Phytoplankton-methodik. Mitt. Int. Ver. Theor. Angew Limnol. 9, 1–38.
Van Wambeke, F., Obernosterer, I., Moutin, T., Duhamel, S., Ulloa, O., and Claustre, H. (2008). Heterotrophic bacterial production in the eastern South Pacific: longitudinal trends and coupling with primary production. Biogeosciences 5, 157–169. doi: 10.5194/bg-5-157-2008
Vincent, J., Laurent, B., Losno, R., Bon Nguyen, E., Roullet, P., Sauvage, S., et al. (2016). Variability of mineral dust deposition in the western Mediterranean basin and south-east of France. Atmos. Chem. Phys. 16, 8749–8766. doi: 10.5194/acp-16-8749-2016
Keywords: natural Saharan dust, Eastern Mediterranean, mesocosm, plankton food web, grazing
Citation: Pitta P, Kanakidou M, Mihalopoulos N, Christodoulaki S, Dimitriou PD, Frangoulis C, Giannakourou A, Kagiorgi M, Lagaria A, Nikolaou P, Papageorgiou N, Psarra S, Santi I, Tsapakis M, Tsiola A, Violaki K and Petihakis G (2017) Saharan Dust Deposition Effects on the Microbial Food Web in the Eastern Mediterranean: A Study Based on a Mesocosm Experiment. Front. Mar. Sci. 4:117. doi: 10.3389/fmars.2017.00117
Received: 19 December 2016; Accepted: 11 April 2017;
Published: 02 May 2017.
Edited by:
Christian Grenz, Mediterranean Institute of Oceanography, FranceReviewed by:
E. Elena Garcia-Martin, University of East Anglia, UKSuzanne Jane Painting, Centre for Environment, Fisheries and Aquaculture Science, UK
Copyright © 2017 Pitta, Kanakidou, Mihalopoulos, Christodoulaki, Dimitriou, Frangoulis, Giannakourou, Kagiorgi, Lagaria, Nikolaou, Papageorgiou, Psarra, Santi, Tsapakis, Tsiola, Violaki and Petihakis. This is an open-access article distributed under the terms of the Creative Commons Attribution License (CC BY). The use, distribution or reproduction in other forums is permitted, provided the original author(s) or licensor are credited and that the original publication in this journal is cited, in accordance with accepted academic practice. No use, distribution or reproduction is permitted which does not comply with these terms.
*Correspondence: Paraskevi Pitta, dnBpdHRhQGhjbXIuZ3I=