 Feng Zhang
 Chenlin Hu
 C. K. Shum3
 Jiyoung Lee
- 1Environmental Science Graduate Program, The Ohio State University, Columbus, OH, USA
- 2Division of Environmental Health Sciences, College of Public Health, The Ohio State University, Columbus, OH, USA
- 3Division of Geodetic Science, School of Earth Sciences, The Ohio State University, Columbus, OH, USA
- 4Department of Environmental and Global Health, College of Public Health and Health Professions, University of Florida, Gainesville, FL, USA
- 5Department of Food Science and Technology, The Ohio State University, Columbus, OH, USA
The growth of toxic Cyanobacterium, Microcystis aeruginosa, and the production of toxins, microcystins, pose serious concerns for the ecological health of lakes, such as western Lake Erie. The toxins are also significant health hazards and could contaminate tap water when sufficient and effective water treatment fails. In this study, water from the intakes of two water treatment plants along Lake Erie (Toledo and Painesville) were collected and examined for microcystins concentration (μg/L) and M. aeruginosa abundance (gene copies/mL) in concert with the performance of satellite-based cyanobacteria bloom indicators, chlorophyll-a and Cyanobacteria Index, a spectral shape index for monitoring the severity of cyanobacterial blooms from the Moderate Resolution Imaging Spectroradiometer (MODIS) from May to October in 2013. Good correlations were observed between toxic M. aeruginosa, microcystins, and MODIS-retrieved bloom indicators for the Toledo water plant intake, where blooms were much more severe with higher chlorophyll-a, phycocyanin and microcystins, but not for the Painesville water plant intake in central Lake Erie where the blooms were less severe. The Spearman's correlation (0.815) suggested a high correlation between the level of microcystins and MODIS-retrieved chlorophyll-a concentration for the Toledo intake point in western Lake Erie. Both total and toxic Microcystis abundance showed a significant positive correlation with MODIS-retrieved chlorophyll-a for the Toledo water intake, as well as the two locations combined. This finding demonstrates the potential utility of satellite remote sensing for detection and monitoring of cyanobacterial blooms, and the method's potential use as an early warning system as a means of preventing human exposure to bloom-impacted waters.
Introduction
Cyanobacteria can be found in inland and coastal waters throughout the world. They proliferate rapidly in nutrient rich waters and often form blooms during warm summer and autumn weather. These blooms are a serious concern, because they can have adverse environmental, economic, and public health impacts (de Figueiredo et al., 2004; Steffensen, 2008). Some cyanobacteria can produce toxins that have neurotoxic, hepatotoxic, and tumor promoting properties (Codd et al., 2005; Li et al., 2011). These toxins include microcystins, saxitoxins, cylindrospermopsins, nodularins, and anatoxins (Sinclair and Hall, 2008). Of these compounds, microcystins are the most commonly reported cyanobacterial toxins in North America (Pelaez et al., 2010) as well as worldwide (Harke et al., 2016). Exposure to these toxins occurs via ingestion of contaminated water, skin contact, and inhalation (Codd et al., 1999). In recent decades, the frequency and intensity of the blooms, as well as the associated economic costs, have increased worldwide (O'Neil et al., 2012). Of greater concern, recent studies suggest that future environmental changes, including rising water temperatures and climate-induced eutrophication, will be more favorable for bloom-forming cyanobacteria (Paerl et al., 2011; Michalak et al., 2013). Microcystis blooms in the Laurentian Great Lakes, especially western Lake Erie, have been observed almost annually in recent years (Rinta-Kanto et al., 2009; Michalak et al., 2013). Among the Great Lakes, Lake Erie is the shallowest and most nutrient-rich, making it more vulnerable to harmful algal blooms (HAB). It has 1,402 kilometers of shoreline, that stretches along the borders of Michigan, Ohio, Pennsylvania, New York, and Ontario and provides drinking water to over 11 million people (Environmental Protection Agency, 2004). According to a report by the Ohio Lake Erie Commission, there are 27 lake-fed water treatment plants along Ohio's North Coast (Ohio Lake Erie Commission, 2004). In Toledo and other communities in western Lake Erie, microcystins and HAB have been found in intake waters, which were subsequently treated and used as drinking water. The water treatment costs for Toledo alone are $3–4 million a year (Associated Press, 2013). However, despite extensive efforts, toxins concentrations were found above the WHO guideline level for safe drinking water when the toxins were not removed sufficiently. A Water Emergency for the city of Toledo was issued in August 2014, when microcystin was discovered in water samples (Ohio Lake Erie Commission, 2004). Another area that draws source water from western Lake Erie, Carroll Township (about 30 kilometers east of Toledo) issued a warning in September 2013 when, even after treatment, their drinking water was found to have contained 3.56 μg/L microcystins (Henry, 2013).
Due to their severe adverse impacts, the monitoring of harmful cyanobacterial blooms and toxins is especially important to provide timely warnings for protection of public health. However, cyanotoxins are not routinely monitored in all recreational and finished drinking waters, mainly due to the costly testing procedures. Additionally, traditional monitoring methods typically require that water samples, collected in the field, be returned to the laboratory so that laboratory analysis, including counting cyanobacteria, can be performed; this process can be time-consuming as well as labor intensive. Due to the limitations of traditional monitoring methods, the frequency of sampling and the number of sampling locations for harmful cyanobacterial blooms are usually inadequate.
To inform timely and effective public health policies, there is an urgent need to develop monitoring systems for harmful cyanobacterial blooms, and thereby their toxins, in Lake Erie and other water bodies. In this way, not only we can prevent recreational exposure to cyanotoxins, but also alert water treatment plants, in real-time, to implement special treatment procedures to ensure drinking water safety. Studies have developed algorithms to retrieve chlorophyll-a and phycocyanin data, based on Landsat, Medium Resolution Imaging Spectrometer (MERIS), Moderate Resolution Imaging Spectroradiometer (MODIS), etc. (Kutser, 2004; Vincent et al., 2004; Simis et al., 2005; Becker et al., 2009). Because of the unique spectral characteristics of cyanobacterial blooms, spaceborne remote sensing has been introduced to monitor algal blooms in Lake Erie (Vincent et al., 2004; Stumpf et al., 2012) and other parts of the world (Siswanto et al., 2013), mostly by quantifying concentration of pigments such as chlorophyll-a or phycocyanin. The key advantage of using satellite imagery for determining water quality parameters is the near continuous spatial coverage in a time-saving manner. Many operational programs now incorporate satellite remote sensing into their monitoring system as a preliminary method (Stumpf et al., 2009; Wynne et al., 2013). Currently, the Experimental Lake Erie Harmful Algal Bloom Bulletin by the National Centers for Coastal Ocean Science and Great Lakes Environmental Research Laboratory uses a MODIS-based Cyanobacteria Index (CI) for monitoring cyanobacterial blooms in Lake Erie. However, remote sensing is only used as a preliminary indicator, due to the lack of a valid quantitative relationship between satellite observation and in situ toxin level data. To date, only a few peer-reviewed articles have evaluated performance of satellite remote sensing for estimating toxin concentrations and validating with toxin-producing cyanobacterial blooms in aquatic systems (Hunter et al., 2010).
In the present study, the performance of two satellite based indicators were examined for the monitoring of harmful cyanobacterial blooms at two drinking water intakes in Lake Erie. Due to the dominance of Microcystis in Lake Eire (Brittain et al., 2000), our cyanobacterial monitoring methods were focused on Microcystis and toxin-producing Microcystis. By examining the association between satellite and tested cyanobacterial bloom indicators (such as pigment concentration, cyanobacteria abundance, and toxins level), the utility of satellite-based indicators in building a public health-oriented monitoring system can be assessed. Accordingly, with the assistance of the proposed monitoring system, water treatment plants and other related entities could respond to intensive blooms in a timely manner.
Materials and Methods
Study Site
All field and laboratory tests were performed using water samples collected from the intake points of two water treatment plants in Toledo and Painesville in Ohio, United States (Figure 1). The Toledo water plant draws water from the western basin of Lake Erie, east of the City of Toledo, where massive cyanobacterial blooms frequently occur. This location is about 3 miles from the shore (City of Maumee, the center of the box as shown in Figure 1). In contrast, the Painesville water treatment plant draws its water from the central basin, where the blooms are much milder. Weekly samples were collected from the Lake County East Water Plant (Painesville, Ohio, USA) water intake point, which draws water about 60 cm (2 feet) above the bottom of the lake (41.784°, −81.301°), from late May to the end of October, 2013. Weekly water samples were collected from Collins Park Water Treatment Plant (Toledo, Ohio, USA) at the water intake point (about 20 cm below from water surface; 41.738°, −83.303°) during the same period.
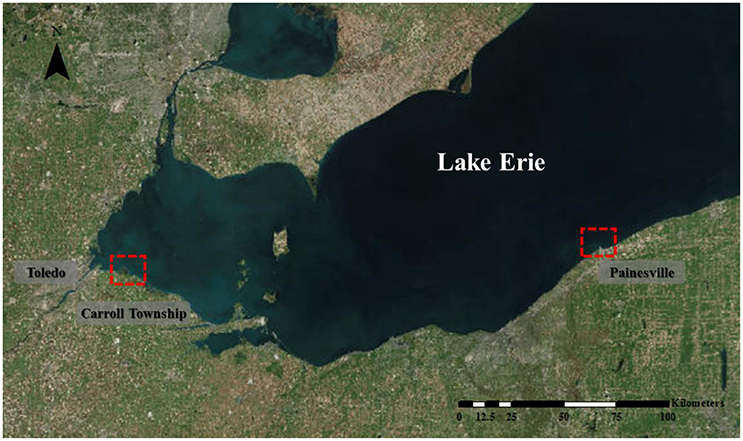
Figure 1. Map showing the intake locations of the Toledo and Painesville water plants.
Water Quality Measurements
Water quality parameters including water temperature, turbidity, and pH were measured in situ and obtained from the water plants. Both chlorophyll-a and phycocyanin (PC) were measured in vivo using a two-channel handheld Aquaflour™ fluorometer (Turner Designs®, Sunnyvale, CA) as described in our previous study (Marion et al., 2012). Water samples were sent to The Ohio State University main campus laboratory (Columbus, OH) on ice for quantitative polymerase chain reaction analysis (qPCR), as well as nutrient and ELISA tests. Colorimetric methods were used for the determination of nitrate by the dimethylphenol or the cadmium reduction methods (Methods 10206 and 8192, Hach Company, Loveland, CO), and total phosphorus was determined using the U.S. Environmental Protection Agency approved acid persulfate digestion method (Method 8190, PhosVer® 3, Hach Company, Loveland, CO). Heterotrophic plate counts (HPC) were performed using the Environmental Protection Agency approved standard method 9215.
Toxin Measurements
Microcystin concentrations were quantified using the EPA-validated Microcystins/Nodularins (ADDA) ES, ELISA kit in a 96-well plate (catalog number PN520011ES, Abraxis®, Warminster, PA). Water samples went through a five time freeze/thaw procedure at −20°C and room temperature, respectively, to effectively lyse cells and release toxins. For each multi-well plate, a total of six standards were used in duplicate to develop plate-specific standard curves (R2 Range = 97.2–99.6%). All samples, including positive and negative controls, were evaluated in duplicate. Samples with microcystin levels over 5 μg/L exceeded the range of detection and were diluted for quantification. Samples with levels below 0.10 μg/L were considered “non-detects” according to manufacturer's instructions. For statistical analyses, the “non-detects” were assigned a value of 0.05 μg/L (1/2 of the detection limit) based on information provided by the ELISA manufacturer (http://www.abraxiskits.com/uploads/products/docfiles/278_Microcystin%20PL%20ADDA%20users%20R120214.pdf, Abraxis, Warminster, PA).
Quantification of Microcystis PC-IGS and mcyB Genetic Abundance Using qPCR
Water samples (200 mL) were filtered through an Isopore™ polycarbonate membrane (0.4 μm, Millipore). Genomic DNAs on sample filters were extracted using the xanthogenate-sodium dodecyl sulfate (XS) DNA extraction method with slight modifications (Tillett and Neilan, 2000). Sample filters were incubated in 1 mL of XS buffer at 70°C for 2 h; the incubation mixture was then vortexed for 10 s and put on ice for 30 min. After centrifugation at 13,200 rpm for 15 min at 4°C, the supernatant was transferred to a new tube and mixed with an equal volume of 100% isopropanol. Subsequently, the mixture was applied to the column in the DNeasy® Blood & Tissue Kit (Qiagen, Valencia, CA) and centrifuged for 1 min at 10,000 rpm. After the sequential AW1/AW2 washing steps, DNA in the column was eluted with 100 μl of TE buffer and stored at −20°C for real-time PCR analysis.
Quantification of Microcystis PC-IGS and mcyB genetic abundance was performed on a Bio-Rad C1000 Touch Thermal Cycler (USA) with primers and probes specific for Microcystis PC-IGS and mcyB genes described previously (Kurmayer and Kutzenberger, 2003). The 5-end and 3-end of probe in the present study were labeled with the 6-carboxyfluorescein (6-FAM) reporter and the Minor Groove Binding non-fluorescent (MGB-NFQ) quencher (Life Technologies, Foster City, USA). Each PCR mixture (20 μl) contained TaqMan universal PCR master mix (10 μL) (Life Technologies, Foster City, USA); Microcystis PC-IGS-specific primers (188F/254R, 300 nM) or Microcystis mcyB -specific primers (30F/108F, 900 nM); Microcystis PC-IGS-specific TaqMan probe (100 nM) or Microcystis mcyB –specific probe (250 nM) and diluted DNA template (2 μL). The PCR profile consisted of an initial cycle of 50°C for 2 min and 95°C for 10 min, followed by 50 cycles of at 95°C for 30 s, 56°C for 1 min, and 72°C for 30 s.
Construction of standard curves to quantify Microcystis PC-IGS and mcyB genetic abundance were prepared as follows: 398-bp Microcystis PC-IGS and 470-bp Microcystis mcyB fragments were amplified from Microcystis aeruginosa NIES843 genomic DNA. The primer set specific for Microcystis PC-IGS and mcyB fragments were PCIGSseqF/PC-IGSseqR (5-TGCGCGAAACCTATGTAGC-3 and 5-GAATTGGCTTTTTCGGTC-3, respectively) and mcyB_548/mcyB_1017 (5-GGAGAATGCGGTCTTCAGAG-3 and 5-TAACCGGGGCAATCAGTTAG-3), respectively. PCR mixtures (20 μl) were prepared according to the manufacturer's instructions (DreamTaq polyermase, Thermo Scientific, USA). The PCR profiles were: one initial cycle of 95°C for 10 min; 35 cycles of at 95°C for 30 s, 55°C for 30 s, and 72°C for 1 min, and one cycle at 72°C for 10 min, which were performed on a MultiGene Thermal Cycler (Labnet, Edison, NJ, USA). After product size confirmation and purification, the amplicons of Microcystis PC-IGS and mcyB fragments were cloned into a pGEM-T vector (Promega, USA) according to the manufacturer's instructions. Subsequently, the ligation mixture was transformed into competent Escherichia coli cells using traditional heat-shocking protocol. Plasmids (pGEM-T-PCIGS and pGEM-T-mcyB) from positive transformants were isolated with Qiaprep Miniprep Kit (USA). After sequencing, the right clone of Microcystis PC-IGS and mcyB fragments were confirmed. Plasmid concentrations (copies/μl) were quantified with the Quant-iT dsDNA kit. Subsequently, a series of plasmid diluted standards, together with unknown samples, were analyzed by real-time PCR to establish standard curves.
Satellite Remote Sensing
Satellites have provided an effective means of monitoring algal blooms and satellite remote sensing has been used worldwide to estimate water quality, i.e., concentrations of chlorophyll and suspended matter (Matthews et al., 2010; Gómez et al., 2011). The National Oceanic and Atmospheric Administration (NOAA) has conducted routine monitoring of Lake Erie for cyanobacterial blooms each summer for several years. The Lake Erie Experimental HAB Bulletin at NOAA (National Center of Coastal Ocean Science) provides cyanobacterial monitoring and forecasting results based on satellite remote sensing. Before MERIS stopped sending data on April 8, 2012, the Bulletin used a Cyanobacterial Index (CI) that was calculated using the spectral shape around the 681 nm band (Stumpf et al., 2012). The spectral shape is determined as a nominal second derivative around the band of interest. After MERIS stopped its service, the Experimental HAB Bulletin began using The Moderate-resolution Imaging Spectroradiometer (MODIS) as an alternative for monitoring cyanobacterial blooms in Lake Erie. The CI by MODIS is defined as the negative of the spectral shape around 678 nm, as shown in Equation (1),
where λ = 678 nm (MODIS band 14), λ+ = 748 nm (band 15), and λ− = 667 nm (band 13). Level 2 reflectance's are used for the analysis; these are normalized water-leaving reflectance's for pixels identified as water.
The MODIS L1A data preprocessed by The National Aeronautics and Space Administration (NASA)'s Goddard Space Flight Center (GSFC) Ocean Color Science Team are available from http://oceancolor.gsfc.nasa.gov/. After downloading the data, SeaDAS (SeaWiFS Data Analysis System) version 6.4 was used to further refine the data in coastal regions. In particular, the Multi-scattering with the 2-band model selection and shortwave-infrared (SWIR) correction (Wang and Shi, 2007) was applied to convert the raw radiances in counts in the original L1A data to water-leaving reflectance above the surface. The turbid water index developed by Wang and Shi (2007) is computed prior to the atmospheric correction for the identification of the productive and/or turbid waters, where the SWIR algorithm can be operated. The Multi-scattering with 2-band model selection and SWIR correction method use the standard (NIR) algorithm in non-turbid oceans, whereas for turbid waters the products are obtained using the SWIR method. In addition, the level 2 process also produces chlorophyll-a concentrations based on OC3 algorithm expressed as Equation (2) (O'Reilly et al., 2000).
The cyanobacteria index at the study area was calculated using the model given in Equation (1). Unreliable data were excluded using level2 flags for every image, such as land mask, cloud mask, and the pixels that were contaminated by high viewing angle, sun zenith, stray light, or high-glint. To prevent potential regional irregularity in the reflectance data, the cyanobacteria index, as well as chlorophyll-a, for all pixels identified as water were spatially smoothed by a spatial box covering (shown in Figure 1) surrounding our sampling point.
Statistical Methods
Spearman's correlation was used to explore the relationship between microcystin concentrations, the abundance of Microcystis genotypes, and limnological parameters. To use statistical methods on the relationship between MODIS measurements and in situ measurements, linear interpolation was used. The time series of MODIS measurements were matched with in situ measurements and Spearman's correlation was used to investigate their relationship. Regression analysis was used to show the relationship between MODIS-retrieved chlorophyll-a with in situ measured chlorophyll-a, as well as the relationship between MODIS-retrieved chlorophyll-a with in situ-measured levels of microcystins. Microcystins levels were log transformed before regression analysis to meet the assumption of normality.
Results
Microcystis, Pigments, and Toxins
Environmental data collected from the intakes at the two water treatment plants are summarized in Table 1. The measured microcystin levels and toxic gene copy numbers in samples collected from Toledo and Painesville water plant intakes in 2013 are presented in Figure 2. Harmful algal bloom-related parameters, including chlorophyll-a, PC, PC-IGS, mcyB, and microcystins, were significantly higher in the intake water at Toledo than at Painesville from May to October in 2013 (Wilcoxon rank-sum test, P < 0.05).
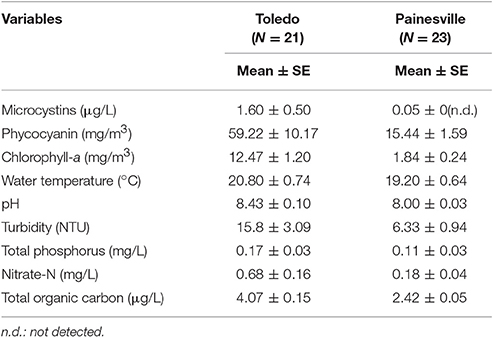
Table 1. Summary of environmental parameters at the Toledo and Painesville water plants.
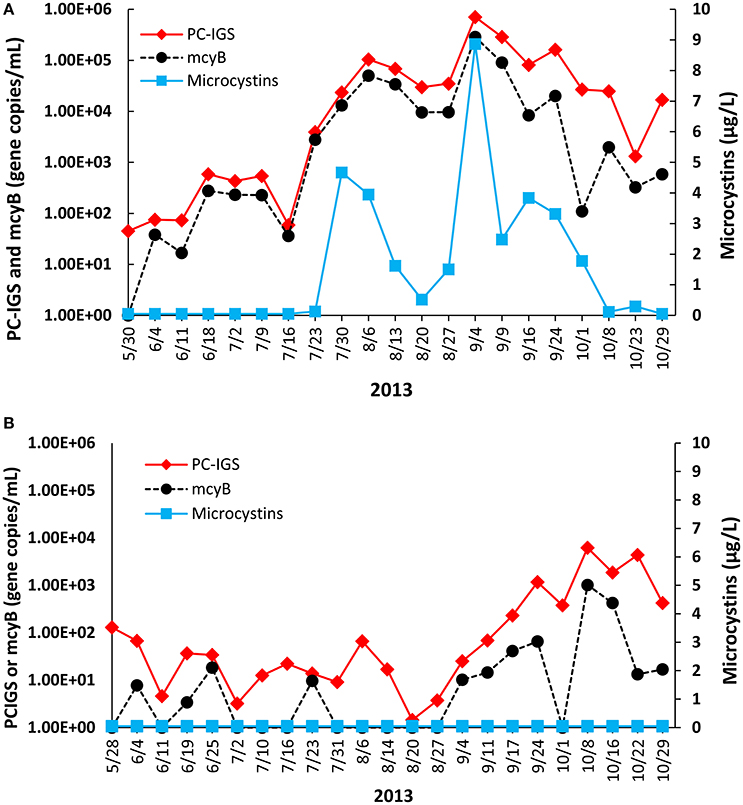
Figure 2. Temporal trends of PC-IGS, mcyB, and microcystins at (A) Toledo and (B) Painesville water plant intake points from May to October in 2013.
Time series of the qPCR results and the toxin levels are summarized in Figure 2. A detectable level of microcystins was observed from July 23 to October 23 with the maximum (8.87 μg/L) occurring on September 4 at the Toledo sampling point. However, microcystins were not detectable during our study period from the Painesville samples. The temporal trend for toxic cyanobacteria at the two locations also differed. At the Toledo water plant intake, both the PC-IGS and mcyB levels peaked in early September and showed a decreasing trend thereafter. The PC-IGS levels at the Toledo water plant intake ranged from 4.5 × 10 to 7.07 × 10⁵ gene copies/mL with the highest observed on September 4th. The mcyB levels at the Toledo intake ranged from 0 to 2.87 × 10⁵ gene copies/mL with the highest level also observed on September 4th. The correlation between PC-IGS and mcyB at the Toledo intake was especially high (Spearman's correlation coefficient is 0.914, P < 0.05). The Spearman's correlation between microcystins and mcyB was 0.823 (P < 0.05) at this location, indicating that the abundance of toxic Microcystis was an effective indicator of the toxin level. In 2013, the relative abundance of toxic Microcystis at the Toledo intake, determined by the ratio of the copy numbers of mcyB genotypes to the total Microcystis, was between 0 and 71%.
In contrast, at the Painesville water plant intake, both the PC-IGS and mcyB levels peaked in October, near the end of the study period. PC-IGS concentrations in the Painsville water plant intake ranged from 1.44 to 6.20 × 10³ gene copies/mL with the highest observed on October 13. Concentrations of mcyB at the Painesville intake ranged from 0 to 1.02 × 10³ gene copies/mL, with the highest level also observed on October 13. The correlation between PC-IGS and mcyB at the Painesville intake was high, although lower than the observation at Toledo (Spearman's correlation coefficient was 0.713, P < 0.05). At Painesville, the relative abundance of toxic Microcystis was 0 to 70%.
Relationship between Environmental Factors and HAB Related Parameters
The data for Toledo and Painesville were examined separately, so that any variations might become apparent. Correlations between microcystin concentrations, abundance of Microcystis genotypes, and limnological parameters were estimated using Spearman's correlation (Table 2). Correlations between microcystins and environmental factors were not available for Painesville data since no microcystins were detected. In Toledo, microcystins concentration yielded a positive correlation with pH, total organic carbon, and HPC. At the Toledo and Painesville sites, the total chlorophyll-a concentration was significantly correlated with Microcystis abundance (P < 0.05). Furthermore, the phycocyanin in Toledo samples showed a significant positive correlation with both microcystin levels (p = 0.437, P < 0.05) and Microcystis abundance as measured by PC-IGS (p = 0.669, P < 0.05). There was no significant correlation between water temperature and HAB-related parameters at either location. Water samples from the Toledo area had higher pH values than Painesville (Wilcoxon rank-sum test, P < 0.05) and had a significant relationship with microcytins, Microcystis abundance, and toxic Microcystis. Total organic carbon, as well as HPC, also showed a significant positive correlation with microcytins, Microcystis abundance, and toxic Microcystis in Toledo.
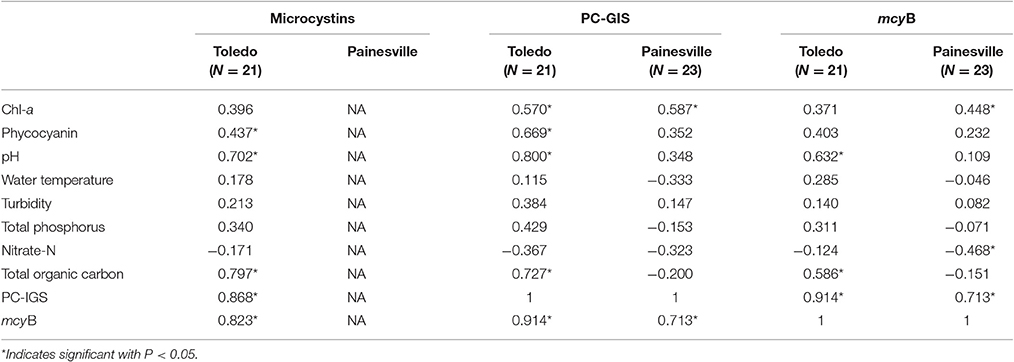
Table 2. Spearman's correlations between microcystin concentrations, the abundance of Microcystis genotypes, and limnological parameters.
Retrieval of Chlorophyll-a and CI Using Remote Sensing
Chlorophyll-a concentration was retrieved using the built-in algorithm in SeaDAS (O'Reilly et al., 2000). After masking unreliable pixels and spatial smoothing, the MODIS-retrieved chlorophyll-a concentration was obtained during the study period near the Toledo and Painesville water plant intakes. The comparison between the in situ measurement and MODIS-retrieved chlorophyll-a concentrations is shown in Figure 3. MODIS-retrieved chlorophyll-a concentrations were generally higher than our in situ measurements. The trend of chlorophyll-a and CI retrieved from MODIS matched well with our molecular measurements of PC-IGS and mcyB in Toledo. MODIS-derived CI showed significant blooms from late July to October, peaking in early September in areas near Toledo. MODIS-derived CI indicated only mild blooms near Painesville in early July, which did not match well with our molecular measurements (p < 0).
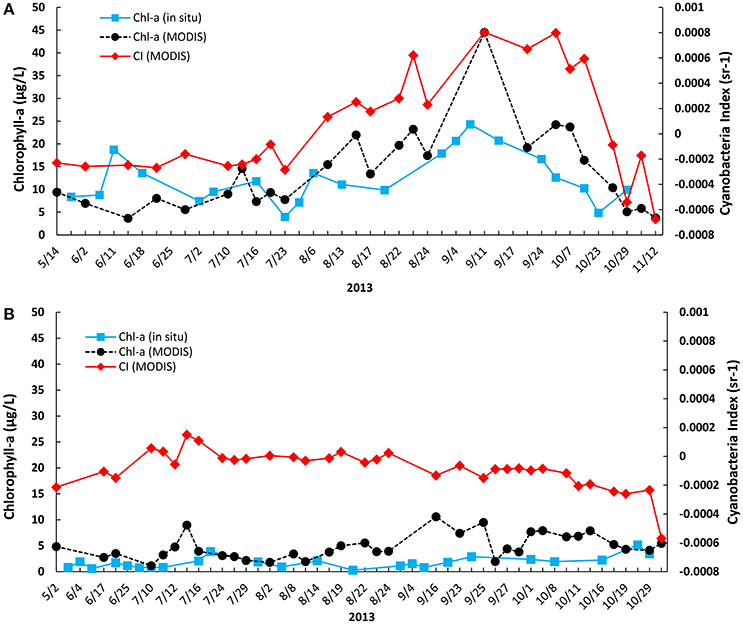
Figure 3. Temporal trends of MODIS-retrieved chlorophyll-a, cyanobacteria index, and in situ measured chlorophyll-a at Toledo and Painesville water plant intake points from May to October in 2013: (A) Toledo; (B) Painesville.
Compare MODIS-Measured Chlorophyll-a and CI with In situ HAB-Related Measurements
The time series of MODIS-measured HAB indicators, such as chlorophyll-a and CI, did not match well with the time series of our in situ measurements in part due to the cloud coverage. In order to conduct statistically meaningful comparisons, linear interpolation was used to obtain the time series of MODIS measurements, and match them to the in situ measurements.
In situ-measured chlorophyll-a showed a statistically significant relationship with the MODIS-measured concentration of chlorophyll-a (R2 = 0.5319, P < 0.05) at the Toledo sampling point (Figure 4). However, the relationship was not significant for observations at Painesville, where the in situ chlorophyll-a concentrations were much lower than those from Toledo, suggesting that the match between MODIS- and in situ-measured chlorophyll-a was more reliable in areas with higher chlorophyll-a concentrations.
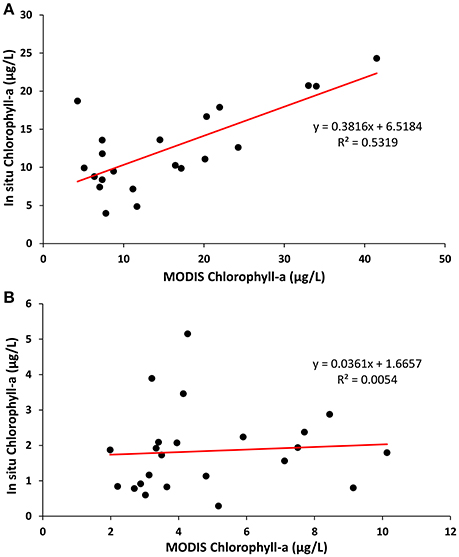
Figure 4. Scatter plots showing the relationship between MODIS-retrieved chlorophyll-a with in situ measured chlorophyll-a at (A) Toledo and (B) Painesville water plant intake points from May to October, 2013. The solid lines represent the best-fit linear regression models.
Spearman's correlation between MODIS measurements and in situ-measured HAB parameters, shown in Table 3, also showed that both MODIS-derived chlorophyll-a and CI correlated well with all HAB parameters, including levels of microcystins, mcyB, PC-IGS, phycocyanin, and chlorophyll-a (p range from 0.508 to 0.853, P < 0.05) at Toledo and that it was possible to estimate the levels of microcystins from the MODIS-measured concentrations of chlorophyll-a (Figure 5, log (microcystins) = 0.0637*MODIS chlorophyll-a −1.4065, R2 = 0.6178). In contrast, MODIS-measured chlorophyll-a showed significant correlations with concentrations of PC-IGS and mcyB, but not with concentrations of pigment at Painesville (Table 3). MODIS- measured CI even showed some negative correlations with in situ-measured HAB parameters at Painesville (Table 3), indicating that CI from MODIS did not perform well when cyanobacterial bloom levels were relatively low. When considering the entire lake data set from Lake Erie, MODIS-retrieved chlorophyll-a also showed significant positive correlations with all HAB parameters (P < 0.05), but CI from MODIS had significant correlations with only the level of microcystins (Table 3). Good correlations between MODIS-retrieved chlorophyll-a and HAB-related parameters (Table 3) suggested that MODIS-retrieved chlorophyll-a can be used as a good indicator for Microcystis blooms in Lake Erie.
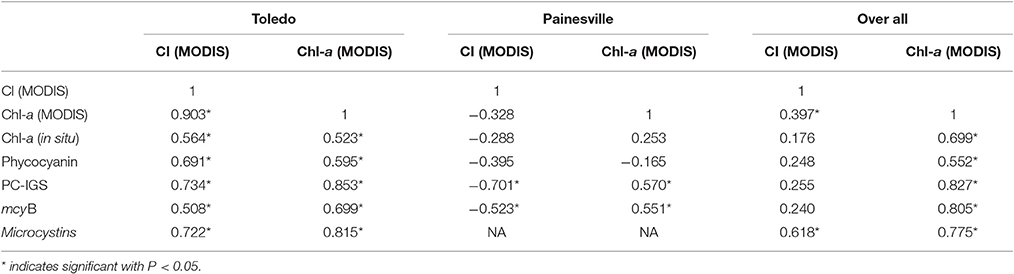
Table 3. Spearman correlation between MODIS measurements and in situ measurements at Toledo (last in situ observation excluded) and Painesville water intake points.
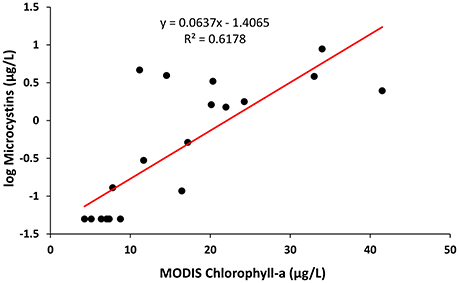
Figure 5. Scatter plot showing the relationship between MODIS-retrieved chlorophyll-a with in situ-measured levels of Microcystins (log transformed) at Toledo water plant intake points from May to October, 2013. The solid lines represent the best-fit linear regression model.
Discussion
Although chlorophyll-a is a universal pigment in phytoplankton, it can still be used as an indicator for cyanobacterial blooms in locations, such as western Lake Erie, where cyanobacteria are known to dominate (Stumpf et al., 2016). Both the chlorophyll-a algorithm and the Cyanobacteria Index (CI) have demonstrated their usefulness and are good indicators of the toxin level in western Lake Erie. However, chlorophyll-a outperformed CI in this study by showing higher correlations with Microcystis abundance and microcystin levels in both western Lake Erie and the entire lake data set. For MODIS CI, the threshold for indicating the presence of a bloom is suggested as above zero (Wynne et al., 2013). Based on the CI, the Toledo area was covered by blooms from August to October, peaking in early September, during which the toxin levels were relatively high. However, no in situ measurements, such as microcystins or Microcystis abundance, were high at Painesville, although the CI was marginally above the zero level in late July, 2013. For MODIS-retrieved chlorophyll-a, a reasonable threshold is 10 μg/L, which is suggested as an indicator of moderate risk associated with a dominant cyanobacterial bloom. Judging by this threshold, the lake area around Toledo was consistently covered by blooms from August to October that matched the period when microcystin levels were detectable. At Painesville, the chlorophyll-a concentration, as determined with MODIS, only went above 10 μg/L on one occasion (September). If we use 10 μg/L as a threshold for MODIS chlorophyll-a, the sensitivity of detecting a microcystins level higher than 1 μg/L is 100%, with a 75%specificityfor the Toledo location. If we include both Toledo and Painesville, sensitivity remains 100%, but specificity is increased to 88.6%. If zero is used as a threshold for MODIS CI, the sensitivity of detecting a microcystins level higher than 1 μg/L is 88.9%, with a specificity of 75% for Toledo. Including both Toledo and Painesville, the sensitivity remains 88.9%, while specificity becomes 82.9%. We chose to set the threshold at 1 μg/L microcystins since it is considered by the World Health Organization (WHO) to be the drinking water guideline. Even though levels of microcystins in finished water will be lowered following water treatment methods, a 1 μg/L threshold was chosen as a conservative measure.
One notable observation is that our water samples were taken from below the surface of the lake, while satellite observations were obtained from the surface of the lake. This could be a possible explanation for fact that MODIS-retrieved chlorophyll-a concentrations were generally higher than our in situ measurements. Although the western part of Lake Erie is shallow, it is likely that Microcystis were still more abundant near the surface. Differences in concentrations of chlorophyll-a, retrieved by MODIS, and our in situ measurements may have been due to a higher abundance of Microcystis near the surface. However, the excellent correlations between MODIS-retrieved chlorophyll-a and HAB-related parameters indicate that satellite observations are useful for monitoring cyanobacterial blooms and toxins for the whole water column in western Lake Erie, possibly due to the shallowness of the water. Based on the above observations, remote sensing can be a feasible means of tracking bloom-associated health risks for lake water below the surface, which is commonly used as a source for drinking water. However, high correlation between microcystins and MODIS-based indicators was only observed in one site where cyanobacteria blooms were severe. In addition, it has been reported that there is a challenge for directly detecting cyanotoxins based on remote sensing data, due to the variability in the relationship between the pigments (e.g., chlorophyll-a and PC) and toxins, and a lack of standardized measurement methods (Stumpf et al., 2016). Therefore, more studies are needed, especially site-specific studies, to validate toxin levels with multiple locations and longer period of time.
In summary, vorh Microcystis and toxic Microcystis strains were observed in both western and central Lake Erie with western Lake Erie having more serious Microcystis blooms. The Microcystis bloom masses in the past decade have been observed in the western basin (Brittain et al., 2000; Rinta-Kanto et al., 2003, 2009). Our observations also support previous studies (Rinta-Kanto et al., 2003; Michalak et al., 2013), which have shown that western Lake Erie experienced more Microcystis blooms than central Lake Erie. During the summer, the raw water at the Toledo water plant contained microcystins at a level higher than the World Health Organization (WHO) drinking water guidelines of 1 μg/L, leading to expensive additional water treatment processes to ensure the removal of microcystins. Although neither the Toledo nor the Painesville water plant had reported levels of microcystins over 1 μg/L in finished water, Carroll Township (also draws water from western Lake Erie) issued a warning on September 5, 2013 because microcystins were detected in the finished water (3.56 μg/L) during the time that our Toledo observations showed a peak of Microcystis blooms (Figure 2).
Toxic Microcystis blooms are a threat to human health mainly due to their production of toxins. Therefore, a rapid monitoring method is needed to provide an indication of toxin levels; such a method is important to protect public health from both recreational and drinking water exposure. The Environmental Protection Agency (EPA) does not require regular monitoring of microcystins in drinking water, but several public water systems near western Lake Erie, including Toledo and Carroll Township, have been performing voluntary weekly monitoring for microcystins (Henry, 2013). However, weekly toxin monitoring may not be sufficient during bloom periods and could potentially miss some days with high toxin levels. A reliable and rapid monitoring method could provide information for water plants drawing water from bloom covered lakes to allow them to adjust their monitoring frequency and treatment strategies to immediately remove toxins. Remote sensing methods could be used as an aid to assess risk to human health by measuring concentrations of chlorophyll-a and CI, which are indicative of potential microcystin levels in high bloom areas. MODIS is one such system, providing a practical and useful method for routine screening, and monitoring of potential Microcystis blooms (images are available twice daily from Aqua and Terra). However, more studies are needed to assess the potential of using remote sensing as a means of tracking cyanotoxins in addition to in situ validation in multiple locations, since other toxin-producing cyanobacteria may behave differently from Microcystis, especially under different nitrogen and phosphorus conditions (Gobler et al., 2016), and are likely to have different characteristics, including toxin production.
Conclusions
• Water from drinking intake showed that western Lake Erie cyanobacterial blooms prevailed from late July to early October in 2013, whereas the bloom was less prevalent in central Lake Erie.
• MODIS-based cyanobacteria indicators included chlorophyll-a and Cyanobacteria Index. Both worked well in western Lake Erie for detecting blooms and both showed good correlations with Microcystis abundance, toxic Microcystis abundance, and microcystin levels.
• In central Lake Erie, where blooms are mild, levels of MODIS-retrieved chlorophyll-a correlated well with abundance of both Microcystis and toxic Microcystis, while the MODIS-retrieved Cyanobacteria Index failed to show any correlation.
• Overall, MODIS-retrieved chlorophyll-a performed better than MODIS-retrieved Cyanobacteria Index for monitoring Microcystis blooms and microcystin levels in water intake in Lake Erie region.
• Satellite-based monitoring for cyanobacterial blooms has a great potential as a complimentary tool for protection of public health around Lake Erie and similar water bodies.
Author Contributions
JL conceived the research. FZ analyzed the data and carried out statistical analyses. CH conducted qPCR experiments. FZ, JL, CS, and SL contributed to the manuscript and all authors approved it.
Funding
This study is supported by grant (RD835192010) from USEPA Science to Achieve Results (STAR).
Conflict of Interest Statement
The authors declare that the research was conducted in the absence of any commercial or financial relationships that could be construed as a potential conflict of interest.
Acknowledgments
The authors are deeply grateful to the Toledo water treatment plant, Painesville water treatment plant, Brenda Snyer, and Trevor Weaver for providing water samples. We also thank Dr. Kuo-Hsin Tseng for his advice in satellite remote sensing, Seungjun Lee for his help in generating figures, and Dr. Bruce Casto and Igor Mrdjen for editing the manuscript.
References
Associated Press (2013). Algae Blooms in Lake Erie becoming a Threat to Drinking Water. Cleveland, OH: Associated Press.
Becker, R. H., Sultan, M. I., Boyer, G. L., Twiss, M. R., and Konopko, E. (2009). Mapping cyanobacterial blooms in the great lakes using MODIS. J. Great Lakes Res. 35, 447–453. doi: 10.1016/j.jglr.2009.05.007
Brittain, S. M., Wang, J., Babcock-Jackson, L., Carmichael, W. W., Rinehart, K. L., and Culver, D. A. (2000). Isolation and characterization of microcystins, cyclic heptapeptide hepatotoxins from a lake erie strain of Microcystis aeruginosa. J. Great Lakes Res. 26, 241–249. doi: 10.1016/S0380-1330(00)70690-3
Codd, G. A., Bell, S. G., Kaya, K., Ward, C. J., Beattie, K. A., and Metcalf, J. S. (1999). Cyanobacterial toxins, exposure routes and human health. Eur. J. Phycol. 34 405–415. doi: 10.1080/09670269910001736462
Codd, G. A., Morrison, L. F., and Metcalf, J. S. (2005). Cyanobacterial toxins: risk management for health protection. Toxicol. Appl. Pharmacol. 203, 264–272. doi: 10.1016/j.taap.2004.02.016
de Figueiredo, D. R., Azeiteiro, U. M., Esteves, S. M., Goncalves, F. J., and Pereira, M. J. (2004). Microcystin-producing blooms — a serious global public health issue. Ecotoxicol. Environ. Saf. 59, 151–163. doi: 10.1016/j.ecoenv.2004.04.006
Environmental Protection Agency (2004). Lake Erie Lakewide Management Plan. Environmental Protection Agency.
Gobler, C. J., Burkholder, J. M., Davis, T. W., Harke, M. J., Johengen, T., Stow, C. A., et al. (2016). The dual role of nitrogen supply in controlling the growth and toxicity of cyanobacterial blooms. Harmful Algae 54, 87–97. doi: 10.1016/j.hal.2016.01.010
Gómez, J. A., Alonso, C. A., and García, A. A. (2011). Remote sensing as a tool for monitoring water quality parameters for mediterranean lakes of european union water framework directive (WFD) and as a system of surveillance of cyanobacterial harmful algae blooms (SCyanoHABs). Environ. Monit. Assess. 181, 317–334. doi: 10.1007/s10661-010-1831-7
Harke, M. J., Steffen, M. M., Gobler, C. J., Otten, T. G., Wilhelm, S. W., Wood, S. A., et al. (2016). A review of the global ecology, genomics, and biogeography of the toxic cyanobacterium, Microcystis spp. Harmful Algae 54, 4–20. doi: 10.1016/j.hal.2015.12.007
Henry, T. (2013). Carroll Township's Scare with Toxin a 'Wake-Up Call' Water Plant Shut Over Lethal Microcystin from Algae. Toledo, OH: The Toledo Blade
Hunter, P. D., Tyler, A. N., Carvalho, L., Codd, G. A., and Maberly, S. C. (2010). Hyperspectral remote sensing of cyanobacterial pigments as indicators for cell populations and toxins in eutrophic lakes. Remote Sens. Environ. 114, 2705–2718. doi: 10.1016/j.rse.2010.06.006
Kurmayer, R., and Kutzenberger, T. (2003). Application of real-time PCR for quantification of microcystin genotypes in a population of the toxic cyanobacterium Microcystis sp. Appl. Environ. Microbiol. 69, 6723–6730. doi: 10.1128/AEM.69.11.6723-6730.2003
Kutser, T. (2004). Quantitative detection of chlorophyll in cyanobacterial blooms by satellite remote sensing. Limnol. Oceanogr. 49, 2179–2189. doi: 10.4319/lo.2004.49.6.2179
Li, Y., Chen, J. A., Zhao, Q., Pu, C. W., Qiu, Z. Q., Zhang, R. P., et al. (2011). A cross-sectional investigation of chronic exposure to microcystin in relationship to childhood liver damage in the three gorges reservoir region, china. Environ. Health Perspect. 119, 1483–1488. doi: 10.1289/ehp.1002412
Marion, J. W., Lee, J., Wilkins, J. R. III., Lemeshow, S., Lee, C., Waletzko, E. J., et al. (2012). In vivo phycocyanin flourometry as a potential rapid screening tool for predicting elevated microcystin concentrations at eutrophic lakes. Environ. Sci. Technol. 46, 4523–4531. doi: 10.1021/es203962u
Matthews, M. W., Bernard, S., and Wintera, K. (2010). Remote sensing of cyanobacteria-dominant algal blooms and water quality parameters in zeekoevlei, a small hypertrophic lake, using meris. Remote Sens. Environ. 114, 2070–2087. doi: 10.1016/j.rse.2010.04.013
Michalak, A. M., Anderson, E. J., Beletsky, D., Boland, S., Bosch, N. S., Bridgeman, T. B., et al. (2013). Record-setting algal bloom in lake erie caused by agricultural and meteorological trends consistent with expected future conditions. Proc. Natl. Acad. Sci. U.S.A. 110, 6448–6452. doi: 10.1073/pnas.1216006110
O'Neil, J. M., Davis, T. W., Burford, M. A., and Gobler, C. J. (2012). The rise of harmful cyanobacteria blooms: the potential roles of eutrophication and climate change. Harmful Algae 14, 313–334. doi: 10.1016/j.hal.2011.10.027
O'Reilly, J. E., Maritorena, S., Siegel, D., O'Brien, M., Toole, D., Greg Mitchell, B., et al. (2000). “Ocean color chlorophyll a algorithms for seawifs, oc2, and oc4: Version 4,” in Seawifs Postlaunch Calibration and Validation Analyses, Part 3. Nasa Tech. Memo. ed J. E. O'Reilly (Greenbelt, MD: NASA Goddard Space Flight Center), 9–23.
Paerl, H. W., Hall, N. S., and Calandrino, E. S. (2011). Controlling harmful cyanobacterial blooms in a world experiencing anthropogenic and climatic-induced change. Sci. Total Environ. 409, 1739–1745. doi: 10.1016/j.scitotenv.2011.02.001
Pelaez, M., Antoniou, M. G., He, X. X., Dionysiou, D. D., de la Cruz, A. A., Tsimeli, K., et al. (2010). Sources and occurrence of cyanotoxins worldwide. Environ. Pollut. 16, 101–127. doi: 10.1007/978-90-481-3509-7_6
Rinta-Kanto, J. M., Konopko, E. A., DeBruyn, J. M., Bourbonniere, R. A., Boyer, G. L., and Wilhelm, S. W. (2009). Lake erie Microcystis: relationship between microcystin production, dynamics of genotypes and environmental parameters in a large lake. Harmful Algae 8, 665–673. doi: 10.1016/j.hal.2008.12.004
Rinta-Kanto, J. M., Ouellette, A. J., Boyer, G. L., Twiss, M. R., Bridgeman, T. B., and Wilhelm, S. W. (2003). Quantification of toxic Microcystis spp. During the and 2004 blooms in western lake erie using quantitative real-time PCR. Environ. Sci. Technol. 39, 4198–4205. doi: 10.1021/es048249u
Simis, S. G. H., Peters, S. W. M., and Gons, H. J. (2005). Remote sensing of the cyanobacterial pigment phycocyanin in turbid inland water. Limnol. Oceanogr. 50, 237–245. doi: 10.4319/lo.2005.50.1.0237
Sinclair, J. L., and Hall, S. (2008). Occurrence of cyanobacterial harmful algal blooms workgroup report. Adv. Exp. Med. Biol. 619, 45–103. doi: 10.1007/978-0-387-75865-7_3
Siswanto, E., Ishizaka, J., Tripathy, S. C., and Miyanura, K. (2013). Detection of harmful algal blooms of Karenia mikimotoi using MODIS measurements: a case study of seto-inland sea, Japan. Remote Sens. Environ. 129, 185–196. doi: 10.1016/j.rse.2012.11.003
Steffensen, D. A. (2008). Economic cost of cyanobacterial blooms. Adv. Exp. Med. Biol. 619, 855–865. doi: 10.1007/978-0-387-75865-7_37
Stumpf, R. P., Davis, T. W., Wynne, T. T., Graham, J. L., Loftin, K. A., Johengen, T. H., et al. (2016). Challenges for mapping cyanotoxin patterns from remote sensing of cyanobacteria. Harmful Algae 54, 160–173. doi: 10.1016/j.hal.2016.01.005
Stumpf, R. P., Tomlinson, M. C., Calkins, J. A., Kirkpatrick, B., Fisher, K., Nierenberg, K., et al. (2009). Skill assessment for an operational algal bloom forecast system. J. Mar. Syst. 76, 151–161. doi: 10.1016/j.jmarsys.2008.05.016
Stumpf, R. P., Wynne, T. T., Baker, D. B., and Fahnenstiel, G. L. (2012). Interannual variability of cyanobacterial blooms in Lake Erie. PLoS ONE 7:e42444. doi: 10.1371/journal.pone.0042444
Tillett, D., and Neilan, B. A. (2000). Xanthogenate nucleic acid isolation from cultured and environmental cyanobacteria. J. Phycol. 36, 251–258. doi: 10.1046/j.1529-8817.2000.99079.x
Vincent, R. K., Qin, X. M., McKay, R. M. L., Miner, J., Czajkowski, K., Savino, J., et al. (2004). Phycocyanin detection from LANDSAT TM data for mapping cyanobacterial blooms in lake erie. Remote Sens. Environ. 89, 381–392. doi: 10.1016/j.rse.2003.10.014
Wang, M., and Shi, W. (2007). The NIR-SWIR combined atmospheric correction approach for MODIS ocean color data processing. Opt. Express 15, 15722–15733. doi: 10.1364/OE.15.015722
Keywords: cyanobacteria, MODIS, Lake Erie, Microcystis, drinking water source
Citation: Zhang F, Hu C, Shum CK, Liang S and Lee J (2017) Satellite Remote Sensing of Drinking Water Intakes in Lake Erie for Cyanobacteria Population Using Two MODIS-Based Indicators as a Potential Tool for Toxin Tracking. Front. Mar. Sci. 4:124. doi: 10.3389/fmars.2017.00124
Received: 01 February 2017; Accepted: 18 April 2017;
Published: 08 May 2017.
Edited by:
Ruhul Amin, bioOptoSense, USAReviewed by:
Luke Thompson, Southwest Fisheries Science Center (NOAA), USAThomas Rohrlack, Norwegian University of Life Sciences, Norway
Joanna Dorota Mankiewicz-Boczek, European Regional Centre for Ecohydrology (PAS) and University of Lodz, Poland
Copyright © 2017 Zhang, Hu, Shum, Liang and Lee. This is an open-access article distributed under the terms of the Creative Commons Attribution License (CC BY). The use, distribution or reproduction in other forums is permitted, provided the original author(s) or licensor are credited and that the original publication in this journal is cited, in accordance with accepted academic practice. No use, distribution or reproduction is permitted which does not comply with these terms.
*Correspondence: Jiyoung Lee, bGVlLjM1OThAb3N1LmVkdQ==