 Lisa Brase
 Hermann W. Bange
 Ralf Lendt
 Tina Sanders
 Kirstin Dähnke
- 1Biogeochemistry, Helmholtz Center Geesthacht, Institute for Coastal Research, Geesthacht, Germany
- 2Biogeochemistry and Marine Chemistry, Institute of Geology, University of Hamburg, Hamburg, Germany
- 3Marine Biogeochemistry, GEOMAR Helmholtz Centre for Ocean Research Kiel, Kiel, Germany
Nitrous oxide (N2O) is one of the most important greenhouse gases and a major sink for stratospheric ozone. Estuaries are sites of intense biological production and N2O emissions. We aimed to identify hot spots of N2O production and potential pathways contributing to N2O concentrations in the surface water of the tidal Elbe estuary. During two research cruises in April and June 2015, surface water N2O concentrations were measured along the salinity gradient of the Elbe estuary by using a laser-based on-line analyzer coupled to an equilibrator. Based on these high-resolution N2O profiles, N2O saturations, and fluxes across the surface water/atmosphere interface were calculated. Additional measurements of DIN concentrations, oxygen concentration, and salinity were performed. Highest N2O concentrations were determined in the Hamburg port region reaching maximum values of 32.3 nM in April 2015 and 52.2 nM in June 2015. These results identify the Hamburg port region as a significant hot spot of N2O production, where linear correlations of AOU-N2Oxs indicate nitrification as an important contributor to N2O production in the freshwater part. However, in the region with lowest oxygen saturation, sediment denitrification obviously affected water column N2O saturation. The average N2O saturation over the entire estuary was 201% (SD: ±94%), with an average estuarine N2O flux density of 48 μmol m−2 d−1 and an overall emission of 0.18 Gg N2O y−1. In comparison to previous studies, our data indicate that N2O production pathways over the whole estuarine freshwater part have changed from predominant denitrification in the 1980s toward significant production from nitrification in the present estuary. Despite a significant reduction in N2O saturation compared to the 1980s, N2O concentrations nowadays remain on a high level, comparable to the mid-90s, although a steady decrease of DIN inputs occurred over the last decades. Hence, the Elbe estuary still remains an important source of N2O to the atmosphere.
Introduction
Nitrous oxide (N2O) is one of the most important atmospheric greenhouse gases (IPCC, 2013) and a major precursor for stratospheric ozone depletion (Crutzen, 1970; WMO, 2014). At present, the global average atmospheric dry mole fraction of N2O is ~324 ppb, with an annual growth rate of ~0.25% (IPCC, 2013). N2O is predominantly released via microbial processes, such as nitrification (oxidation of ammonium to nitrate) and denitrification (reduction of nitrate to dinitrogen, N2). Both processes occur in soils, sediments, or water bodies, and release in total ~10–12 Tg N2O-N per year (Davidson and Kanter, 2014). During the first step of nitrification (i.e., the oxidation of ammonium to nitrite via hydroxylamine), N2O can be produced as a side product of hydroxylamine oxidation (Ritchie and Nicholas, 1972; Poughon et al., 2001). During denitrification, N2O is an obligate intermediate that can be further reduced to N2 (Knowles, 1982).
However, the yield of N2O production during nitrification and denitrification strongly depends on the prevailing oxygen (O2) concentrations, which is especially relevant in aquatic systems: Hypoxic to anoxic conditions lead to high N2O production by both nitrification and denitrification, whereas N2O is consumed by denitrification under anoxic conditions (Bakker et al., 2014). Coastal regions receive inputs of nitrogen (N) that fuel both nitrification and denitrification. Moreover, eutrophication via N inputs also promotes hypoxia or anoxia (Howarth et al., 2011) which, in turn, may lead to additional N2O production (see e.g., Naqvi et al., 2010). In line with this, estuaries are known to release high amounts of N2O from nitrification and/or denitrification (e.g., Bange, 2006; Barnes and Upstill-Goddard, 2011; Murray et al., 2015).
The Elbe estuary has undergone a long history of eutrophication and remediation and was highly polluted until the 1990s. Since then, ecological conditions in the Elbe estuary have improved significantly due to a better management of municipal and industrial sewage and an overall reduction of pollution (Adams et al., 2001; Langhammer, 2010). As a consequence, the O2 regime improved and O2 concentrations rarely decrease below 2 mg L−1 (62.5 μM), which comes along with a decrease of ammonium and nitrate concentrations in the Elbe (Amann et al., 2012).
In an early study from the late 1980s, Hanke and Knauth (1990) found N2O saturations of up to 1,600% in the Elbe estuary which they attributed mostly to denitrification in the port region and its sediments. In a follow-up study by the BIOGEST project in the 1990s, N2O saturations of <400% were reported (data from J. Middelburg published in Barnes and Upstill-Goddard, 2011).
Here we present the results of high-resolution measurements of dissolved N2O along the Elbe estuary in April and June 2015. This study was performed in order (i) to decipher the N2O distribution and its saturations along the transect and (ii) to identify hot spots of N2O production and potential N2O production pathways in the Elbe estuary. Moreover, we compare our results with those of previous studies (iii) to elucidate how management measures that changed the ecological conditions of the Elbe estuary over the past 20 years have affected N2O pathways and emissions.
Methods
Study Site
The Elbe River runs from the Czech Republic through Germany and discharges into the German Bight/North Sea. Its catchment area of about 148.300 km2 is inhabited by nearly 25 million people (Simon, 2005). The Elbe estuary extends over ~140 km, from a weir at stream km 586 that separates the tidal estuary from the river, through the Port of Hamburg to the port of Cuxhaven (stream km 730), where the estuary opens into the German Bight. The salinity gradient starts around stream km 670. The estuary is well mixed (Middelburg and Herman, 2007) and with an annual load of 2.9 kt P and 88 kt N (mostly as nitrate), it is the largest nutrient source to the German Bight (RBC Elbe, 2010). From the Port of Hamburg (~ stream km 620) to the German Bight, the estuary has an average water depth of >10 m and ~15 m in the navigational route and it is heavily dredged on a regular basis to ensure access for large container ships to the port (Schöl et al., 2014).
Transect Sampling
Samples were taken during two research cruises with the research vessel Ludwig Prandtl during 28/29 April 2015 and 9–11 June 2015. All sampling and on-line measurements were done during ebb tide to ensure comparable current and mixing conditions. Transects and locations of sampling stations were similar in April and June (Figure 1), but sampling started further downstream (stream km 626) in April compared to June (stream km 609). Distinct samples for nutrient analyses were taken at 16 stations in April 2015 and at 20 stations in June 2015.
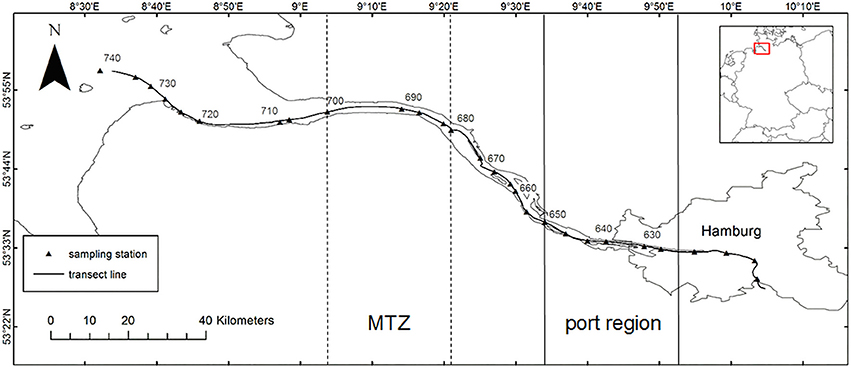
Figure 1. The Elbe estuary with river stream km, transect line (black line) and stations for distinct sampling (triangles); MTZ, maximum turbidity zone.
The ship's membrane pump continuously pumped water from 2 m water depth and supplied a Ferry-Box system (Petersen et al., 2003) and the equilibrator of the N2O measurement system with a continuous flow rate of 1 L min−1. Additionally, discrete samples for nutrient analysis were taken from a separate outlet of the ship's pump. O2 concentration (μM), O2 saturation (%), salinity, and temperature (°C) data were recorded with the Ferry-Box system.
Nutrient Measurements
Water samples for nutrient analyses were filtered immediately (GFF, 0.45 μm), and stored frozen (−18°C) for later analyses in the shore-based laboratory. Dissolved nitrate, nitrite and ammonium concentrations were measured with a continuous flow auto analyzer (AA3, SEAL Analytical) using standard colorimetric techniques (Hansen and Koroleff, 2007).
Equilibrator Based N2O Measurements and Calculations
An N2O analyzer (Model 914-0022, Los Gatos Res. Inc., San Jose, CA, USA) was used to measure gas phase mole fractions of N2O, as well as water vapor (H2O), using off-axis integrated cavity output spectroscopy (OA-ICOS; Baer et al., 2002).
The N2O analyzer was connected to a seawater/gas equilibrator which is described in detail by Körtzinger et al. (1996).
Comparable setups show a very good agreement with discrete measurements of dissolved CH4 and N2O using traditional gas chromatographic system (Gülzow et al., 2011; Arévalo-Martínez et al., 2013) and have been successfully deployed during various campaigns to the Atlantic and Pacific Oceans and the Baltic Sea (Gülzow et al., 2013; Grefe and Kaiser, 2014; Arévalo-Martínez et al., 2015, 2017).
The general principle of dynamic equilibration systems is based on a continuous flow of water passing through an equilibration chamber which is open to the atmosphere. This allows equilibration at ambient pressure at any time of the measurements. The continuous re-circulation of a fixed volume of headspace air ensures a permanent equilibrium with the constantly renewed water phase. For a quick equilibration, water is dripped down along the glass tube of the headspace in combination with a “shower head and laminary flow” to enlarge the surface sample gas to water ratio (Körtzinger et al., 1996). The gas stream from the headspace was dried in a Nafion® tube embedded in silica gel beads before it reached the inlet of the analyzer (Figure 2). The equilibration time of N2O for the equilibrator applied in our study was determined to 7 min (according to Gülzow et al., 2011) and was taken into account for data processing.
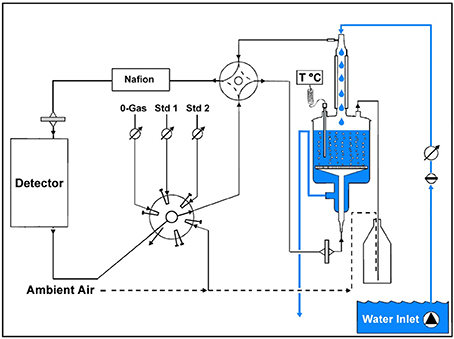
Figure 2. Scheme of the N2O measurement system.
The N2O analyzer covers a N2O mole fraction range from 300 to 100 ppm. Its internal precision is ±0.2 ppb for N2O (1σ, 100 s integration time, N2O > 300 ppb). Furthermore, the instrument's software uses the parallel measured water vapor to calculate N2O dry mole fractions. Laboratory dilution experiments covering a N2O mole fraction range from 300 to 5 ppm showed an analytical precision of gas phase measurement of N2O from ±0.2 ppb (at 300 ppb N2O) to ±3 ppb (at 5 ppm N2O) which corresponds to an overall precision of ±0.06–0.07%.
For validation of the N2O measurements, standard gas mixtures of N2O in synthetic air (Standard 1: 312.9 ppb N2O and Standard 9: 573.8 ppb N2O, prepared by Deuste Steininger GmbH, Mühlhausen, Germany) were measured regularly during the campaigns. In addition, a bottle of pressurized air (337 ppb N2O) in the lab was used for on-site calibration of the system. Standard measurements had a precision of 0.5 ppb and an accuracy of 0.9 ppb. During our transect measurements, no drift was detected, and thus, no drift correction was performed.
For further data analyses, we calculated 1 min averages of N2O dry mole fractions (ppb). The dry mole fractions were measured from the recirculating the headspace air of the equilibrator, and N2O water concentrations (N2Ocw; SD: ± 0.15 nM) were calculated from these, using the Bunsen solubility function of Weiss and Price (1980) and taking into account temperature differences between sample inlet and equilibrator (Rhee et al., 2009). N2O saturations (s) were calculated as shown in Equation (1), based on N2Ocw and atmospheric N2O (N2Oair).
Atmospheric N2O was determined in regular measurements along the two transects. The average atmospheric N2O dry mole fractions were 331 ppb (SD: ±0.5 ppb) in April 2015 and 325 ppb (SD: ±0.8 ppb) in June 2015. The comparably high mean N2O mole fraction in April was most probably resulting from agricultural activities such as manure-and N-fertilization (Lampe et al., 2003; Hellebrand et al., 2008). Computations of 48 h air mass backward trajectories (data not shown) imply that the measured air masses originated from the agricultural regions of western Germany, the Netherlands and Belgium.
The gas transfer coefficient (k) (Equation 2), expressed in m d−1, was calculated based on Borges et al. (2004) using the average wind speed at 10 m height above water surface (u10 = 7.41 ± 2.26 m s−1 in April, u10 = 5.05 ± 1.31 m s−1 in June) and the Schmidt number (Sc), which is the ratio of the kinematic viscosity of water (Siedler and Peters, 1986) to the diffusivity of N2O in water (Rhee, 2000). Air-sea flux densities (f in μmol m−2 d−1; Equation 3) were calculated according to Equation (3):
Results
Transect Measurements
Based on the N2O concentration peaks, as well as on the lowest O2 concentrations found between km 620 and 650, we in the following refer to this region of the Elbe estuary as the Hamburg port region. Its upper boundary coincides with the intensely dredged deep water section (>10 m, navigational route: ~15 m) of the Port of Hamburg (Schöl et al., 2014).
N2O and O2 Concentrations
In general, N2O and O2 concentrations were inversely correlated (Figure 3A). N2O was low in the upstream part of the transect (only sampled in June 2015), rose further downstream and peaked in the Hamburg port region, with maximum values of 32.3 and 52.2 nM in April and June, respectively. N2O concentrations then decreased and remained relatively constant between stream km 650 and 700 with average values of 18.6 ± 0.5 nM in April and 18.2 ± 1.9 nM in June. In the Elbe mouth, the N2O concentrations decreased with increasing salinity to a final concentration of ~10 nM N2O in April and June, which is near the equilibrium concentration calculated for dissolved N2O in water based on the measured N2O atmospheric mole fractions.
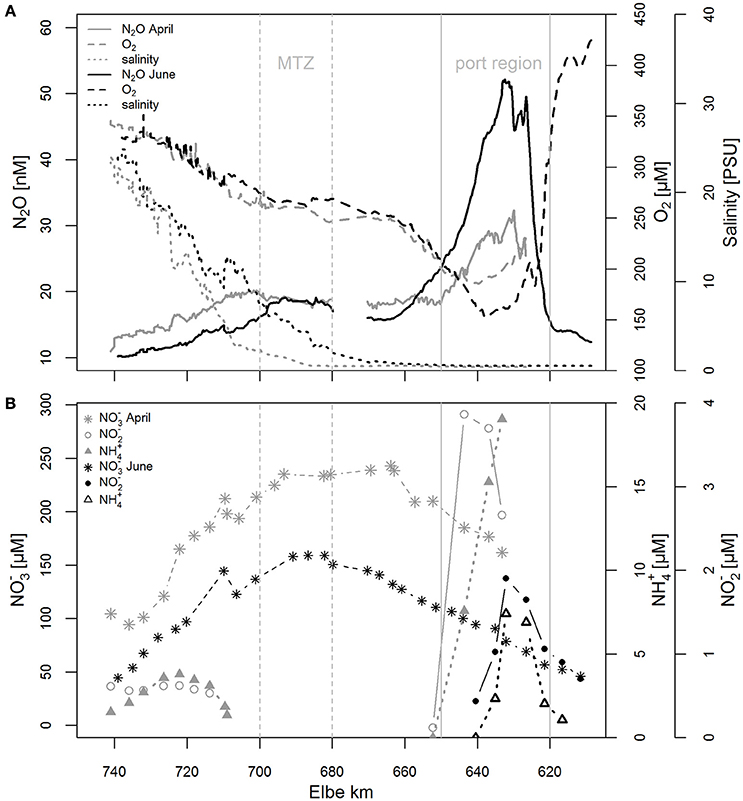
Figure 3. Transect measurements in April 2015 and June 2015 from Elbe stream km 609 to 745. (A) Continuous measurements of N2O, O2 and salinity, (B) Concentrations of DIN: , , and ; vertical lines indicate the Hamburg port region according to Figure 1, the dashed line localized the area of the MTZ.
Upstream of the port region, the O2 concentration was high (up to 424 μM) and supersaturated (>140%). The concentrations then decreased to 324 μM and approached saturation when entering the port region. In April 2015, sampling started slightly further downstream, and the O2 saturation at the beginning of the transect was only 72% (230 μM). In the port region, the O2 concentrations decreased to minimum values of 185 μM (April) and 153 μM (June), corresponding to saturations of 58 and 53%, respectively. Downstream of the port region, the O2 concentrations rose again, reaching ~330–350 μM in both months in the Elbe mouth, which was equivalent to 100% saturation in April and a slight oversaturation of 105% in June.
DIN Distribution
Dissolved inorganic nitrogen (DIN, i.e., , , and ) concentrations were generally higher in April than in June (Figure 3B). concentrations increased from the beginning of each transect up to the MTZ (Maximum Turbidity Zone, located between stream km 680–700), and then decreased with increasing salinity. Maximum concentrations of (19 μM) and (4 μM) were measured in April around stream km 640 in the port region. In June, the peaks were located slightly further upstream at stream km ~630 to ~635 in the port region, and maximum values were 7 μM for and 2 μM for . Further downstream, ammonium and nitrite concentration fell below the detection limit (<0.5 μM). In April, a slight increase in ammonium and nitrite concentration (4 and 0.6 μM, respectively) was visible in the mouth of the estuary (stream km 710–740).
N2O Saturations and Emissions to the Atmosphere
The N2O saturations were always highest in the Hamburg port region (Figure 4) with median N2O saturations of 237 ± 32% and 386 ± 105% in April and June, respectively. Downstream, the mean saturations dropped to 155 ± 5% in April and 175 ± 11% in June. Toward the end of the transect, at the onset of the salinity gradient, saturations decreased further and approached equilibrium (i.e., 100%) in the German Bight/North Sea region.
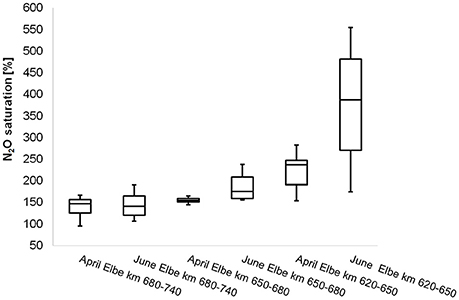
Figure 4. N2O water saturations (%) of different transect parts with according Elbe stream km, including the Hamburg port area (km 620–650), the Elbe river (km 650–680) and beginning of salinity gradient of the Elbe estuary up to the North Sea (km 680–740).
Similar to the N2O saturations, the N2O sea-to-air flux densities were highest between stream km 620 and 650, i.e., in the section of the estuary where the port of Hamburg is located (100 and 199.8 μmol m−2 d−1 in April and June, respectively). To get an integrated picture of N2O emissions along the estuary, we divided the transect into different sections, the Port region (stream km 620–650), the residual freshwater part (stream km 650–680), beginning of salinity gradient up to the North Sea (stream km 680–740). We then calculated mean fluxes for each section, and, based on the respective surface area (J. Kappenberg, pers. comm.), calculated the flux for the entire estuary. This calculation yielded an average sea-to-air flux density of 48 μmol m−2 d−1 (SD: ± 41.4 μmol m−2 d−1) over the entire estuary, which is equivalent to an N2O emission of 0.18 Gg N2O y−1 (SD: ± 0.01 Gg N2O y−1).
Discussion
N2O Source Regions in the Estuary
N2O and DIN concentrations were low upstream of the port, where the water column was oversaturated with respect to O2. In this region of the Elbe, intense phytoplankton growth led to an obvious increase of dissolved oxygen concentration (Amann et al., 2012, 2015; Schöl et al., 2014), and this clearly was also the reason for the observed O2 oversaturations during our sampling campaign in early summer.
Especially in June 2015, the O2 concentrations decreased sharply around stream km 620, where a sudden increase in channel depth marks the beginning of the deep Hamburg port region (Schöl et al., 2014). Due to a reduction of light availability in the port, and an increase of suspended particulate matter, primary production is inhibited in this region (Goosen et al., 1995; Wolfstein and Kies, 1999), and the fresh phytoplankton biomass brought in by the Elbe water is an optimal source for remineralization by heterotrophic bacteria (Kerner, 2000). Enhanced remineralization and decreasing phytoplankton activity leads to increased O2 consumption and a decrease of O2 production, respectively, leading to the observed minimal O2 concentrations in the deep Hamburg port region (Schöl et al., 2014).
Furthermore, these high remineralization rates (Kerner and Spitzy, 2001; Schöl et al., 2014) can contribute to elevated ammonium concentrations (Figure 3B). This ammonium is the substrate for ammonia oxidation during the first step of nitrification (Kerner and Spitzy, 2001). Based on stable isotope investigations, Dähnke et al. (2008) concluded that nitrification played an important role in the estuary.
Intriguingly, recent rate measurements revealed that both nitrification and denitrification can occur at high rates in the port region: Deek et al. (2013) found highest denitrification rates in the sediments at stream km ~630, and Sanders et al. (2017) found highest nitrification rates in the water column in the same section of the estuary. This implies that both processes can potentially contribute to N2O production in the region of the Hamburg port where the O2 minimum is most pronounced.
In addition, N2O production either due to nitrification and/or denitrification is enhanced under lower oxygen conditions (e.g., Goreau et al., 1980; Codispoti et al., 2001; de Bie et al., 2002), also seen in N2O concentration differences between June and April. Furthermore, an increase of nitrification and denitrification rates and thus N2O release, is fueled by warmer temperatures (e.g., Nowicki, 1994; Gödde and Conrad, 1999) which were also measured in June (20 vs. 14°C in April) in the port region.
Beside this obvious hot spot of N2O production, we also aimed to evaluate N2O production in the downstream part of the Elbe estuary. The low concentrations of and measured in April when entering the Elbe mouth may indicate biological N-turnover, but there was no obvious relationship with the N2O concentrations which decreased steadily. Upstream of the Elbe mouth, between stream km 680 and 700, the MTZ is located, and in many estuaries, this is regarded as a hot spot of biogeochemical processing (e.g., Barnes and Owens, 1998; Kerner, 2000; Harley et al., 2015) due to intense decomposition of organic matter at rising salinity. This decomposition is often coupled to intense N2O production (e.g., Barnes and Owens, 1998; de Wilde and de Bie, 2000; Barnes and Upstill-Goddard, 2011). In our study, however, we only see a slight increase of 3–6 nM N2O at the beginning of the salinity gradient in the MTZ. This indicates that the MTZ at the time of our measurements was not a site of enhanced N2O production.
Thus, in contrast to other European estuaries, we find that the MTZ is only of minor importance with regards to estuarine N2O emissions, which leaves the Hamburg port region as the most important hot spot of N2O production in the Elbe estuary.
Assessment of Nitrification and of Denitrification as N2O Sources
If we assume that significant N2O production occurs mainly in the deeper part of the Hamburg port region, this still leaves an open question as to whether this N2O production is dominated by nitrification (in the water column or in surface sediments) or by sedimentary denitrification.
The relationship of DIN and nitrous oxide can be useful tools to evaluate the origin of N2O. Denitrification intensity is regulated by the presence of nitrate and nitrite (Dong et al., 2004). Thus, with ample nitrate present, the setting for sedimentary denitrification is ideal, and nitrous oxide may well stem from denitrification. However, the importance of nitrification in the estuary is obvious: in the most upstream part of the transect (June: stream km 611–633), a distinct parallel increase of and N2O concentration and a positive correlation (r2 = 0.90) suggests that N2O production and production are linked to each other to some extent. Furthermore, the sharp increase in N2O concentrations coincided with high concentrations during both sampling campaigns (April: r2 = 0.95, p ≪ 0.05, June: r2 = 0.67, p ≪ 0.05) and provides additional evidence for N2O produced during nitrification (de Wilde and de Bie, 2000). Downstream the N2O concentration peak, concentration continues to increase up to the MTZ, likely due to ongoing nitrification, resulting in an overall negative correlation of both parameters. This highlights that the exact setting and nutrient distribution in an individual estuary must be taken into account, and that processes cannot be quantified based on correlations alone (cf. Harley et al., 2015).
Thus, to assess the role of nitrification vs. denitrification, we investigated the correlation of excess N2O (N2Oxs) and apparent oxygen utilization (AOU). Nitrification consumes oxygen, and a linear correlation of AOU and N2Oxs is usually regarded as an indicator for a dominant role of nitrification in N2O production (e.g., Cohen and Gordon, 1979; Nevison et al., 2003; Walter et al., 2004). N2Oxs was calculated based on the difference between the N2O concentration in the water (N2Ocw) and the theoretical equilibrium concentration (N2Oair):
This can be correlated to the apparent oxygen utilization (AOU in μM) defined as Equation (5),
where O2 is the dissolved O2 measured in the water phase and is the theoretical equilibrium concentration of the water body with respect to atmospheric O2 concentration (Garcia and Gordon, 1992).
In our study, mixing along the salinity gradient obviously exerts a major control on both AOU and N2Oxs, and when mixing is dominant, the correlation of both parameters cannot be used as a proxy for nitrification. Therefore, only parts of the data can be used to investigate the correlation of AOU and N2Oxs. All stations with clearly rising salinities are disregarded due to dominant mixing effects, and so are all upstream stations that showed an oversaturation in O2. Hence, only the freshwater part of the Elbe was plotted [stream km 620, where mean water depth decreases due to dredging (Schöl et al., 2014), up to stream km 670], Figure 5.
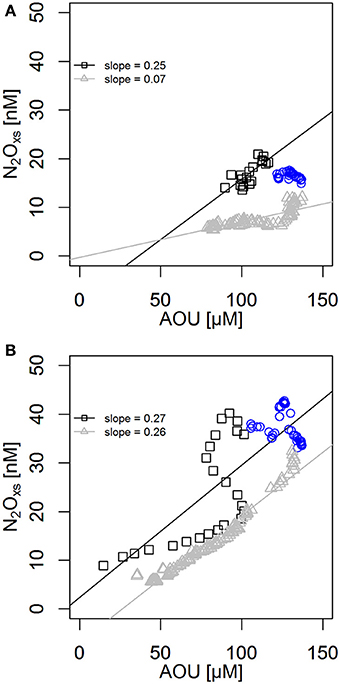
Figure 5. Relationship between N2O excess (N2Oxs) and apparent oxygen utilization (AOU) in the Elbe river with according regression slopes in April (A) and June (B). □, Elbe river upstream of the region with lowest O2 concentration; Δ, Elbe river downstream of the region with lowest O2 concentration region; o, within the oxygen minimum.
AOU-N2Oxs cross plots showed a significant linear relationship in most parts of the transect (Figure 5), which only breaks down at lowest O2 concentrations, where N2O production is elevated (blue symbols in Figure 5). Such a linear relation is regarded as an indicator for a dominant role of nitrification in N2O production (Cohen and Gordon, 1979; Walter et al., 2004). The slope itself generally reflects the biological N2O yield per mole O2 consumed (Cohen and Gordon, 1979; Najjar, 1992; Suntharalingam and Sarmiento, 2000). As we find a linear correlation throughout most of the transect, we thus conclude that nitrification dominates N2O production in the Elbe estuary.
Regression slopes were remarkably similar in the upstream part of the river in April and June. Furthermore, in June, the slopes upstream and downstream of the O2 minimum are also comparable. For nitrification, regression slopes of 0.08 to 0.3 nM N2O/μM O2 have been calculated (Suntharalingam and Sarmiento, 2000), in our study, the slopes (0.25–0.27) are thus in the high end of this range, reflecting a high relative N2O yield. In the light of comparatively low O2 concentrations in our study, this is in line with an expected increase of nitrous oxide production with decreasing O2 (Bakker et al., 2014).
We note that the slopes can also be affected by mixing processes (Suntharalingam and Sarmiento, 2000; Nevison et al., 2003), and assume that this is the case in June 2015, where we, despite significant linearity (Figure 5B—black symbols, r2 = 0.39, p ≪ 0.05), see a curved pattern of AOU vs. N2Oxs. We assume that this reflects local mixing with water masses from adjacent harbor basins and/or waste water discharge by a neighboring waste water treatment plant (stream km ~630). We also note that in estuarine regions like in the Elbe estuary, oxygen consumption is fueled not only by nitrification, but that remineralization also can contribute to an increased AOU. Hence, the strong linear correlation cannot be taken as an indicator of nitrification alone. Nevertheless, nitrification contributes to oxygen consumption, is tightly coupled to remineralization in the Elbe estuary (Kerner and Spitzy, 2001), and obviously increases the nitrate load massively throughout the estuary. This co-occurrence of nitrate production, in combination with the linear correlation of AOU and N2Oxs suggests a large portion of nitrous oxide that is produced in the freshwater section of the estuary from stream km 620 onwards stems from nitrification (Cohen and Gordon, 1979; Walter et al., 2004).
While we did not perform N2O measurements in the sediment, at minimum O2 concentrations, we find that the linear correlation of N2Oxs and AOU breaks up (Figure 5). Our measured O2 concentration which was measured at 2 m water depth is too high to allow denitrification in the water column. But the break-up of linearity is accompanied by high AOU values, which indicate high O2 consumption in water masses and/or sediment of the Elbe River, either due to nitrification and/or due to respirational processes (Schöl et al., 2014; Amann et al., 2015). Therefore, we speculate that the resulting hypoxic conditions can favor denitrification as an additional contributor to N2O in the Elbe estuary and previous studies showed that denitrification in sediments is highly active in this region (Schroeder et al., 1990; Deek et al., 2013). It is thus plausible that a portion of the N2O that is apparently produced in the sediment during denitrification escapes to the water column. In consequence, this would affect linearity of N2Oxs/AOU by increasing the relative amount of N2O, which is exactly what we find in our measurements. Hence, we assume that the additional N2Oxs in the oxygen minimum region must be explained by sedimentary denitrification contributing to an elevated concentration of N2O in the water column. This break-up of linearity occurred at lowest oxygen concentrations and in a smaller part of the transect (~stream km 627/633–638/640) in the port region. Thus, we conclude that sedimentary denitrification is an additional contributor to N2O concentration beside nitrification.
Trends in N2O Saturation in the Estuary and Emissions
In comparison to other European estuaries, N2O saturation in the Elbe appears to be in the midrange of values reported so far, even if seasonal variability can affect the comparison. The mean N2O saturation of 201% (SD: ±94%) in the Elbe is high compared to Tamar, Temmesjoki, Gironde, and Tagus estuaries, but relatively low compared to the Schelde and the Humber (UK) estuary (Table 1), where nitrification is the main source of N2O (Barnes and Owens, 1998; de Wilde and de Bie, 2000; de Bie et al., 2002). In addition, de Bie et al. (2002) also speculated that additional N2O may derive from denitrification, which occurs at high rates in the inner Humber estuary (Barnes and Owens, 1998).
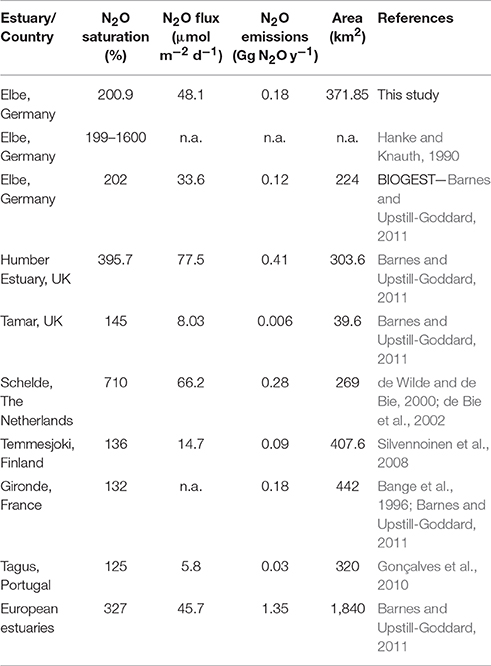
Table 1. Comparison of N2O saturations, fluxes and emissions from European estuaries.
Despite the moderate N2O saturations in the Elbe estuary, we found very high sea-to-air fluxes which are closer to those measured in the Schelde and the Humber estuary than to other European estuaries. While a major uncertainty derives from estimations of gas transfer velocity, which highly depends on wind, water currents, turbulences, etc. (Zappa et al., 2003; Abril et al., 2009), the average sea-to-air flux density of 48.1 μmol m−2 d−1 still suggests that the Elbe is a significant source for N2O. The calculated total N2O emissions of 0.18 Gg N2O y−1 are rather comparable to the Gironde (France) (Table 1) than to the Humber estuary (0.41 Gg N2O y−1), even though the DIN concentrations in the Elbe are comparable to those of the Humber estuary. Zhang et al. (2010) showed that DIN and N2O emissions are often correlated, and the Elbe data from our study nicely match the correlation they show.
Thus, as this correlation holds, and because nutrient loads in the Elbe Estuary have decreased during the last decades, we compared trends in nutrient loads and N2O concentrations over time. Previous investigations in the 1980s (Hanke and Knauth, 1990) found N2O saturations from 199 to 1,600%, which were much higher than the saturation range from 139 to 374% reported in the BIOGEST study from the 1990s (Barnes and Upstill-Goddard, 2011). One main reason for the difference between the results of Hanke and Knauth (1990) and later studies including ours probably is the reduced nutrient load of the Elbe estuary and the increased oxygen concentration (Figure 6A). Hanke and Knauth (1990) reported ammonium concentrations of ~15–110 μM along the whole transect, while in our study ammonium concentrations were below 19 μM. In line with high nutrient loads and low oxygen saturation at that time, Hanke and Knauth (1990) concluded that denitrification was the dominant contributor to N2O production. The importance of denitrification appears to have ceased in the contemporary Elbe estuary since then (Dähnke et al., 2008), and our data support that this also affects N2O production: Beside the obvious nitrate production in the freshwater section, the clear correlation of N2Oxs and AOU also points toward nitrification as an important N2O source in the contemporary estuary.
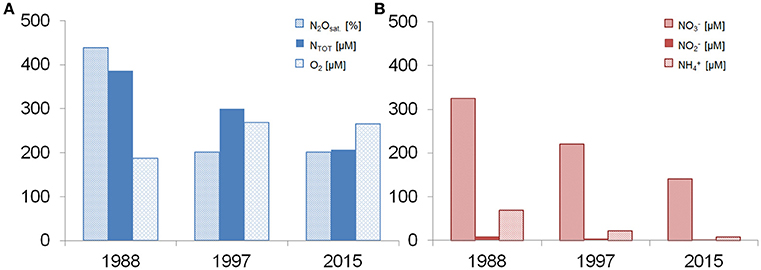
Figure 6. Comparison of Elbe transect measurements for the years 1988, 1997, and 2015. (A) Average N2O saturation, and annual average total N and O2 concentrations. (B) Annual average concentrations of dissolved , , and . Nutrient and O2 data are available at: http://www.elbe-datenportal.de/FisFggElbe/content/start/BesucherUnbekannt.action.
Since the study by Hanke and Knauth (1990), the DIN load decreased markedly, and a significant improvement of the environmental condition in the Elbe estuary occurred as a consequence of reduced nutrient inputs (Figure 6B). A reduced input of DIN correlates with a reduction in N2O production (Zhang et al., 2010), and we thus expected to find lower N2O concentrations than during the BIOGEST study in the 1990s (Figure 6). However, in comparison to the BIOGEST data, it is remarkable that N2O saturations have obviously not decreased any further some 20 years later, even though a steady decrease of the total nitrogen load occurred over the last decades (Pätsch and Lenhart, 2004; Radach and Pätsch, 2007; see also Figure 6A). It is yet unclear why N2O saturations remained unchanged at this high level, but it appears plausible that internal N-cycling, i.e., intense nitrification, and denitrification in the port region, may compensate for the reduction in overall nutrient loads.
Conclusions
N2O saturations in the range from 118 to 554% and high sea-to-air fluxes were observed along two transects along the salinity gradient of the Elbe estuary in April and June 2015, indicating that the Elbe estuary was a moderate source of N2O to the atmosphere. We found highest N2O concentrations in the Hamburg port area, which was a hot spot of biological N2O production with maximum sea-to-air flux densities of 100 and 200 μmol m−2 d−1 April and June, respectively. Our DIN and O2 measurements suggest that intense remineralization and respiration took place in this area leading to maximum ammonium concentrations, which serve as a substrate for nitrification. Moreover, nitrification was identified to be mainly responsible for N2O production as indicated by linear correlations of apparent oxygen utilization and N2Oxs throughout much of the transect in the freshwater part. However, we found that the linear correlation of AOU-N2Oxs breaks up at highest N2O concentrations associated with the lowest measured O2 concentrations, which shows a signal of N2O production by sedimentary denitrification as an additional contributor to N2O concentration in parts of the port region.
In comparison to previous studies, our data indicate that the main N2O production pathway with respect to the whole Elbe estuary freshwater part has changed from predominant denitrification in the 1980s to nitrification in the present estuary. Although a significant reduction in N2O saturations (and its subsequent emissions to the atmosphere) occurred since the 1980s, the Elbe estuary remains an important source of N2O, especially as nutrient reduction measures do not seem to further reduce N2O production. Thus, the future development of the Elbe estuary as a greenhouse gas source is unclear, and the seasonality of N2O production as well as determining factors should be evaluated in future studies.
Author Contributions
LB contributed to the concept of the work and analytical design, analyzing, and interpretation of the data and draft the manuscript. HB and KD contributed to interpretation of the data and critical discussion. RL contributed to analytical design and critical discussion. TS contributed to critical discussion and first data interpretation. KD conceived this study, and also helped to structure and draft the manuscript.
Funding
This study was partly funded by the Helmholtz Association (VH-NG-721).
Conflict of Interest Statement
The authors declare that the research was conducted in the absence of any commercial or financial relationships that could be construed as a potential conflict of interest.
Acknowledgments
We want to thank M. Ankele for his help with the sample analyses. A. Bratek and A. Neumann are gratefully acknowledged for their help with field work.
References
Abril, G., Commarieu, M.-V., Sottolichio, A., Bretel, P., and Guérin, F. (2009). Turbidity limits gas exchange in a large macrotidal estuary. Estuar. Coast. Shelf Sci. 83, 342–348. doi: 10.1016/j.ecss.2009.03.006
Adams, M. S., Ballin, U., Gaumert, T., Hale, B. W., Kausch, H., and Kruse, R. (2001). Monitoring selected indicators of ecological change in the Elbe River since the fall of the Iron Curtain. Environ. Conserv. 28, 333–344. doi: 10.1017/S0376892901000364
Amann, T., Weiss, A., and Hartmann, J. (2012). Carbon dynamics in the freshwater part of the Elbe estuary, Germany: implications of improving water quality. Estuar. Coast. Shelf Sci. 107, 112–121. doi: 10.1016/j.ecss.2012.05.012
Amann, T., Weiss, A., and Hartmann, J. (2015). Inorganic carbon fluxes in the inner Elbe Estuary, Germany. Estuar. Coasts 38, 192–210. doi: 10.1007/s12237-014-9785-6
Arévalo-Martínez, D. L., Kock, A., Steinhoff, T., Brandt, P., Dengler, M., Fischer, T., et al. (2017). Nitrous oxide during the onset of the Atlantic Cold Tongue. J. Geophys. Res. Oceans 122, 171–184. doi: 10.1002/2016jc012238
Arévalo-Martínez, D. L., Beyer, M., Krumbholz, M., Piller, I., Kock, A., Steinhoff, T., et al. (2013). A new method for continuous measurements of oceanic and atmospheric N2O, CO and CO2: performance of off-axis integrated cavity output spectroscopy (OA-ICOS) coupled to non-dispersive infrared detection (NDIR). Ocean Sci. 9, 1071–1087. doi: 10.5194/os-9-1071-2013
Arévalo-Martínez, D. L., Kock, A., Löscher, C., Schmitz, R. A., and Bange, H. W. (2015). Massive nitrous oxide emissions from the tropical South Pacific Ocean. Nat. Geosci. 8, 530–533. doi: 10.1038/ngeo2469
Baer, D. S., Paul, J. B., Gupta, M., and O'Keefe, A. (2002). “Sensitive absorption measurements in the near-infrared region using off-axis integrated cavity output spectroscopy,” in International Symposium on Optical Science and Technology (Seattle: International Society for Optics and Photonics), 167–176. doi: 10.1117/12.451461
Bakker, D. C., Bange, H. W., Gruber, N., Johannessen, T., Upstill-Goddard, R. C., Borges, A. V., et al. (2014). “Air-sea interactions of natural long-lived greenhouse gases (CO2, N2O, CH4) in a changing climate,” in Ocean-Atmosphere Interactions of Gases and Particles (Heidelberg, Berlin: Springer), 113–169.
Bange, H. W. (2006). Nitrous oxide and methane in European coastal waters. Estuar. Coast. Shelf Sci. 70, 361–374. doi: 10.1016/j.ecss.2006.05.042
Bange, H. W., Rapsomanikis, S., and Andreae, M. O. (1996). Nitrous oxide in coastal waters. Glob. Biogeochem. Cycles 10, 197–207. doi: 10.1029/95GB03834
Barnes, J., and Owens, N. J. P. (1998). Denitrification and nitrous oxide concentrations in the humber Estuary, UK, and adjacent Coastal Zones. Mar. Pollut. Bull. 37, 247–260. doi: 10.1016/S0025-326X(99)00079-X
Barnes, J., and Upstill-Goddard, R. (2011). N2O seasonal distributions and air-sea exchange in UK estuaries: implications for the tropospheric N2O source from European coastal waters. J. Geophys. Res. Biogeosci. 116, 1–21. doi: 10.1029/2009jg001156
Borges, A. V., Vanderborght, J.-P., Schiettecatte, L.-S., Gazeau, F., Ferrón-Smith, S., Delille, B., et al. (2004). Variability of the gas transfer velocity of CO2 in a macrotidal estuary (the Scheldt). Estuaries 27, 593–603. doi: 10.1007/BF02907647
Codispoti, L., Brandes, J. A., Christensen, J., Devol, A., Naqvi, S., Paerl, H. W., et al. (2001). The oceanic fixed nitrogen and nitrous oxide budgets: moving targets as we enter the anthropocene? Sci. Mar. 65, 85–105. doi: 10.3989/scimar.2001.65s285
Cohen, Y., and Gordon, L. I. (1979). Nitrous oxide production in the ocean. J. Geophys. Res. Oceans 84, 347–353. doi: 10.1029/JC084iC01p00347
Crutzen, P. J. (1970). The influence of nitrogen oxides on the atmospheric ozone content. Q. J. R. Meteorol. Soc. 96, 320–325. doi: 10.1002/qj.49709640815
Dähnke, K., Bahlmann, E., and Emeis, K. (2008). A nitrate sink in estuaries? An assessment by means of stable nitrate isotopes in the Elbe estuary. Limnol. Oceanog. 53, 1504–1511. doi: 10.4319/lo.2008.53.4.1504
Davidson, E. A., and Kanter, D. (2014). Inventories and scenarios of nitrous oxide emissions. Environ. Res. Lett. 9:105012. doi: 10.1088/1748-9326/9/10/105012
de Bie, M. J., Middelburg, J. J., Starink, M., and Laanbroek, H. J. (2002). Factors controlling nitrous oxide at the microbial community and estuarine scale. Mar. Ecol. Prog. Ser. 240, 1–9. doi: 10.3354/meps240001
Deek, A., Dähnke, K., Van Beusekom, J., Meyer, S., Voss, M., and Emeis, K. (2013). N2 fluxes in sediments of the Elbe Estuary and adjacent coastal zones. Mar. Ecol. Prog. Ser. 493, 9–21. doi: 10.3354/meps10514
de Wilde, H. P. J., and de Bie, M. J. M. (2000). Nitrous oxide in the Schelde estuary: production by nitrification and emission to the atmosphere. Mar. Chem. 69, 203–216. doi: 10.1016/S0304-4203(99)00106-1
Dong, L. F., Nedwell, D., Colbeck, I., and Finch, J. (2004). Nitrous oxide emission from some English and Welsh rivers and estuaries. Water Air Soil Pollut. Focus 4, 127–134. doi: 10.1007/s11267-004-3022-4
Garcia, H. E., and Gordon, L. I. (1992). Oxygen solubility in seawater: better fitting equations. Limnol. Oceanogr. 37, 1307–1312. doi: 10.4319/lo.1992.37.6.1307
Gödde, M., and Conrad, R. (1999). Immediate and adaptational temperature effects on nitric oxide production and nitrous oxide release from nitrification and denitrification in two soils. Biol. Fertil. Soils 30, 33–40. doi: 10.1007/s003740050584
Gonçalves, C., Brogueira, M. J., and Camões, M. F. (2010). Seasonal and tidal influence on the variability of nitrous oxide in the Tagus estuary, Portugal. Sci. Mar. 74, 57–66. doi: 10.3989/scimar.2010.74s1057
Goosen, N. K., Van Rijswijk, P., and Brockmann, U. (1995). Comparison of heterotrophic bacterial production rates in early spring in the turbid estuaries of the Scheldt and the Elbe. Hydrobiologia 311, 31–42. doi: 10.1007/BF00008569
Goreau, T. J., Kaplan, W. A., Wofsy, S. C., Mcelroy, M. B., Valois, F. W., and Watson, S. W. (1980). Production of NO2-and N2O by nitrifying bacteria at reduced concentrations of oxygen. Appl. Environ. Microbiol. 40, 526–532.
Grefe, I., and Kaiser, J. (2014). Equilibrator-based measurements of dissolved nitrous oxide in the surface ocean using an integrated cavity output laser absorption spectrometer. Ocean Sci. 10, 501–512. doi: 10.5194/os-10-501-2014
Gülzow, W., Rehder, G., Deimling, J. S. V., Seifert, T., and Tóth, Z. (2013). One year of continuous measurements constraining methane emissions from the Baltic Sea to the atmosphere using a ship of opportunity. Biogeosciences 10:81.
Gülzow, W., Rehder, G., Schneider, B., Deimling, J. S. V., and Sadkowiak, B. (2011). A new method for continuous measurement of methane and carbon dioxide in surface waters using off-axis integrated cavity output spectroscopy (ICOS): an example from the Baltic Sea. Limnol. Oceanogr. Methods 9, 176–184. doi: 10.4319/lom.2011.9.176
Hanke, V.-R., and Knauth, H.-D. (1990). N2O-Gehalte in Wasser-und Luftproben aus den Bereichen der Tideelbe und der Deutschen Bucht. Vom Wasser 75, 357–374.
Hansen, H. P., and Koroleff, F. (1999). “Determination of nutrients,” in Methods of Seawater Analysis, 3rd Edn., eds K. Grasshoff, K. Kremling, and M. Ehrhardt (Weinheim: Wiley-VCH Verlag GmbH). doi: 10.1002/9783527613984.ch10
Harley, J. F., Carvalho, L., Dudley, B., Heal, K. V., Rees, R. M., and Skiba, U. (2015). Spatial and seasonal fluxes of the greenhouse gases N2O, CO2 and CH4 in a UK macrotidal estuary. Estuar. Coast. Shelf Sci. 153, 62–73. doi: 10.1016/j.ecss.2014.12.004
Hellebrand, H. J., Scholz, V., and Kern, J. (2008). Fertiliser induced nitrous oxide emissions during energy crop cultivation on loamy sand soils. Atmos. Environ. 42, 8403–8411. doi: 10.1016/j.atmosenv.2008.08.006
Howarth, R., Chan, F., Conley, D. J., Garnier, J., Doney, S. C., Marino, R., et al. (2011). Coupled biogeochemical cycles: eutrophication and hypoxia in temperate estuaries and coastal marine ecosystems. Front. Ecol. Environ. 9, 18–26. doi: 10.1890/100008
IPCC (2013). Climate Change 2013: The Physical Science Basis. Contribution of Working Group I to the Fifth Assessment Report of the Intergovernmental Panel on Climate Change. Cambridge, UK; New York, NY: Cambridge University Press.
Kerner, M. (2000). Interactions between local oxygen deficiencies and heterotrophic microbial processes in the Elbe estuary. Limnol. Ecol. Manag. Inland Waters 30, 137–143. doi: 10.1016/S0075-9511(00)80008-0
Kerner, M., and Spitzy, A. (2001). Nitrate regeneration coupled to degradation of different size fractions of DON by the picoplankton in the Elbe Estuary. Microb. Ecol. 41, 69–81. doi: 10.1007/s002480000031
Körtzinger, A., Thomas, H., Schneider, B., Gronau, N., Mintrop, L., and Duinker, J. C. (1996). At-sea intercomparison of two newly designed underway pCO2 systems—encouraging results. Mar. Chem. 52, 133–145. doi: 10.1016/0304-4203(95)00083-6
Lampe, C., Dittert, K., Sattelmacher, B., Wachendorf, M., Butterbach-Bahl, K., Papen, H., et al. (2003). “Einfluss der N-düngung auf die N2O-emissionen auf grünland,” in DLG-Grünlandtagung “Die 10.000 kg-Herde auf dem Grünland”, 36–42.
Langhammer, J. (2010). Water quality changes in the Elbe River basin, Czech Republic, in the context of the post-socialist economic transition. GeoJournal 75, 185–198. doi: 10.1007/s10708-009-9292-7
Middelburg, J. J., and Herman, P. M. (2007). Organic matter processing in tidal estuaries. Mar. Chem. 106, 127–147. doi: 10.1016/j.marchem.2006.02.007
Murray, R. H., Erler, D. V., and Eyre, B. D. (2015). Nitrous oxide fluxes in estuarine environments: response to global change. Glob. Chang. Biol. 21, 3219–3245. doi: 10.1111/gcb.12923
Najjar, R. G. (1992). “Marine biogeochemistry,” in Climate System Modeling, ed K. E. Trenberth (Cambridge: Cambridge University Press), 241–280.
Naqvi, S., Bange, H. W., Farias, L., Monteiro, P., Scranton, M., and Zhang, J. (2010). Marine hypoxia/anoxia as a source of CH4 and N2O. Biogeosciences 7, 2159–2190. doi: 10.5194/bg-7-2159-2010
Nevison, C., Butler, J. H., and Elkins, J. (2003). Global distribution of N2O and the ΔN2O-AOU yield in the subsurface ocean. Global Biogeochem. Cycles 17, 30-1–30-18. doi: 10.1029/2003GB002068
Nowicki, B. L. (1994). The effect of temperature, oxygen, salinity, and nutrient enrichment on estuarine denitrification rates measured with a modified nitrogen gas flux technique. Estuar. Coast. Shelf Sci. 38, 137–156. doi: 10.1006/ecss.1994.1009
Pätsch, J., and Lenhart, H.-J. (2004). “Daily loads of nutrients, total alkalinity, dissolved inorganic carbon and dissolved organic carbon of the European continental rivers for the years 1977–2002,” in Berichte aus Dem Zentrum fÃijr Meeres-und Klimaforschung; Reihe B: Ozeanographie 48 (Hamburg: Institut fÃijr Meereskunde), 159.
Petersen, W., Petschatnikov, M., Schroeder, F., and Colijn, F. (2003). FerryBox systems for monitoring coastal waters. Elsevier Oceanogr. Ser. 69, 325–333. doi: 10.1016/S0422-9894(03)80052-1
Poughon, L., Dussap, C. G., and Gros, J. B. (2001). Energy model and metabolic flux analysis for autotrophic nitrifiers. Biotechnol. Bioeng. 72, 416–433. doi: 10.1002/1097-0290(20000220)72:4<416::AID-BIT1004>3.0.CO;2-D
Radach, G., and Pätsch, J. (2007). Variability of continental riverine freshwater and nutrient inputs into the North Sea for the years 1977–2000 and its consequences for the assessment of eutrophication. Estuar. Coasts 30, 66–81. doi: 10.1007/BF02782968
RBC Elbe, F. (2010). Elbebericht 2008–Ergebnisse des Nationalen Überwachungsprogramms Elbe der Bundeländer über den Ökologischen und Chemischen Zustand der Elbe Nach EG-WRRL Sowie der Trendentwicklung von Stoffen und Stoffgruppen. Gemeinsamer Bericht der Bundesländer und der Bundesrepublik Deutschland, Hamburg.
Rhee, T., Kettle, A., and Andreae, M. (2009). Methane and nitrous oxide emissions from the ocean: a reassessment using basin-wide observations in the Atlantic. J. Geophys. Res. Atmos. 114, 1–20. doi: 10.1029/2008jd011662
Rhee, T. S. (2000). The Process of Air-Water Gas Exchange and Its Application. Ph.D. thesis, Texas A&M University, College Station, TX.
Ritchie, G. A., and Nicholas, D. J. (1972). Identification of the sources of nitrous oxide produced by oxidative and reductive processes in Nitrosomonas europaea. Biochem. J. 126, 1181–1191. doi: 10.1042/bj1261181
Sanders, T., Schöl, A., and Dähnke, K. (2017). Hot spots of nitrification in the Elbe Estuary and their impact on nitrate regeneration. Estuar. Coast. doi: 10.1007/s12237-017-0264-8
Schöl, A., Hein, B., Wyrwa, J., and Kirchesch, V. (2014). Modelling water quality in the Elbe and its estuary-Large scale and long term applications with focus on the oxygen budget of the estuary. Die Küste 81, 203–232.
Schroeder, F., Klages, D., and Knauth, H.-D. (1990). “Bell-jar experiments and suspension measurements for the quantification of oxygen consumption and nitrogen conversion in sediments of the Elbe estuary,” in Estuarine Water Quality Management, ed W. Michaelis (Berlin; Heidelberg: Springer), 253–258.
Siedler, G., and Peters, H. (1986). “Properties of sea water: physical properties,” in Oceanography, ed J. Sündermann (Berlin; Heidelberg: Springer Berlin Heidelberg), 233–264.
Silvennoinen, H., Liikanen, A., Rintala, J., and Martikainen, P. J. (2008). Greenhouse gas fluxes from the eutrophic Temmesjoki River and its Estuary in the Liminganlahti Bay (the Baltic Sea). Biogeochemistry 90, 193–208. doi: 10.1007/s10533-008-9244-1
Simon, M. (2005). Die Elbe und ihr Einzugsgebiet: Ein Geographisch-Hydrologischer und Wasserwirtschaftlicher Überblick. Magdeburg: Internationale Kommission zum Schutz der Elbe (IKSE).
Suntharalingam, P., and Sarmiento, J. (2000). Factors governing the oceanic nitrous oxide distribution: simulations with an ocean general circulation model. Global Biogeochemical Cycles 14, 429–454. doi: 10.1029/1999GB900032
Walter, S., Bange, H. W., and Wallace, D. W. (2004). Nitrous oxide in the surface layer of the tropical North Atlantic Ocean along a west to east transect. Geophys. Res. Lett. 31, 1–14. doi: 10.1029/2004GL019937
Weiss, R. F., and Price, B. A. (1980). Nitrous oxide solubility in water and seawater. Mar. Chem. 8, 347–359. doi: 10.1016/0304-4203(80)90024-9
WMO (2014). Scientific Assessment of Ozone Depletion: 2014. Global Ozone Research and Monitoring Project–Report No. 55. Geneva: World Meteorological Organization.
Wolfstein, K., and Kies, L. (1999). Composition of suspended participate matter in the Elbe estuary: implications for biological and transportation processes. Deutsche Hydrografische Zeitschrift 51, 453–463. doi: 10.1007/BF02764166
Zappa, C. J., Raymond, P. A., Terray, E. A., and Mcgillis, W. R. (2003). Variation in surface turbulence and the gas transfer velocity over a tidal cycle in a macro-tidal estuary. Estuaries 26, 1401–1415. doi: 10.1007/BF02803649
Keywords: nitrous oxide, N2O, estuary, Elbe River, trace gases, emissions, laser spectroscopy
Citation: Brase L, Bange HW, Lendt R, Sanders T and Dähnke K (2017) High Resolution Measurements of Nitrous Oxide (N2O) in the Elbe Estuary. Front. Mar. Sci. 4:162. doi: 10.3389/fmars.2017.00162
Received: 07 February 2017; Accepted: 12 May 2017;
Published: 30 May 2017.
Edited by:
Antonio Tovar-Sanchez, Consejo Superior de Investigaciones Científicas (CSIC), SpainReviewed by:
Dirk Erler, Southern Cross University, AustraliaForja Pajares Jesús, University of Cádiz, Spain
Copyright © 2017 Brase, Bange, Lendt, Sanders and Dähnke. This is an open-access article distributed under the terms of the Creative Commons Attribution License (CC BY). The use, distribution or reproduction in other forums is permitted, provided the original author(s) or licensor are credited and that the original publication in this journal is cited, in accordance with accepted academic practice. No use, distribution or reproduction is permitted which does not comply with these terms.
*Correspondence: Lisa Brase, bGlzYS5icmFzZUBoemcuZGU=