 Kathrin Busch
 Sonja Endres
 Morten H. Iversen
 Jan Michels
 Eva-Maria Nöthig
 Anja Engel
- 1Department of Marine Biogeochemistry/Biological Oceanography, GEOMAR Helmholtz Centre for Ocean Research Kiel, Kiel, Germany
- 2Department Deep Sea Ecology and Technology/SEAPUMP, Alfred Wegener Institute Helmholtz Centre for Polar and Marine Research, Bremerhaven, Germany
- 3MARUM and University of Bremen, Bremen, Germany
- 4Department Polar Biological Oceanography, Alfred Wegener Institute Helmholtz Centre for Polar and Marine Research, Bremerhaven, Germany
Gel particles—a class of abundant transparent organic particles—have increasingly gathered attention in marine research. Field studies on the bacterial colonization of marine gels however are still scarce. So far, most studies on respective particles have focused on the upper ocean, while little is known on their occurrence in the deep sea. Here, we report on the vertical distribution of the two most common gel particle types, which are polysaccharide-containing transparent exopolymer particles (TEP) and proteinaceous Coomassie stainable particles (CSP), as well as numbers of bacteria attached to gel particles throughout the water column, from the surface ocean down to the bathypelagial (< 3,000 m). Our study was conducted in the Arctic Fram Strait during northern hemispheres' summer in 2015. Besides data on the bacterial colonization of the two gel particle types (TEP and CSP), we present bacterial densities on different gel particle size classes according to 12 different sampling depths at four sampling locations. Gel particles were frequently abundant at all sampled depths, and their concentrations decreased from the euphotic zone to the dark ocean. They were colonized by bacteria at all sampled water depths with risen importance at the deepest water layers, where fractions of bacteria attached to gel particles (%) increased within the total bacterial community. Due to the omnipresent bacterial colonization of gel particles at all sampled depths in our study, we presume that euphotic production of this type of organic matter may affect microbial species distribution within the whole water column in the Fram Strait, down to the deep sea. Our results raise the question if changes in the bacterial community composition and functioning on gel particles occur over depth, which may affect microbial respiration and remineralization rates of respective particles in different water layers.
Introduction
Marine organic gel particles are highly hydrated particles that contain a polymer matrix (Verdugo, 2007). They have been classified according to their main components and the dye used for identification. Two types of gel particles have gathered attention in marine ecological and biogeochemical studies, the transparent exopolymer particles (TEP), which are visualized by Alcian Blue, a dye that primarily binds to acidic carboxyl residues of polycarbohydrates (Alldredge et al., 1993), and the Coomassie stainable particles (CSP), visualized by Coomassie Brilliant Blue G, a dye that binds to alkaline amino acids in proteinaceous CSP (Long and Azam, 1996). Research on CSP is still in its infancy, which comprises that information about the origin and mode of formation is still missing for this particle class. For TEP however, it is documented that they are an ubiquitous and abundant class of organic particles in the ocean (see Passow, 2002 for review), being formed by the coagulation of dissolved or colloidal exopolymers exuded by phytoplankton in the euphotic zone (e.g., Chin et al., 1998; Passow, 2000; Passow et al., 2001; Engel et al., 2004). Being in the micrometer size range, TEP bridge the gap between dissolved and particulate organic matter pools and play a significant role in the biogeochemical cycling of organic matter in marine systems (Engel and Passow, 2001; Verdugo et al., 2004). Furthermore, TEP are considered to be an essential part of the marine carbon cycle, as they represent the sticky glue for the coagulation of particles into rapidly sinking marine snow (Logan et al., 1995; Engel, 2000; Szlosek Chow et al., 2015). Elevated TEP concentrations were shown to induce an increased vertical particle flux (Passow et al., 2001), eventually leading to a removal of biologically fixed CO2 from the surface to the deep ocean (Engel, 2002; Arrigo, 2007; Engel et al., 2014). TEP and CSP have both been recorded to serve as microhabitats and substrate for bacteria (Passow and Alldredge, 1994; Berman and Viner-Mozzini, 2001; Meiners et al., 2004; Grossart et al., 2006). The bacterial colonization of microaggregates has not only been documented for marine environments, but also for freshwater environments (compare review of Simon et al., 2002), which underlines the relevance that those particles have for aquatic systems. Bacteria play a crucial role in the degradation of particulate organic matter in the ocean and in a resupply of energy to the classical planktonic food web via the microbial loop (Azam et al., 1983). In this regard, gel particles can constitute a valuable source of bioavailable carbon and nitrogen to fuel the microbial loop in the ocean.
The present study focuses on the bacterial colonization of marine gel particles in the Arctic Fram Strait and includes ideas on the concomitant implications for organic matter cycling, which remain to be practically tested by future studies. Although vertical distributions of both, TEP and CSP, can show peaks of concentration at depths below the euphotic zone (Cisternas-Novoa et al., 2015)—which may indicate a production of those particles by heterotrophic organisms—, formation of gel particles is traditionally considered to be linked to phytoplankton production (e.g., Chin et al., 1998; Passow et al., 2001; Engel et al., 2004). We therefore hypothesized that highest concentrations of gel particles and concomitantly highest numbers of colonizing bacteria should be present within the euphotic zone. This expectation was encouraged by the sampling season during which our study was conducted, as we were sampling during a period in which the summer bloom had occurred in the Fram Strait in previous years (Nöthig et al., 2015). Furthermore, we expected to find differences between the vertical profiles of TEP concentration and CSP concentration, as well as in the bacterial colonization between the two gel particle types. Profiles of TEP and CSP concentration over depth are a result of the formation and degradation processes to which gel particles are exposed. Knowledge about CSP origin and dynamics is still not sufficiently available. Nevertheless, we expected a stronger bacterial degradation activity of CSP compared to TEP in the surface ocean. Since Coomassie Brilliant Blue G binds to alkaline amino acids in CSP, these proteinaceous gel particles by definition contain organic nitrogen—a factor often limiting microbial biomass production in the surface ocean. Thus, CSP may be an important source of nutrient remineralization in the upper ocean and strongly colonized by bacteria.
To evaluate how relevant gel particles are for the total bacterial community in the Fram Strait, a vertical comparison of free-living bacterioplankton cells (mL−1) and cells attached to gel particles (mL−1) was conducted. In this regard especially the deep ocean—which has been neglected by most previous studies—is of particular interest. When trying to evaluate on the general relevance of a particle class for the total prevailing bacterial community, it is crucial to not only include the surface ocean but also the deeper water layers—as the majority of the total ocean volume is deep sea (~80%). For example, a particle class that is very abundant and strongly colonized in the surface ocean (and thus an important habitat for the here prevailing microbial community) may be rare at depth and thus—although being individually strongly colonized—less important for the total microbial community on an overall scale.
Methods
Sampling Procedure
Samples were collected in July/August 2015 during a cruise (PS 93.2) with RV Polarstern to the Fram Strait, which represents the only deep water connection between the Central Arctic Ocean and the North Atlantic (Figure 1). We collected shallow and deep water samples at four stations within the Long-Term Ecological Research (LTER) observatory HAUSGARTEN (78. 42°N, 2.27°E and 79.50°N, 6.20°E): S3, HG4, EG4, N4 (for details see Supplementary Table S1). In addition to water samples collected by CTD casts, we collected settling aggregates with a Marine Snow Catcher which was deployed at 60 m water depth at station HG4. At all four stations, 12 CTD sampling depths were distributed throughout the whole water column, with six sampling depths within the upper 100 m and six remaining depths down to the seafloor (for details see Supplementary Table S1).
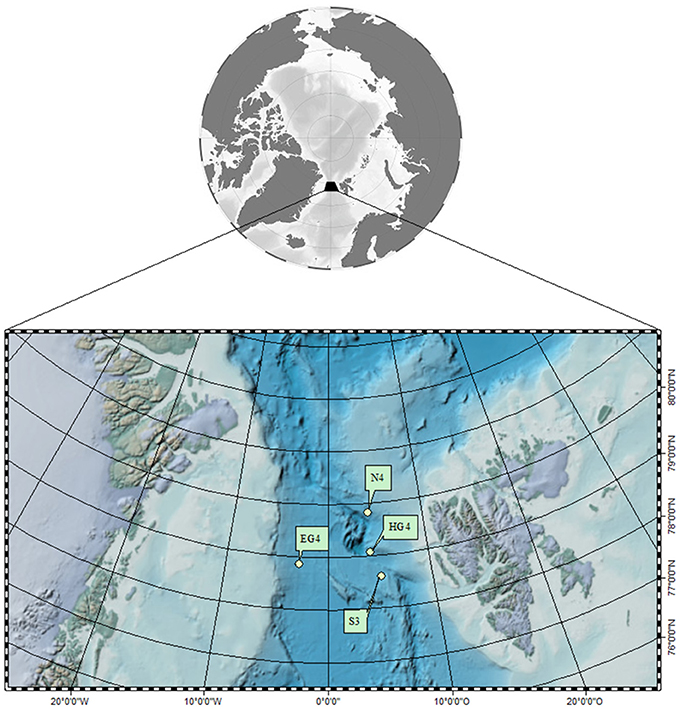
Figure 1. Location of the sampling stations in the Long-Term Ecological Research (LTER) observatory HAUSGARTEN (78. 42° N, 2.27° E and 79.50°N, 6.20°E) on a global map and a more detailed overview of the Fram Strait based on the Arctic Bathymetry Basemap (IBCAO/GEBCO_08). Stations sampled (from 24th of July until 4th of August 2015) for this project are indicated by dots (for exact positions see coordinates listed in the Supplementary Table S1). Landmasses depict Greenland and Spitsbergen, light green color marks continental shelves.
Overview of Methods Applied
We used bright-field microscopy and wide-field fluorescence microscopy to analyse numbers of bacteria attached to gel particles. Flow cytometry was used to analyse abundance of bacterioplankton (see explanation below). We applied bright-field microscopy, wide-field fluorescence microscopy and confocal laser scanning microscopy (CLSM) to analyse aggregate composition and to determine bacterial abundances associated with marine snow aggregates collected with the Marine Snow Catcher. Latter was done to shed some more light on the dynamics of both gel particle classes, especially on those of CSP, in the water column. As described before, it is documented for TEP that they can represent the sticky glue for the formation of macroaggregates, while according research on CSP is still at the very beginning. We were therefore aiming at gaining a first impression on this topic in the Arctic Fram Strait by analyzing the aggregate composition of a number of marine snow aggregates with respect to their polysaccharidic and proteinaceous content.
Bright-Field and Wide-Field Fluorescence Microscopy
To microscopically analyse gel particles and their attached bacteria, a double staining approach was applied.
Seawater samples (20–100 mL), derived from CTD casts, were immediately filtered on board under a partial vacuum (−200 mbar) onto Whatman® Nuclepore™ track-etched polycarbonate filters with a diameter of 25 mm and a pore size of 0.4 μm (GE Healthcare Life Sciences, Little Chalfont, UK). Separate filters were prepared to analyse TEP and CSP, and two replicates were produced for every sampling depth. Immediately after filtration, gel particles were stained with Alcian Blue or Coomassie Brilliant Blue G (procedure after Alldredge et al., 1993; Long and Azam, 1996). The stained, still damp filters were placed in a small Petri dish with the sample side up and frozen at −20°C.
After a storage and transportation period of about 2 months, the samples were stained with 4′,6-diamidino-2-phenylindole (DAPI; concentration: 10 μg/mL) to microscopically determine bacterial numbers attached to gel particles. Directly after staining, the samples were screened using a wide-field fluorescence microscope Zeiss Axio Scope.A1, equipped with a light source Kübler HXP 120C and a DAPI fluorescence filter set (Carl Zeiss Microscopy GmbH, Jena, Germany). In a first step, the samples were screened rapidly in the bright-field microscopy mode at low light intensities. After randomly choosing and focusing the particle(s), the system was switched to the wide-field fluorescence microscopy mode, and the DAPI fluorescence was visualized with the camera Zeiss Axio Cam MRc (Carl Zeiss Microscopy GmbH). Afterwards, the microscope settings were changed to the bright-field microscopy mode again, and a micrograph of exactly the same position and focal plane was taken (using a 100× objective). In total, 20 micrographs per sample (10 in each mode) were taken using this method. The micrographs were later on used to determine numbers of bacteria attached to gel particles and to set bacterial colonization in relation to the particle area. (For exemplary micrographs see Supplementary Material S2).
To determine gel particle abundances as well as sizes, a lower magnification was used (20× objective). In this regard, the filter was screened in the bright-field microscopy mode, in total 30 micrographs of the filter were taken with a fixed pattern (15 micrographs along the maximum distances in the x- and y-directions, respectively), and the micrographs were digitally analyzed following the method of Engel (2009). It has to be noted, that the use of a single magnification instead of combining successive magnifications can lead to an underestimation of the abundance of small particles (of ≤ a few μm in diameter) that are difficult to observe, while large particles (of ≥ several tens of μm in diameter) that occur in low concentrations might be missed (compare Mari and Kiørboe, 1996; Mari and Burd, 1998). This limitation should be kept in mind, as an accurate determination of the spectral slope can only be obtained by covering the entire size distribution. Size frequency distributions of gel particles in this study were described by a power law relation (Mari and Kiørboe, 1996):
with dN: number of particles per unit water volume
in the size range dp to [dp+d(dp)]
k : constant; depending on the particle concentration
δ: (< 0) descriptor of the distributions' spectral slope.
Both, δ and k were deduced from regressions of log[dN/d(dp)] vs. log[dp]. In this regard, it applies that the less negative δ is the less steep is the slope of the regression. This can be due to fewer small particles or more large particles—in both cases the relative importance of larger gel particles is increased. Size classes chosen in this study ranged from 1 to 33.5 μm. Size classes covered always an interval of 0.5 μm each. This constant step increase was applied because plotting of log[dN/d(dp)] against log[dp] revealed linear regressions. To calculate regression lines, a minimal number of at least 10 particles per size class was applied to prevent giving too much weight to occasional large particles. Size distributions used to calculate the spectral slope are shown in the Supplementary Material S3.
Digital Image Processing to Determine Total Abundances of Bacteria per Gel Particle (Area)
In order to determine the total abundances of bacteria per gel particle (area), the image analysis software Image J (courtesy of Wayne Rasband, National Institute of Mental Health, Bethesda, Maryland, USA; version 1.48) and the computing environment MATLAB (version R2011a) were used.
In a first step, the particle parameters (routinously area, perimeter, major, minor and ferret diameter) were determined on the bright-field micrographs and recorded. To combine the information of the bright-field micrographs (showing gel particles) and the wide-field fluorescence micrographs (showing bacteria)—which were captured at the same filter spots—, a MATLAB routine was developed, and the total abundances of bacteria per gel particle were determined. A more detailed description of the developed image processing workflow is given in the Supplementary Material S4.
Calculation of Expected Bacterial Frequencies, Densities and Fractions
We calculated the equivalent spherical diameter (ESD) from the measured gel particle areas (). Afterwards, the measured bacterial frequencies (> one bacterium per gel particle) were plotted on a log-log scale against the ESD. The number of attached bacteria was fitted to a power law relationship (Mari and Kiørboe, 1996):
with n: number of bacteria per gel particle
dp: the ESD
a, b: constants
a and b were calculated for the two pooled replicates of every depth at all stations and for both gel particle types. With the relationship described by Equation (2) and the calculated constants a and b, the expected bacterial frequencies were determined for every size class between 1 and 33.5 μm (ESD) at each depth and for all stations, as well as for both gel particle types. Size classes covered always an interval of 0.5 μm each. Using the size(of particle)-frequency(of particle) distributions obtained by Equation (1), the expected bacterial frequencies per size class (mL−1) were calculated. To obtain bacterial densities (mm−2), the expected bacterial frequencies per size class (mL−1) were summed up and divided by the total gel particles areas (mm2 mL−1) (which were determined with the 20× objective). The absolute numbers of bacteria attached to gel particles [densities (mm−2)] presented in this study might be overestimated due to a filtration artifact, as a secondary attachment of bacteria onto the gel particles might occur during the filtration procedure. According to an estimation based on bacterial counts at “empty” (i.e., no-gel particle-containing) filter spots, particle attached bacterial densities might be overestimated by ~15%. For the filters originating from the deep sampling depth (~2,000 m), the mean calculated overestimation was only 4% of the mean calculated overestimation for the shallow depth (~15 m), indicating that the problem of a probable overestimation is in particular a problem for samples deriving from shallow depths. The potential overestimation of bacteria attached to particles [densities (mm−2)] calculated in this study due to an artificial filtration of cells onto gel particles (~15% for the shallow depths) is comparable to the proportions reported by Carrias et al. (2002) (10%).
In this regard, it also has to be mentioned that on the other side, since we were determining the bacterial abundances by “two-dimensional” microscopy, based on the surface area of the respective gel particles, all bacterial numbers presented in this study may be underestimated for bacterial cells within larger, voluminous gels.
For the calculation of gel particle attached bacterial fractions, the total bacterial community (100%) was assumed to be the sum of all TEP-attached bacteria (mL−1) + all CSP-attached bacteria (mL−1) + all bacterioplankton cells determined by flow cytometry (mL−1).
Flow Cytometry
Total abundances of bacterioplankton were analyzed by flow cytometry (using BD Facs Calibur, Becton Dickinson, Franklin Lakes, USA). In this regard, several factors (such as fixative, storage time and temperature) are known to have an impact on the precision of bacterial cell enumeration, as cells can rapidly decay over time (Turley and Hughes, 1994; Parvathi et al., 2011). Therefore, in a first step, 4 mL of the seawater samples, derived from CTD casts, were fixed with 200 μL glutardialdehyde (GDA, 25%), which has been shown to be a suitable fixative (Troussellier et al., 1995). As suggested (Turley and Hughes, 1994; by Parvathi et al., 2011), the sample-containing tube was frozen in a vertical position at −20°C for a maximum of 3 months until measurement.
Thawed and prefiltered (Filcons syringe filters, 50 μm pore size) sample aliquots of 400 μL were mixed with 10 μL of a SYBR Green stock solution (10,000× concentrate in DMSO; Sigma-Aldrich Chemie GmbH, Munich, Germany). Additionally, 10 μL Fluoresbrite fluorescence microspheres (Polysciences Europe GmbH, Hirschberg an der Bergstraße, Germany) with a diameter of 1 μm were added, and the product was incubated for 5 min in the dark. Cell counting was performed at a low flow rate (~12.9 μL min−1), and the analysis of the results was performed using the software Cell Quest 3.3. The measuring volume was calculated from the counted microspheres (min−1) and the manually adjusted flow rate. Bacterioplankton cells were determined after visual inspection and manual gating of the bacterial population in the cytogram of side scatter against green fluorescence. We were only analyzing larger gel particles (> 1 μm) for attached bacterial numbers, which should not have been recorded in the cytogram as bacterioplankton cells. Nevertheless, a misclassification and therefore (minor) counting error for extraordinary large bacterioplankton cells (~1 μm) or for bacteria attached to very small gel particles (~1 μm) can not be precluded in our study.
In-Situ Chlorophyll a Data
Seawater (0.5–2 L) derived from CTD casts between 0 and 100 m was filtered onto 25-mm diameter glass fiber filters (GF/F, Whatman, Kent, UK) under a partial vacuum (−200 mbar). The filters were frozen and stored below −20°C until they were extracted in acetone and analyzed with a spectrophotometer. Pigments were extracted with 6 mL of 90% acetone. The filters with the cells were physically disrupted by employing a Precellys® 24 bead beater (Bertin Technologies, Montigny-le-Bretonneux, France) and then further extracted in the refrigerator for 2 h. Subsequently, they were centrifuged for 10 min at 5,000 rpm at 4°C prior to measurement. The chlorophyll a concentration was determined fluorimetrically (Turner Designs, San José, USA) together with the total phaeophytin concentration after acidification (HCl, 0.1 N) with slightly modified versions of the methods described by Edler (1979) and Evans et al. (1987).
Marine Snow Catcher
After collection, a total of 30 aggregates were filled in Eppendorf tubes and frozen in seawater at −20°C. After ~2 months, the aggregates were isolated from the seawater with a glass pipette. They were transferred onto Whatman®Nuclepore™ track-etched polycarbonate filters with a pore size of 0.4 μm and a diameter of 25 mm (GE Healthcare Life Sciences). Ten aggregates were stained with Alcian Blue and DAPI, and 10 aggregates were stained with Coomassie Brilliant Blue G and DAPI as described above. Several micrographs per aggregate were taken at different focal planes with bright-field microscopy as well as with wide-field fluorescence microscopy settings. Afterwards, the single micrographs were stacked using the focus stacking function of Adobe Photoshop CS6 (Adobe systems, San José, USA).
The 10 remaining aggregates were analyzed with CLSM for aggregate composition and bacterial abundance. For this, the aggregates were placed onto black Whatman®Nuclepore™ track-etched polycarbonate filters with a diameter of 25 mm and a pore size of 0.2 μm (GE Healthcare Life Sciences) and immediately stained in the dark at room temperature for 20 min with sodium bicarbonate buffer (concentration: 0.1 mol L−1) containing SYTO® 9 (concentration: 5 μmol L−1; staining of nucleic acids; Thermo Fisher Scientific GmbH, Darmstadt, Germany) and a conjugate of the lectin Concanavalin A and the fluorescent dye Alexa Fluor® 633 (concentration: 0.1 mg mL−1; staining of polysaccharides; Thermo Fisher Scientific GmbH). After the staining, the samples were thoroughly washed with sodium bicarbonate buffer (concentration: 0.1 mol L−1). Subsequently, the complete buffer solution was removed by filtration under a partial vacuum (−200 mbar), and the samples were immediately mounted on an object slide using BacLight mounting oil (Thermo Fisher Scientific GmbH) and high-precision cover slips (Carl Zeiss Microscopy GmbH). The fluorescences of the samples were visualized with a Leica TCS SP5 II CLSM system applying the objective Leica HC PL APO 20× /0.75 IMM CS2 and immersion oil (Leica Microsystems GmbH, Wetzlar, Germany). The following wavelengths were used to excite the different fluorescences, and the following fluorescence wavelength ranges were detected for the visualization: SYTO® 9 (nucleic acids): 488 nm excitation, 495–555 nm emission; Alexa Fluor® 633 (polysaccharides): 633 nm excitation, 640–680 nm emission; chlorophyll autofluorescence: 488 nm excitation, 640–740 nm emission.
Data Analysis
Statistical outputs presented in this study were produced with R (version 3.0.2; R Development Core Team, 2013), graphs also with MATLAB (version R2011a), Arc GIS (version 10.2.2) and Ocean Data View (version 4.7.1). Statistics applied included Spearman correlations between gel particle numbers and total gel particle areas for both gel particle types at all stations over depth. Pair wise comparisons of bacterial colonization were conducted (for both TEP and CSP) by Tukey and Kramer (Nemenyi) tests between the different depths at all stations. A Mann-Whitney-U test was conducted to compare bacterial colonization between the two gel particle types. Bacterial colonization was compared between the different stations using pairwise comparisons by Tukey and Kramer (Nemenyi) tests. A Mann-Whitney-U test was conducted of the bacterial colonization between “smaller” and “bigger” gel particles with data compiled from all depths and stations. For all analyses a significance level (α) of 0.05 was applied.
Results
Gel Particle Abundances and Sizes
For all stations, both gel particle types (CSP and TEP) showed a decreasing vertical depth profile in terms of particle numbers and total particle areas (Figure 2). The major decrease of total gel particle areas occurred within the upper 100 m (on average 68% ± 35% SD of the total decrease between the shallowest and the deepest sampling depth). All stations showed strong positive correlations over depth between gel particle number and total gel particle area for both gel particle types (Spearman's rank correlation coefficient r > 0.9). The correlations between total gel particle area and gel particle number were overall slightly stronger for CSP ( = 0.96) compared to TEP ( = 0.94). In the upper 100 m, gel particle number and total area were positively related to chlorophyll a concentrations at the two ice-covered stations EG4 and N4 (compare Supplementary Material S5 for sea ice maps and Supplementary Material S6 for distribution of prevailing water masses). Furthermore, highest maximal particle numbers were observed at EG4, followed by N4 (Figure 2). The same pattern with highest concentrations, as well as most pronounced peaks, at EG4 (max. 1.9 μg L−1), followed by N4 (max. 1.6 μg L−1) and lower concentrations at HG4 (max. 1.4 μg L−1) and S3 (max. 0.7 μg L−1) was observed for the measured chlorophyll a concentrations (Figure 2).
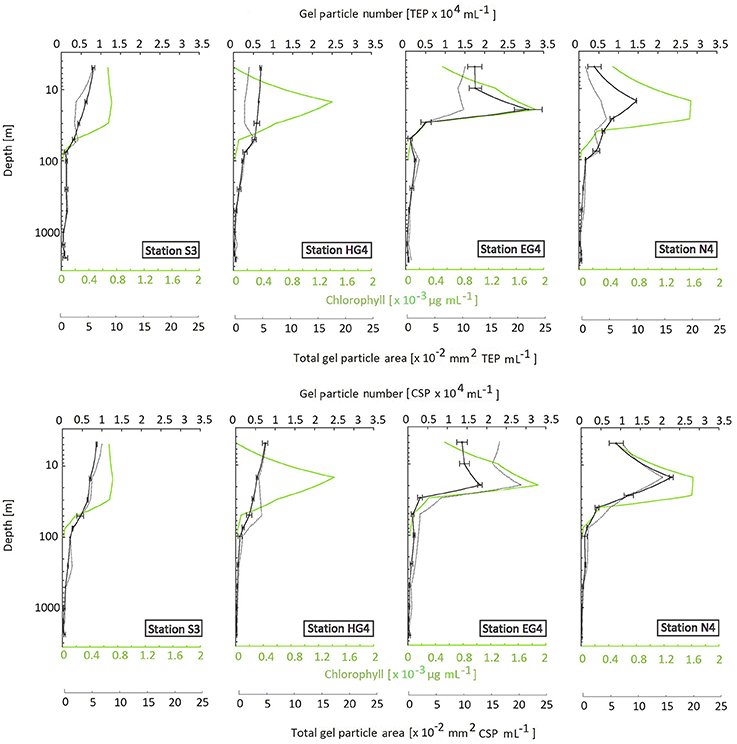
Figure 2. Vertical profiles of gel particle number (black line with errorbars that represent standard deviation of the two replicates), total gel particle area (dashed line; interpolated between sample depths) and chlorophyll a (green line). Y-axis inverse, with logarithmic scaling.
For the shallow depths (<100 m), total area (mm2 mL−1) of CSP was higher than total area of TEP with only a few exceptions (Figure 3). At deeper depths, the pattern reversed at most stations (all except S3), showing relatively higher TEP amounts in terms of total area compared to CSP.
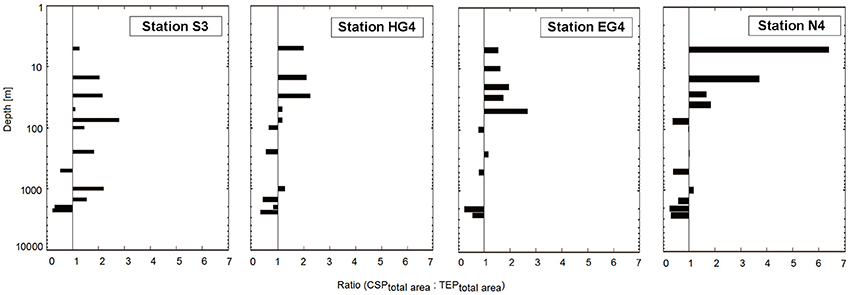
Figure 3. Barplot showing pattern of CSPtotalArea:TEPtotalArea ratio over depth for different stations. Y-axis inverse, with logarithmic scaling.
Size frequency distributions of gel particles revealed that data could be fitted well with Equation (1) (see also Supplementary Material S3 for plotted size frequency distributions and Supplementary Table S7 for information on δ).
Analysis of marine snow aggregates showed substantial amounts of TEP forming the aggregate matrix. For the restricted number of analyzed aggregates, we observed that CSP can also be associated with macroaggregates (Figure 4 and Supplementary Material S8).
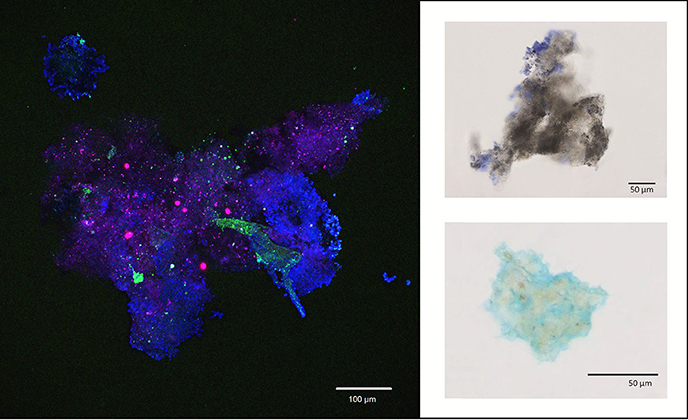
Figure 4. Left: Exemplary confocal laser scanning micrograph, showing an aggregate collected with the Marine Snow Catcher. Blue, polysaccharide-containing structures; green, structures containing nucleic acids; red, structures containing chlorophyll. Right: Aggregates (or aggregate fragments) from the Marine Snow Catcher stained with Coomassie Brilliant Blue G (staining of CSP material; upper right) or Alcian Blue (staining of TEP material; lower right).
Bacterial Colonization
Both gel particle types, TEP and CSP, were colonized by bacteria throughout the whole water column, yielding an average bacterial density over all depths, stations and particle types of 26 ± 18% SD × 104 cells mm−2. Concentrations of bacteria attached to gel particles (cells per volume of seawater [mL−1]) were calculated using the sums of total bacterial frequencies per gel particle size class (mL−1) and the calculated total gel particle areas (mL−1) (see Methods for details). In general, concentrations of free-living bacterioplankton cells as well as of bacteria attached to gel particles decreased with depth, but showed some variance in abundance with increasing depth (Figure 5). Bacterioplankton concentrations (cells per volume of seawater [mL−1]) measured by flow cytometry were approximately two orders of magnitude higher than concentrations of TEP or CSP associated bacteria, respectively.
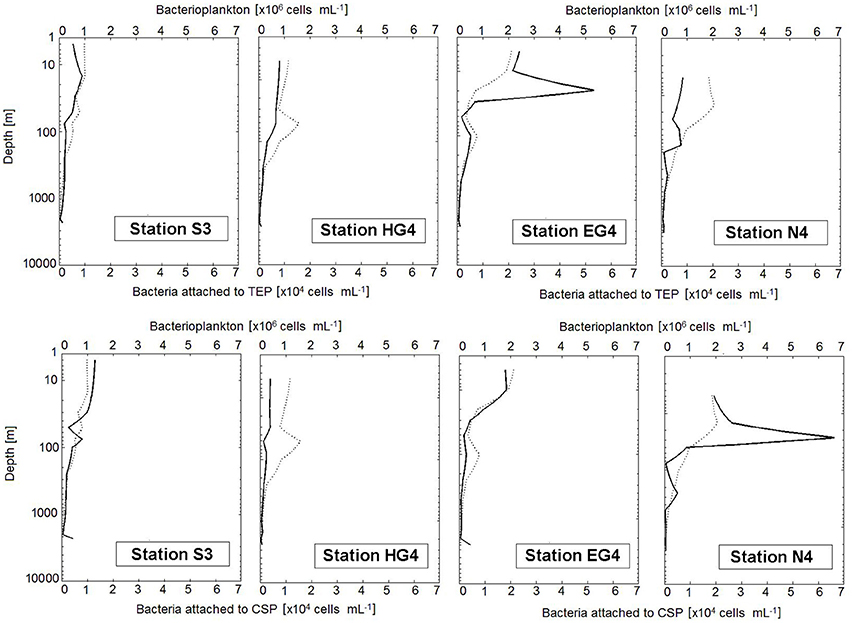
Figure 5. Vertical depth profiles of bacterial cells. The dashed line represents the interpolated behavior of the bacterioplankton curve (measured by flow cytometry). The continuous line shows bacteria attached to gel particles (determined by microscopy). Note that bacterioplankton concentrations are given in ×106 (cells per volume of seawater [mL−1]), while concentrations of bacteria attached to gel particles are scaled two orders of magnitude lower and therefore given in × 104 (cells per volume of seawater [mL−1]). Y-axis has logarithmic scaling.
At three out of the four sampled stations (HG4, EG4 and N4), bacterial densities (number per mm2) on TEP showed highest values within the upper 30 m (max = 70 × 104 cells mm−2) (Table 1). At the fourth station (S3), highest bacterial densities (number per mm2) were found at 1,000 m depth (i.e., 58 × 104 cells mm−2). Bacterial densities on CSP showed no clear pattern over depth. However, at two stations (S3 and EG4), bacterial densities on CSP (number per mm2) showed a sudden, pronounced increase at the deepest sampling depth (Table 1). Pairwise comparisons were conducted (for both gel particle types, TEP and CSP) between the different depths by Tukey and Kramer (Nemenyi) tests, which revealed no significant differences in the bacterial colonization (cells mm−2) between any of the sampling depths at any station.
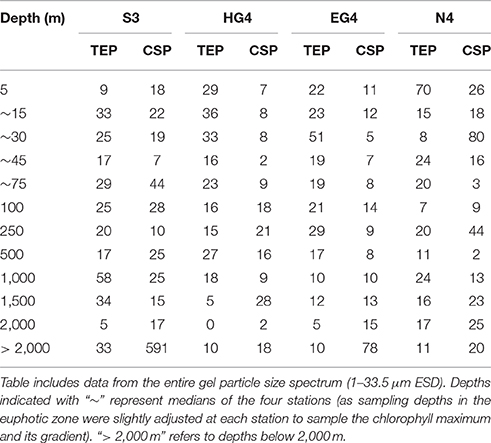
Table 1. Bacterial colonization (×104 mm−2) of the two gel particle types (TEP and CSP) over depth for all four stations.
At two stations (HG4 and EG4), bacterial densities (number per mm2) on TEP exceeded those on CSP within the epi- and mesopelagial (down to 1,000 m depth; with exception at HG4 in 100 and 250 m depth). At the two other stations, no pattern of higher bacterial densities on a certain gel particle class could be observed within the same depth range (down to 1,000 m depth). For the bathypelagic sampling depths (> 1,000 m depth), higher bacterial densities (number per mm2) were observed on CSP compared to TEP at all four stations (exception at S3 in 1,500 m depth) (Table 1). Overall (Mann-Whitney-U test between particle types with data compiled from all depths and stations), there was no statistically significant difference in the bacterial densities between TEP (median = 19 × 104 cells mm−2) and CSP (median = 15 × 104 cells mm−2) (compare with Figure 6).
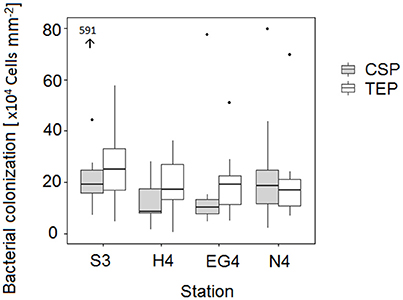
Figure 6. Difference in bacterial colonization (mm−2) between the two gel particle types (TEP and CSP), combined for all depths at the four stations. Values presented in the graph were calculated from total bacterial abundances (i.e., bacterial frequency sums per particle size classes in 1 L of seawater) and the total areas of gel particles (in 1 L of seawater). Outliers are represented by dots and also by the black arrow (the number next to the arrow indicates the respective y-value).
Pair wise comparisons of the bacterial colonization (cells mm−2) were conducted between the different stations by Tukey and Kramer (Nemenyi) tests. For CSP, bacterial overall densities at station EG4 differed significantly from station S3 (p = 0.05) (Figure 6). None of the comparisons for TEP turned out to show significant differences in the bacterial colonization (cells mm−2) between any pair of stations.
In general, there were more bacteria (cells per particle) on the larger gel particles than on the small particles (Figure 7). Bacterial numbers scaled with the gel particles' ESD rose to an exponent of ~0.6 (Figure 7; Supplementary Table S9). On small gel particles (1–10 μm ESD), however, significantly higher bacterial densities (∑cells mm−2) were found compared to larger gels (10.5–33.5 μm ESD) (Mann-Whitney-U test between “smaller” and “bigger” gel particles with data compiled from all depths and stations, p < 0.01; Figure 8).
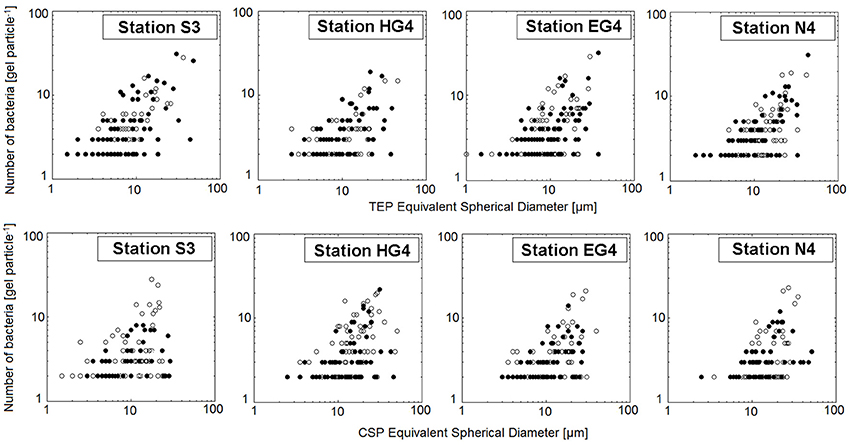
Figure 7. Size(of particle)-frequency(of bacteria)-distributions for all four stations and both gel particle classes on a log-log scale. For all 12 sampling depths both replicates are plotted (black dots and white dots indicate replicate A and replicate B, respectively).
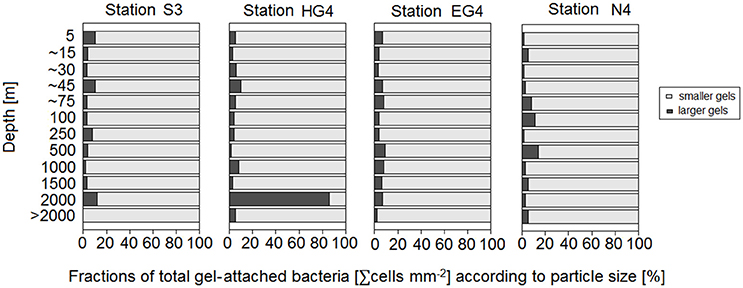
Figure 8. Percentages of total gel-attached bacteria (∑ cells mm−2) according to particle size. Smaller gels, which means 1–10 μm ESD, are depicted in light gray. Larger gels, which means 10.5–33.5 μm ESD, are shown in dark gray. Results are presented for all sampling depths and all stations. Depths indicated with “~” represent medians of the four stations (as sampling depths in the euphotic zone were slightly adjusted at each station to sample the chlorophyll maximum and its gradient). “> 2,000 m” refers to depths below 2,000 m.
The size(of particle)-frequency(of bacteria)-distributions, as well as the size(of particle)-frequency(of particle)-distributions and the total free-living bacterioplankton concentrations (mL−1) were used to estimate the fraction of total bacteria that was attached to gel particles (see Methods for more details).
Based on these calculations, on average ~3% (range 1–20%) of the total bacterial community (as defined in this study) were associated to gel particles (Figure 9). Average proportions of all four stations revealed intermediate fractions (= 2–4%) in the three shallowest sampling depths (5–~30 m water depth; within which also the chlorophyll maxima were observed at ~15 m). Albeit attached bacterial fractions were comparably high at 30 m water depth at the two stations with highest chlorophyll a concentrations (EG4 and N4). Below those depths (i.e., between ~45 and 100 m depth), attached bacterial fractions decreased to 1% on average. Interestingly, average proportions of bacteria attached to gel particles increased again below the euphotic zone (250 ≥ 2,000 m) with 2% at 250 and 500 m, 3% at 1,000 m and 4% at 1,500 m. The strongest increase in the average proportions of bacteria attached to gel particles, however, was observed between the two deepest sampling depths (i.e., 2,000 and > 2,000 m depth) from 2 to 12%, respectively (Figure 9).
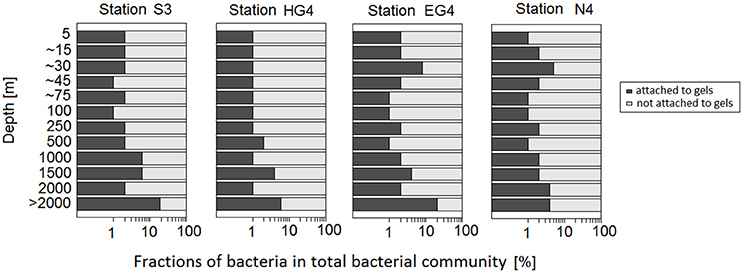
Figure 9. Fractions of bacteria in the total bacterial community (%) over depth at the four sampling stations. Dark gray bars represent data for bacteria attached to gel particles. Light gray bars represent bacterioplankton fractions. Depths indicated with “~” represent medians of the four stations (as sampling depths in the euphotic zone were slightly adjusted at each station to sample the chlorophyll maximum and its gradient). “> 2,000 m” refers to depths below 2,000 m. X-axis has logarithmic scaling.
Discussion
This study investigated the bacterial colonization of marine gel particles in the Artic Fram Strait and potential implications for organic matter cycling. We conducted an analysis of vertical gel particle distribution and bacterial colonization from the surface ocean down to the deep sea (> 2,000 m).
Gel Particle Abundances and Sizes
Both gel particle types (TEP and also CSP) were abundant throughout the whole water column of the Fram Strait, showing a decreasing vertical depth profile in terms of particle numbers and total particle areas. Loss processes of gel particles, which may lead to a decrease in particle numbers and total areas, can potentially be a degradation by bacteria, an incorporation of microaggregates into very large aggregates that escaped our analyses or a consumption by zooplankton (Passow and Alldredge, 1999). In this study, the major decrease of total gel particle areas occurred within the upper 100 m, suggesting that the responsible loss processes are most prominent in those water layers. Based on the observed chlorophyll a concentrations, we conclude that we were facing differences in the productivity and in the prevailing bloom stages at the respective stations, with highest chlorophyll a concentrations at the eastern and northern station. In the upper 100 m, gel particle number and total area were positively related to chlorophyll a concentrations at the two ice-covered stations EG4 and N4, which can be ascribed to the circumstance that, at least TEP, can originate from autotrophic production in the surface ocean (e.g., Passow, 2002). In this regard, a presence of large amounts of gel particles in the deep sea is not self-evident, because TEP are known to be neutrally buoyant or even upward floating due to their low density (e.g., Azetsu-Scott and Passow, 2004; Mari, 2008; Engel, 2009). Results of our study, showing that TEP and also CSP can be associated to marine snow aggregates, suggest that gel particles originating from the euphotic zone are transported to deeper water layers by incorporation into marine snow aggregates, which in turn may underlie disaggregation and degradation processes. On the other hand, heterotrophic activity can also produce TEP (Stoderegger and Herndl, 1999), and previous data (Cisternas-Novoa et al., 2015) seem to confirm that transparent exopolymer particles can be produced far below the euphotic zone. It remains open for future studies to identify the mechanisms that drive the vertical profiles observed in our study.
In this study, abundance of CSP in terms of its total area (mm2 mL−1) was higher than that of TEP for the shallow depths, with only a few exceptions. At the deeper depths, the pattern was converse in a way that TEP abundances in terms of total area were higher than CSP abundances, also with only a few exceptions. This can indicate for example that the recycling of CSP in the shallow water depths was more pronounced than that of TEP. On the other hand, it can also indicate that production processes of TEP in the deep ocean are higher than those of CSP, or that higher amounts of TEP compared to CSP are incorporated into marine snow aggregates which are transported to the deep ocean and disentangle on their way down.
Bacterial Colonization
In this study, both gel particle types, TEP and CSP, were colonized by bacteria throughout the whole water column. The relative numbers of bacteria attached to gel particles in the Fram Strait (with an overall mean of 3%, range: 1–20%) are slightly lower than the estimates for TEP by Schuster and Herndl 1995; 5%) as well as by Mari and Kiørboe (1996; 5%). The latter showed in their study that there can be a seasonal variation in the bacterial density on TEP. Hence, numbers presented here may differ in a different sampling season. This aspect may also explain the significant difference observed in bacterial overall densities on CSP between the two stations EG4 and S3, as those two stations were facing different bloom stages (compare above). We are not aware of any previously published studies on the bacterial colonization of gel particles that give percentages of bacteria associated to gel particles over the whole water column (to a comparable maximum water depth). Neither are we aware of any bacterial colonization data for pelagic gel particles in the Fram Strait.
Highest concentrations of bacteria attached to gel particles (cells mL−1) were observed in surface waters (≤ 100 m) at all stations and for both gel particle types. Bacterial densities (mm−2) clarify that those high concentrations in the surface waters were—at least for CSP attached bacteria—mainly due to the fact that highest gel particle concentrations (mL−1) were observed in those water depths. Bacterial densities (mm−2) on CSP showed no clear pattern over depth, while TEP showed highest values within the upper 30 m at three out of four sampled stations. Several previous studies highlighted that gel particles might serve as important carbon and nitrogen sources for Arctic bacteria (e.g., Mock and Thomas, 2005), which in turn degrade and modify the respective particles. In this study, both gel particle types (CSP and TEP) showed a generally decreasing vertical depth profile in terms of particle numbers and total particle areas, which means that the sum of loss processes had a stronger overall impact on gel particles than the sum of production processes. Although both gel particle types were colonized by bacteria, the impact that microbes play on their microhabitats cannot be given for sure within this context. We definitively need further studies to better disentangle the microbial degradation and heterotrophic production processes in regard to TEP and CSP.
In this study, abundance of free-living bacterioplankton cells as well as of bacteria attached to gel particles (mL−1) decreased with depth but showed some variance in abundance with increasing depth. An experimental approach by Grossart and Gust (2009) revealed that hydrostatic pressure changes during the sinking of surface bacteria down to 4,000 m, can generate depth-specific minima and maxima in bacterial numbers. Besides this, there are also several other possible reasons for the variance in the declining trend: Assuming that gel particles are settling, it may reflect the different conditions in the surface ocean at the time of production, as gel particles at different depths do not have the same age. Further, it can also be an indicator of different prevailing water masses at the given depths. Another explanation can be, as suggested by Riemann et al. (2000), that a significant number of bacterial taxa might hop on and off particles during sinking due to, for example, changes in nutrient supply or grazing pressure. A rapid exchange between attached and free-living bacteria, with a typical residence time of bacteria on aggregates of only 3 h, has also been proposed by Kiørboe et al. (2002). In addition, growth and interspecific interactions among microbes have been shown to be essential variables for an evaluation of the bacterial colonization of marine particles (Grossart et al., 2003), as well as bacterial motility (Kiørboe et al., 2002).
Average proportions of bacteria attached to gel particles in our study were decreasing (from 2–4 to 1–2%) below the chlorophyll maximum and thereafter stayed constant down to the mesopelagic zone (~500 m). This suggests that main colonization activities (i.e., attachment of bacteria to particles) occur in the uppermost water layers where highest abundances of bacterioplankton and gel particles prevail. This is consistent with recent studies on the bacterial colonization of marine aggregates (e.g., Thiele et al., 2014) showing that the microbial community found on organic particles from deep water layers seemed to be “inherited” from that present at the chlorophyll autofluorescence maximum. Interestingly, average proportions of bacteria attached to gel particles increased again at the deepest sampling depths with 3% at 1,000 m and 4% at 1,500 m and the strongest increase between the two deepest sampling depths (i.e., 2,000 and > 2,000 m depth) from 2 to 12% (compare interpretation of this result given in the last sentences of the next paragraph).
In this study, we observed more bacteria (cells per particle) on the larger gel particles than on the small gel particles. This pattern existed at all stations and can be reasonably explained because large gel particles provide a larger colonization area for bacteria than small gel particles. On small gel particles (1–10 μm ESD), however, significantly higher bacterial densities (∑cells mm−2) were found compared to larger gel particles (10.5–33.5 μm ESD). A similar relationship of decreasing bacterial densities (per area TEP) with increasing length of TEP has been also observed by previous studies (e.g., Passow and Alldredge, 1994).
Overall, there was no statistically significant difference in the bacterial densities observed between TEP (median = 19 × 104 cells mm−2) and CSP (median = 15 × 104 cells mm−2). This is in contrast to the results of a study in euphotic freshwater (Berman and Viner-Mozzini, 2001) that observed higher bacterial densities (~3- to 10-fold) on CSP compared to TEP. Bacterial overall densities on TEP were comparably high as those determined by Passow and Alldredge (1994). In our study, at half of the sampled stations, bacterial densities (number per mm2) on TEP exceeded those on CSP within the epi- and mesopelagial (down to 1,000 m depth; with few exceptions). On the contrary, for the bathypelagic sampling depths (> 1,000 m depth) higher bacterial densities (number per mm2) were observed on CSP compared to TEP at all four stations (with one exception at a single sampling depth at one station). Carrias et al. (2002) found significant differences in bacterial colonization between particle types and, therefore, suggested that bacterial colonization is a function of the nature of the particle. As we are still lacking sufficient information to compare the particle characteristics and compositions of TEP and CSP, we can currently not say if this suggestion explains the depth-related pattern in bacterial colonization of TEP vs. CSP we observed in this study. Whether a certain gel particle type promotes passive colonization will also remain to be figured out by future experiments. TEP are known to be very sticky (e.g., Passow, 2002) but for CSP this aspect is not yet sufficiently evaluated (Cisternas-Novoa et al., 2015). It will also be interesting for future studies to see if bacterial (degradation or production) activity is higher on a specific gel particle type. In our study, we noticed no significantly higher overall bacterial colonization (mm−2) of CSP although total areas of CSP (mm2 mL−1) overall declined stronger over depth than total areas of TEP. Previous studies have observed particle attached bacteria to be more metabolically active than free-living ones (e.g., Grossart et al., 2007). For TEP, it is documented that those particles are a site for sorption of nutrients and trace metals such as manganese and iron (Beauvais et al., 2003) and therewith fulfill important enrichment functions. Dang and Lovell (2000) suggested that the ability to colonize particles provides bacteria with relevant advantages, including increased access to nutrients, the maintenance of extracellular enzyme activities, grazing protection against nanoflagellates and shelter from predation in general. Our results reveal that in this regard gel particles are especially relevant for the bacterial community in the bathypelagial where fractions (%) of the total bacterial community attached to gel particles increased, while fractions of “free” living bacterial cells decreased.
Outlook and Conclusion
For the future Arctic Ocean, the importance of gel particles is expected to increase, as phytoplanktonic exudation of dissolved organic precursor material has been shown to be enhanced by warming and in high CO2 environments (Arrigo, 2007; Engel et al., 2011). To further evaluate on possible concomitant impacts on the organic matter cycling, a continuation of regular studies in the Fram Strait is thus highly relevant. For future studies it will also be interesting to evaluate in more detail on the diversity and function of bacteria attached to gel particles in the transition zone between the North Atlantic Ocean and the Arctic Ocean.
We conclude that both gel particle types (CSP and TEP) represent a microenvironment for bacteria at all examined water depths in the study region as well as a potential transport vehicle for bacterial community exchange between the surface and the deep ocean.
Author Contributions
KB conducted the study, analyzed the data and wrote the manuscript. AE, SE and KB designed the study. MI, JM and EN provided material and data. All authors contributed to writing of the manuscript.
Funding
This work was financed by institutional funds of the GEOMAR Helmholtz Centre for Ocean Research Kiel and the Alfred Wegener Institute Helmholtz Centre for Polar and Marine Research (partially by grant number AWI_PS93.2_00).
Conflict of Interest Statement
The authors declare that the research was conducted in the absence of any commercial or financial relationships that could be construed as a potential conflict of interest.
The reviewer J-FC and handling Editor declared their shared affiliation, and the handling Editor states that the process nevertheless met the standards of a fair and objective review.
Acknowledgments
We thank Tania Klüver, Liz Bonk, Nadine Knüppel and Christiane Lorenzen for technical support in the laboratory with our flow cytometry and chlorophyll samples. Christian Konrad and Helga van der Jagt gave valuable technical assistance regarding sampling and extraction of the marine snow aggregates onboard. Thanks to Lena Jaschke for her support regarding programming of the basic loop in the developed MATLAB routine. We also thank Judith Piontek, Carolina Cisternas-Novoa and Ute Hentschel Humeida for well-grounded statements and inspiring discussions. Comments of the two reviewers improved the manuscript substantially. We greatly acknowledge the captain and crew of RV Polarstern for their support during the cruise.
Supplementary Material
The Supplementary Material for this article can be found online at: http://journal.frontiersin.org/article/10.3389/fmars.2017.00166/full#supplementary-material
References
Alldredge, A. L., Passow, U., and Logan, B. E. (1993). The abundance and significance of a class of large, transparent organic particles in the ocean. Deep Sea Res. 40, 1131–1140. doi: 10.1016/0967-0637(93)90129-Q
Azam, F., Fenchel, T., Field, J. G., Gray, J. S., Meyer-Reil, L., and Thingstad, F. (1983). The ecological role of water-column microbes in the sea. Mar. Ecol. Prog. Ser. 10, 257–263. doi: 10.3354/meps010257
Azetsu-Scott, K., and Passow, U. (2004). Ascending marine particles: significance of transparent exopolymer particles (TEP) in the upper ocean. Limnol. Oceanogr. 3, 741–748. doi: 10.4319/lo.2004.49.3.0741
Beauvais, S., Pedrotti, M. L., Villa, E., and Lemée, R. (2003). Transparent exopolymer particle (TEP) dynamics in relation to trophic and hydrological conditions in the NW Mediterranean Sea. Mar. Ecol. Prog. Ser. 262, 97–109. doi: 10.3354/meps262097
Berman, T., and Viner-Mozzini, Y. (2001). Abundance and characteristics of polysaccharide and proteinaceous particles in Lake Kinneret. Aquat. Microb. Ecol. 24, 255–264. doi: 10.3354/ame024255
Carrias, J. F., Serre, J. P., Sime-Ngando, T., and Amblard, C. (2002). Distribution, size, and bacterial colonization of pico and nano-detrital organic particles (DOP) in two lakes of different trophic status. Limnol. Oceanogr. 47, 1202–1209. doi: 10.4319/lo.2002.47.4.1202
Chin, W.-C., Orellana, M. V., and Verdugo, P. (1998). Spontaneous assembly of marine dissolved organic matter in polymer gels. Nature 391, 568–572. doi: 10.1038/35345
Cisternas-Novoa, C., Lee, C., and Engel, A. (2015). Transparent exopolymer particles (TEP) and Coomassie stainable particles (CSP): differences between their origin and vertical distributions in the ocean. Mar. Chem. 175, 56–71. doi: 10.1016/j.marchem.2015.03.009
Dang, H., and Lovell, C. R. (2000). Bacterial primary colonization and early succession on surfaces in marine waters as determined by amplified rRNA gene restriction analysis and sequence analysis of 16S rRNA genes. Appl. Environ. Microbiol. 66, 467–475. doi: 10.1128/AEM.66.2.467-475.2000
Edler, L. (1979). Recommendations on Methods for Marine Biological Studies in the Baltic Sea–Phytoplankton and Chlorophyll, Vol. 5. Uppsala: University of Stockholm.
Engel, A. (2000). The role of transparent exopolymer particles (TEP) in the increase in apparent particle stickiness (alpha) during the decline of a diatom bloom. J. Plankton Res. 22, 485–497. doi: 10.1093/plankt/22.3.485
Engel, A. (2002). Direct relationship between CO2 uptake and transparent exopolymer particles production in natural phytoplankton. J. Plankton Res. 24, 49–53. doi: 10.1093/plankt/24.1.49
Engel, A. (2009). “Determination of marine gel particles,” in Practical Guidelines for the Analysis of Seawater, ed O. Wurl (Boca Raton, FL: CRC Press), 125–142.
Engel, A., Händel, N., Wohlers, J., Lunau, M., Grossart, H. P., Sommer, U., et al. (2011). Effects of sea surface warming on the production and composition of dissolved organic matter during phytoplankton blooms: results from a mesocosm study. J. Plankton Res. 33, 357–372. doi: 10.1093/plankt/fbq122
Engel, A., and Passow, U. (2001). Carbon and nitrogen content of transparent exopolymer particles (TEP) in relation to their Alcian blue adsorption. Mar. Ecol. Prog. Ser. 219, 1–10. doi: 10.3354/meps219001
Engel, A., Piontek, J., Grossart, H. P., Riebesell, U., Schulz, K. G., and Sperling, M. (2014). Impact of CO2 enrichment on organic matter dynamics during nutrient induced coastal phytoplankton blooms. J. Plankton Res. 36, 641–657. doi: 10.1093/plankt/fbt125
Engel, A., Thoms, S., Riebesell, U., Rochelle-Newall, E., and Zondervan, I. (2004). Polysaccharide aggregation as a potential sink of marine dissolved organic carbon. Nature 428, 929–932. doi: 10.1038/nature02453
Evans, C. A., O'Reily, J. E., and Thomas, J. P. (1987). A Handbook for Measurement of Chlorophyll a and Primary Production. Texas, TX: A & M University, College Station.
Grossart, H.-P., Czub, G., and Simon, M. (2006). Algae–bacteria interactions and their effects on aggregation and organic matter flux in the sea. Environ. Microbiol. 8, 1074–1084. doi: 10.1111/j.1462-2920.2006.00999.x
Grossart, H.-P., and Gust, G. (2009). Hydrostatic pressure affects physiology and community structure of marine bacteria during sinking to 4000m: an experimental approach. Mar. Ecol. Prog. Ser. 390, 97–104. doi: 10.3354/meps08201
Grossart, H.-P., Kiørboe, T., Tang, K., and Ploug, H. (2003). Bacterial colonization of particles: growth and interactions. Appl. Environ. Microbiol. 69, 3500–3509. doi: 10.1128/AEM.69.6.3500-3509.2003
Grossart, H.-P., Tang, K. W., Kiørboe, T., and Ploug, H. (2007). Comparison of cell-specific activity between free-living and attached bacteria using isolates and natural assemblages. FEMS Microbiol. Lett. 266, 194–200. doi: 10.1111/j.1574-6968.2006.00520.x
Kiørboe, T., Grossart, H.-P., Ploug, H., and Tang, K. (2002). Mechanisms and rates of bacterial colonization of sinking aggregates. Appl. Environ. Microbiol. 68, 3996–4006. doi: 10.1128/aem.68.8.3996-4006.2002
Logan, B. E., Passow, U., Alldredge, A. L., Grossart, H. P., and Simon, M. (1995). Rapid formation and sedimentation of large aggregates is predictable from coagulation rates (half lives) of transparent exopolymer particles (TEP). Deep Sea Res. 42, 203–214. doi: 10.1016/0967-0645(95)00012-f
Long, R. A., and Azam, F. (1996). Abundant protein-containing particles in the sea. Aquat. Microb. Ecol. 10, 213–221. doi: 10.3354/ame010213
Mari, X. (2008). Does ocean acidification induce an upward flux of marine aggregates? Biogeosciences 5, 1023–1031. doi: 10.5194/bg-5-1023-2008
Mari, X., and Burd, A. (1998). Seasonal size spectra of transparent exopolymeric particles (TEP) in a coastal sea and comparison with those predicted using coagulation theory. Mar. Ecol. Prog. Ser. 163, 63–76. doi: 10.3354/meps163063
Mari, X., and Kiørboe, T. (1996). Abundance, size distribution and bacterial colonization of transparent exopolymeric particles (TEP) during spring in the Kattegat. J. Plankton Res. 18, 969–986. doi: 10.1093/plankt/18.6.969
Meiners, K., Brinkmeyer, R., Granskog, M. A., and Lindfors, A. (2004). Abundance, size distribution and bacterial colonization of exopolymer particles in Antarctic sea ice (Bellingshausen Sea). Aquat. Microb. Ecol. 35, 283–296. doi: 10.3354/ame035283
Mock, T., and Thomas, D. N. (2005). Recent advances in sea-ice microbiology. Environ. Microbiol. 7, 605–619. doi: 10.1111/j.1462-2920.2005.00781.x
Nöthig, E. M., Bracher, A., Engel, A., Metfies, K., Niehoff, B., Peeken, I., et al. (2015). Summertime plankton ecology in Fram Strait - a compilation of long- and short-term observations. Polar Res. 34:1. doi: 10.3402/polar.v34.23349
Parvathi, A., Radhakrishnan, S., Sajila, M. P., and Jacob, B. (2011). Study of changes in bacterial and viral abundance in formaldehyde-fixed water samples by epifluorescence microscopy. Environ. Monit. Assess. 177, 227–231. doi: 10.1007/s10661-010-1629-7
Passow, U. (2000). Formation of transparent exopolymer particles, TEP, from dissolved precursor material. Mar. Ecol. Prog. Ser. 192, 1–11. doi: 10.3354/meps192001
Passow, U. (2002). Transparent exopolymer particles (TEP) in aquatic environments. Prog. Oceanogr. 55, 287–333. doi: 10.1016/S0079-6611(02)00138-6
Passow, U., and Alldredge, A. L. (1994). Distribution, size and bacterial colonization of transparent exopolymer particles (TEP) in the ocean. Mar. Ecol. Prog. Ser. 113, 185–198. doi: 10.3354/meps113185
Passow, U., and Alldredge, A. L. (1999). Do transparent exopolymer particles (TEP) inhibit grazing by the euphausiid Euphausia pacifica? J. Plankton Res. 21, 2203–2217. doi: 10.1093/plankt/21.11.2203
Passow, U., Shipe, R. F., Murray, A., Pak, D. K., Brzezinski, M. A., and Alldredge, A. L. (2001). The origin of transparent exopolymer particles (TEP) and their role in the sedimentation of particulate matter. Cont. Shelf Res. 21, 327–346. doi: 10.1016/S0278-4343(00)00101-1
R Development Core Team (2013). R: A Language and Environment for Statistical Computing. Vienna: R Foundation for Statistical Computing. Available online at: http://www.R-project.org
Riemann, L., Steward, G. F., and Azam, F. (2000). Dynamics of bacterial community composition and activity during a mesocosm diatom bloom. Appl. Environ. Microbiol. 66, 578–587. doi: 10.1128/AEM.66.2.578-587.2000
Schuster, S., and Herndl, G. J. (1995). Formation and significance of transparent exopolymeric particles in the northern Adriatic Sea. Mar. Ecol. Prog. Ser. 124, 227–236.
Simon, M., Grossart, H.-P., Schweitzer, B., and Ploug, H. (2002). Microbial ecology of organic aggregates in aquatic ecosystems. Aquat. Microb. Ecol. 28, 175–211. doi: 10.3354/ame028175
Stoderegger, K. E., and Herndl, G. J. (1999). Production of exopolymer particles by marine bacterioplankton under contrasting turbulence conditions. Mar. Ecol. Prog. Ser. 189, 9–16. doi: 10.3354/meps189009
Szlosek Chow, J., Lee, C., and Engel, A. (2015). The influence of extracellular polysaccharides, growth rate, and freecoccoliths on the coagulation efficiency of Emiliania huxleyi. Mar. Chem. 175, 5–17. doi: 10.1016/j.marchem.2015.04.010
Thiele, S., Fuchs, B. M., Amann, R., and Iversen, M. H. (2014). Colonization in the photic zone and subsequent changes during sinking determines bacterial community composition in marine snow. Appl. Environ. Microbiol. 81, 1463–1471. doi: 10.1128/AEM.02570-14
Troussellier, M., Courties, C., and Zettelmaier, S. (1995). Flow cytometric analysis of coastal lagoon bacterioplankton and picophytoplankton: fixation and storage effects. Estuar. Coast Shelf Sci. 40, 621–633. doi: 10.1006/ecss.1995.0042
Turley, C. M., and Hughes, D. J. (1994). Effect of storage temperature on enumeration of epifluorescence-detectable bacterial cells in preserved seawater samples. J. Mar. Biol. Assoc. U.K. 74, 259–262. doi: 10.1017/S0025315400035827
Verdugo, P. (2007). Dynamics of marine biopolymer networks. Polym. Bull. 58, 139–143. doi: 10.1007/s00289-006-0615-2
Keywords: gel particles, TEP, CSP, bacteria, organic matter, Fram Strait, HAUSGARTEN
Citation: Busch K, Endres S, Iversen MH, Michels J, Nöthig E-M and Engel A (2017) Bacterial Colonization and Vertical Distribution of Marine Gel Particles (TEP and CSP) in the Arctic Fram Strait. Front. Mar. Sci. 4:166. doi: 10.3389/fmars.2017.00166
Received: 18 October 2016; Accepted: 15 May 2017;
Published: 12 June 2017.
Edited by:
Télesphore Sime-Ngando, Centre National de la Recherche Scientifique (CNRS), FranceReviewed by:
Xavier Mari, Institute of Research for Development, FranceJean-François Carrias, Centre National de la Recherche Scientifique (CNRS), France
Copyright © 2017 Busch, Endres, Iversen, Michels, Nöthig and Engel. This is an open-access article distributed under the terms of the Creative Commons Attribution License (CC BY). The use, distribution or reproduction in other forums is permitted, provided the original author(s) or licensor are credited and that the original publication in this journal is cited, in accordance with accepted academic practice. No use, distribution or reproduction is permitted which does not comply with these terms.
*Correspondence: Anja Engel, YWVuZ2VsQGdlb21hci5kZQ==