 James R. Foley*
 Miwa Takahashi
- Department of Research and Monitoring, Toledo Institute for Development and Environment, Punta Gorda, Belize
Queen conch (Lobatus gigas) is an important food source and export product for Belize, where extraction is regulated by shell length (SL) and market clean weight (MCW) limits. However, lip thickness (LT) limits are used to manage juvenile mortality and reduce risk of growth overfishing in other countries. Empirical studies suggest relationships between LT and sexual maturity vary spatially and need to be determined locally. This study was conducted to determine the most reliable, easily measurable proxy indicator(s) of maturity and associated target size limits in L. gigas that can effectively restrict harvest of juveniles. Morphological measures (SL, LT, lip width, unprocessed meat weight, MCW, operculum dimensions), gonadosomatic index (GSI) and histological evaluations were recorded from L. gigas collected in PHMR before, during, and after the L. gigas closed season. Upon determining Period 2 (during closed season) as the peak reproductive period, relationships between these variables in Period 2 were examined. No relationship was found in males between SL and maturity, and was weak in females, whereas there were significant curvilinear relationships between LT and GSI for both sexes, suggesting urgent need to base size limits on LT not SL. LT at which 50% of the population was mature (LT50) was 15.51 mm for females and 12.33 mm for males, therefore a 16 mm LT limit is recommended. MCW of female L. gigas was also significantly related to GSI, indicating MCW may be an appropriate management tool in conjunction with LT as it can be measured at landing sites whereas shells are usually discarded at sea. However, MCW at which 50% of females were mature (MCW50) was 199 g and many individuals exceeding LT50 had MCW <199 g, suggesting the current 85 g MCW limit is too low to protect juveniles yet 199 g MCW limit would be too high to substitute the recommended LT limit at landing sites. To minimize short-term impacts yet maximize long-term benefits to fishers' livelihoods, multi-stage adaptive management is recommended that integrates initial catch reductions, followed by introduction of size limits of 16 mm LT, and 150 g MCW. Adjustable LT and MCW limits determined by fishery simulation could later be introduced.
Introduction
Accurate information on life history traits of target fishery species is critical to developing effective management strategies. It is estimated that more than 80% of fisheries worldwide lack sufficient data to employ stock assessments to determine effective harvest control rules (Costello et al., 2012), while 29% of studied fish stocks in the world are defined as overexploited, depleted, or recovering from depletion (FAO, 2014). Inadequate management, mainly as a result of insufficient knowledge of life history characteristics and poor data quality, is largely responsible for the poor state of fisheries worldwide (Beddington et al., 2007). The fisheries of Queen conch (Lobatus gigas) are no exception. This large gastropod, found throughout the Caribbean, has long been an important local food source and economically important export product for many Caribbean coastal nations (Randall, 1964; Stoner et al., 2012c). Once prevalent throughout the Caribbean, L. gigas has been fished to a degree where its fisheries in many regions are no longer viable (Thiele, 2005; Stoner et al., 2012a). Late maturity (3–4 years) (Appeldoorn, 1988) and ease with which L. gigas can be found and collected compared with other target species make this species particularly susceptible to overfishing.
Until 2013, Port Honduras Marine Reserve (PHMR) in southern Belize enjoyed a relatively stable population of L. gigas. Unfished densities in both Replenishment Zones (no-take areas) and General Use Zones (controlled fishing areas) observed since 2009 were continuously above the minimum density threshold of 88 ha−1 (Foley, 2016, unpublished.) recommended by the Belize Fisheries Department (BFD; McDonald et al., 2017). Its fishery is currently regulated by a ≥17.8 cm national shell length (SL) limit and ≥85 g market clean weight (MCW) limit, a 3-month closed season from 1st July to 30th September (presumed reproductive season), a ban on the use of SCUBA, and permanent protection in Replenishment Zones. International trade in L. gigas is regulated due to its inclusion in Appendix II of CITES (Daves and Fields, 2004). Despite fisheries dependent catch surveys between 2009 and 2012 indicating that fishers using PHMR were adhering to the regulations, the sustainability of L. gigas extraction in PHMR is of serious concern. Unfished density of L. gigas in PHMR has been continuously declining, and fell to below 88 ha−1 in 2013 for the first time since monitoring began in 2009. It further declined to <56 ha−1 in 2014 (Foley, 2016, unpublished.), below which mating has been found not to occur due to the “Allee effect” (Stoner and Ray-Culp, 2000; Stoner et al., 2012b). These surveys also provide evidence of recurrent diminished recruitment in PHMR in recent years, as long-standing trends of higher densities after closed seasons in both Replenishment Zones and General Use Zones of PHMR have ceased since 2013 (Foley, 2016, unpublished).
These indications of overfishing of L. gigas in PHMR suggest that the current SL-based size limit that has been in force in Belize since 1978 (Acosta, 2006) may be unsuitable. Tagging studies have identified lip thickness (LT) to be far more reliable as a proxy indicator of reproductive maturity than SL (Avila-Poveda and Baqueiro-Cárdenas, 2006; Stoner et al., 2012c), with estimates of between 5 and 12 mm LT and above being considered mature (Appeldoorn, 1988; Stoner and Sandt, 1992; Gascoigne and Lipcius, 2004; Stoner et al., 2012c). Previous studies have shown that sexual maturity is reached after lip formation (e.g., Appeldoorn, 1988). After the lip flares, L. gigas stop growing in SL but continue to deposit shell material on the inside of the lip (Egan, 1985; Appeldoorn, 1988; Clerveaux et al., 2005). Because SL is not a good proxy for maturity, Belize's minimum SL limit is not likely achieving the intended management objective of protecting immature L. gigas from harvest (Avila-Poveda and Baqueiro-Cárdenas, 2006), which may explain the observed decline in L. gigas density in PHMR. Indeed, this decline coincided with the decrease in the proportion of PHMR L. gigas catch with LTs more than the minimum LT maturity thresholds (12 and 9 mm for females and males respectively) recommended by Stoner et al. (2012c) from 70.8% in 2009 to 10.6% in 2012 (Foley, 2013, unpublished.). Continuous decline in overall density and proportion of matured L. gigas (with thicker LT) in PHMR is the typical indication of growth overfishing, which can have serious and irreversible consequences for the population by reducing the likelihood of L. gigas encountering a mate (Delgado et al., 2004). This can lead to increasing recruitment failure and potentially the collapse of the PHMR fishery if not monitored closely and managed appropriately. Therefore, there is an urgent need to identify accurate proxy indicator(s) for maturity of L. gigas in PHMR and revise current size limit regulations.
Relationships between LT and maturity vary between habitat types on local and regional levels (Appeldoorn, 1988; Stoner and Schwarte, 1994). In PHMR, L. gigas fishing is concentrated in relatively shallow water (<10 m) on seagrass meadows, sand-algal flats, and coral reefs. PHMR is a highly dynamic inshore environment with substantial freshwater input from several major watersheds, giving rise to different habitats and thus foraging success and dietary habits in comparison to those from previous studies. The only known histological evaluations in Belize showed that first maturity in L. gigas (LTmin) occurred at 4 mm LT for females and 3 mm LT for males (Egan, 1985). However, this study is over 30 years old, and conducted in the Boca Chica region of northern coastal Belize. While there are some similarities with substrate type between Boca Chica and PHMR, Egan's (1985) description suggests lower freshwater input and therefore less terrestrial nutrient input compared with PHMR. Additionally, local fishers have observed morphological differences in shells of L. gigas from the nearby barrier reef habitats in Sapodilla Cayes Marine Reserve, which tend to be smaller and stockier in general than those in PHMR, further emphasizing that results from previous studies in other areas cannot be reliably applied to L. gigas in PHMR.
Reproductive periods of L. gigas also vary in timing and duration in different regions of the Caribbean, spanning between a 4 and 9 months period between April and October, but most often between June and September (Avila-Poveda and Baqueiro-Cárdenas, 2009). In general, reproductive seasons are shorter in northern regions of the distribution range of L. gigas (e.g., Florida), and become longer with decreasing latitude toward the equator (e.g., Colombia; FAO, 2007). Belize is located approximately in the middle of this latitudinal distribution range and therefore L. gigas in this region are likely to spawn during the most common spawning season (June-September). The only known study of seasonality of reproductive activity of L. gigas in Belize indicated that some reproductive activity occurs year round, but with considerable variability (Egan, 1985). Peak reproductive season needs to be assessed to determine effectiveness of the current closed season in protecting reproductive activity of L. gigas in Belize.
This study aimed to determine the peak reproductive season, the most reliable proxy indicator(s) of sexual maturity, and minimum and target size limits of these indicators for L. gigas in PHMR in order to assess the efficacy of current management tools. Recommendations for revisions and alterations to current management regulations were then made based on observations in this study, that are more likely to achieve long-term sustainability of the L. gigas fishery in PHMR, while meeting economic needs of fishers and associated livelihoods. The Belize Science Team, which consists of scientists and marine protected area (MPA) managers from BFD, partnering academic institutions and non-governmental organizations (NGOs), has collaborated to develop a national-level Adaptive Management Framework (AMF; McDonald et al., 2017) for commercial fisheries in Belize including that of L. gigas. AMF synthesizes data collected by MPA research staff and feedback from stakeholders to adjust management strategies in order to achieve desired sustainability outcomes. Results of this study are intended for use in conjunction with PHMR fisheries-dependent and fisheries-independent data to inform the development and implementation of the AMF, in which indicators such as observed LT can be evaluated relative to target reference points. This will drive management actions aimed at maintaining the indicators near target levels (McDonald et al., 2017).
Materials and Methods
Site Description and Sample Collection
L. gigas were collected around the Snake Cayes and Moho Caye in the General Use Zone of PHMR at depths between 5 and 15 m (Figure 1). These areas cover ~25% of PHMR, and are known by local fishers as good conch fishing grounds. Reefs at the sampling sites comprise a series of distinct flat-topped, platykurtic-shaped banks rising to ~5–8 m depth, capped with sparse seagrass, gorgonians and small coral patches. These are fringed with denser coral at the bank edges to ~10 m depth, and flanked by calcareous sandy slopes below ~10 m extending down to much larger surrounding isotropic interstitial mudflats ranging between 15 and 25 m depth. Samples were collected during three distinct seasonal periods in order to determine the peak reproductive period as well as size-maturity and size-reproductive output relationships; Period 1 (late open season) was from February to March 2015, Period 2 (closed season & presumed reproductive season) was from July to September 2015, and Period 3 (early open season) was in November and December 2015. Sample collection was carried out over four individual day trips during each Period. During open season (Periods 1 and 3), research staff accompanied local fishers harvesting conch for sample collections. Samples collected during the closed season (Period 2) or samples under the SL size limit (17.8 cm) were obtained by research staff under special permission from BFD.
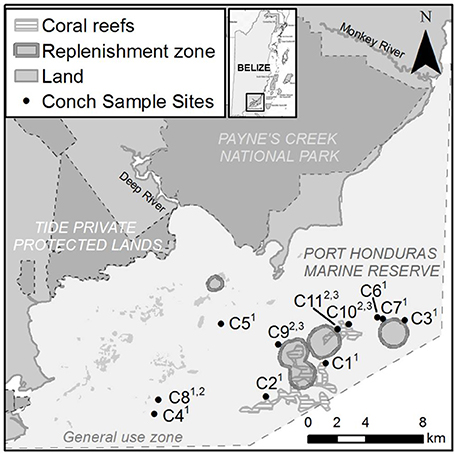
Figure 1. Map showing L. gigas collection sites C1-C11 in General Use Zone of PHMR over three Periods in 2015; Period 1 (January–March), Period 2 (July–September), Period 3 (November–December). Numbers in superscript adjacent to each site name indicate sampling periods.
Field Data Collection
Entire soft tissue was carefully removed from the shell, ensuring not to damage the posterior end of the animal. LT (the thickest region of the flared lip), lip width (LW) (widest point between flared lip and main shell at spire end of shell), operculum length (OL) and operculum width (OW) were measured to the nearest 0.1 mm using calipers. OL was not measured when eroded. SL was recorded as the distance from the shell spire to the end of the siphonal canal using a ruler to the nearest 1 mm. Sex was determined by visual inspection of the gonads (pinkish orange color in males, creamy color in females), and from recognition of secondary sexual characteristics; a verge in males or a genital groove in females (Reed, 1995a,b). Unprocessed weight (UW) (whole body weight excluding shell) was weighed to the nearest 1 g using an electronic balance. Gonads, digestive organs, tough skin around the meat, and operculum were removed and market-clean weight (MCW) was recorded to the nearest 1 g. A 1 cm3 piece of gonadal tissue was preserved in 10% buffered formalin in an airtight container for further histological processing within 3 h of removal from the shell. Remaining parts of gonads, with stomachs and digestive glands attached were stored in labeled bags in a freezer. Frozen gonads were later defrosted and cleaned by separating from the stomach and digestive gland using a surgical blade. Cleaned gonad weight was recorded to the nearest 0.01 g.
Histological Preparation
The 1 cm3 gonad sections were kept in the initial 10% buffered formalin fixative for no less than 48 h, then rinsed under running water for 12 h before being immersed in a series of graded ethanols (one change of 60% ethanol, two changes of 70% ethanol for 2 h each) prior to being sent for slide preparation. Ethanol-preserved gonad sections were then weighed to the nearest 0.001 g and fresh gonad section weight (y) was calculated from the preserved weight (x) using the formula y = 1.3438x+0.1099. This formula was derived by comparing 50 randomly selected gonad section samples with known fresh and ethanol-preserved weights to account for weight loss during preservation. The calibrated weight of gonad sections was then added to the remaining gonad weight to derive total gonad weight (GW). Gonadosomatic index (GSI), used as a coarse proxy indicator of maturity in previous studies (e.g., Stoner et al., 2012c) was calculated for each sample as the ratio of wet GW to wet soft tissue weight (Stoner et al., 2012c). Preserved gonad sections were sent to Harbor Branch Oceanographic Institute, Florida, USA, subjected to standard paraffin and embedding procedures, sectioned to 5–6 micrometers for slide preparation, mounted on microscope slides, then stained by standard hematoxylin and eosin. Prepared slides were then returned to TIDE.
Histological Analysis
Slides were examined on a compound light microscope at magnifications ranging from 4X to 80X and assigned maturity and reproductive output classifications in accordance with standard phase scale and % cover scale procedures (Delgado et al., 2004; Stoner et al., 2012c). Phase scale maturity analysis provides a more precise indication of presence, absence and relative stages of development of gonadal structures, i.e., the ability to spawn or not. However, it lacks the ability to estimate reproductive output i.e., the volume of gametes produced during spawning. The % cover scale provides a better estimate of reproductive output, but lacks the ability to distinguish between immature individuals and mature spent individuals. Where possible, thresholds for measured parameters were then determined at which 50% of the population is mature (i.e., capable of spawning) with at least 50% germ tissue cover to ensure an adequate amount of gametes are produced during spawning to sustain the population.
Each slide was examined for gonadal structures such as connective lumen tissue, follicular tissue, oogonia, oocytes and oviducts (female), spermatogonia, spermatocytes and vas deferens (male), to classify samples by sex and maturity stages. Each sample was then categorized using a 7-category maturity scale (Table 1) similar to that employed by Egan (1985) and Avila-Poveda (2004), and later adapted by Delgado et al. (2004) and Stoner et al. (2012c). A % cover classification system was used to find the proportion of gametogenic tissue to somatic cells (i.e., the percentage of ovarian or testicular tissue occupying the available space of the section) using a four-category reproductive output scale (Table 2; Delgado et al., 2004; Stoner et al., 2012c).
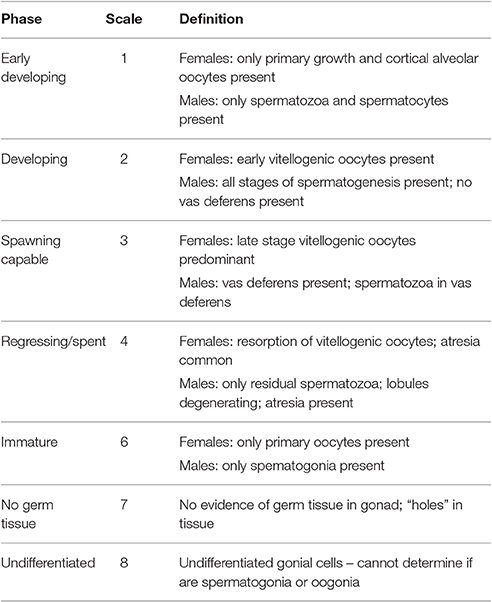
Table 1. Reproductive phase maturity scale classifications for L. gigas gonadal tissues (Delgado et al., 2004; Stoner et al., 2012c).
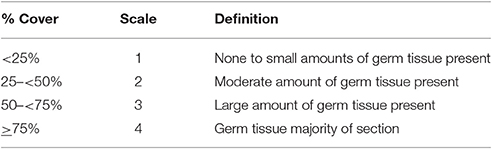
Table 2. Reproductive area % germ tissue coverage classifications for L. gigas gonadal tissues (Delgado et al., 2004; Stoner et al., 2012c).
Statistical Analysis
Mean GSI was compared between the sampling periods and sexes using 2-way ANOVA to identify the seasonal variations of GSI of matured individuals. Individuals with LTs above the LT at which 50% of the population is mature with at least 50% germ tissue cover (LT50) were used for this analysis. The assumption of normal distribution and homogeneity of variance was examined using Q-Q plots and Levene's test. Tukey HSD was carried out for post-hoc pairwise comparisons.
Upon determining Period 2 as the peak reproductive period and thus most reliable period to conduct maturity analysis, samples from Period 2 were used for the following statistical analyses.
Relationships between GSI and the following morphological measures of each sex were examined using regression analysis or Spearman correlation: LT, SL, MCW, UW, GW, LW, OL, OW, and operculum length-width ratio (OL:OW). Polynomial regression was used to examine the relationship between LT and GSI as there was clear non-linearity in the relationships. Upon the determination of the significant relationship between GSI and LT, relationships between LT and MCW were examined using regression analysis in order to establish whether one can be used to estimate the other for management purposes. Assumptions of a normal distribution and homogeneity of variance were examined using the plots of residuals against fitted values and Q-Q plots. Log, square root, fourth root and reciprocal transformations were applied for the variables where the assumptions were not met. None of the transformations successfully improved the normality and homogeneity assumptions, thus a non-parametric test (Spearman correlation) was used to investigate relationships between those variables and GSI. Null hypotheses were rejected when p < 0.05 for parametric analyses, and p < 0.01 for non-parametric analyses. A more conservative significance level was used for non-parametric analyses due to the lower sensitivity to detect the statistical significance owing to less information inherent in the distribution assumptions.
Due to the binary nature of the maturity classification outputs (mature, not mature), binomial logistic regression analysis with 95% confidence intervals was used to determine the probability of maturity (phase scale) and probability of good reproductive output (% cover scale) as a function of LT, SL, MCW, UW, GW, LW, OL, OW, and OL:OW for both females and males in Period 2. Individuals assigned to phases 3 or 4 on the phase scale were considered mature (score 1) while those assigned to phases 1, 2, 6, 7, and 8 were considered not mature (score 0) (Table 1; Delgado et al., 2004; Stoner et al., 2012c). On the % cover scale, those with ≥50% germ tissue cover (scale 3 or 4) were considered to have good reproductive output and thus categorized as mature (score 1), while those with <50% germ tissue cover (scale 1 or 2) were considered to have low reproductive output, and thus categorized as not mature (score 0) (Table 2; Delgado et al., 2004). The Hosmer-Lemeshow goodness-of-fit test (HL test) was used to generate Chi-squared values and assess the fit of the data to the logistic regression models. While 10 groups (g = 10) is the default and most commonly used (Lemeshow and Hosmer, 1982), we used g = 8 in order to ensure a sufficient number of samples was evenly distributed in each group. The null-hypothesis of the HL test was that the observed and expected values were the same across the range of the independent variables, and was rejected when p < 0.05. Non-significant p-values in the HL test are not proof that the logistic regression models have a good fit to the data; only that there is not failure to reject the null hypothesis. Therefore, p-values generated from the binomial logistic regressions were used to identify the significance of relationships between measured parameters and probability of maturity (phase scale) and probability of >50% germ tissue cover (% cover scale). Null hypotheses (no relationship) were rejected when p-values of binomial logistic regressions were <0.05 on either scale to ensure a high level of reliability when applied to management.
LT50 and SL50 for both sexes and MCW50 for female L. gigas were calculated from the binomial logistic regression curves based on both phase scale and % cover scale analyses. To understand minimum and maximum range for management options for setting harvest control rules, Xmin and X95 were also determined when logistic regressions were significant, where X is measured variables, Xmin is the minimum size at maturity, and X95 is the size at which a 95% probability of maturity and good reproductive output was observed. Xmin values were determined by observing the smallest value for X at which maturity was observed on both scales, and X95 was determined from the binomial logistic regression curves. X50 values were accepted only if corresponding X95 was achieved from the binomial logistic regression curves. Failure to achieve this would indicate a weak relationship between the parameters and maturity and therefore not applicable for management. UW and GW were also examined in the same way because binomial regression yielded significant relationships; however, no figures are presented for these as they are of limited practical use for management.
The software R (v. 3.02.) was used for all statistical analyses (R Development Core Team, 2014).
Ethics Approval Statement
This study was carried out in accordance with the Toledo Institute for Development and Environment (TIDE)'s ongoing research permit validated under the terms of TIDE's co-management agreement with BFD. The study and protocol were reviewed and approved by BFD, who have full authority for approving scientific research involving the use of marine commercial species in Belize, and are the agency responsible for providing ethics approvals for research involving commercially harvested marine species in Belize. This approval was issued via a written letter of recommendation and endorsement from the Fisheries Administrator at BFD who has final authority in the matter. During open season, sampled specimens were obtained and returned as ordinary catch of local fishers. Specimens collected during closed season were donated to a local home for the elderly as instructed by BFD. Gonad samples were exported to the USA for histological preparation under CITES permits issued by BFD.
Results
Sample Collection
A total of 576 specimens were obtained. In Period 1, 190 samples were obtained (107 female, 83 male); in Period 2, 195 samples were obtained (101 female, 94 male); in Period 3, 191 samples were obtained (123 female, 68 male). During all periods, but especially in Periods 1 and 3, there were more females than males (male to female ratio of 1:1.25 in Period 1, 1: 1.06 in Period 2; 1: 1.75 in Period 3) with a total of 331 females and 245 males sampled.
Seasonal Variations in GSI and Histological Stages
There were significant differences in mean GSI between sampling periods [2-way ANOVA; F(2, 285) = 44.24, p < 0.001], and between sexes [2-way ANOVA; F(1, 285) = 13.18, p < 0.001]. Interaction between Periods and sexes was not significant [2-way ANOVA; F(2, 285) = 0.22, p = 0.80]. Mean GSIs in Period 2 for individuals with LTs above LT50 were 2.92 ± 0.10 (mean ± S.E.) and 3.29 ± 0.07 for females and males, respectively, and were significantly higher than those from Periods 1 and 3 in both sexes (Figure 2), indicating that the reproductive peak of L. gigas in PHMR was during Period 2 (July–September). Mean GSIs in Period 1 (2.38 ± 0.09 and 2.67 ± 0.09 for females and males respectively), and Period 3 (2.02 ± 0.15 and 2.24 ± 0.15 for females and males respectively) were not significantly different from each other (Figure 2). Pairwise comparison also showed there were no significant differences between sexes within each Period. In accordance with GSI, histological analysis revealed more spawning capable individuals, and more with ≥50% germ tissue cover in Period 2, further supporting the supposition that Period 2 is the peak reproductive period (Figure 3).
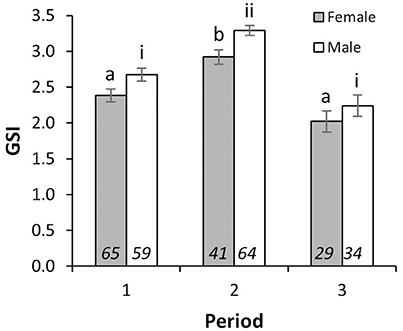
Figure 2. Mean GSI (±SE) of female and male L. gigas with LT above LT50 of each sex in PHMR. Letters (female) and Roman numerals (male) imply statistically similar means for GSI, according to the results of Tukey HSD post-hoc test. Sample sizes are shown in italics.
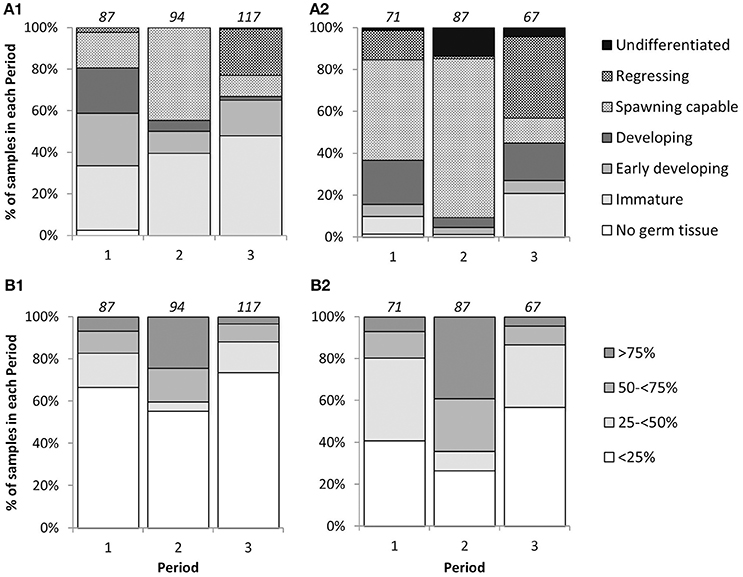
Figure 3. Percentage frequency of phase scale (A1,A2) and cover scale (B1,B2) stages in each sampling period for female (A1,B1) and male (A2,B2) L. gigas in PHMR. Sample sizes in each period are indicated above each bar.
Relationship between GSI and Morphological Measures
There was a significant curvilinear relationship between GSI and LT, with 54% and 44% of the variation in GSI explained by LT for females and males, respectively (Table 3; Figure 4). Peak GSI was 3.01 at LT 19.5 mm for females and 3.45 at LT 26.9 mm for males. There were significant positive relationships between GSI and UW and MCW in female L. gigas, with r2 values being 0.27 and 0.32, respectively (Table 3). For males, UW did not have a significant relationship with GSI, and the relationship between GSI and MCW was statistically significant but only 4% of the variation in GSI was explained by MCW. Similar patterns were observed in the relationship between GSI against SL, where the relationship was significant only in females (Table 3). LW of both females and males were significantly related to GSI but only 10% and 3% of the variation was explained, respectively by LW (Table 3). There were no relationships between GSI and any of the operculum dimensions (Table 3).
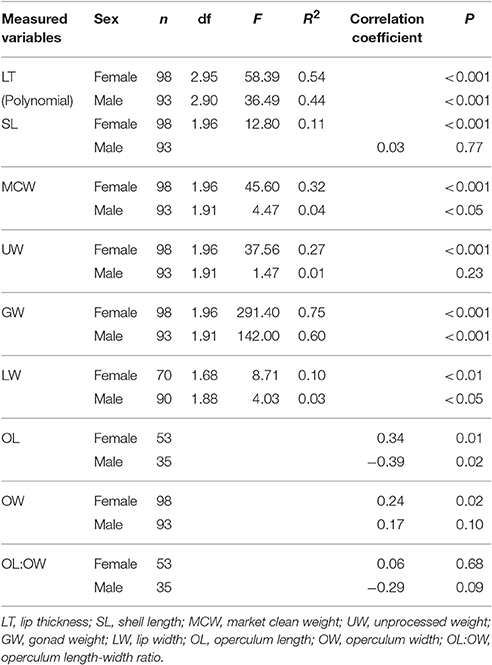
Table 3. Results of regression and Spearman correlation, showing relationships between gonadosomatic index (GSI) and measured variables of L. gigas during Period 2–reproductive season in PHMR.
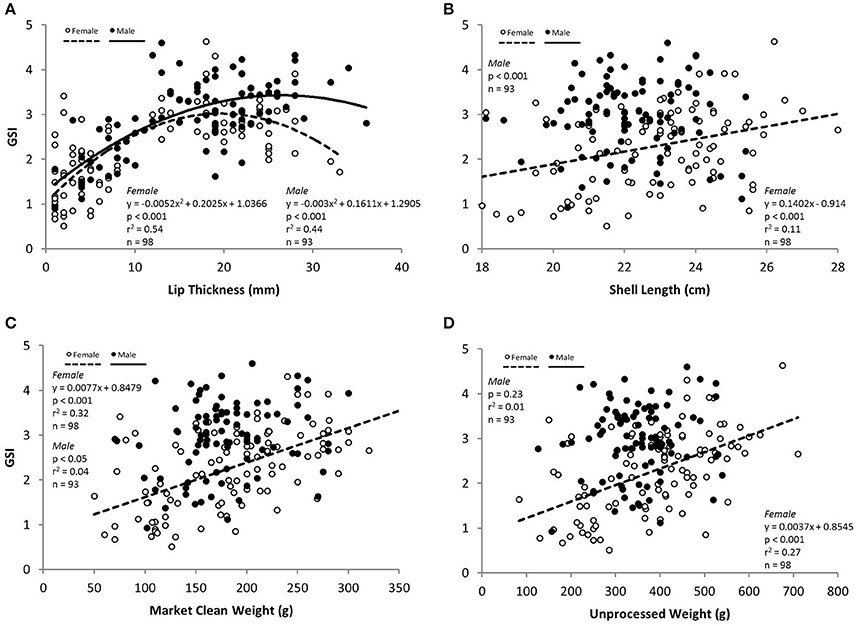
Figure 4. GSI in relation to measured variables (A) lip thickness (LT), (B) shell length (SL), (C) market clean weight (MCW) and (D) unprocessed weight (UW) for females (white circles), males (black circles) L. gigas in Period 2.
Relationship between Lip Thickness and Market Clean Weight
Relationships between LT and MCW for all sampling periods combined were curvilinear for both sexes but particularly for females. There was a stronger relationship between LT and MCW for females [polynomial regression: F(2, 326) = 93.24, r2 = 0.36, p < 0.001] than for males [polynomial regression: F(2, 240) = 10.41, r2 = 0.07, p < 0.001; Figure 5]. MCW of female L. gigas at LT50 (15.51 mm) was 211.42 g and male MCW at LT50 was 178.8 g, calculated from the respective female and male polynomial regression equations.
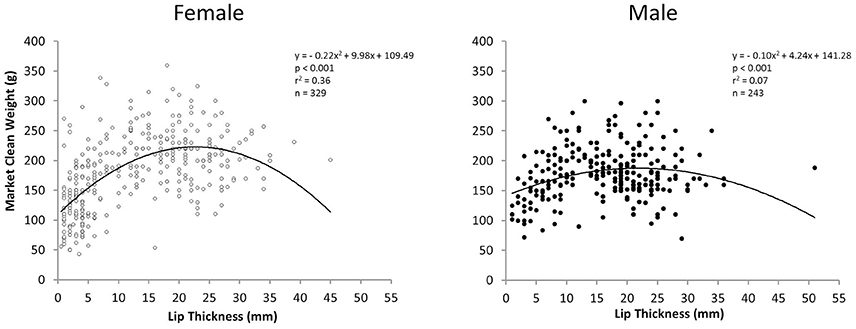
Figure 5. Plot of market clean weight in relation to lip thickness of female (left) and male (right) L. gigas in PHMR. Samples are from Periods 1, 2, and 3 combined.
Percentage Frequency Distribution of Phase Scale and % Cover Scale Maturity at Each LT and SL Class
There was an increase in the proportion of mature L. gigas with increasing LT in Period 2 for both sexes using both the phase scale and % cover scale. Males and females with LT >20 mm were almost all mature, with the exception of 18.2% or two male individuals in the 25–30 mm LT class being classified as “undifferentiated” (phase scale 8), possibly due to being sterile specimens (Figure 6). Relationships between proportion mature and increasing SL were weak for females, taking into account that apparent high proportions of mature specimens in SL classes above 26 cm are due to extremely low sample sizes (n = 1~2) above 26 cm SL (Figure 7). No relationship between SL class and maturity was observed for Period 2 males (Figure 7).
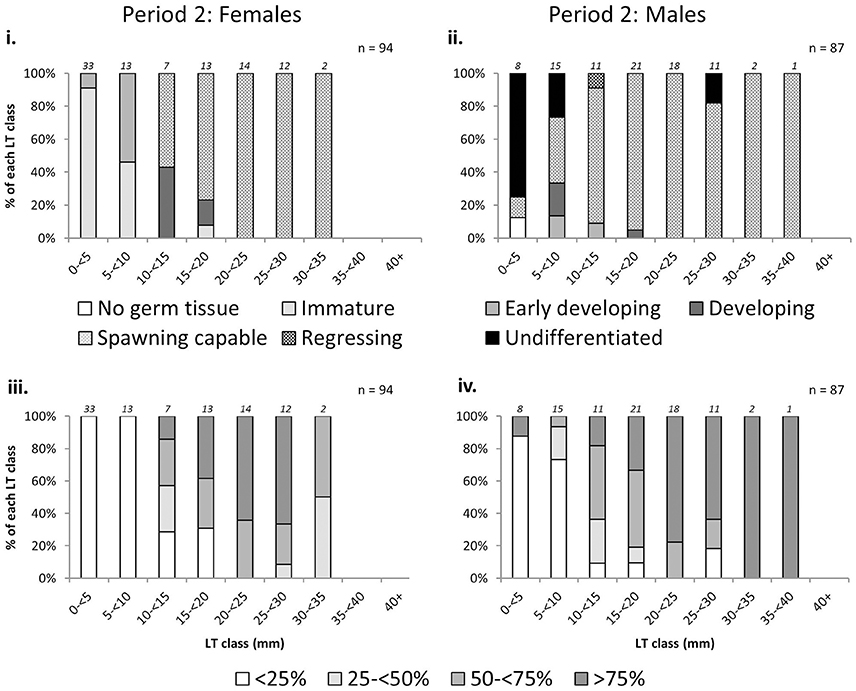
Figure 6. Percentage frequency of maturity stages [phase scale (top) and % cover scale (bottom)] of female (left) and male (right) L. gigas in each 5 mm lip thickness (LT) class, collected during Period 2 in PHMR. Sample numbers in each size class are indicated above each bar.
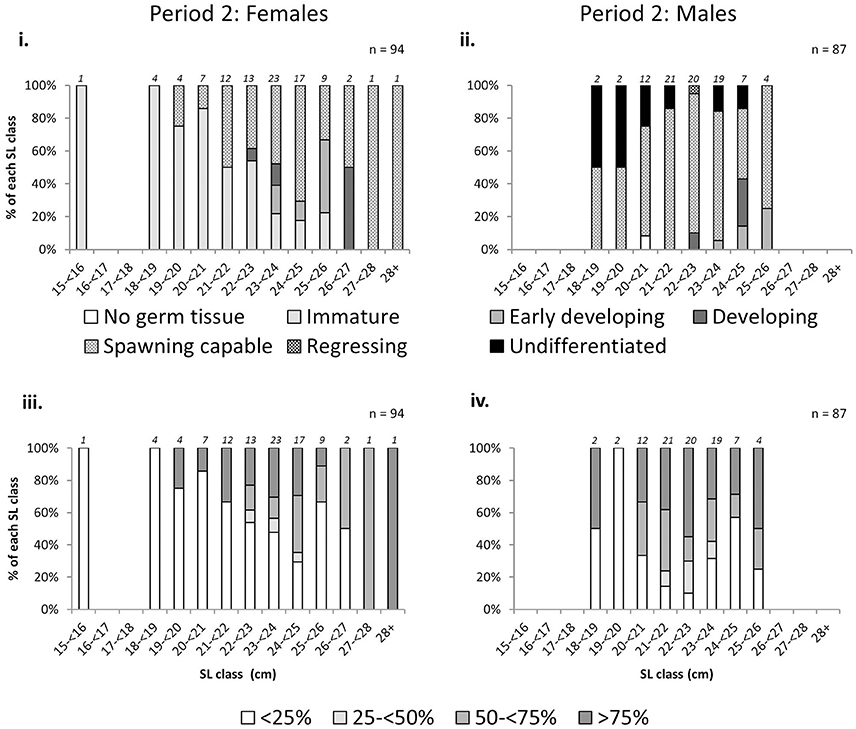
Figure 7. Percentage frequency of maturity stages [phase scale (top) and % cover scale (bottom)] of female (left) and male (right) L. gigas in each 1 cm shell length (SL) class, collected during Period 2 in PHMR. Sample numbers in each size class are indicated above each bar.
Maturity as a Function of LT, SL, MCW and Other Biometrics
Lip Thickness
Relationships between LT and maturity using both phase scale and % cover scale were significant in Period 2 (Table 4; Figure 8). LTmin in Period 2 was 12 mm for females and 4 mm for males using the phase scale. Identical LTmin values were obtained using the % cover scale because the first maturity at the smallest female and male LTs were revealed from the same individuals in both scales. Female LT50 in Period 2 was 14.01 mm (phase scale) or 15.51 mm (% cover scale), and for males was 7.88 mm (phase scale) or 12.33 mm (% cover scale; Figure 8). Phase scale LT95 occurred in females at LT 19.20 mm and males at 20.06 mm (Figure 8). Percentage cover scale LT95 was observed in females at 24.62 mm and males at 24.02 mm (Figure 8). HL tests revealed that observed values and expected values using phase scale were significantly different across the range of observed LTs in males (Table 4). Therefore, caution was applied in the interpretation of the binomial regression in this instance (i.e., LT50 yielded from the logistic curve was not used to determine the recommended size limit even though the p-value from the logistic regression was significant).
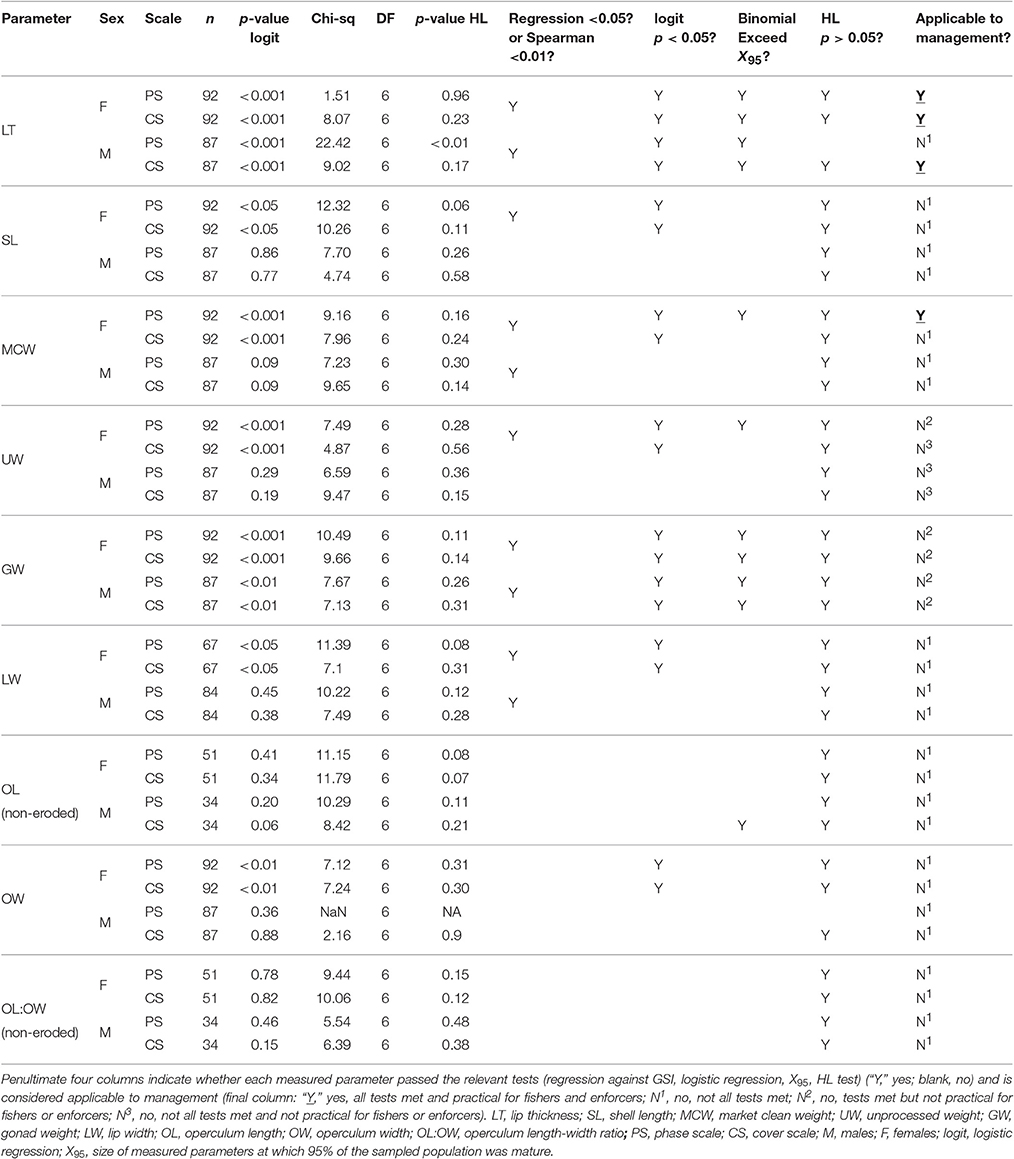
Table 4. Results of logistic regression and Hosmer Lemeshow (HL) goodness-of-fit tests.
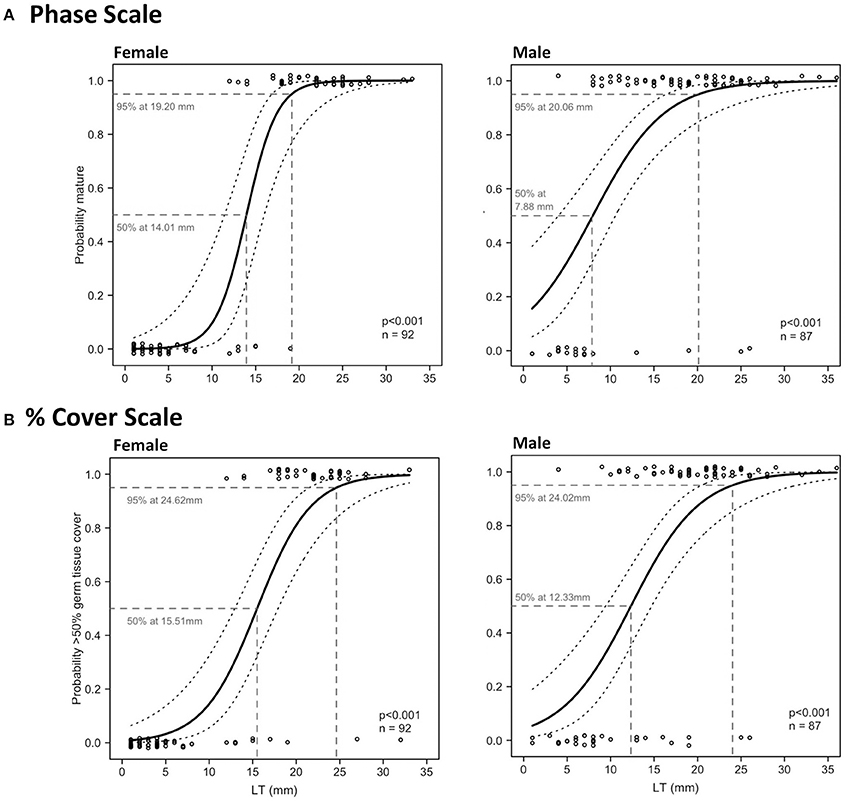
Figure 8. Binomial logistic regression curves and their 95% confidence intervals, derived from the maturity scores (1 = mature, 0 = immature) based on phase scale (A) and % cover scale (B) showing probability of maturity as a function of lip thickness (LT) of female (left) and male (right) L. gigas, sampled during Period 2 in PHMR. For phase scale, spawning capable and regressing specimens were considered mature, and no germ tissue, immature, early developing and late developing were considered not mature. For % cover scale, >50% cover of gametogenic tissue in relation to somatic cells were considered within desired reproductive output; <50% were considered below desired reproductive output.
Shell Length
In females, there were significant relationships between SL and maturity in Period 2 using the phase scale and % cover scale (Table 4). SLmin in Period 2 was 19.5 cm for females and 18.1 cm for males using the phase scale. Identical SLmin values were obtained using the % cover scale because they were revealed from the same individuals in both scales. Female SL50 in Period 2 was 23.52 cm (phase scale) or 24.14 cm (% cover scale; Figure 9). However, these values are considered not reliable for use as proxies to maturity for management purposes because the logistic curves did not exceed 95% probability of being mature or having good reproductive output (SL95) (Figure 9), and the statistical outcome was not as strong as those in LT (Figure 8). There were no significant relationships between SL and probability of maturity or reproductive output for males in Period 2, using either the phase scale or the % cover scale (Table 4; Figure 9).
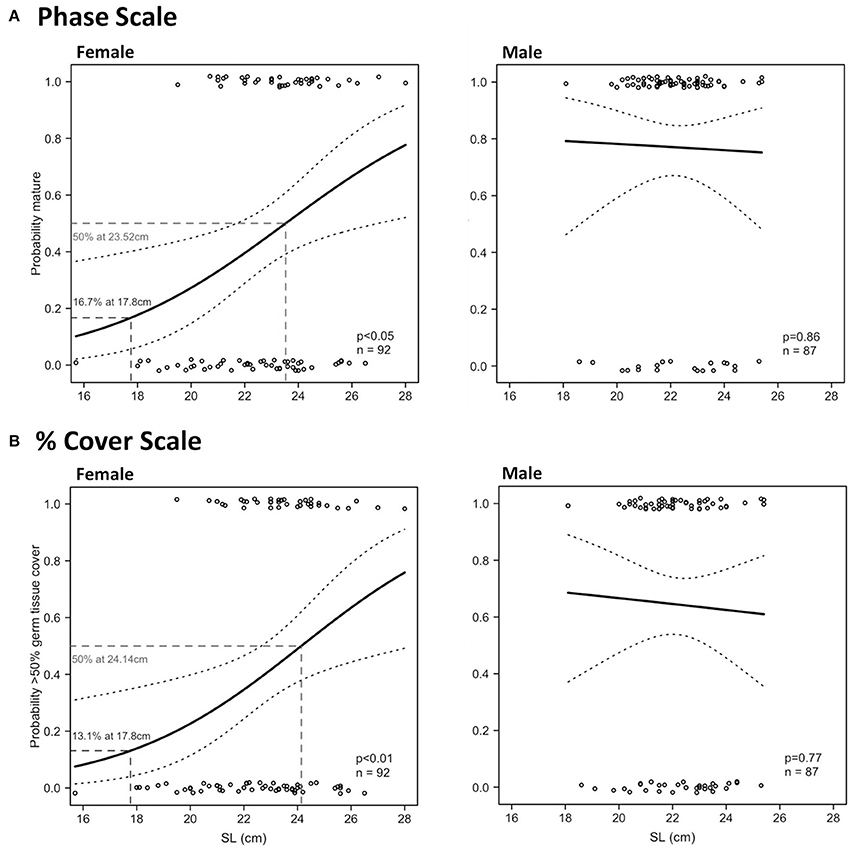
Figure 9. Binomial logistic regression curves and their confidence intervals, derived from the maturity scores (1 = mature, 0 = immature) based on phase scale (A) and % cover scale (B) showing probability of maturity as a function of shell length (SL) of female (left) and male (right) L. gigas, sampled during Period 2 in PHMR.
Market Clean Weight
There were significant relationships on both scales in Period 2 between MCW and maturity and reproductive output of female L. gigas, for which HL tests did not fail to reject the null hypothesis (Table 4; Figure 10). MCWmin in Period 2 was 130 g for females and 70 g for males, revealed from the same individuals in both scales. Female MCW50 in Period 2 was 199 g (phase scale) or 213 g (% cover scale). Phase scale MCW95 occurred in females at 355 g, however % cover scale analysis did not achieve 95% probability of good reproductive output. There were no significant relationships between MCW and maturity or reproductive output for males in Period 2 using either the phase scale or the % cover scale and therefore male MCW50 could not be estimated.
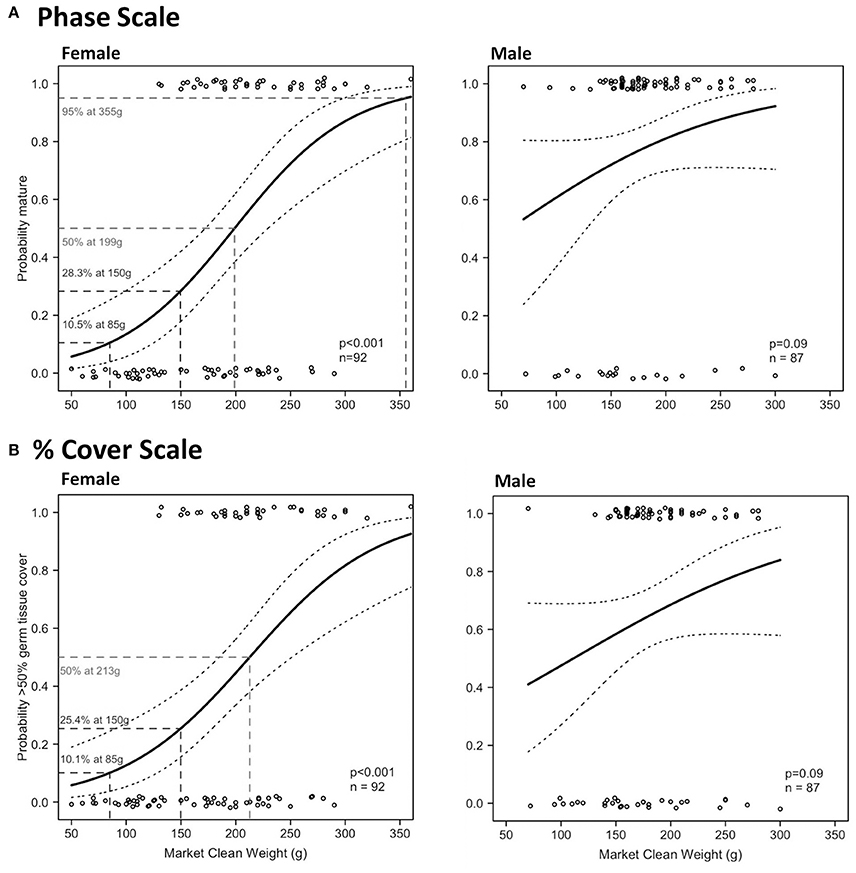
Figure 10. Binomial logistic regression curves and their confidence intervals, derived from the maturity scores (1 = mature, 0 = immature) based on phase scale (A) and % cover scale (B) showing probability of maturity as a function of market clean weight (MCW) of female (left) and male (right) L. gigas, sampled during Period 2 in PHMR.
Other Biometrics
The patterns observed in UW were similar to those in MCW, where significant relationships were determined from binomial regression in females on both scales for which HL tests did not fail to reject the null hypothesis (Table 4; Figure 10). Female UW50 in Period 2 was 412 g (phase scale) or 435 g (% cover scale). There were no significant relationships between UW and maturity or reproductive output for males in Period 2 using either the phase scale or the % cover scale and therefore male UW50 could not be estimated. UWmin in Period 2 was 290 g for females and 200 g for males using the phase scale, while % cover scale UWmin values were 290 g for females and 126 g for males. Phase scale UW95 occurred in females at UW 685 g, however % cover scale analysis did not achieve 95% probability of good reproductive output. There were significant relationships for GW for both sexes exceeding 95% probability of maturity and good reproductive output in Period 2, for which HL tests did not fail to reject the null hypothesis (Table 4). In Period 2, female GW50 was 9.96 g (phase scale) or 10.86 g (% cover scale), while male GW50 was 4.94 g (phase scale) or 7.18 g (% cover scale). GWminin Period 2 was 7.09 g for females and 3.50 g for males using the phase scale, while % cover scale GWmin values were 7.09 and 4.48 g for females and males, respectively. Phase scale maturity relationships for LW and OW were significant for females only, but did not exceed 95% probability of maturity or good reproductive output (Table 4). Maturity relationships for OL and OL:OW were not significant using either phase scale or % cover scale analysis (Table 4).
Relationships between Existing Size Limits and Observed Maturity of PHMR L. gigas:
Shell Length
97.6% and 100.0% of the total (all periods) sampled female and male populations, respectively, had SLs over the minimum SL limit (17.8 cm). 33.2% and 64.2% of legal-sized (SL > 17.8 cm) female and male L. gigas, respectively, for which histology analysis was carried out, were mature according to the phase scale, and 22.0% and 34.5% of legal-sized female and male L. gigas, respectively, for which histology analysis was carried out, were mature according to the % cover scale. For Period 2 females there was a 16.7% (phase scale) or 13.1% (% cover scale) probability of maturity at the current SL legal size limit of 17.8 cm, and unknown for Period 2 males (Figure 9).
Market Clean Weight
91.8% and 98.0% of the total (all periods) female and male sampled populations, respectively, had MCWs over the current minimum MCW limit (85 g). 35.3% and 64.1% of legal sized (MCW >85 g) female and male L. gigas, respectively, for which histology analysis was carried out, were mature according to the phase scale, while 23.4% and 34.5% of legal-sized female and male L. gigas, respectively, for which histology analysis was carried out, were mature according to the % cover scale. In Period 2 females, there was a 10.5% (phase scale) or 10.1% (% cover scale) probability of maturity at the current MCW legal size limit of 85 g, and unknown for Period 2 males (Figure 10).
Discussion
Assessing Proxy Indicators of Sexual Maturity of L. gigas in PHMR
The results of our study revealed that SL did not predict the maturity stages of L. gigas in PHMR, and the current MCW limit (85 g) is too low to protect juvenile populations. Current regulations using SL and MCW are therefore likely resulting in growth overfishing and the observed rapid population reduction in recent years. Revisions to legal size limits are therefore needed. We confirmed that LT was the best practical proxy to the maturity stages. MCW was the second best practical proxy of maturity after LT in female L. gigas, but did not explain the maturity of males. Nevertheless, replacement of the current SL limit with a LT limit and a substantial increase in the MCW limit would likely reduce fishing mortality on juveniles and enhance L. gigas recruitment, yields and economic returns.
Size at maturity of L. gigas has been studied in multiple locations in the Caribbean, including northern Belize (Egan, 1985), Puerto Rico (Appeldoorn, 1988), Colombia (Avila-Poveda and Baqueiro-Cárdenas, 2006; Aldana Aranda and Frenkiel, 2007), Florida (Spade et al., 2010), Barbados (Bissada, 2011) and the Bahamas (Stoner et al., 2012c), with considerable spatial variation observed in life history traits between different areas (Table 5). In this study, most conservative estimates of LT50 of L. gigas in PHMR were 15.51 mm (% cover scale) for females and 12.33 mm (% cover scale) for males, both of which were lower in comparison to other regional studies (Table 5). On the other hand, LTmin in this study was 12 mm for females, which is higher than the regional average based on previous studies, and three times higher than those in northern Belize, whereas LTmin of male L. gigas was 4 mm which was lower compared with most previous studies. The implication of these marked spatial variations is that Belizean conch fisheries should be managed with regulations tailored to distinct locations to accommodate important differences such as habitat and fishing pressure in life history characteristics.
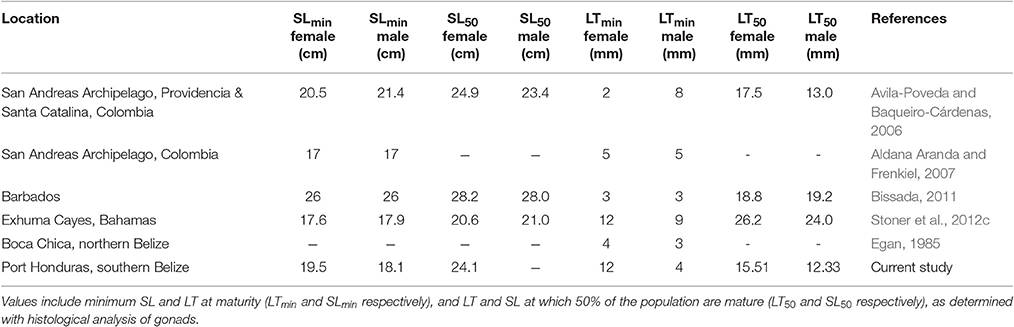
Table 5. Comparison of shell length (SL) and lip thickness (LT) measurements observed in L. gigas in various locations in the Caribbean region, including this study.
Multiple environmental factors affect growth, development, and survivorship of L. gigas (Alcolado, 1976), including habitat (Ray and Stoner, 1995), food availability, population density (Stoner, 1989), inhibited gene flow in the event of population isolation (Mitton et al., 1989; Davis et al., 1993; Weersing and Toonen, 2009) and water quality, such as salinity (Davis, 1998), pH (Byrne, 2011) and temperature (Egan, 1985; Davis, 1998; Stoner et al., 2012c). Anthropogenic nutrients, contaminants and heavy metals (e.g., Cu, Zn) also affect life history traits of gastropods and other aquatic invertebrates (Coeurdassier et al., 2005; Rogevich et al., 2009; Doney, 2010; Spade et al., 2010). Further studies are required to identify the influential factors of spatial variations in reproductive life history traits in order to identify appropriate spatial scales for effective management of L. gigas in Belize and across the Caribbean region.
Maturity relationships for OL and OL:OW were not significant, while phase scale maturity relationships for LW and OW were significant for females only, but did not exceed 95% probability of maturity or good reproductive output and therefore these biometrics are not considered reliable for use as proxies to maturity for management of PHMR L. gigas. UW of females and GW of both sexes had significant relationships with maturity and reproductive output. However, these are of limited practical value in terms of management due to excess appendages usually being removed to produce market clean product at sea prior to landing. Also, even if rules were adopted to require meat not to be cleaned prior to landing, the gonads are delicate and would therefore be difficult for fishers to keep intact when removing them from shells and also during transport.
Efficacy of Current Seasonal Closure Management
We found Period 2 (July–September) to be the peak reproductive period, confirming that the current seasonal closure (1st July–30th September) is appropriately timed for protecting L. gigas in PHMR during reproduction. However, spawning capable individuals were observed in Periods 1 and 3, albeit to a lesser extent, suggesting that the spawning season may extend into these Periods. Since warmer temperatures tend to result in longer spawning seasons (FAO, 2007), increased duration of the peak reproductive period may be expected with rising water temperature due to climate change. Further studies are required to determine minimum and maximum temperature thresholds at which reproduction is induced, which could provide insights into the potential effects of climate change on reproductive seasons of L. gigas.
Target Size Limits for L. gigas in PHMR
Ideally, sex-specific LT minimum size limits of 16 mm for females and 13 mm for males would be recommended for PHMR, which are the most conservative estimates of LT50 for each sex from either phase scale or cover scale analyses (15.51 mm for females and 12.33 mm for males) rounded up to the nearest mm for management ease. Given the impracticalities of identifying sex quickly without killing L. gigas, we recommend that the more conservative 16 mm LT limit be applied to both sexes. This is more conservative than those adopted in Cuba (5 mm), Venezuela (5 mm), Colombia (7 mm), Puerto Rico (9.5 mm) and US Virgin Islands (9.5 mm) (Thiele, 2005) even though LT50 values in PHMR were lower than those in other studied sites. 63.3% and 84.0% (phase scale), and 49.0% and 52.0% (% cover scale) of the total sampled L. gigas (female and male, respectively) with LT ≥16 mm were mature, suggesting that the proposed LT size limit will protect at least half of juveniles from harvest. Our proposed limit takes both phase scale and % cover scale maturity estimates into consideration in order to ensure that L. gigas available to harvest are more likely to be mature and also capable of adequate reproductive output to sustain the population, which will likely achieve stock recovery more effectively than a lower limit.
A major shortcoming in LT-based size limits is that fishers usually remove L. gigas meat from the shell and discard the shells at sea before landing their product. This is because the shells are bulky and heavy in comparison to the meat, and there is no locally established industry for shell-based products. It is therefore currently not economically viable for fishers to land whole animals due to space limitations in local fishing vessels. This results in an enforcement problem for fisheries officers at landing sites who do not have access to the shells to ensure they meet the LT limit. Indeed this is the problem with the current SL-based limits, and the MCW limit of 85 g attempts to address this issue, as MCW can be measured at landing sites and markets by fisheries law enforcement staff. However, the current 85 g limit is too low to be effective in protecting juveniles from excessive harvest because MCWmin was 130 g and 70 g for females and males, respectively, suggesting that potentially all females landed with MCW between 85 g and 130 g are most likely immature.
MCW50 of female L. gigas was 199 g (phase scale MCW50 as % cover scale did not reach 95% probability of maturity), and female MCW at LT50 was 211.42 g, both calculated from the polynomial regression curve of these two variables. Male MCW at LT50 was 178.8 g, less than for females, although the relationship between LT and MCW in males was not significant. In the absence of any reliable MCW proxy to male maturity, the female MCW limit could be applied to both sexes to alleviate the need to identify sex-specific size limits. A minimum MCW limit of 199 g would therefore be desirable for both males and females. However, to account for the relatively large error in the relationship between LT and MCW (31.9% of females and 71.5% of males with LT >16 mm had MCW <199 g), we recommend lowering the MCW size limit in order to provide a buffer for this error. A reduced MCW limit of 150 g is suggested, as only 19.3% of females and 12.4% of males that had LT >16 mm had MCW <150 g. 42.1 and 68.5% (phase scale) and 29.0 and 37.6% (% cover scale) of the total sampled L. gigas (female and male, respectively) with MCW ≥150 g were mature. An MCW limit of 150 g would yield at least 28.3% probability of maturity in females, and unknown in males, resulting in far more juvenile survivorship than with the current MCW limit of 85 g, at which there is only a 10.5% (phase scale) or 10.1% (% cover scale) probability of maturity in females, and unknown in males. This recommended MCW limit is therefore likely to significantly improve the survival of immature individuals in both sexes. Further studies are required however to elucidate sex-specific maturity proxies and reveal a better size limit to protect juvenile males, and caution is still advised when considering applying MCW-based size limits in the short term when taking impacts on fishers' livelihood into account.
Multi-Stage Adaptive Management; Balancing Sustainability with Economic Needs
A key challenge is to determine management recommendations that not only achieve stock recovery and long-term sustainability of the PHMR L. gigas fishery, but that also minimize short-term negative impacts on fishers' livelihoods. Our proposed LT size limits will reduce the available L. gigas for fishers by approximately half because 59.2% and 44.1% of the total sampled female and male populations, respectively, had LTs <16 mm. There would be little difference if the existing SL size limit were to remain in force in addition to the new LT regulations, as 58.2% and 44.1% of the total sampled female and male populations, respectively, of legal size (SL greater than or equal to the current SL limit of 17.8 cm) had LTs <16 mm. A 150 g MCW limit would leave 68.0% and 78.3% of the total sampled female and male populations, respectively, available to harvest, compared with 91.8% and 98.0% respectively, with the current minimum MCW limit (85 g). Therefore, LT-based and revised MCW-based size limits are only likely to be able to meet both objectives of achieving sustainable fisheries and minimizing livelihood impacts once L. gigas density recovers. In order to balance these challenges, we suggest a multi-stage adaptive management approach, where either a significant quota reduction, or even a moratorium is introduced until density across PHMR fishing grounds recovers to above the minimum density threshold of 88 ha−1 recommended by the Belize Fisheries Department (BFD; McDonald et al., 2017). Assuming there is significant self-recruitment in the PHMR population, this temporary period of little or no fishing pressure may preserve older spawning adults which are capable of producing more eggs than younger adults, thereby promoting stock recovery in minimal time. Further research is however needed to substantiate the assumption of self-recruitment in PHMR. Notwithstanding, if future fisheries-independent monitoring indicates mean density to be above 88 ha−1, the fishery could be reopened with the new 16 mm LT and 150 g MCW size limits in place alongside other existing regulations, such as seasonal closures, spatial closure of permanent Replenishment Zones, and fishing gear restrictions. Enhanced enforcement is needed to ensure illegal fishing does not undermine the effectiveness of the period of reduced quota or moratorium, and alternative livelihoods must be provided to mitigate short-term negative economic impacts to fishers.
A L. gigas fishery simulation approach (Harford et al., 2016) could be used to determine recovery timescales under different adaptive LT and MCW limit options to be implemented in coming seasons, assessed annually through existing fisheries-independent and fisheries-dependent surveys. This approach could be used in conjunction with the AMF for PHMR's L. gigas fishery using stakeholder-defined goals as a basis for determining performance metrics, and employing management strategy evaluation (MSE) to examine the effectiveness of the AMF compared with traditional management tools. Results of these surveys and simulations would need to be regularly communicated to stakeholders via consultations during local fishers' forums to achieve consensus for science-based adjustments to size limits. Fishers would then be empowered to make informed decisions over how they would like to manage the fishery, striking the right balance in achieving stock recovery in the quickest time possible while also limiting short-term economic impacts to a level acceptable to fishers.
The current study provides the first insights into relationships between multiple morphological measures and sexual maturity of L. gigas in PHMR, which is essential knowledge with direct implications for management of the PHMR L. gigas fishery. In order to inform national and regional regulations and development of the AMF, further research is needed to identify size at maturity and population structures of L. gigas in other areas of Belize outside PHMR and other countries in the Caribbean. Better understanding of factors influencing spatial variations in relationships between size and maturity in PHMR and other areas is also needed. Additionally, long-term monitoring of reproduction and recruitment success of L. gigas, population density, catch rates, water quality, and habitat changes are required to determine the extent to which these are drivers of spatial and temporal variability. For PHMR, these can be assisted by TIDE's existing water quality monitoring data, habitat mapping data, PHMR Managed Access logbook data, and Spatial Monitoring and Reporting Tool (SMART) enforcement data, most of which have been collected since 2011. Such knowledge could also provide insights into potential impacts of future climate change on conch maturity relationships, and thus inform climate change-related adaptive management of the PHMR L. gigas fishery, in order to ensure sustainability of fishers' livelihoods in times of considerable climate uncertainty.
Author Contributions
JF: Conception and design, acquisition, analysis, interpretation of data for the work, drafting the work, revising it critically for important intellectual content, final approval of the version to be published, agreement to be accountable for all aspects of the work. MT: Acquisition, analysis, interpretation of data for the work, revising it critically for important intellectual content, agreement to be accountable for all aspects of the work.
Conflict of Interest Statement
The authors declare that the research was conducted in the absence of any commercial or financial relationships that could be construed as a potential conflict of interest.
Acknowledgments
This project was entirely funded by the Belize Protected Areas Conservation Trust (PACT) (Grant ID# RSCH-15-01). We thank the following staff members and interns at the Toledo Institute for Development and Environment (TIDE) for their technical support in the field and laboratory; Marty Alvarez, Tanya Barona, TIDE rangers, TIDE community researchers: Willie Caal, Fernando Rabateau, Jenny Ramirez, Curtis Hines, Anna Ramirez, Eeryn Bowden, Rasheed Arzu, Anthony Rash and Bevinton Cal, and TIDE interns: Tom Irvine, Daryl Smith, Alexandra Smith, Melissa Luna, Danica Warns, Katy Moseley, Julie Sabattis, Frank Hachmann and Jenny Chambers. Managed Access licensed fishers of PHMR also provided significant support with data collection and sample processing in the field. We would also like to express gratitude to: Dr. Rod Fujita from Environmental Defense Fund, CA, USA; Dr. William Harford from University of Miami, FL, USA; Gavin McDonald from University of California, CA, USA; and Nancy Brown-Peterson from University of Southern Mississippi, MS, USA for technical support and critical revision. Additionally we thank the Belize Fisheries Department for providing written endorsement for this study.
References
Acosta, C. A. (2006). Impending trade suspensions of Caribbean Queen conch under CITES: a case study on fishery impacts and potential for stock recovery. Fisheries 31, 601–606. doi: 10.1577/1548-8446(2006)31[601:ITSOCQ]2.0.CO;2
Alcolado, P. M. (1976). Crecimiento, variaciones morfologicas de la concha y algunos datos biologicos del cobo Strombus gigas L. (Mollusca, Mesogastropoda). Academia de Ciencias de Cuba Instituto de Oceanologia 34, 1–36.
Aldana Aranda, D., and Frenkiel, L. (2007). “Lip thickness of Strombus gigas (Mollusca: Gastropoda) versus maturity: a management measure,” in Proceedings of the Gulf and Caribbean Fisheries Institute (San Andres Island), 431–442.
Appeldoorn, R. S. (1988). Age determination, growth, mortality and age of first reproduction in adult Queen conch, Strombus gigas off Puerto Rico. Fish. Res. 6, 363–378. doi: 10.1016/0165-7836(88)90005-7
Avila-Poveda, O. H. (2004). Ciclo Reproductivo del Caracol Pala Strombus gigas Linnaeus 1758 (Gastropoda: Caenogastropoda: Strombidae) del Archipiélago de San Andrés, Providencia y Santa Catalina, Caribe insular Colombiano. M.Sc. thesis, CINVESTAV-IPN, Unidad Mérida.
Avila-Poveda, O. H., and Baqueiro-Cárdenas, E. R. (2006). Size at sexual maturity in the Queen conch Stombus gigas from Colombia. Boletín de Investigaciones Marinas y Costeras 35, 223–233.
Avila-Poveda, O. H., and Baqueiro-Cárdenas, E. R. (2009). Reproductive cycle of Strombus gigas Linnaeus 1758 (Caenogastropoda: Strombidae) from Archipelago of San Andres, Providencia and Santa Catalina, Colombia. Invertebr. Reprod. Dev. 53, 1–12. doi: 10.1080/07924259.2009.9652284
Beddington, J. R., Agnew, D., and Clark, C. W. (2007). Current problems in the management of marine fisheries. Science 316, 1713–1716. doi: 10.1126/science.1137362
Bissada, C. E. (2011). Aspects of the Biology of Queen Conch Strombus gigas in Barbados with Implications for Fisheries Management. M.Phil. thesis, University of the West Indies, Cave Hill.
Byrne, M. (2011). Impact of ocean warming and ocean acidification on marine invertebrate life history stages: vulnerabilities and potential for persistence in a changing ocean. Oceanogr. Mar. Biol. Annu. Rev. 49, 1–42. doi: 10.1201/b11009-2
Clerveaux, W., Danylchuk, A. J., and Clerveaux, V. (2005). “Variation in Queen conch shell morphology: management implications in the Turks and Caicos Islands BWI,” in Proceedings of the Gulf and Caribbean Fisheries Institute (Tortola), 715–724.
Coeurdassier, M., de Vaufleury, A., Crini, N., Scheifler, R., and Badot, P. M. (2005). Assessment of whole effluent toxicity on aquatic snails: bioaccumulation of Cr, Zn, F., and individual effects in bioassays. Environ. Toxicol. Chem. 24, 198–204. doi: 10.1897/03-505.1
Costello, C., Ovando, D., Hilborn, R., Gaines, S. D., Deschenes, O., and Lester, S. E. (2012). Status and solutions for the world's unassessed fisheries. Science 338, 517–520. doi: 10.1126/science.1223389
Daves, N., and Fields, J. (2004). “Recent developments in CITES concerning the international trade in Queen conch (Strombus gigas),” in Proceedings of the Gulf and Caribbean Fisheries Institute (St. Petersburg, FL), 763–770.
Davis, M., Bolton, C. A., and Stoner, A. W. (1993). A comparison of larval development, growth, and shell morphology in three Caribbean Strombus species. Veliger 36, 236–244.
Davis, M. (1998). The Effects of Natural Foods, Temperature and Salinity on the Length of Larval Life for the Tropical Gastropod Strombus gigas. ProQuest Dissertations Publishing.
Delgado, G. A., Bartels, C. T., Glazer, R. A., Brown-Peterson, N. J., and McCarthy, K. J. (2004). Translocation as a strategy to rehabilitate the Queen conch (Strombus gigas) population in the Florida Keys. Fish. Bull. 102, 278–288.
Doney, S. C. (2010). The growing human footprint on coastal and open-ocean biochemistry. Science 328, 1512–1516. doi: 10.1126/science.1185198
Egan, B. D. (1985). Aspects of the Reproductive Biology of Strombus gigas. Master thesis, University of British Columbia, Vancouver, BC.
FAO (2007). Regional Workshop on the Monitoring and Management of Queen Conch, Strombus gigas. FAO Fisheries Report No. 832, Kingston; Rome.
FAO (2014). The State of World Fisheries and Aquaculture. Rome: Food and Agriculture Organization of the United Nations.
Gascoigne, J., and Lipcius, R. N. (2004). Conserving populations at low abundance: delayed functional maturity and Allee effects in reproductive behavior of the Queen conch Stombus gigas. Mar. Ecol. Prog. Ser. 284, 185–194. doi: 10.3354/meps284185
Harford, W. J., Gedamke, T., Babcock, E. A., Carcamo, R., McDonald, G., and Wilson, J. R. (2016). Management strategy evaluation of a multi-indicator adaptive framework for data-limited fisheries management. Bull. Mar. Sci. 92, 423–445. doi: 10.5343/bms.2016.1025
Lemeshow, S., and Hosmer, D. W. (1982). A review of goodness of fit statistics for use in the development of logistic regression models. Am. J. Epidemiol. 115, 92–106.
McDonald, G., Harford, B., Arrivillaga, A., Babcock, A. B., Carcamo, R., Foley, J. R., et al. (2017). An indicator-based adaptive management framework and its development for data-limited fisheries in Belize. Mar. Policy 76, 28–37. doi: 10.1016/j.marpol.2016.11.027
Mitton, J. B., Berg, C. J. Jr., and Orr, K. S. (1989). Population structure, larval dispersal, and gene flow in the queen conch, Strombus gigas, of the Caribbean. Biol. Bull. 177, 356–362. doi: 10.2307/1541595
R Development Core Team (2014). R: A Language and Environment for Statistical Computing. Vienna: R Foundation for Statistical Computing. Available online at: http://www.R-project.org
Randall, J. E. (1964). Contributions to the biology of the Queen conch, Strombus gigas. Bull. Mar. Sci. 14, 246–295.
Ray, M., and Stoner, A. W. (1995). Growth, survivorship, and habitat choice in a newly settled seagrass gastropod, Strombus gigas. Mar. Ecol. Prog. Ser. 123, 83–94. doi: 10.3354/meps123083
Reed, S. E. (1995a). Reproductive anatomy and biology of the genus Strombus in the Caribbean: I. Males. J. Shellfish Res. 14, 325–330.
Reed, S. E. (1995b). Reproductive anatomy and biology of the genus Strombus in the Caribbean: II. Females. J. Shellfish Res. 14, 331–336.
Rogevich, E. C., Hoang, T. C., and Rand, G. M. (2009). Effects of sublethal chronic copper exposure on the growth and reproductive success of the Florida apple snail (Pomacea paludosa). Arch. Environ. Contam. Toxicol. 56, 450–458. doi: 10.1007/s00244-008-9231-5
Spade, D. J., Griffitt, R. J., Liu, L., Brown-Peterson, N. J., Kroll, K. J., Feswick, A., et al. (2010). Queen conch (Strombus gigas) testis regresses during the reproductive season at nearshore sites in the Florida Keys. PLoS ONE 5:e12737. doi: 10.1371/journal.pone.0012737
Stoner, A. W. (1989). Density-dependent growth and grazing effects of juvenile queen conch Strombus gigas L. in a tropical seagrass meadow. J. Exp. Mar. Biol. Ecol. 130, 119–133.
Stoner, A. W., and Sandt, V. J. (1992). Population structure, seasonal movements and feeding of Queen conch, Strombus gigas, in deep-water habitats of the Bahamas. Bull. Mar. Sci. 51, 287–300.
Stoner, A. W., and Schwarte, K. C. (1994). Queen conch, Strombus gigas, reproductive stocks in the central Bahamas, distribution and probable sources. Fish. Bull. 92, 171–179.
Stoner, A. W., and Ray-Culp, M. (2000). Evidence for Allee effect in an overharvested marine gastropod: density-dependent mating and egg production. Mar. Ecol. Prog. Ser. 202, 297–302. doi: 10.3354/meps202297
Stoner, A. W., Davis, M. H., and Booker, C. J. (2012a). Abundance and population structure of queen conch inside and outside a marine protected area: repeat surveys show significant declines. Mar. Ecol. Prog. Ser. 460, 101–114. doi: 10.3354/meps09799
Stoner, A. W., Davis, M. H., and Booker, C. J. (2012b). Negative consequences of Allee effect are compounded by fishing pressure: comparison of queen conch reproduction in fishing grounds and a marine protected area. Bull. Mar. Sci. 88, 89–104. doi: 10.5343/bms.2011.1044
Stoner, A. W., Meuller, K. W., Brown-Peterson, N. J., Davis, M. H., and Booker, C. J. (2012c). Maturation and age in Queen conch (Strombus gigas): urgent need for changes in harvest criteria. Fish. Res. 131–133, 76–84. doi: 10.1016/j.fishres.2012.07.017
Thiele, S. (2005). “Status of the queen conch Strombus gigas stocks, management and trade in the Caribbean,” in Proceedings of the Gulf and Caribbean Fisheries Institute (Tortola), 675–695.
Keywords: queen conch, size at maturity, shell lip thickness, fisheries management, sustainability
Citation: Foley JR and Takahashi M (2017) Shell Lip Thickness Is the Most Reliable Proxy to Sexual Maturity in Queen Conch (Lobatus gigas) of Port Honduras Marine Reserve, Belize; Informing Management to Reduce the Risk of Growth Overfishing. Front. Mar. Sci. 4:179. doi: 10.3389/fmars.2017.00179
Received: 15 March 2017; Accepted: 24 May 2017;
Published: 09 June 2017.
Edited by:
Brett Favaro, Memorial University of Newfoundland, CanadaReviewed by:
Leslie Cornick, Alaska Pacific University, United StatesJohn A. Cigliano, Cedar Crest College, United States
Copyright © 2017 Foley and Takahashi. This is an open-access article distributed under the terms of the Creative Commons Attribution License (CC BY). The use, distribution or reproduction in other forums is permitted, provided the original author(s) or licensor are credited and that the original publication in this journal is cited, in accordance with accepted academic practice. No use, distribution or reproduction is permitted which does not comply with these terms.
*Correspondence: James R. Foley, Y2hpbGVqaW1AaG90bWFpbC5jb20=