 Sarah A. Marley
 Christine Erbe
 Chandra P. Salgado Kent
- Centre for Marine Science and Technology, Curtin University, Perth, WA, Australia
There is growing awareness of underwater noise in a variety of marine habitats, and how such noise may adversely affect marine species. This is of particular concern for acoustically-specialized species, such as dolphins. In order to ascertain the potential impacts of anthropogenic noise on these animals, baseline information is required for defining the soundscape of dolphin habitats. The Swan-Canning River system in Western Australia flows through the city of Perth, and experiences numerous anthropogenic activities. Despite this, the river system is home to a community of Indo-Pacific bottlenose dolphins (Tursiops aduncus). To provide a baseline soundscape description of dolphin habitat, over 11,600 h of acoustic data were analyzed from five sites within the Swan River (from Fremantle Inner Harbor to 20 km upstream) across an 8-year period. Multiple sound sources were recorded at these sites, including: snapping shrimp; fishes; dolphins; pile-driving; bridge and road traffic; and vessel traffic. The two most prevalent sound sources, vessel traffic and snapping shrimp, likely have very different effects on dolphin communication with the former expected to be more disruptive. Sites were characteristic in their prominent sound sources, showing clear among-site variations, with some sites being “noisier” than others based on broadband noise levels, octave-band noise levels, and power spectrum density percentiles. Perth Waters had the highest broadband noise (10–11 kHz; median 113 dB re 1 μPa rms), whilst Heirisson Island was quietest (median 100 dB re 1 μPa rms). Generalized estimating equations identified variation in broadband noise levels within sites at a fine temporal scale, although sites differed in the significance of temporal variables. At Mosman Bay, a long-term dataset spanning eight years highlighted inter-annual variation in broadband noise levels, but no overall upwards or downwards trend over time. Acoustic habitats of the Swan River displayed significant variations at a variety of temporal and spatial scales throughout areas frequented by the local dolphin community. Such variations should be quantified when assessing dolphin acoustic habitat as they may provide significant clues to dolphin behavior.
Introduction
Marine habitats are characterized by a unique combination of topographic structures, environmental conditions, and species compositions. These features contribute, either directly or indirectly, to the acoustic conditions of a particular environment as abiotic (e.g., wind, waves, precipitation, ice break-up, earthquakes) and biotic (e.g., crustaceans, fishes, marine mammals) sound sources. Habitats with human activities also have the added contribution of anthropogenic sound sources. As a result, the “soundscape” of any particular habitat varies in space and time depending on the prevalence of the sound sources within it (Krause, 2008; Pijanowski et al., 2011).
The distribution and occurrence of marine species is often related to physical features, such as depth, seafloor slope, or proximity to shore (Forney, 2000; Cañadas et al., 2002; Elwen and Best, 2004; Elwen et al., 2006). In other cases, species occurrence may be linked with more transient environmental variables, such as sea surface temperature, salinity, or primary productivity (Forney, 2000; Azzellino et al., 2008; Mannocci et al., 2014). Given the acute attenuation of light in water, many marine organisms rely on acoustics to investigate their environment (Nybakken and Bertness, 2005). As a result, introduced anthropogenic underwater noise has been increasingly recognized to act as a chronic, environmental stressor, which can affect both individual animals and ecosystem linkages (Weilgart, 2007; Hatch and Fristrup, 2009; Erbe, 2010; Boyd et al., 2011; Wright et al., 2011; Erbe et al., 2014; Finneran, 2015; Williams et al., 2015b). Thus, for acoustically-specialized fauna, species occurrence may also be influenced by the soundscape of a marine habitat.
Of the acoustically-specialized marine fauna, cetaceans show some of the most elaborate and extreme adaptations for auditory perception and sound production underwater (Tyack and Miller, 2002). Using sound allows these animals to overcome the challenges of limited vision to fulfill a series of vital processes, such as orientation, communication, and foraging. However, these auditory adaptations also make cetaceans especially susceptible to the impacts of anthropogenic noise. The potential effects of underwater noise on cetaceans are widely recognized, ranging from minimal short-term effects to severe long-term effects (Richardson et al., 1995; Nowacek et al., 2007; Southall et al., 2007; Tyack, 2008). At low levels often corresponding with long ranges from the source, anthropogenic noise may be merely detectable by marine mammals. At higher levels, noise may interfere with animal communication and acoustic signal detection, or cause displacement, behavioral disturbance or induce stress. In extreme cases, acoustic exposure might even lead to hearing loss or physical injury (Erbe, 2012).
Coastal areas are among those marine habitats most at risk from human activities (McIntyre, 1999; Moore, 1999). As a result, coastal species—such as bottlenose dolphins (Tursiops sp.)—are among those marine fauna most vulnerable to anthropogenic threats (Thompson et al., 2000; DeMaster et al., 2001). In coastal habitats, the most ubiquitous source of anthropogenic underwater noise is vessel traffic, which has resulted in numerous dolphin behavioral response studies. Results have found evidence of physical and acoustical changes to dolphin behavior, such as alterations to inter-breath intervals, inter-animal distances, movement patterns, activity states, whistle duration or rates, and frequency shifts in whistle characteristics, among others (Hastie et al., 2003; Buckstaff, 2004; Bejder et al., 2006; Lusseau, 2006; Nowacek et al., 2007; Weilgart, 2007; Ellison et al., 2012; Steckenreuter et al., 2012; New et al., 2013; Pirotta et al., 2015; Heiler et al., 2016). Significant changes to foraging success or energy demands (from altered movement, behavior or vocal production patterns) could also affect individual health, reproductive rates, or even long-term population survival. This is of particular concern for small dolphin communities, which tend to exhibit naturally low reproductive rates (Wilson et al., 1999; Ross, 2006). Therefore, knowledge regarding the response of dolphins to vessel traffic is of relevance to managers regulating activities in coastal areas.
However, in order to ascertain the potential impacts of anthropogenic noise on cetacean distribution, population dynamics, and behavior, there is first a requirement for baseline information defining the soundscape of cetacean habitats. Such baseline studies involve describing the habitat in terms of prominent sound sources, levels of acoustic energy in particular frequency bands, and patterns of ambient and anthropogenic noise (e.g., Parks et al., 2009; Erbe et al., 2014; Rice et al., 2014; Guan et al., 2015). Once identified, the acoustic characteristics of critical cetacean habitats can be further examined to determine the potential impact of man-made noise. Such studies can go on to inform management decisions regarding human-use of these areas, and determine whether conservation efforts are best directed toward “fixing” noisy habitats or preserving the remaining quiet areas (Erbe et al., 2014; Williams et al., 2014, 2015a). Given that the underwater soundscape contains sounds driven by weather conditions, environmental variables, and the presence of both marine fauna and human activities, it follows that an acoustic habitat will not be static in its composition. Consequently, whilst generalizations may be made about the acoustic characteristics of some underwater environments, many marine habitats will also display spatial and temporal variability in their acoustic components (Parks et al., 2009; Radford et al., 2010; McWilliam and Hawkins, 2013; Rice et al., 2014; Erbe et al., 2015; Guan et al., 2015; Marley et al., 2016a). Thus, to understand the role acoustic characteristics may play in driving the habitat use of cetaceans, there is a need to quantify the marine soundscape over large areas and across long periods of time.
The Swan River is an estuarine river system flowing through the Western Australian state capital of Perth. It is joined in its middle reaches by the Canning River, and together these rivers form an extensive system with a combined shoreline of approximately 300 km length. The Swan River estuary has a mean depth of 6 m and covers a surface area of approximately 31 km2 (Robson et al., 2008). The system is composed of three distinct regions: an entrance channel at the river mouth; several shallow basins in the middle reaches of the river; and the riverine upper reaches. Despite transiting through a major metropolitan area (>1.4 million people), the Swan-Canning River is home to a small resident community of approximately 18 adult bottlenose dolphins (T. aduncus), plus juveniles and calves (Chabanne et al., 2012; SRT, 2015). The dolphins show daily use of this river system and high site fidelity (Chabanne et al., 2012). Research investigating the spatial and temporal patterns of dolphin occurrence within the rivers has shown that animals are distributed heterogeneously, with certain areas experiencing higher numbers of dolphin sightings than others (Moiler, 2008; Beidatsch, 2012; Marley et al., 2016b). In particular, the Fremantle Inner Harbor has been identified as a seasonal “hotspot” strongly linked with dolphin foraging behavior (Moiler, 2008). Other hotspots of dolphin sightings include Freshwater Bay, Melville Waters, Matilda Bay and Canning Bridge, located within the shallow basins region (Moiler, 2008; Beidatsch, 2012). Yet the dolphins are also sighted throughout the rest of the river system, with their range extending to the upper reaches of both the Swan and Canning Rivers (Beidatsch, 2012; SRT, 2015).
Like many urban estuaries, this river system experiences a range of environmental stressors. For example, in the past the Swan River has suffered from toxic algal blooms, nutrient enrichment, anoxia, pollution, introduced and invasive species, coastal flooding, and habitat modification (Rate et al., 2000; Robson and Hamilton, 2003; Morgan et al., 2004; Gosbell and Clemens, 2006; Eliot, 2012; Smale and Childs, 2012; Adolf et al., 2015; Hourston et al., 2015). These stressors were highlighted by the deaths of six dolphins within the river in 2009, which was hypothesized to be the result of a lowered immune system from multiple pressures, such as contaminant exposure and human activities (Holyoake et al., 2010). Parts of the Swan River have been shown to receive high levels of human activities. Visual monitoring at Perth Waters and the Fremantle Inner Harbor has revealed high levels of vessel traffic engaged in a range of activities (Marley et al., 2016b). Acoustic monitoring at The Narrows—a site mid-way along the Swan River in the Perth Waters area revealed that vessel noise was present in approximately 52% of hourly underwater recordings across a six-week period (Marley et al., 2016a). Similarly, the Fremantle Inner Harbor has been found to contain various sources of anthropogenic noise, including: vessel traffic, train and vehicle traffic passing over a nearby bridge; machinery noise; and wharf construction (Salgado Kent et al., 2012). As underwater noise levels and characteristics increasingly become considered as an indicator of habitat quality, there is a need to characterize the soundscape of the Swan-Canning river system with regard to its bottlenose dolphin population and anthropogenic activities. While past studies have highlighted the variation in soundscape at specific locations (Salgado Kent et al., 2012; Marley et al., 2016a), they have not described how these change in time and over a broader spatial range.
This study aims to examine spatial and temporal variability in the soundscape of the Swan River. Acoustic data collected from five locations along the river across 8 years were used to: (1) identify and compare prominent sound sources defining each site, (2) compare the spatial variability in soundscapes at four locations in the Swan River, (3) identify significant temporal scales (hourly, daily, monthly) of variability within the four sites, (4) describe long-term variability in the soundscape at peak vessel traffic periods (using one exemplary site), and (5) relate prominent sound sources and their spatio-temporal variability to dolphin communication. In particular, the prevalence of vessel noise within the river system was used to determine whether some sites are “noisier” than others and thus have a potential to affect how dolphins use these habitats.
Methods
The Swan-Canning estuary is located along the Western Australian coast. Five locations within the estuary over a distance of 20 km were selected for collecting acoustic data (Figure 1). From west to east, these locations were: Fremantle Inner Harbor (in the lower reaches of the river); Mosman Bay (middle reaches); Matilda Bay (middle reaches); Perth Waters (middle reaches); and Heirisson Island (upper reaches). These five study sites comprise a mixture of dolphin sighting hotspots and areas of human activity along the lower, middle, and upper reaches of the Swan River.
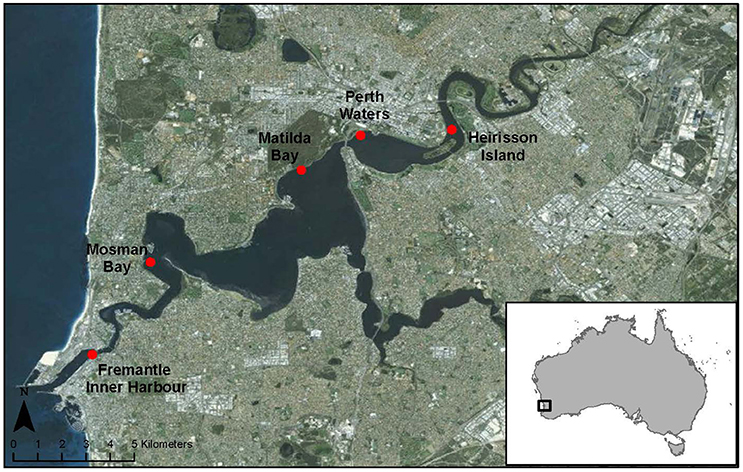
Figure 1. Map of the Swan River with the five acoustic monitoring sites indicated.
The Fremantle Inner Harbor is part of the state's biggest general cargo port and Australia's fourth largest container port (http://www.fremantleports.com.au), experiencing high levels of vessel traffic from commercial and recreational sources (Marley et al., 2016b). However, it has also been identified as a dolphin sighting hotspot, with animals reportedly spending several hours foraging within the Inner Harbor, regardless of vessel densities (Moiler, 2008; Marley et al., 2016b).
Mosman Bay is up-river of the narrow entrance channel at the river mouth. A long tidal sandbar stretches across from the opposite bank, funneling water flow, vessel traffic, and animals as they move down from the wide, shallow basins of the middle river reaches into the narrow, cliff-lined lower reaches. Three water ski areas line the periphery of this area with several boat pens located at the northern side, and the main Swan River ferry route passing through the middle of the bay. Dolphins transit through this site, with opportunistic foraging occurring around the boat pens. Mosman Bay has been identified as a spawning site for mulloway (Argyrosomus japonicus; Farmer et al., 2005). Consequently, this is the site of a long-term fish acoustic monitoring study for the species, which exhibits characteristic spawning-related vocalizations of high source level (Parsons et al., 2013).
Matilda Bay is a dolphin sighting hotspot, which is primarily used for foraging (Moiler, 2008). This small bay has a boat ramp and series of boat pens located on the north-eastern shore, and is adjacent to the main ferry route utilizing the Swan River. The southern river shore opposite Matilda Bay is used as a personal watercraft freestyle area.
Perth Waters comprises a wide (ca. 1.5 km), shallow basin within the middle reaches of the Swan River. It has not been identified as a dolphin hotspot; however, animals traveling between the middle and upper reaches of the Swan River must transit through this area (Marley et al., 2016b). This site contains the Barrack Street ferry terminal, and is also used by recreational boaters and crab fishermen. Additionally, at the time of this study, Elizabeth Quay (http://www.mra.wa.gov.au/projects-and-places/elizabeth-quay) was under development, involving construction and dredging activities.
Finally, Heirisson Island marks the beginning of the riverine upper reaches of the Swan River, characterized by a narrowing of the river as it winds through the Perth Hills. Although not a dolphin hotspot, animals are regularly sighted in the upper reaches of the Swan River. Heirisson Island experiences vessel traffic from both recreational boats and tourism ferries, and is also adjacent to a seasonally-used powerboat racecourse.
Data Collection
A total of 13 underwater acoustic recorders were used to collect soundscape data. Underwater acoustic recorders were one of two types. Low-frequency underwater sound recorders were custom-built by Curtin University's Centre for Marine Science and Technology (CMST) and equipped with external hydrophones, entering the housing via a bulkhead connector to an impedance matching pre-amplifier with 20 dB gain. Digitized recordings (16 bit) were written on a flash card and, when full, to a hard disk in the logger. High-frequency recorders were assembled at CMST, using the same pre-amplifier as in the low-frequency recorders, and a programmable 16-bit data acquisition board made by Wildlife Acoustics Inc. Digitized recordings were written to four 128 GB SD cards. Both recorder types were calibrated by applying white noise of known power spectral density. High-pass filters (8 Hz cut-off) were employed to filter out high levels of low-frequency noise, enhancing the dynamic range of the recorder at the frequencies of interest.
The acoustic recorders were placed on the seabed during all deployments. The recorder was connected to a weighted ground line leading to a main weight; as there was no surface line, the authors grappled for the recorder during recovery. The exception to this was the Fremantle Inner Harbor recorder, which was deployed from a small jetty and tied off by two surface lines. Recorders were deployed on the riverbed for several weeks (Table 1). This allowed for temporal variations in the acoustic environment to be documented over hours, days and weeks, thus giving a representative insight into the acoustic conditions of each deployment over the temporal scales at which soundscape variations are likely to occur (Parsons et al., 2016). In some cases, multiple deployments within the same site were achievable, allowing longer-term measurements of underwater noise (Figure 1; Table 1). The specific recording dates, locations, settings and duty cycles used for each deployment are summarized in Table 1, along with hydrophone sensitivities. Mosman Bay deployments typically recorded for 5 of every 15 min at a sampling frequency of 6 kHz; however, two deployments were at 4 and 5 kHz. The Heirisson Island deployment was part of a separate study targeting high-frequency vessel noise, and so was set to record 40 of every 43 min at a sampling frequency of 96 kHz. The remaining deployments all recorded 10 of every 15 min, with sampling frequencies of either 22 kHz (Matilda Bay, Perth Waters first and second deployments) or 96 kHz (Perth Waters third deployment and Fremantle Inner Harbor). This variation in sampling frequency was a result of whether a low- or high-frequency acoustic recorder was used, which was dependent upon equipment availability.
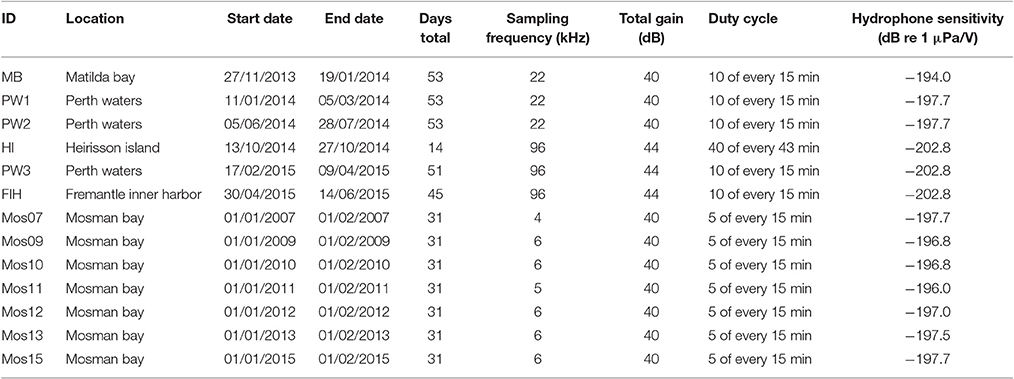
Table 1. Summary of acoustic data collection within the Swan River.
The study was carried out in accordance with the recommendations of the National Health and Medical Research Council Australia code for the care and use of animals for scientific purposes 8th Edition (2013). The protocol was approved by the Curtin University Animal Ethics Committee (Approval Number AEC-2013-28).
Acoustic Analyses
Data were first reviewed in Matlab (Version R2013a, The MathWorks Inc.) using the toolbox CHORUS (Gavrilov and Parsons, 2014). This allowed prominent sound sources for each deployment to be identified. Protocols for further processing of acoustic data broadly followed the methodology of Marley et al. (2016a) and were applied to data collected from each deployment. Recordings were analyzed in Matlab, and were first Fourier transformed in 1 s windows, producing a time series of power spectral density (PSD). Cable noise, where it existed, was identified as brief broadband spikes and the corresponding 1 s windows were discarded from further analysis. Due to the range of sampling frequencies employed, data were down-sampled to correspond with the lowest sampling frequency of 22 kHz. The exception to this were recorders used in Mosman Bay, which had an original sampling frequency of 4–6 kHz (here, down-sampled to 4 kHz), as these were part of a separate study targeting fish calls. Hence, these data were not used in the spatial comparison, and instead were utilized for a long-term temporal overview of soundscape changes in the Swan River.
For all datasets, the PSD was averaged into 10 s windows and the first 10 s PSD average of each minute was plotted in a weekly spectrogram (Mon–Sun). These spectrograms allowed initial visual inspection and comparison of the data. The first 10 s PSD average of each minute was used to compute PSD percentile plots. To reduce computational effort, the PSD was further averaged into a series of adjacent frequency bands, each 10 Hz wide. The nth percentile of each plot gives the level that was exceeded n% of the time, with the 50th percentile representing the median. Thus, these plots illustrate the statistical variability of underwater sound for each deployment across the study period, allowing visual comparison of acoustic power vs. frequency, both within and between sites.
The 1 Hz PSDs of underwater sound were converted to linear units, averaged over 10 min of every acoustic recording and integrated into adjacent octave band levels (OBLs). This resulted in time series of noise levels in each octave band, with one sample corresponding with each acoustic recording, allowing comparison of the noise levels in each OBL across both sites and years. Dolphin whistles in the Fremantle Inner Harbor have been reported to range between 1.1 and 18.4 kHz, with a minimum frequency of 1.1 to 9.0 kHz (Ward et al., 2016). Given this frequency range, it is possible to consider which sound sources may overlap with dolphin communication frequencies and identify which river sites may pose concern given noise levels in their upper OBLs.
Spatial and Temporal Variation
For each recording, broadband noise levels (NL_BB) were calculated as the root-mean-square sound pressure level over the duration of each file. These data were used to compare spatial and temporal variations in NL_BB, both between and within sites. Spatial comparisons were made across all sites except for Mosman Bay, as this dataset was down-sampled at a lower frequency than the other sites. Spatial variation was examined by conducting a Kruskal-Wallis test on the Fremantle, Matilda Bay, Perth Waters, and Heirisson Island datasets. Wilcoxon-Mann-Whitney Tests identified the source of any differences, and the power of these tests was assessed through post hoc tests in G*Power (Vr 3.1.9.2).
To examine short-term temporal variation within sites, Generalized Estimating Equations (GEEs) were applied to the Fremantle, Matilda Bay, Perth Waters, and Heirisson Island datasets. For the purposes of these analyses, data were down-sampled to select only one recording per hour. Temporal variation in NL_BB was examined for hour of day (“Hour”), day type (weekday or weekend; “DayType”), and month of the year (“Month”). GEEs were deemed suitable for these analyses as they account for temporal autocorrelation whilst identifying temporal variation, thus allowing the use of repeated measures data (Zuur et al., 2009; Photopoulou et al., 2011; Bailey et al., 2013). Modeling followed the methods of Marley et al. (2016a), with DayType and Month included as factors. However, as time of day forms part of a cycle, the variable Hour (h) was converted to a cyclical covariate using sine and cosine vectors, termed Hs and Hc respectively (Zuur et al., 2009; Bailey et al., 2013):
This allowed hours at the start and end of the day to be considered close to each other (e.g., 23:00 and 01:00 h). A similar approach has been undertaken by other studies to include circular variables as model terms (Griffin and Griffin, 2003; Bailey et al., 2009, 2010, 2013; Pirotta et al., 2013; De Boer et al., 2014; Marley et al., 2016a). This approach was not applied to Month due to datasets generally being limited to only a few months.
The GEE model used a gamma error distribution with a log-link function. Gamma distributions are appropriate for continuous response variables which have positive values (Zuur et al., 2009). Variance Inflation Factors (VIFs; Zuur et al., 2010) were calculated, but revealed no collinear variables in the model. However, a Runs Test indicated that there was an issue with correlation in the model residuals (p < 0.001); therefore, a blocking structure was selected to model this correlation.
GEEs account for temporal autocorrelation via within-cluster correlations to increase the estimation efficiency, thus allowing maximum use of sequential or repeated measures data (Zuur et al., 2009; Bailey et al., 2013). To select clusters for the model blocks (ID), the autocorrelation of the model residuals by ID was plotted to check for a decline in correlation over time. During each separate “Date” (a sequential value beginning on Day 1 of sampling and ending on the final day of sampling), the correlation of observations made hourly declined to approximately zero within a 24-h period. Thus, separate days were treated as independent, and so “Date” was selected to define clusters of data points within which residuals were allowed to be autocorrelated. Given that the data were serially correlated and that GEEs are robust in providing consistent estimates of mean parameters even when the correlation structure is mis-specified, an AR-1 correlation structure was selected as the most logical option for the model.
Selection of the best model was assessed via a quasi-likelihood criterion (QIC; Pan, 2001) and model fit was assessed by plotting observed vs. fitted values and fitted values vs. scaled Pearson's residuals. Once the final model was selected, repeated Wald's tests were used to assess the significance of each temporal variable, and partial residual plots of significant terms were created.
Long-term temporal variation of high vessel traffic periods was assessed for Mosman Bay. This site included 7 years of data collected between 2006 and 2015. Although several months of data were recorded each year, only January was retained because it was consistently captured each year and also represents the austral summer, when high levels of anthropogenic activities were expected to occur. In January, daily mulloway choruses were recorded in the late evening. To explore sources associated with human “rush hour” as opposed to peak mulloway chorusing, only acoustic data from the morning (06:00–12:00 h) were used (Marley et al., 2016a,b). A Kruskal-Wallis test was applied to this multi-year dataset to identify variations between years; the source of differences were then identified by Wilcoxon-Mann-Whitney Tests. Statistical power was again assessed using G*Power (Vr 3.1.9.2).
All statistical analyses were conducted in R (R Core Team, 2015) with the aid of the geepack (Yan, 2002; Yan and Fine, 2004; Højsgaard et al., 2006), MESS (Ekstrom, 2014), MRSea (Scott-Hayward et al., 2014), and stats (R Core Team, 2015) packages.
Results
A total of over 11,600 h of acoustic data were collected during 14 deployments at five sites within the Swan River. Of these, approximately 6,450 h from seven deployments at four sites were analyzed for spatial and short-term temporal comparisons, whilst 5,200 h from seven annual deployments at Mosman Bay were analyzed to assess long-term temporal variation.
Prominent Sound Sources
Prominent sounds recorded in this study came from biotic and anthropogenic sources. These included: snapping shrimp; fish choruses; dolphin clicks and whistles; impulse pile-driving; trains and/or vehicles passing over nearby bridges; and vessel traffic.
Dolphin sounds were most abundant in the Fremantle Inner Harbor, where both whistles and echolocation clicks were frequently recorded (Figures 2A,B). While sounds likely produced by fish occurred at all locations, fish choruses were only observed at the Heirisson Island site (Figure 2C), although they are known to occur in other areas of the river such as Blackwall Reach and Mosman Bay (Parsons et al., 2013). Snapping shrimp were observed in all locations to varying degrees (e.g., Figure 2D).
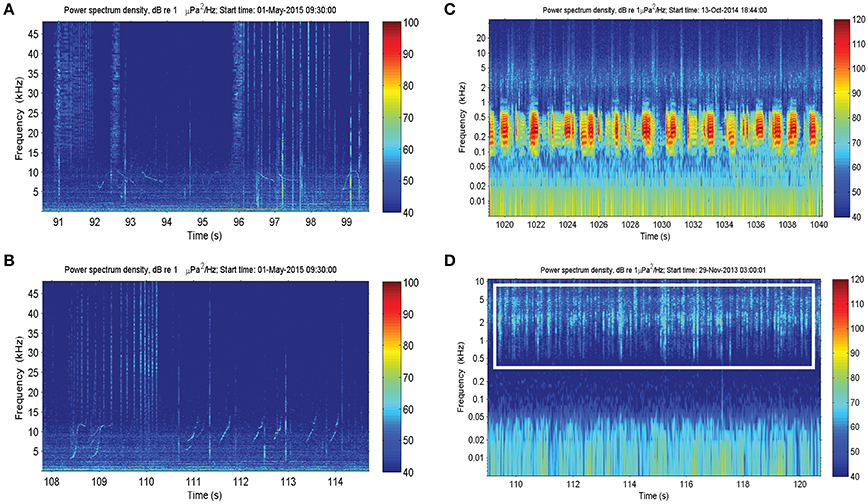
Figure 2. Biotic sound sources recorded within the Swan River included: (A,B) the clicks and whistles of Indo-Pacific bottlenose dolphins; (C) mulloway fish choruses; and (D) snapping shrimp.
There were also a number of additional anthropogenic sounds. Pile-driving was heard at Heirisson Island, due to adjacent shore-based construction works (Figure 3A). The sound of pile-driving recorded in water consists of series of sharp pulses every few seconds (see Erbe, 2009, for pile driving recorded in equally shallow water). High-frequency “blips” thought to originate from vessel echo-sounders were observed in Fremantle Inner Harbor (Figure 3B). In Matilda Bay, series of very low-frequency pulses were observed (Figure 3C). Similar pulses have been previously reported at the neighboring Narrows Bridge site (Marley et al., 2016a), where they were hypothesized to be the result of train or vehicle traffic crossing the bridge. The Matilda Bay deployment site was adjacent to a busy main road, which may be the source of this sound.
Figure 3. Anthropogenic sound sources within the Swan River included: (A) pile-driving; (B) vessel echosounders; and (C) unknown series of low-frequency impulses thought to originate from vehicle traffic.
One of the most striking features was the variability in sounds produced by vessel traffic (Figure 4). In the Fremantle Inner Harbor, there was near-continuous background noise from transiting vessels and idling engines, in addition to sounds from near-passing vessels (Figure 4A). In other areas, vessel sounds included steady tones (Figures 4B,C), series of engine revs increasing with engine rotations per minute (Figure 4D; Erbe et al., 2016a), undulating tones with many harmonics from jet skis (Figure 4E; Erbe, 2013), and bands across the low and high frequencies (Figures 4B,F, respectively). Considering all the variations observed, vessel noise has the potential to range from 5 to over 20 kHz. The highest frequency sounds were observed in the presence of small powerboats engaged in high-speed races near Heirisson Island (Figure 4F).
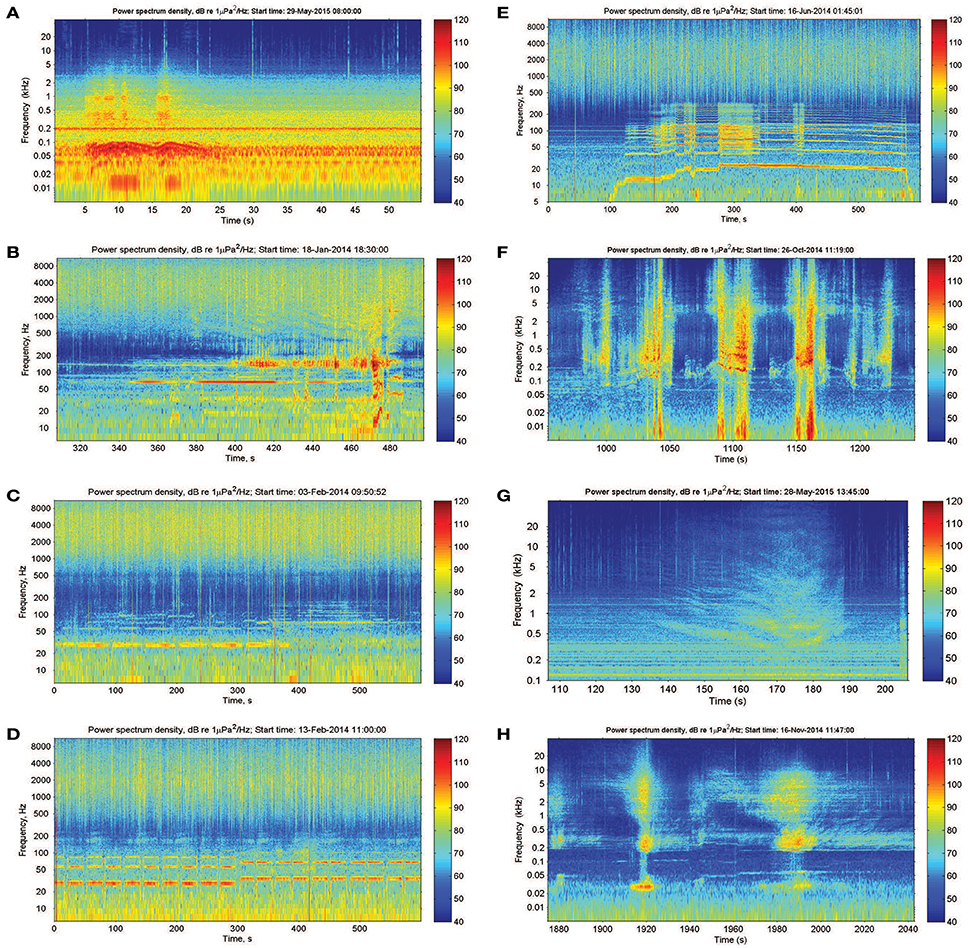
Figure 4. A sample of the various types of sounds produced by vessel traffic in the Swan River.
Spatial Variation
Significant variation in NL_BB occurred among the four Swan River sites (Fremantle Inner Harbor, Matilda Bay, Perth Waters, and Heirisson Island; Kruskal-Wallis test X2 = 4,252.6, df = 3, p < 0.001; Figure 5). All sites were significantly different from each other (Wilcoxon-Mann-Whitney Tests all had p < 0.001). The effect size of site ranged from 0.12 to 1.15, achieving a power of 0.77–1.00. Median NL_BB's for the four Swan River sites were: Fremantle Inner Harbor 106 dB re 1 μPa; Matilda Bay 107 dB re 1 μPa; Perth Waters 113 dB re 1 μPa; and Heirisson Island 100 dB re 1 μPa.
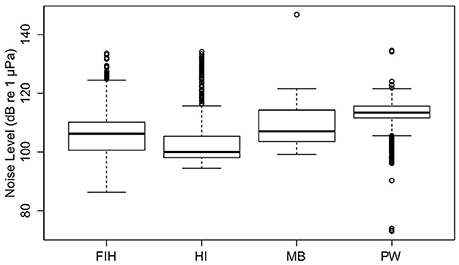
Figure 5. Overall broadband noise levels (NL_BB) of four Swan River sites: Fremantle Inner Habour (FIH), Heirisson Island (HI), Matilda Bay (MB) and Perth Waters (PW).
The soundscapes of the four Swan River sites were further compared by investigating PSD percentile plots (Figure 6). The most obvious feature of the Fremantle Inner Harbor dataset was the presence of vessel traffic at 0.05–1 kHz. As a result of this sound source, the Fremantle site was only as quiet as other Swan River sites <5% of the time. In addition to noise from vessel traffic, there was near-continuous background anthropogenic noise from Port operations, such as machinery and engine noise. Despite this site being located closest to the ocean and containing numerous structures for settlement, noise from snapping shrimp was not often detected. Shrimp clicks were detected sporadically, and did not dominate the weekly spectrograms or PSD percentile plots (unlike at other sites, such as Matilda Bay or Perth Waters). Dolphin clicks and whistles were frequently present in manually reviewed acoustic files; however, these transient events did not cause any obvious spikes in PSD percentile plots.
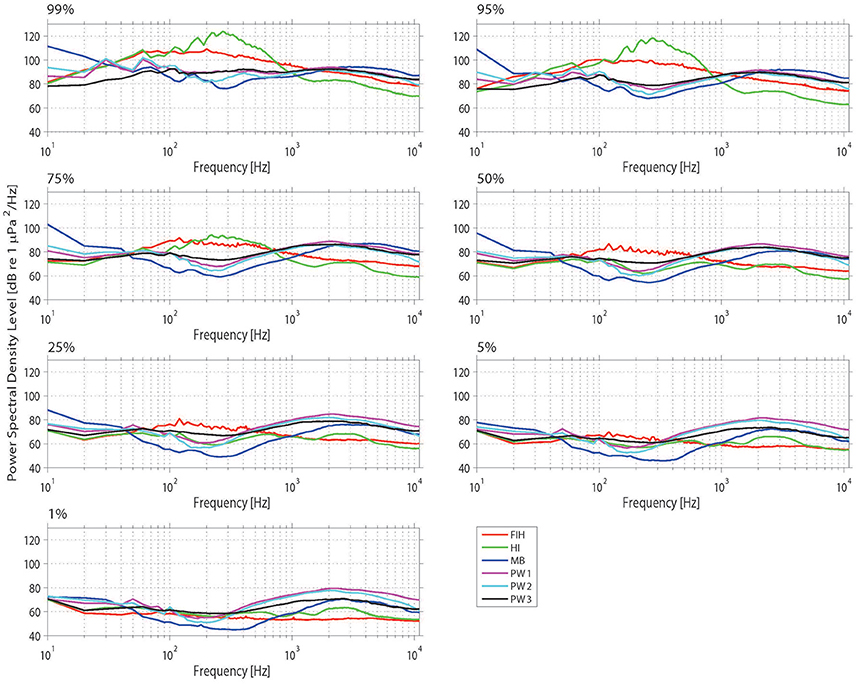
Figure 6. Power spectrum density (PSD) percentiles (averaged into 10 Hz bands) from the four sites considered in the spatial analysis. The nth percentile gives the level that was exceeded n% of the time.
The Matilda Bay acoustic measurements resulted in higher PSD levels in the lower frequencies (Figure 6), which corresponded with observed trends in the weekly spectrograms. Matilda Bay had the strongest prevalence of snapping shrimp of all sites. Numerous vessel transits were visible in the weekly spectrograms, particularly during the daytime; yet these did not form the same strong bands of vessel noise observed in the Fremantle Inner Harbor. Matilda Bay exhibited some of the quietest recorded ambient noise levels in the 100–1,000 Hz band.
Three deployments occurred at Perth Waters. The first and second deployments were similar in terms of overall noise levels in the lower frequencies, whilst in the higher frequencies the second and third deployments showed greater similarity (Figure 6). Spectrograms from this site also showed daily patterns of low-frequency noise bands were present, which were particularly prominent in the second deployment. Snapping shrimp noise was a strong feature at this site and was slightly louder than in Matilda Bay (Figure 6).
One deployment occurred at Heirisson Island, the most prominent feature of which was the presence of a fish chorus from 50 to 500 Hz (Figure 6). Snapping shrimp were minimally observed at this site, which is located in the upper, riverine reaches of the Swan River. At the higher frequencies (>1 kHz), there is evidence of high-frequency vessel traffic approximately 1% of the time. This corresponds to high-speed powerboats, which occasionally race in this area during the austral summer months (Figure 4F). Powerboats also contributed to the frequency band of fish chorusing (Figures 2C, 4F) but occurred temporally out of sync, with boats recorded during the day and fish at night.
When individual OBLs are considered, it is evident that some levels vary between sites more substantially than others (Figure 7). Levels at Matilda Bay and Perth Waters were higher than other sites in the OBL centered at 20 Hz, reflecting the presence of unidentified low-frequency anthropogenic sounds (Figure 3C). All sites were similar at the 40 Hz OBL. Fremantle Inner Harbor was highest at mid-range OBLs centered at 80, 160, 320, and 640 Hz, reflecting the high level of vessel traffic at this site. Levels at Heirisson Island also had a wide range across these OBLs, due to the presence of a fish chorus. Levels at Matilda Bay were highest in the OBLs centered at 1,280, 2,560, and 5,120 Hz, followed by the Perth Waters deployments. This energy reflected the prevalence of snapping shrimp at these sites.
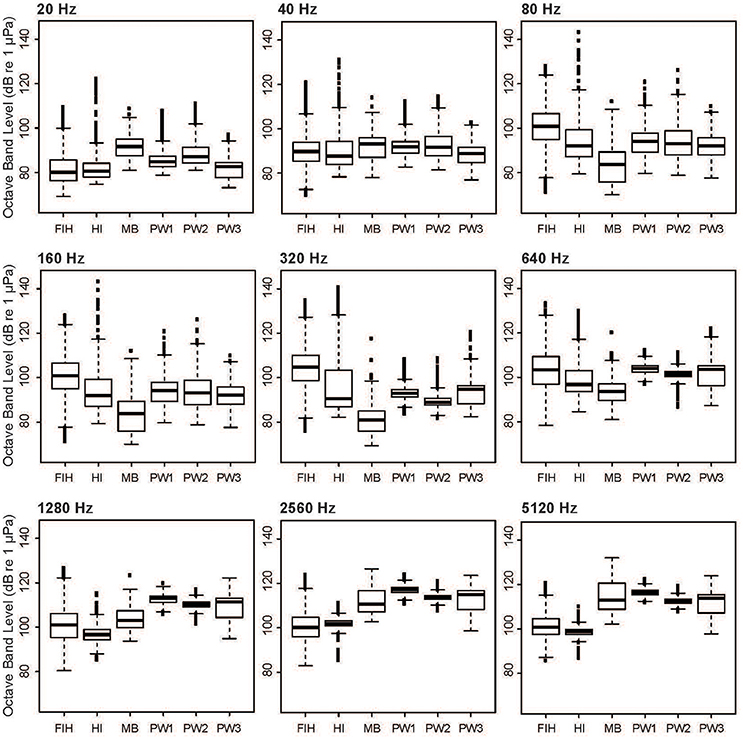
Figure 7. Variation in selected octave-band levels between the four sites considered in the spatial analysis: Fremantle Inner Harbor (FIH); Heirisson Island (HI); Matilda Bay (MB); and Perth Waters (PW1-3).
Short-Term Temporal Variation
There were significant temporal variations within each site based on GEE results (Table 2; Figure 8). NL_BB at Fremantle Inner Harbor varied by Hour (X2 = 55.848, p < 0.001), DayType (X2 = 5.212, p = 0.022), and Month (X2 = 8.301, p < 0.001). Noise levels were typically higher during the day at this site, peaking at approximately 09:00 h. Weekday noise levels were higher than those of the weekend, and May was noisier than June.
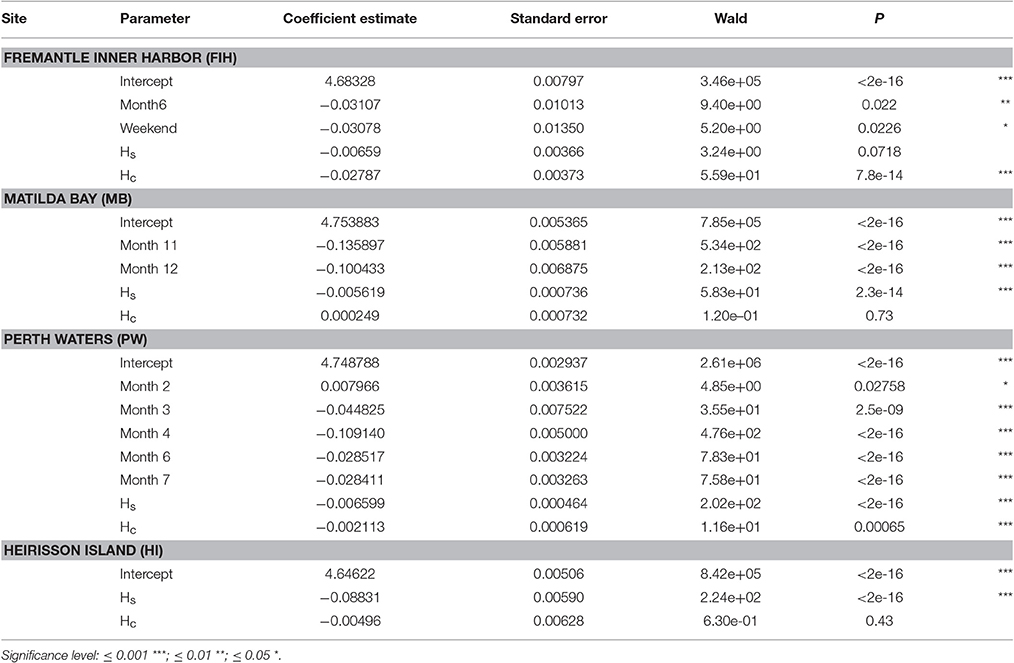
Table 2. Summary of generalized estimating equation (GEE) models investigating temporal patterns within Swan River sites at the scale of Month, DayType (Weekday or Weekend), and Hour (a cyclical variable represented by Hs and Hc).
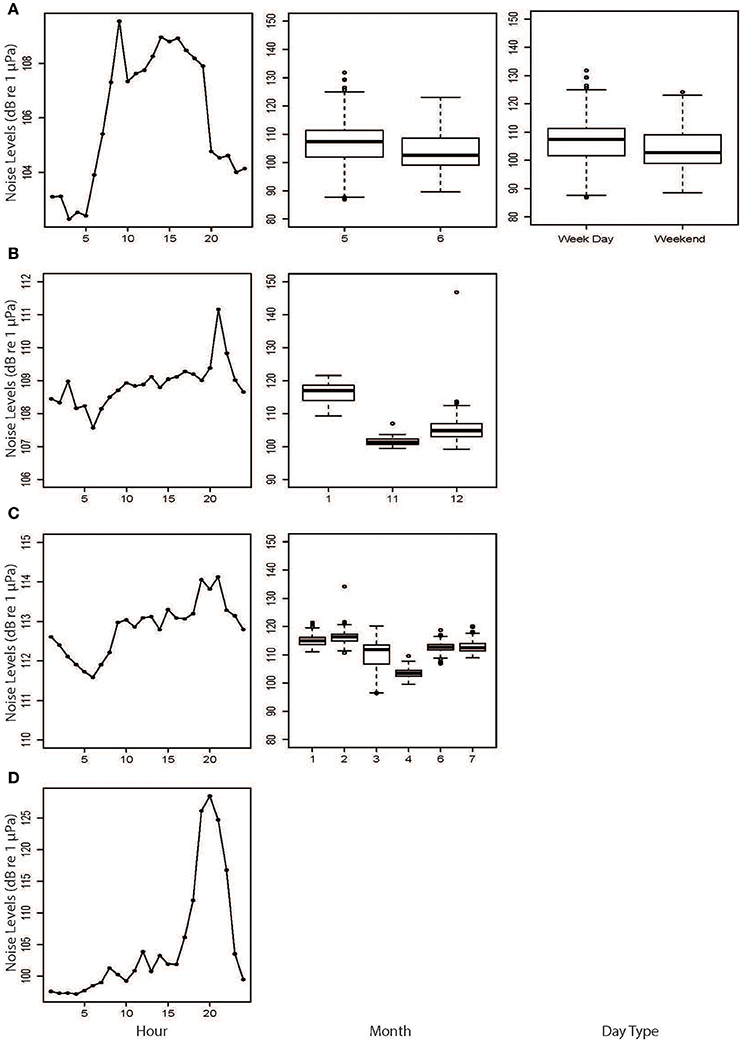
Figure 8. Results from the generalized estimating equations (GEEs) based on hourly broadband noise levels from (A) Fremantle Inner Harbor, (B) Matilda Bay, (C) Perth Waters, and (D) Heirisson Island. Only significant explanatory variables are shown.
The Matilda Bay GEE retained Hour (X2 = 59.07, p < 0.001) and Month (X2 = 515.05, p < 0.001) as significant variables. At this site, noise levels gradually increased throughout the day before peaking at 20:00 h. Noise levels increased over the austral summer months (November to January).
Perth Waters retained Hour (X2 = 11.64, p < 0.001) and Month (X2 = 780.37, p < 0.001) as significant variables. Noise levels sharply increased between 08:00 and 10:00 h then peaked between 19:00 and 21:00 h before decreasing overnight. April was the quietest month.
Heirisson Island only retained Hour (X2 = 223.739, p < 0.001) as a significant variable. It showed a gradual increase in noise levels throughout the day, then a sharp peak between 18:00 and 22:00 h; this period coincided with the evening fish chorus identified in the weekly spectrograms.
Long-Term Temporal Variation
In Mosman Bay, NL_BB measured in January differed among the seven years of measurement (Kruskal-Wallis X2 = 102.75, df = 6, p < 0.001; Figure 9). NL_BB in 2010 was greatest, whilst NL_BB in 2013 and 2015 were most similar. The effect size of year ranged from 0.01 to 0.49, achieving a power of 0.06–1.00.
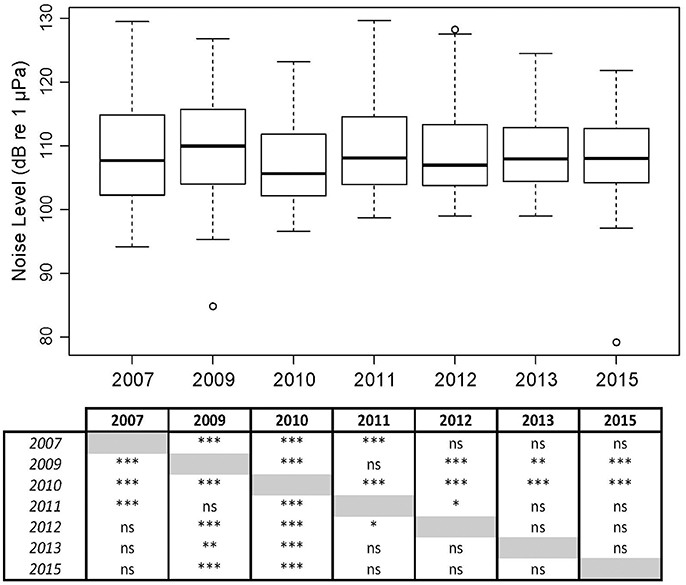
Figure 9. Overall broadband noise levels (NL_BB) at Mosman Bay over the month of January across a 9-year period, including a table of significant differences as determined by Wilcoxon-Mann-Whitney Tests: ≤ 0.001 ***; ≤ 0.01 **; ≤ 0.05 *.
The Mosman Bay PSD percentile plots and OBLs show that the soundscape at this site was very similar over the years (Figures 10, 11). Most noise occurred in the 70–300 Hz frequency band. Closer examination in the weekly spectrograms suggested the noise was produced by vessel traffic. About 5% of the time, noise in this band was above 100 dB re 1 μPa2/Hz for all years considered. This noise only dropped to below 70 dB re 1 μPa2/Hz less than 5% of the time. There was no trend of decreasing or increasing noise levels at any frequency over the 7-year period of acoustic monitoring in Mosman Bay.
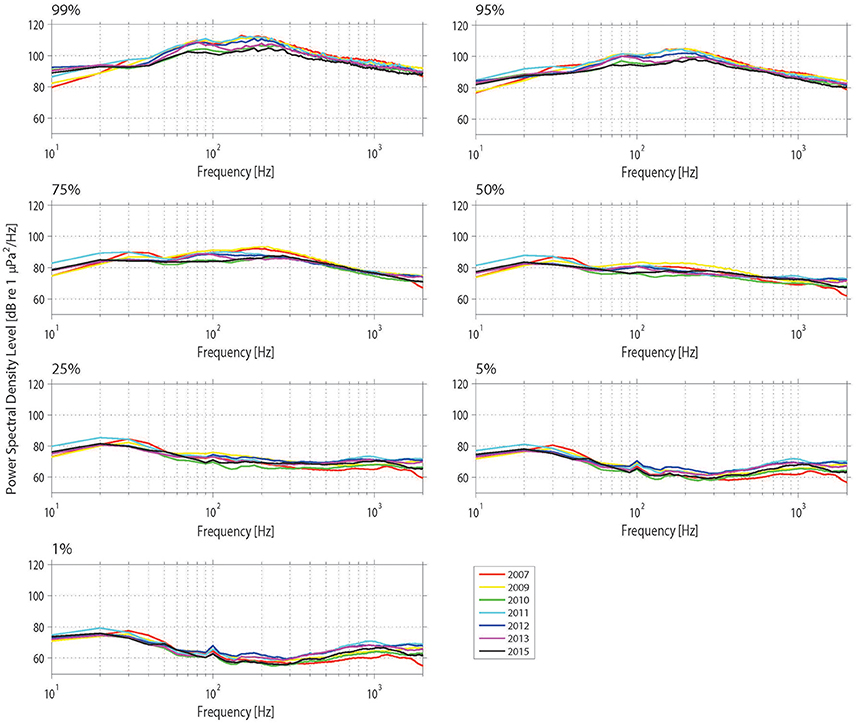
Figure 10. Power spectrum density (PSD) percentiles (averaged into 10 Hz bands) at Mosman Bay over the month of January across the 9-year period considered in the temporal analysis. The nth percentile gives the level that was exceeded n% of the time.
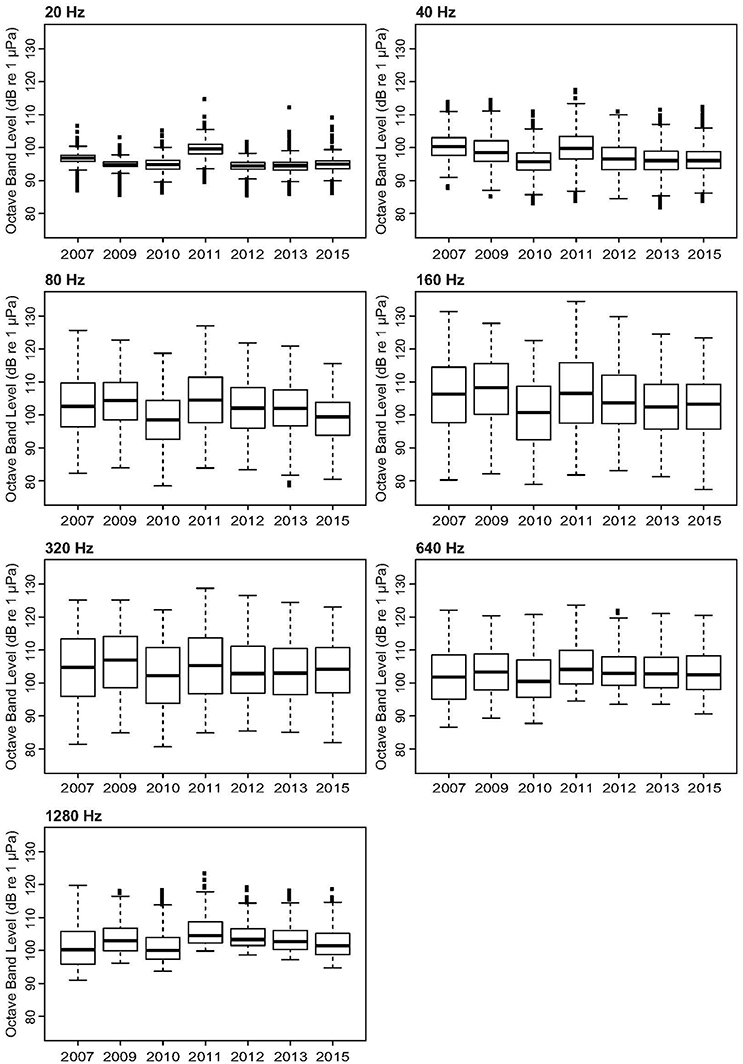
Figure 11. Variation in selected octave-band noise levels across the 9-year period considered in the temporal analysis of Mosman Bay.
Relevance to Dolphin Communication
Dolphin whistles could be expected to overlap with OBLs centered at 1,280, 2,560, and 5,120 Hz (Figure 7). High mean noise levels at these OBLs were present at Matilda Bay and Perth Waters due to the presence of snapping shrimp. In comparison, Heirisson Island and the Fremantle Inner Harbor had lower mean values. However, the high variability of levels at the Fremantle Inner Harbor resulted in levels occasionally surpassing those of Matilda Bay and Perth Waters. Due to the relatively low levels of snapping shrimp noise in Fremantle Inner Harbor when compared to other study sites, these “noisiest” periods are likely attributable to high vessel traffic.
When considered as individual sound sources, snapping shrimp and vessel traffic produce noise across a wide frequency band that can overlap with dolphin whistles (Figures 2D, 4, respectively). However, the spectro-temporal structures of these sounds differ considerably. Whilst colonies of snapping shrimp produce frequent impulsive broadband clicks, each lasting a few milliseconds, vessels produce continuous broadband noise from propeller cavitation and long-lasting tonal sounds due to engine and propeller rotations (e.g., Erbe et al., 2016a). Propeller cavitation is a stochastic process, and the resulting power spectrum has characteristics of pink noise. Shrimp snaps, on the other hand, show a higher degree of comodulation across frequency (Branstetter et al., 2013). It is the different temporal structures and comodulation degrees that will likely reduce the risk of acoustic masking by snapping shrimp over that of vessels (Erbe, 2008; Erbe et al., 2016b). In other words, high levels of vessel traffic in Fremantle Inner Harbor are more likely to mask dolphin whistles than high levels of snapping shrimp in Matilda Bay.
Discussion
This study describes the acoustic habitat in the core range of the Swan River dolphin community, at varying spatial and temporal scales. Overall, there were two predominant sound sources which occurred at multiple sites: snapping shrimp and vessel traffic. From the acoustic perspective of the resident dolphin community, both of these sound sources overlap with the frequency range of dolphin whistles used for communication. However, whilst snapping shrimp sounds are brief, impulsive, repetitive, and their spectrum comodulated across multiple frequencies, the propeller cavitation noise produced by vessel traffic is temporally continuous and spectrally not comodulated. Thus, the latter is more likely to interfere with dolphin whistles, particularly where multiple vessels are simultaneously contributing to the soundscape. Additionally, the number of sound sources identified and their changeability throughout the river system clearly illustrates the spatially variable acoustic environment experienced by this community of bottlenose dolphins. High within-site temporal variability observed over small and large temporal scales (hours to years) adds another layer of complexity to this acoustic environment.
In this study, the most ubiquitous sound source was vessel noise, which was present at all sites to some degree. The Swan River is known to be a site of high vessel traffic, used by vessels of numerous types engaged in a range of activities (Marley et al., 2016b). However, despite their prevalence, vessel sounds were not consistent. In fact, the extreme variation in vessel sounds was in marked contrast to the much lower variability in characteristics of prominent biotic sounds, such as shrimp snaps and fish calls, which were of comparatively predictable duration and frequency. The high variability in vessel acoustic features is a result of differences in vessel type, speed and behavior; the physical characteristics of the environment; and varying distances from the receiver (see Erbe, 2013; Erbe et al., 2016a for variability of underwater noise from jetskis and small boats with outboard motors, which are the most common type of vessel in the Swan River). For example, some vessels produced bursts of low-frequency “revs” with relatively few harmonics, whilst others produced mid-frequency tonal sounds with several harmonics for a few minutes, and many dominated the entire frequency band for the whole recording period of 10 min. Low-frequency sounds (centered at 35 Hz) have previously been recorded from passenger ferries operating in Perth Waters (Marley et al., 2016a). Some of these ferries also venture to other parts of the river, traveling past Heirisson Island, Perth Waters, Matilda Bay and the Fremantle Inner Harbor. Vessels are often observed milling in some parts of the river (e.g., Perth Waters), where they circle an area at low speeds for a prolonged period of time, and the engine may be stopped and started several times as the vessel moves between particular spots (Marley et al., 2016b). Such vessel behavior, which often coincides with fishing or crabbing activities, likely contributes to the low-frequency acoustic environment of the river system. The highest frequency vessel sounds were observed in the presence of small powerboats engaged in high-speed races near Heirisson Island. Such races can involve several competing powerboats at any one time, with the most powerful boats claimed to “regularly achieve over 170 kph” (http://www.wasbc.com.au). This race site is situated at the start of the upper riverine reaches of the Swan River system, where the river narrows to only 450 m wide. Given the high-frequency noise produced by these vessels and the narrow nature of the river in this area, there could be potential for displacement of dolphins whose communication whistles could be masked.
The wide array of sound characteristics—even from the same source type—contributed to the spatial and temporal variability of the acoustic environment experienced by this dolphin community. Each of the sites considered had its own characteristic combination of contributing sound sources. The minimum distance between any two of these sites is approximately 2.5 km, highlighting the site-specific nature of acoustic habitats within the same system. This agrees with findings of previous studies. Soundscape studies in New Zealand (Radford et al., 2010), Pacific Panama (Kennedy et al., 2010), the U.S. east coast (Rice et al., 2014) and Taiwan (Guan et al., 2015) have also noted site-specific sound fields at locations several kilometers apart, generally as the result of biotic or anthropogenic activities. Additionally, there was considerable temporal variation within sites. The Fremantle Inner Harbor was noisiest between the hours of 08:00–20:00 h, particularly on weekdays. The presence of both recreational vessel traffic and port activities at these times combine to increase average noise levels. Matilda Bay and Perth waters also displayed increased noise levels during the day, likely from vessel traffic. Noise levels at Heirisson Island only slightly increased during the day; instead, the ‘noisiest’ period occurred between the hours of 18:00–22:00 h as a result of the evening fish chorus. In the Swan River, the “noisiness” of each site also varied according to the frequency band considered; all sites were uniformly quieter in the lowest frequency OBLs, but at the mid- and upper-frequency OBLs there were considerable differences between sites. Overall, snapping shrimp sounds were prevalent at Matilda Bay and Perth Waters, whilst Heirisson Island displayed a strong fish chorus, and the Fremantle Inner Harbor was dominated by sounds from vessel traffic and port activities. In the OBLs centered on frequencies also utilized by dolphins, noise from vessel traffic and snapping shrimp caused the greatest variation.
How dolphins may respond to vessel traffic in the Swan River is still under investigation. A previous study on dolphin occupancy in response to vessel traffic found that despite similarities in vessel densities, dolphins showed differential use of two monitored sites within the river (Marley et al., 2016b). Fewer dolphin sightings were recorded at Perth Waters when vessel densities were high, whereas vessel traffic appeared to have no relationship with dolphin occupancy in the Fremantle Inner Harbor (Marley et al., 2016b). The acoustic data presented here from Perth Waters 1, Perth Waters 3 and the Fremantle Inner Harbor overlap temporally with the visual observations presented in Marley et al. (2016b). It can be clearly seen that dolphins are not experiencing the same acoustic environment at these two separate sites; yet dolphins remained present at the anthropogenically busiest, noisiest one. Future research investigating whether certain vessel characteristics (physical, behavioral or acoustical) elicit responses in Swan River dolphins beyond changes in animal occupancy would provide insight into finer scale responses. These responses could be physical behavioral changes such as alterations to swim speed, activity state, movement patterns, or acoustical behavioral changes such as variations in whistle frequency, repetition, or duration.
To determine the level at which dolphin communications are being masked at anthropogenically noisy sites (such as the Fremantle Inner Harbor), future work on source levels and transmission of whistles in the Swan River is required. In addition, data on how the structure of Swan River dolphin whistles may change in different contextual scenarios should be measured. The acoustic characteristics of whistles appear to vary between dolphin populations, in terms of frequency content, bandwidth, duration, extrema, steps and inflection points (Ding et al., 1995; May-Collado and Wartzok, 2008; Hawkins, 2010; Ward et al., 2016). These differences may be due to distance (e.g., separate vocal evolution, low exchange rates of individuals) or as a result of context (e.g., group composition, behavior). Variations in whistle characteristics could also reflect different environments in terms of physical or environmental characteristics, such as water depth, sediment type, salinity and/or temperature. Ambient noise is increasingly becoming considered an indicator of environmental quality, which could also influence features and use of dolphin whistles (Buckstaff, 2004; Morisaka et al., 2005; Guerra et al., 2014; May-Collado and Quiñones-Lebrón, 2014; Heiler et al., 2016). Furthermore, different dolphin populations also appear to vary in the source levels of the whistles they produce (Jensen et al., 2012). To date, the only published analysis of the Swan River dolphins' repertoire describes the characteristics of whistles recorded in the Fremantle Inner Harbor and does not include source levels or contextual analysis (Ward et al., 2016). Additionally, little is known about the source levels of different sound types in the Swan River, particularly from anthropogenic activities. Anthropogenic noise has the potential to degrade habitat through a loss of “acoustic space.” In areas which experience high levels of anthropogenic noise, habitat fragmentation may even occur if animals are unable or unwilling to transit through noisy areas in order to reach necessary habitat (Rice et al., 2014). Thus, it would be beneficial to document the structure and source levels of dolphin whistles and human activities at multiple sites throughout the Swan River to see if differences exist in “noisy” vs. “quiet” habitats.
The lack of any long-term increase or decrease in noise levels at Mosman Bay suggests a degree of temporal stability within this site. There is growing concern regarding the increasing level of underwater noise in many coastal areas as a result of expanding anthropogenic activities. Mosman Bay is the site of a long-term acoustic monitoring study due to a prominent fish chorus associated with seasonally-breeding mulloway. To focus on potential increases in anthropogenic noise and avoid including the evening fish chorus in analyses, only data from 06:00 to 12:00 h were assessed. This period was expected to overlap with the morning vessel “rush hour” reported in other studies at different points in the river (Marley et al., 2016a,b), during a month of increased recreational time due to the austral summer holidays. Although years were not all the same, their average noise levels were all within 3 dB, displaying no overall upwards or downwards trend in yearly noise levels within Mosman Bay. The relatively low effect size associated with the majority of yearly comparisons suggests that, although significant, differences are not considerable. Despite considerable urban growth within Perth over this time period (average annual rate of population grown 2.7% between 2007 and 2015; ABS, 2016), noise levels at Mosman Bay did not increase. Thus, despite some inter-year variability, there appears to be a general long-term stability in the soundscape of this site.
Such acoustic stability in localized soundscapes could be beneficial for long-lived animals such as dolphins, as this may indicate the possibility of predictability in a variable environment. If dolphins are able to use acoustics to aid predictions of when and where different sound sources occur in the river system, this may influence their habitat use. For example, fish calls may indicate prey availability and signal an “attractive” area, whereas vessel or pile-driving noise may signal an “unattractive” area where animals are at risk of disturbance or harm. This information could be particularly important for the decision-making of mother-calf pairs, who may have a greater preference for quieter areas for vital nursing and resting activities. Previous studies within the Swan River have found differential site use by dolphins in response to site-specific environmental and anthropogenic variables (Moiler, 2008; Beidatsch, 2012; Marley et al., 2016b). It could therefore be particularly beneficial to ascertain the relationship between the acoustic characteristics of the environment and dolphin occurrence or behavior.
In conclusion, the Swan River is a highly variable acoustic environment, experiencing a large range of different sound sources. The most ubiquitous noise in the Swan River came from vessel traffic, which was persistent at all sites considered, followed by snapping shrimp which had site-specific prevalence. Although these two sound sources are both strong acoustic components of the Swan River soundscape over similar frequency ranges, their impact on dolphin communication is likely to contrast due to structural differences, with vessel noise suggested to be the more detrimental. The prominence of these sound sources varied spatially, resulting in characteristic soundscapes at different sites within the same river system. Some sites are therefore “noisier” than others, with the Fremantle Inner Harbor the noisiest from an anthropogenic perspective. However, there was variation in “noisiness” within sites, with different sites showing temporal variation in broadband noise levels at the scale of hours, days, months or even (to some degree) years. This spatial and temporal variation illustrates the acoustic complexity of the Swan River soundscape. How dolphins effectively navigate this spatially and temporally complex environment, and at what stage anthropogenic noise becomes too much to maintain a healthy dolphin community, has yet to be determined. Thus, when considering dolphin acoustic habitat, it is beneficial to consider the context of soundscape contributors—their frequency structure, duration, variability within source type, and spatio-temporal prevalence.
Author Contributions
Conceived and designed study: SM, CS, CE, and MP. Collected and analyzed the data: SM, with contributions to data collection from MP. Advised on analyses: CE, CS, and IP. Wrote the manuscript: SM, with contributions to drafting, critical review, and editorial input from CE, CS, MP, and IP.
Conflict of Interest Statement
The authors declare that the research was conducted in the absence of any commercial or financial relationships that could be construed as a potential conflict of interest.
Acknowledgments
The authors would like to thank the following people for their invaluable support of this research: Sylvia Osterrieder, Tim Gourlay, Tristan Lippert, Jamie McWilliam, Nick Riddoch, Leila Fouda, Montserrat Landero, and Scott Ha for assistance in the deployment and recovery of acoustic equipment; David Minchin, Malcolm Perry and Michael Bittle for assistance in the technical aspects of acoustic logger and mooring preparation; and Alexander Gavrilov for Matlab assistance. The Fremantle Port Authority and Swan River Trust generously granted access to different field sites for data collection and provided field support. Long-term acoustic data used in the Mosman Bay analysis was collected as part of a Fisheries Research and Development Corporation project, funded by the Australian Government. And finally, we would like to extend our thanks for financial support to the Swan River Trust, Australian Acoustical Society and Holsworth Wildlife Research Endowment – Equity Trustees Charitable Foundation & the Ecological Society of Australia.
References
ABS (2016). Regional Population Growth, Australia: Population Estimates by Significant Urban Area, 2005 to 2015. Australian Bureau of Statistics.
Adolf, J. E., Bachvaroff, T. R., Deeds, J. R., and Place, A. R. (2015). Ichthyotoxic Karlodinium veneficum (Ballantine) J Larsen in the upper swan river estuary (Western Australia): ecological conditions leading to a fish kill. Harmful Algae 48, 83–93. doi: 10.1016/j.hal.2015.07.006
Azzellino, A., Gaspari, S. A., Airoldi, S., and Lanfredi, C. (2008). Biological consequences of global warming: does sea surface temperature affect cetacean distribution in the western Ligurian Sea? J. Mar. Biol. Assoc. 88, 1145–1152. doi: 10.1017/s0025315408000751
Bailey, H., Corkrey, R., Cheney, B., and Thompson, P. M. (2013). Analyzing temporally correlated dolphin sightings data using generalized estimating equations. Mar. Mammal Sci. 29, 123–141. doi: 10.1111/j.1748-7692.2011.00552.x
Bailey, H., Mate, B. R., Palacios, D. M., Irvine, L., Bograd, S. J., and Costa, D. P. (2009). Behavioural estimation of blue whale movements in the Northeast Pacific from state-space model analysis of satellite tracks. Endanger. Species Res. 10, 93–106. doi: 10.3354/esr00239
Bailey, H., Senior, B., Simmons, D., Rusin, J., Picken, G., and Thompson, P. M. (2010). Assessing underwater noise levels during pile-driving at an offshore windfarm and its potential effects on marine mammals. Mar. Pollut. Bull. 60, 888–897. doi: 10.1016/j.marpolbul.2010.01.003
Beidatsch, K. (2012). Machine Learning for Species Distribution Modelling: Evaluation of a Novel Method. Honours Thesis, Curtin University.
Bejder, L., Samuels, A., Whitehead, H., Gales, N., Mann, J., Connor, R., et al. (2006). Decline in relative abundance of bottlenose dolphins exposed to long-term disturbance. Conserv. Biol. 20, 1791–1798. doi: 10.1111/j.1523-1739.2006.00540.x
Boyd, I. L., Frisk, G., Urban, E., Tyack, P., Ausubel, J., Seeyave, S., et al. (2011). An international quiet ocean experiment. Oceanography 24, 174–181. doi: 10.5670/oceanog.2011.37
Branstetter, B. K., Trickey, J. S., Aihara, H., Finneran, J. J., and Liberman, T. R. (2013). Time and frequency metrics related to auditory masking of a 10 kHz tone in bottlenose dolphins (Tursiops truncatus). J. Acoust. Soc. Am. 134, 4556. doi: 10.1121/1.4824680
Buckstaff, K. (2004). Effects of watercraft noise on the acoustic behavior of bottlenose dolphins, tursiops truncatus, in sarasota bay, Florida. Mar. Mammal Sci. 20, 709–725. doi: 10.1111/j.1748-7692.2004.tb01189.x
Cañadas, A., Sagarminaga, R., and García-Tiscar, S. (2002). Cetacean distribution related with depth and slope in the Mediterranean waters off southern Spain. Deep. Res. Part I Oceanogr. Res. Pap. 49, 2053–2073. doi: 10.1016/S0967-0637(02)00123-1
Chabanne, D., Finn, H., Salgado-Kent, C., and Bedjer, L. (2012). Identification of a resident community of bottlenose dolphins (Tursiops aduncus) in the Swan Canning Riverpark, Western Australia, using behavioural information. Pacific Conserv. Biol. 18, 247–262. doi: 10.1071/PC120247
De Boer, M. N., Simmonds, M. P., Reijnders, P. J. H., and Aarts, G. (2014). The influence of topographic and dynamic cyclic variables on the distribution of small cetaceans in a shallow coastal system. PLoS ONE 9:e86331. doi: 10.1371/journal.pone.0086331
DeMaster, D. P., Fowler, C. W., Perry, S. L., and Richlen, M. F. (2001). Predation and competition: the impact of fisheries on marine mammal populations over the next one hundred years. J. Mammal. 82, 641–651. doi: 10.1644/1545-1542(2001)082<0641:PACTIO>2.0.CO;2
Ding, W., Wursig, B., and Evans, W. (1995). Whistles of bottlenose dolphins: comparisons among populations. Aquat. Mamm. 21, 65–77.
Ekstrom, C. (2014). MESS: Miscellaneous Esoteric Statistical Scripts. R Package Version 0.3–2. R Software package.
Eliot, M. (2012). Sea level variability influencing coastal flooding in the Swan River region, Western Australia. Cont. Shelf Res. 33, 14–28. doi: 10.1016/j.csr.2011.08.012
Ellison, W. T., Southall, B. L., Clark, C. W., and Frankel, A. S. (2012). A new context-based approach to assess marine mammal behavioral responses to anthropogenic sounds. Conserv. Biol. 26, 21–28. doi: 10.1111/j.1523-1739.2011.01803.x
Elwen, S. H., and Best, P. B. (2004). Environmental factors influencing the distribution of southern right whales (Eubalaena australis) on the south coast of South Africa I: broad scale patterns. Mar. Mammal Sci. 20, 567–582. doi: 10.1111/j.1748-7692.2004.tb01180.x
Elwen, S., Meýer, M. A., Best, P. B., Kotze, P. G. H., Thornton, M., and Swanson, S. (2006). Range and movements of female heaviside's dolphins (Cephalorhynchus heavisidii), as determined by satellite-linked telemetry. J. Mammal. 87, 866–877. doi: 10.1644/05-MAMM-A-307R2.1
Erbe, C. (2008). Critical ratios of beluga whales (Delphinapterus leucas) and masked signal duration. J. Acoust. Soc. Am. 124, 2216–2223. doi: 10.1121/1.2970094
Erbe, C. (2010). The marine soundscape and the effects of noise on aquatic mammals. Can. Acoust. 38, 20–21.
Erbe, C. (2012). “The effects of underwater noise on marine mammals,” in The Effects of Noise on Aquatic Life, eds A. Popper and A. D. Hawkins (New York, NY: Springer), 17–22. doi: 10.1007/978-1-4419-7311-53
Erbe, C. (2013). Underwater noise of small personal watercraft (jet skis). J. Acoust. Soc. Am. 133, EL326–EL330. doi: 10.1121/1.4795220
Erbe, C., Liong, S., Koessler, M. W., Duncan, A. J., and Gourlay, T. (2016a). Underwater sound of rigid-hulled inflatable boats. J. Acoust. Soc. Am. Express Lett. 139, 223–227. doi: 10.1121/1.4954411
Erbe, C., Reichmuth, C., Cunningham, K., Lucke, K., and Dooling, R. (2016b). Communication masking in marine mammals: a review and research strategy. Mar. Pollut. Bull. 103, 15–38. doi: 10.1016/j.marpolbul.2015.12.007
Erbe, C., Verma, A., McCauley, R., Gavrilov, A., and Parnum, I. (2015). The marine soundscape of the Perth Canyon. Prog. Oceanogr. 137, 38–51. doi: 10.1016/j.pocean.2015.05.015
Erbe, C., Williams, R., Sandilands, D., and Ashe, E. (2014). Identifying modeled ship noise hotspots for marine mammals of Canada's pacific region. PLoS ONE 9:e89820. doi: 10.1371/journal.pone.0089820
Farmer, B. M., French, D. J. W., Potter, I. C., Hesp, S. A., and Hall, N. G. (2005). Determination of Biological Parameters for Managing the Fisheries for Mulloway and Silver Trevally in Western Australia. Fisheries Research and Development Corporation Report FRDC Project 2002/004.
Finneran, J. J. (2015). Noise-induced hearing loss in marine mammals: a review of temporary threshold shift studies from 1996 to 2015. J. Acoust. Soc. Am. 138, 1702–1726. doi: 10.1121/1.4927418
Forney, K. A. (2000). Environmental models of cetacean abundance : reducing uncertainty in population trends. Conserv. Biol. 14, 1271–1286. doi: 10.1046/j.1523-1739.2000.99412.x
Gavrilov, A. N., and Parsons, M. J. G. (2014). A matlab tool for the characterisation of recorded underwater sound (CHORUS). Acoust. Aust. 42, 190–196.
Gosbell, K., and Clemens, R. S. (2006). Population monitoring in Australia: some insights after 25 years and future directions. Stilt 50, 162–175.
Griffin, R. B., and Griffin, N. J. (2003). Distribution, habitat partitioning, and abundance of Atlantic spotted dolphins, bottlenose dolphins, and loggerhead sea turtles on the eastern Gulf of Mexico continental shelf. Gulf Mex. Sci. 21, 23–34.
Guan, S., Lin, T.-H., Chou, L.-S., Vignola, J., Judge, J., and Turo, D. (2015). Dynamics of soundscape in a shallow water marine environment: a study of the habitat of the Indo-Pacific humpback dolphin. J. Acoust. Soc. Am. 137, 2939–2949. doi: 10.1121/1.4919312
Guerra, M., Dawson, S. M., Brough, T. E., and Rayment, W. J. (2014). Effects of boats on the surface and acoustic behaviour of an endangered population of bottlenose dolphins. Endanger. Species Res. 24, 221–236. doi: 10.3354/esr00598
Hastie, G. D., Wilson, B., Tufft, L. H., and Thompson, P. M. (2003). Bottlenose dolphins increase breathing synchrony in response to boat traffic. Mar. Mammal Sci. 19, 74–84. doi: 10.1111/j.1748-7692.2003.tb01093.x
Hatch, L. T., and Fristrup, K. M. (2009). No barrier at the boundaries: implementing regional frameworks for noise management in protected natural areas. Mar. Ecol. Prog. Ser. 395, 223–244. doi: 10.3354/meps07945
Hawkins, E. R. (2010). Geographic variations in the whistles of bottlenose dolphins (Tursiops aduncus) along the east and west coasts of Australia. J. Acoust. Soc. Am. 128, 924–935. doi: 10.1121/1.3459837
Heiler, J., Elwen, S. H., Kriesell, H. J., and Gridley, T. (2016). Changes in bottlenose dolphin whistle parameters related to vessel presence, surface behaviour and group composition. Anim. Behav. 117, 167–177. doi: 10.1016/j.anbehav.2016.04.014
Højsgaard, S., Halekoh, U., and Yan, J. (2006). The R Package geepack for generalized estimating equations. J. Stat. Softw. 15, 1–11. doi: 10.18637/jss.v015.i02
Holyoake, C., Finn, H., Stephens, N., Duignan, P., Salgado, C., Smith, H., et al. (2010). Technical Report on the Bottlenose Dolphin (Tursiops aduncus) Unusual Mortality Event within the Swan Canning Riverpark. Report to the Australian Government.
Hourston, M., McDonald, J. I., and Hewitt, M. J. (2015). Public engagement for the detection of the introduced marine species Charybdis japonica in Western Australia. Manag. Biol. Invasions 6, 243–252. doi: 10.3391/mbi.2015.6.3.03
Jensen, F. H., Beedholm, K., Wahlberg, M., Bejder, L., and Madsen, P. T. (2012). Estimated communication range and energetic cost of bottlenose dolphin whistles in a tropical habitat. J. Acoust. Soc. Am. 131, 582–592. doi: 10.1121/1.3662067
Kennedy, E. V., Holderied, M. W., Mair, J. M., Guzman, H. M., and Simpson, S. D. (2010). Spatial patterns in reef-generated noise relate to habitats and communities: evidence from a Panamanian case study. J. Exp. Mar. Bio. Ecol. 395, 85–92. doi: 10.1016/j.jembe.2010.08.017
Lusseau, D. (2006). The short-term behavioral reactions of bottlenose dolphins to interactions with boats in doubtful sound, New Zealand. Mar. Mammal Sci. 22, 802–818. doi: 10.1111/j.1748-7692.2006.00052.x
Mannocci, L., Catalogna, M., Dorémus, G., Laran, S., Lehodey, P., Massart, W., et al. (2014). Predicting cetacean and seabird habitats across a productivity gradient in the South Pacific gyre. Prog. Oceanogr. 120, 383–398. doi: 10.1016/j.pocean.2013.11.005
Marley, S. A., Erbe, C., and Salgado-Kent, C. P. (2016a). Underwater sound in an urban estuarine river: sound sources, soundscape contribution, and temporal variability. Acoust. Aust. 44, 171–186. doi: 10.1007/s40857-015-0038-z
Marley, S. A., Salgado Kent, C. P., and Erbe, C. (2016b). Occupancy of bottlenose dolphins (Tursiops aduncus) in relation to vessel traffic, dredging and environmental variables within a highly-urbanised estuary. Hydrobiologia 792, 243–263. doi: 10.1007/s10750-016-3061-7
May-Collado, L. J., and Quiñones-Lebrón, S. G. (2014). Dolphin changes in whistle structure with watercraft activity depends on their behavioral state. J. Acoust. Soc. Am. 135, EL193–EL198. doi: 10.1121/1.4869255
May-Collado, L. J., and Wartzok, D. (2008). A comparison of bottlenose dolphin whistles in the Atlantic ocean: factors promoting whistle variation. J. Mammal. 89, 1229–1240. doi: 10.1644/07-MAMM-A-310.1
McIntyre, A. D. (1999). Conservation in the sea – looking ahead. Aquat. Conserv. Mar. Freshw. Ecosyst. 9, 633–637. doi: 10.1002/(SICI)1099-0755(199911/12)9:6<633::AID-AQC367>3.0.CO;2-9
McWilliam, J. N., and Hawkins, A. D. (2013). A comparison of inshore marine soundscapes. J. Exp. Mar. Bio. Ecol. 446, 166–176. doi: 10.1016/j.jembe.2013.05.012
Moiler, K. (2008). Bottlenose Dolphins (Tursiops sp.) – a Study of Patterns in Spatial and Temporal Use of the Swan River. Honours Thesis, Curtin University.
Moore, P. G. (1999). Fisheries exploitation and marine habitat conservation: a strategy for rational coexistence. Aquat. Conserv. Mar. Freshw. Ecosyst. 9, 585–591. doi: 10.1002/(SICI)1099-0755(199911/12)9:6<585::AID-AQC366>3.0.CO;2-4
Morgan, D. L., Gill, H. S., Maddern, M. G., and Beatty, S. J. (2004). Distribution and impacts of introduced freshwater fishes in Western Australia. New Zeal. J. Mar. Freshw. Res. 38, 511–523. doi: 10.1080/00288330.2004.9517257
Morisaka, T., Shinohara, M., Nakahara, F., and Akamatsu, T. (2005). Effects of ambient noise on the whistles of indo-pacific bottlenose dolphin populations. J. Mammal. 86, 541–546. doi: 10.1644/1545-1542(2005)86[541:EOANOT]2.0.CO;2
New, L. F., Harwood, J., Thomas, L., Donovan, C., Clark, J. S., Hastie, G., et al. (2013). Modelling the biological significance of behavioural change in coastal bottlenose dolphins in response to disturbance. Funct. Ecol. 27, 314–322. doi: 10.1111/1365-2435.12052
Nowacek, D. P., Thorne, L. H., Johnston, D. W., and Tyack, P. L. (2007). Responses of cetaceans to anthropogenic noise. Mamm. Rev. 37, 81–115. doi: 10.1111/j.1365-2907.2007.00104.x
Nybakken, J. W., and Bertness, M. D. (2005). Marine Biology: An Ecological Approach. Pearson, GA: Benjamin Cummings.
Pan, W. (2001). Akaike's information criterion in generalized estimating equations. Biometrics 57, 120–125. doi: 10.1111/j.0006-341X.2001.00120.x
Parks, S. E., Urazghildiiev, I., and Clark, C. W. (2009). Variability in ambient noise levels and call parameters of North Atlantic right whales in three habitat areas. J. Acoust. Soc. Am. 125, 1230–1239. doi: 10.1121/1.3050282
Parsons, M. J. G., Erbe, C., McCauley, R. D., McWiliam, J., Marley, S. A., Parnum, I. M., et al. (2016). Long-term monitoring of soundscapes and deciphering a usable index: examples from Australia. Proc. Meet. Acoust. 27, 010023. doi: 10.1121/2.0000286
Parsons, M. J. G., McCauley, R. D., and Mackie, M. C. (2013). Characterisation of mulloway Argyrosomus japonicus advertisement sounds. Acoust. Aust. 41, 196–201.
Photopoulou, T., Best, P., Hammond, P., and Findlay, K. (2011). Movement patterns of coastal bottlenose dolphins in the presence of a fast-flowing, prevailing current: shore-based observations at Cape Vidal, South Africa. Afr. J. Mar. Sci. 33, 393–401. doi: 10.2989/1814232X.2011.637346
Pijanowski, B. C., Villanueva-Rivera, L. J., Dumyahn, S. L., Farina, A., Krause, B. L., Napoletano, B. M., et al. (2011). Soundscape ecology: the science of sound in the landscape. Bioscience 61, 203–216. doi: 10.1525/bio.2011.61.3.6
Pirotta, E., Laesser, B. E., Hardaker, A., Riddoch, N., Marcoux, M., and Lusseau, D. (2013). Dredging displaces bottlenose dolphins from an urbanised foraging patch. Mar. Pollut. Bull. 74, 396–402. doi: 10.1016/j.marpolbul.2013.06.020
Pirotta, E., Merchant, N. D., Thompson, P. M., Barton, T. R., and Lusseau, D. (2015). Quantifying the effect of boat disturbance on bottlenose dolphin foraging activity. Biol. Conserv. 181, 82–89. doi: 10.1016/j.biocon.2014.11.003
Radford, C. A., Stanley, J. A., Tindle, C. T., Montgomery, J. C., and Jeffs, A. G. (2010). Localised coastal habitats have distinct underwater sound signatures. Mar. Ecol. Prog. Ser. 401, 21–29. doi: 10.3354/meps08451
Rate, A. W., Robertson, A. E., and Borg, A. T. (2000). Distribution of heavy metals in near-shore sediments of the Swan River estuary, Western Australia. Water Air Soil Pollut. 124, 155–168. doi: 10.1023/A:1005289203825
R Core Team (2015). R: A Language and Environment for Statistical Computing. Available online at: http://www.r-project.org/
Rice, A. N., Tielens, J. T., Estabrook, B. J., Muirhead, C. A., Rahaman, A., Guerra, M., et al. (2014). Variation of ocean acoustic environments along the western North Atlantic coast: a case study in context of the right whale migration route. Ecol. Inform. 21, 89–99. doi: 10.1016/j.ecoinf.2014.01.005
Richardson, W. J., Greene, C. R., Malme, C. I., and Thomson, D. H. (1995). Marine Mammals and Noise. San Diego, CA: Academic Press.
Robson, B. J., Bukaveckas, P. A., and Hamilton, D. P. (2008). Modelling and mass balance assessments of nutrient retention in a seasonally-flowing estuary (Swan River Estuary, Western Australia). Estuar. Coast. Shelf Sci. 76, 282–292. doi: 10.1016/j.ecss.2007.07.009
Robson, B. J., and Hamilton, D. P. (2003). Summer flow event induces a cyanobacterial bloom in a seasonal Western Australian estuary. Mar. Freshw. Res. 54, 139–151. doi: 10.1071/MF02090
Ross, G. J. B. (2006). Review of the Conservation Status of Australia's Smaller Whales and Dolphins. Report to the Australian Government.
Salgado Kent, C., McCauley, R. D., Parnum, I. M., and Gavrilov, A. N. (2012). “Underwater noise sources in Fremantle Inner Harbor: dolphins, pile driving and traffic,” in Proceedings of the Acoustical Society of Australia (Fremantle, WA), 21–23.
Scott-Hayward, L. A., Oedekoven, C. S., MacKenzie, M. L., Rexstad, E., and Walker, C. (2014). MRSea Package (version 0.0.1): Statistical Modelling of Bird and Cetacean Distributions in Offshore Renewables Development Areas. St Andrews: University of St Andrews Contract with Mar. Scotl. SB9.
Smale, D. A., and Childs, S. (2012). The occurrence of a widespread marine invader, Didemnum perlucidum (Tunicata, Ascidiacea) in Western Australia. Biol. Invasions 14, 1325–1330. doi: 10.1007/s10530-011-0167-8
Southall, B. L., Bowles, A. E., Ellison, W. T., Finneran, J. J., Gentry, R. L., Greene Jr. C. R., et al. (2007). Marine mammal noise exposure criteria: initial scientific recommendation. Aquat. Mamm. 33, 411–521. doi: 10.1578/A.M.33.4.2007.411
Steckenreuter, A., Möller, L., and Harcourt, R. (2012). How does Australia's largest dolphin-watching industry affect the behaviour of a small and resident population of Indo-Pacific bottlenose dolphins? J. Environ. Manage. 97, 14–21. doi: 10.1016/j.jenvman.2011.11.002
Thompson, P. M., Wilson, B., Grellier, K., and Hammond, P. S. (2000). Combining power analysis and population viability analysis to compare traditional and precautionary approaches to conservation of coastal cetaceans. Conserv. Biol. 14, 1253–1263. doi: 10.1046/j.1523-1739.2000.00099-410.x
Tyack, P. L. (2008). Large-scale changes in the marine acoustic environment. J. Mammal. 89, 549–558. doi: 10.1644/07-MAMM-S-307R.1
Tyack, P. L., and Miller, E. H. (2002). “Vocal anatomy, acoustic communication and echolocation,” in Marine Mammal Biology: An Evolutionary Approach, ed A. R. Hoelzel (Oxford, UK: Blackwell Science Ltd.), 142–184.
Ward, R., Parnum, I., Erbe, C., and Salgado-Kent, C. (2016). Whistle Characteristics of Indo-pacific bottlenose dolphins (Tursiops aduncus) in the Fremantle inner harbor, Western Australia. Acoust. Aust. 44, 159–169. doi: 10.1007/s40857-015-0041-4
Weilgart, L. S. (2007). The impacts of anthropogenic ocean noise on cetaceans and implications for management. Can. J. Zool. 85, 1091–1116. doi: 10.1139/Z07-101
Williams, R., Clark, C. W., Ponirakis, D., and Ashe, E. (2014). Acoustic quality of critical habitats for three threatened whale populations. Anim. Conserv. 17, 174–185. doi: 10.1111/acv.12076
Williams, R., Erbe, C., Ashe, E., and Clark, C. W. (2015a). Quiet(er) marine protected areas. Mar. Pollut. Bull. 100, 154–161. doi: 10.1016/j.marpolbul.2015.09.012
Williams, R., Wright, A. J., Ashe, E., Blight, L. K., Bruintjes, R., Canessa, R., et al. (2015b). Impacts of anthropogenic noise on marine life: publication patterns, new discoveries, and future directions in research and management. Ocean Coast. Manag. 115, 17–24. doi: 10.1016/j.ocecoaman.2015.05.021
Wilson, B., Hammond, P. S., and Thompson, P. M. (1999). Estimating size and assessing trends in a coatal bottlenose dolphin population. Ecol. Appl. 9, 288–300. doi: 10.1890/1051-0761(1999)009[0288:ESAATI]2.0.CO;2
Wright, A. J., Deak, T., and Parsons, E. C. M. (2011). Size matters: management of stress responses and chronic stress in beaked whales and other marine mammals may require larger exclusion zones. Mar. Pollut. Bull. 63, 5–9. doi: 10.1016/j.marpolbul.2009.11.024
Yan, J., and Fine, J. P. (2004). Estimating equations for association structures. Stat. Med. 23, 859–880. doi: 10.1002/sim.1650
Keywords: underwater soundscape, spatio-temporal variation, anthropogenic noise, Indo-Pacific bottlenose dolphins
Citation: Marley SA, Erbe C, Salgado Kent CP, Parsons MJG and Parnum IM (2017) Spatial and Temporal Variation in the Acoustic Habitat of Bottlenose Dolphins (Tursiops aduncus) within a Highly Urbanized Estuary. Front. Mar. Sci. 4:197. doi: 10.3389/fmars.2017.00197
Received: 30 January 2017; Accepted: 09 June 2017;
Published: 23 June 2017.
Edited by:
Davide Borelli, Università di Genova, ItalyReviewed by:
Gianni Pavan, University of Pavia, ItalyNikolaos Kourogenis, University of Piraeus, Greece
Copyright © 2017 Marley, Erbe, Salgado Kent, Parsons and Parnum. This is an open-access article distributed under the terms of the Creative Commons Attribution License (CC BY). The use, distribution or reproduction in other forums is permitted, provided the original author(s) or licensor are credited and that the original publication in this journal is cited, in accordance with accepted academic practice. No use, distribution or reproduction is permitted which does not comply with these terms.
*Correspondence: Sarah A. Marley, c2FyYWgubWFybGV5ODZAZ21haWwuY29t