 Gabriel Navarro
 Pablo Almaraz
 Isabel Caballero1
- 1Department of Ecology and Coastal Management, Institute of Marine Sciences of Andalusia (CSIC), Puerto Real, Spain
- 2Department of Applied Physics, Higher Engineering School, University of Cadiz, Puerto Real, Spain
During the last two decades, several satellite algorithms have been proposed to retrieve information about phytoplankton groups using ocean color data. One of these algorithms, the so-called PHYSAT-Med, was developed specifically for the Mediterranean Sea due to the optical peculiarities of this basin. The method allows the detection from ocean color images of the dominant Mediterranean phytoplankton groups, namely nanoeukaryotes, Prochlorococcus, Synechococcus, diatoms, coccolithophorids, and Phaeocystis-like phytoplankton. Here, we present a new version of PHYSAT-Med applied to the Ocean Colour—Climate Change Initiative (OC-CCI) database. The OC-CCI database consists of a multi-sensor, global ocean-color product that merges observations from four different sensors. This retuned version presents improvements with respect to the previous version, as it increases the temporal range (since 1998), decreases the cloud cover, improves the bias correction and a validation exercise was performed in the NW Mediterranean Sea. In particular, the PHYSAT-Med version has been used here to analyse the annual cycles of the major phytoplankton groups in the Mediterranean Sea. Wavelet analyses were used to explore the spatial variability in dominance both in the time and frequency domains in several Mediterranean sub-regions, such as the Alboran Sea, Ligurian Sea, Northern Adriatic Sea, and Levantine basin. Results extended the interpretation of previously detected patterns, indicating the dominance of Synechococcus-like vs. prochlorophytes throughout the year at the basin level, and the predominance of nanoeukaryotes during the winter months. The method successfully reproduced the diatom blooms normally detected in the basin during the spring season (March to April), especially in the Adriatic Sea. According to our results, the PHYSAT-Med OC-CCI algorithm represents a useful tool for the spatio-temporal monitoring of dominant phytoplankton groups in Mediterranean surface waters. The successful applications of other regional ocean color algorithms to the OC-CCI database will give rise to extended time series of phytoplankton functional types, with promising applications to the study of long-term oceanographic trends in a global change context.
Introduction
Since the launch of the Coastal Zone Color Scanner (CZCS) in the late 1970s, ocean color remote sensing has deeply improved our understanding of the ocean system by providing global estimations of the surface chlorophyll concentration (Chla), a parameter known to be a good proxy of phytoplankton biomass (e.g., McClain, 2009). Marine phytoplankton are located at the base of the marine food web (Chassot et al., 2010; and references therein), play a major role in the global biogeochemical cycles (Field et al., 1998) and participate actively in the regulation of the global climate (Sabine et al., 2004). During the last 40 years, observations of regional-to-global Chla data have been acquired by different ocean color sensors (IOCCG, 2012), such as Sea-viewing Wide Field-of-view Sensor (SeaWiFS), Moderate Resolution Imaging Spectroradiometer (MODIS), Medium-Resolution Imaging Spectrometer (MERIS) and Visible Infrared Imager Radiometer Suite (VIIRS). In order to extend the existing time series beyond that provided by a single satellite sensor, the European Space Agency (ESA) has recently generated the Ocean Colour—Climate Change Initiative (OC-CCI), a multi-sensor, global, ocean-color product mainly devoted to climate research (Storm et al., 2013) that merges observations from four different sensors: SeaWiFS, MODIS, MERIS, and VIIRS. As an ESA-funded CCI project, the OC-CCI focuses specifically in creating a consistent, error-characterized time-series of ocean-color products, with a strong focus in climate-change studies (Brewin et al., 2015). Remote-sensing reflectance (Rrs) data from MODIS-Aqua and MERIS are then band-shifted to match the wavelengths of SeaWiFS by using an in-water bio-optical model (e.g., see Mélin and Sclep, 2015). The main reason behind this choice is that SeaWiFS is widely considered as the highest quality sensor with the best match to in situ observations, and is commonly used in peer literature (Couto et al., 2016). This dataset improves the bias correction, thus reducing the sensitivity to medium-term changes and extending the method applicability beyond the lifetime of SeaWiFS. As a result, the current OC-CCI database allows for the examination of the spatial and temporal variability of surface Chla since September 1997 (Couto et al., 2016).
Even though remote sensing derived phytoplankton types does not provide a full description of the marine ecosystem, its spatio-temporal distribution (including phenology, Kostadinov et al., 2017), and identification of key groups give powerful insights on the dynamics of the marine food web and the ocean's role in climate regulation in the context of the global change (Bracher et al., 2017). This relevance was early recognized by Platt et al. (2006), who concluded that detection of phytoplankton from remote sensing images was a major challenge in ocean optics. Therefore, over the last decade, several remote sensing algorithms have been developed to characterize the global distribution patterns of phytoplankton functional types (PFT) or size classes (PSC; e.g., Sathyendranath et al., 2004; Alvain et al., 2005, 2008; Ciotti and Bricaud, 2006; Raitsos et al., 2008; Aiken et al., 2009; Bracher et al., 2009; Brewin et al., 2010; Kostadinov et al., 2010; Hirata et al., 2011; Uitz et al., 2012; see recent summary in Table 2 in (Bracher et al., 2017 and Table 3 in Mouw et al., 2017). A complete guide of the available approaches can be found in Mouw et al. (2017). Some of these algorithms are based on various spectral features, such as backscattering (e.g., Kostadinov et al., 2010), absorption (e.g., Ciotti and Bricaud, 2006; Bracher et al., 2009; Mouw and Yoder, 2010; Roy et al., 2013) or a hybrid between absorption and backscattering (Fujiwara et al., 2011). Other algorithms exploit second-order anomalies of reflectance spectra (Alvain et al., 2005, 2008), which is the case of the so-called PHYSAT that was first developed at a global scale by Alvain et al. (2005, 2008). The PHYSAT approach relies on the identification of specific signatures in the normalized water leaving radiance (nLw) spectra measured by an ocean color sensor (Alvain et al., 2005, 2008), thereby enabling the identification of nanoeukaryotes, haptophytes (a major component of the nanoflagellates), Synechococcus-like cyanobacteria, diatoms, Prochlorococcus, Phaeocystis-like phytoplankton, and coccolithophorids. The PHYSAT method has been successfully validated with phytoplankton in situ data and extensively used by many authors (e.g., Bopp et al., 2005; Arnold et al., 2010; D'Ovidio et al., 2010; Gorgues et al., 2010; Masotti et al., 2010, 2011; Alvain et al., 2012, 2013; Belviso et al., 2012; Demarcq et al., 2012; De Monte et al., 2013; Hashioka et al., 2013; Ben Mustapha et al., 2014; Thyssen et al., 2015).
Navarro et al. (2014) later proposed a regionalized version of the algorithm for the Mediterranean Sea (Figure 1), the PHYSAT-Med, using the MODIS era (2002–2013) for identification of nanoeukaryotes, Prochlorococcus, Synechococcus-like cyanobacteria and diatoms, which was compared with more than 3,000 high-performance liquid chromatography (HPLC) in situ measurements (see Table 3 in Navarro et al., 2014). The main utility of the PHYSAT-Med is that it allows for the tracking of specific features of phytoplankton community structure occurring in the basin, along with their associated bio-optical relationships that are heavily affected by continental inputs, such as desert dust events and rivers discharge (Bricaud et al., 2002; Claustre et al., 2002; Alvain et al., 2006; Loisel et al., 2011). Volpe et al. (2007) early suggested that the unique phytoplankton assemblages of the basin could alter its spectral signature, therefore being responsible for the peculiar color of the Mediterranean. Due to these characteristics, standard remote sensing approaches tend to either overestimate or underestimate Chla levels in the Mediterranean. In fact, Volpe et al. (2007) also showed that NASA SeaWiFS standard chlorophyll products are affected by an uncertainty in the order of 100%. Specific algorithms have been thus developed to retrieve Chla in the region, namely DORMA-SeaWiFS (D'Ortenzio et al., 2002), BRIC-SeaWiFS (Bricaud et al., 2002), MedOC4-SeaWiFS (Volpe et al., 2007), MedOC3-MODIS (Santoleri et al., 2008), and MedOC4ME-MERIS (Santoleri et al., 2008).
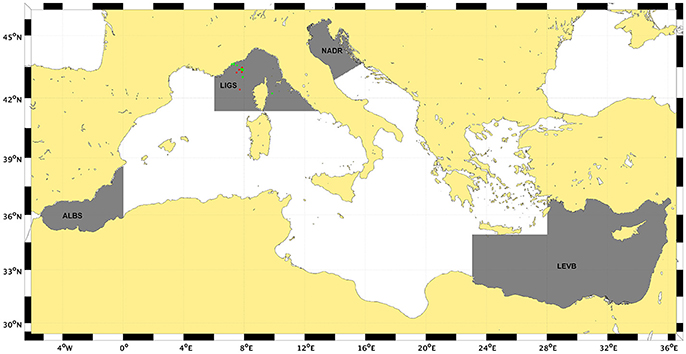
Figure 1. Map of the Mediterranean Sea. Gray areas show the sub-regions selected in this study for a regional assessment: Alboran Sea (ALBS), Ligurian Sea (LIGS), Northern Adriatic Sea (NADS), and Levantine basin (LEVB).
Furthermore, these bio-optical characteristics of the basin described above clearly indicate the necessity to use customized algorithms to detect PFT or PSC in Mediterranean Sea. Recently, Sammartino et al. (2015) described the temporal variability of PSC in Mediterranean Sea using the model proposed by Brewin et al. (2011). Di Cicco et al. (2017) presented a new regional algorithm to identify simultaneously the contribution of each PSC and PFT group to the satellite estimates of total Chla concentration in the basin.
The Mediterranean (Figure 1) is the largest inland ocean basin on Earth, only connected to the rest of the world's oceans by the Strait of Gibraltar. It exhibits an oligotrophic regime (Krom et al., 1991), notwithstanding relatively external high inputs of essential nutrients (Ludwig et al., 2009; Huertas et al., 2012; Powley et al., 2016). Nevertheless, local physical structures generate convergences zones, which are reflected in the distinct biogeochemical properties of the two Mediterranean sub-regions, the Western and the Levantine. Thus, a notable decreasing gradient in Chla concentration is detected from the west to the east, which causes a significant longitudinal variation in primary production (Turley et al., 2000; Uitz et al., 2012). This gradient in oligotrophy is evidenced both by in situ measurements (Tanhua et al., 2013) and satellite data (D'Ortenzio and Ribera d'Alcalá, 2009). However, the seasonal evolution of Chla distribution still follows the typical succession of temperate regions, characterized by a phytoplankton biomass increase in late winter/early spring, a decrease during the summer season and a second smaller phytoplankton bloom in autumn (Siokou-Frangou et al., 2010; Sammartino et al., 2015).
Phytoplankton community structure in oligotrophic areas throughout the world's ocean is mainly composed by picoplankton and ultraplankton (Li et al., 1983; Brunet et al., 2006; Dandonneau et al., 2006). Nevertheless, the Mediterranean phytoplankton communities structures reveals a considerable variability over both temporal and spatial scales, and large dissimilarities in phytoplankton assemblage composition along with other microorganisms across the basin have been also highlighted (Siokou-Frangou et al., 2010). Many studies have pointed to the dominance of picoplankton as the fingerprint of the Mediterranean Sea and its overriding oligotrophy, but the occurrence of regional phytoplankton blooms cause the coexistence of numerous microalgal groups (Siokou-Frangou et al., 2010).
The satellite empirical model applied by Sammartino et al. (2015) encompassed this unusual and complex community structure in the Mediterranean Sea and allowed assessment of the spatio-temporal variability of the three phytoplankton size classes (micro-, nano-, and pico-plankton) during the entire SeaWiFS era (1998–2010). Previously, Navarro et al. (2014) had redefined the PHYSAT algorithm (Alvain et al., 2005, 2008) to the Mediterranean Sea's bio-optical characteristics to estimate the dominant functional phytoplankton types (Prochlorococcus, Synechococcus, diatoms, nanoeukaryotes, coccolithophorids, and Phaeocystis-like) from the MODIS sensor. More recently, Di Cicco et al. (2017) developed a new regional algorithm for satellite biomass estimates of PSC and PFT in Mediterranean Sea and assessed their accuracy with respect to global models, improving the uncertainty and the spread of about one order of magnitude for all phytoplankton classes.
Regarding the distribution of chlorophyll, low values (less 0.2 mg/m3) are found over vast areas of the basin, with the exception of large blooms observed in late winter and early spring in the North Western Mediterranean (Siokou-Frangou et al., 2010). Mesoscale activity also increases the chlorophyll concentration mainly in the Alboran Sea, Balearic-Catalan Sea, Adriatic Sea and the South Eastern Levantine Sea, by about one order of magnitude for all phytoplankton classes. In other coastal areas close to major rives, such us the Po in the North Adriatic Sea, the Rhone in Gulf of Lions and the Nile in the Levantine Sea, and river discharge generates a large increase in chlorophyll levels (Siokou-Frangou et al., 2010). In the eastern basin, the Chla rarely exceeds 0.5 mg/m3, with minima as low as 0.003 mg/m3 (Siokou-Frangou et al., 2010). Low biomass values are generally associated with the dominance of cyanobacteria, prochlorophytes and picoplankton-sized flagellates (Siokou-Frangou et al., 2010 and references therein), and represents 59% of the total Chla and 65% of the primary production. However, nanoflagellates are the dominant group in terms of cell numbers throughout most of the year in the Mediterranean Sea. Finally, observed increases in Chla correlate with decreases in the contribution of picoplankton and nanoplankton, and increases in diatom concentration during February and March (Siokou-Frangou et al., 2010).
Bracher et al. (2017) recently highlighted the limited applicability of global satellite algorithms to determine the composition of phytoplankton at a regional scale as one of the major gaps in satellite research. Accordingly, these authors suggest a roadmap for future developments in regionally adapted algorithms. The main goal of this paper is thus to bridge the gap diagnosed by Bracher et al. (2017) by updating and improving the original version of the PHYSAT-Med method (Navarro et al., 2014) with the new OC-CCI database. Firstly, the advantages of this new version are: (a) an increase in the temporal range (1997–2015; (b) a decrease of the cloud cover due to the use of several ocean color sensors; (c) an improvement in the bias correction, thus reducing sensitivity to medium-term changes; and (d) the validation of the temporal range in the NW Mediterranean Sea using diagnostic pigments analysis (DPA, Vidussi et al., 2001). Secondly, wavelet analysis is applied to the retuned version in order to analyse the contributions of different temporal cycles of dominance variability of the major phytoplankton groups in the Mediterranean Sea.
Materials and Methods
PHYSAT-Med OC-CCI Algorithm
The OC-CCI is a long-term, consistent and error-characterized dataset generated from merged normalized remote-sensing reflectance derived from four satellite sensors: SeaWiFS, MODIS, MERIS, and VIIRS (Storm et al., 2013; Jackson et al., in press). In this work, we have used OC-CCI v3.0, where more data have been included (VIIRS and SeaWiFS LAC). In addition, the bias correction has been improved, reducing sensitivity to medium-term changes and extending the method to work beyond the lifetime of SeaWiFS. Daily level 3 remote sensing reflectance data (Rrs) at 412, 443, 490, 510, 555, and 670 nm and diffuse attenuation coefficient (Kd490) were downloaded from the OC-CCI website covering the period from January 1998 to December 2015 (Figure 2, step 1). These products were displayed on a regular 4 km grid, with an equi-rectangular projection with constant longitude and latitude steps. Error specification (RMSE and bias) is based on comparison with match-up in situ data and extrapolation to global scale ocean.
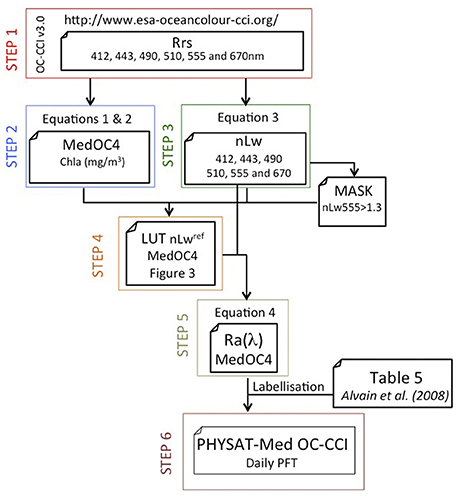
Figure 2. Schematic view of steps of the PHYSAT-Med OC-CCI algorithm.
In a second step (Figure 2, step 2), the Chla concentration in the Mediterranean Sea was calculated using a regional algorithm (MedOC4, Mediterranean ocean color four-bands, Volpe et al., 2007) developed for the basin for SeaWiFS bands (or CCI),
where
This bio-optical algorithm is based on a fourth-power polynomial regression between log-transformed Chla and log-transformed maximum band ratio (MBR). It is known that using multiple Rrs ratios decreases the noise-to-signal ratio, thereby enhancing the algorithm's performance (O'Reilly et al., 1998). The MedOC4 algorithm was calibrated on a representative open-water bio-optical dataset collected in the Mediterranean Sea, and is the best algorithm matching the requirement of unbiased satellite orophyll estimates (Volpe et al., 2007; Santoleri et al., 2008). At a global scale, the SeaWiFS algorithms have shown errors in the range of <5% for radiances and <35% for chlorophyll (Mueller and Austin, 1995; Gregg and Casey, 2004). The accuracy limit for chlorophyll using these standard algorithms has been shown to be unrealistic in Mediterranean Sea, yielding a severe overestimation (>70% for chlorophyll <0.2 mg/m3; Volpe et al., 2007, 2012).
At the third step (Figure 2), the Rrs was converted to nLw using the nominal band solar irradiance (Fo, in mW cm−2 μm−1) for any specific spectral band (λ) of the SeaWiFS sensor (Gregg et al., 1993; Thuillier et al., 2003).
During step 4 (Figure 2), a new Look-Up-Table (LUT, Figure 3 and Table 1 in Supplementary Material) of nLwref(λ, Chla) was empirically generated for the Mediterranean Sea from a large dataset of OC-CCI Chla and nLw pixels for all daily images contained within the study period (January 1998 to December 2015). Turbid pixels (defined as nLw555>1.3 mW cm−2 mm−1 sr−1, Nezlin and DiGiacomo, 2005) were excluded in order to minimize the impact of high-suspended matter loads. Briefly, nLwref is calculated from nLw data, and the associated Chla computed from the MedOC4 algorithm within the concentration range between 0.01 and 10 mg/m3 (41 narrow intervals). This figure is similar to the one used in the development of the PHYSAT-Med algorithm (Navarro et al., 2014).
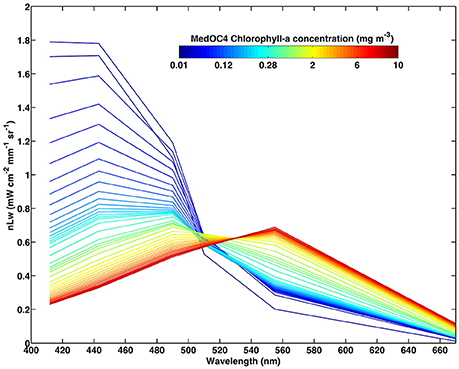
Figure 3. Look-Up-Table for PHYSAT-Med OC-CCI algorithm. Normalized water-leaving radiance nLw as a function of wavelength for various MedOC4-Chla concentration (color scale, in mg/m3) for the Mediterranean Sea (excluding Black Sea) during the study period (January 1998–December 2015).
Once the new LUT (Figure 3, Table 1 in Supplementary Material) for the Mediterranean Sea was calculated using the regional MedOC4-Chla algorithm, the radiance anomalies [Ra(λ), see Figure 3, step 5] were computed for all daily OC-CCI wavelengths analyzed using Equation (4) for all available wavelengths (412, 443, 490, 510, 555, and 670 nm). Ra(λ) is an adimensional parameter independent of the Chla level, and hence also independent of the biomass. Ra(λ) thus represents the second order variation in nLw(λ) after removal of the first order effect of the Chla variation (Alvain et al., 2005):
The analyses by Alvain et al. (2005) showed that for a given Chla concentration, the particle scattering variability explains the largest fraction of the remotely sensed Ra spectral variability, especially when focusing on Ra magnitude changes. The labellization step was performed using the thresholds of Ra for each of the six phytoplankton groups examined in PHYSAT-v2008 (see Table 5 in Alvain et al., 2008), which is specifically set up for SeaWiFS channels. These thresholds were used to process daily images to calculate daily PFTs map (Figure 3, step 6). For a spectrum to be associated with one group, all criteria must be fulfilled. Thresholds (Table 5 in Alvain et al., 2008) were fixed in order to avoid any overlapping. Pixels with nLw values that were not classified for any phytoplankton groups were cataloged as “unidentified (unid.),” and this can sum up a significant fraction (Navarro et al., 2014). PHYSAT-Med retrieves the dominant group for a given satellite image pixel (4 km) for Mediterranean Sea, where a given phytoplankton group is the major contributor to the radiance anomaly. From this database (near to 6,600 daily images), 10-day and monthly maps of dominant phytoplankton groups were obtained by calculating the phytoplankton group that was present more days during the integration period (10-day or monthly, respectively) at each geographical pixel, not including “unidentified” pixels. To estimate the proportion of each phytoplankton group in the entire basin and several Mediterranean sub-regions (Alboran Sea, Ligurian Sea, Northern Adriatic Sea, and Levantine basin in Figure 1, Bricaud et al., 2002), the number of the pixels of each PFT during 10-day or 1 month was calculated for each area in proportion to all the identified pixels, excluding the unidentified pixels. The box plot figures were created using Matlab® software (boxplot.m function), where the central mark corresponds to the median, the edges of the box are the 25th and 75th percentiles, the whiskers extend to the most extreme data points not considered outliers, and outliers are plotted individually. These statistics were calculated for each climatological month by considering all the values obtained during a particular month for the whole data series (from 1998 to 2015).
In situ Validation
In order to validate the PHYSAT-Med output, we have compared the temporal variability of PFT obtained from remote sensing algorithm with diagnostic pigments analysis (DPA, Vidussi et al., 2001) obtained from HPLC in North-Western Mediterranean Sea. A total of 5,400 samples were collected from the basin and analyzed by HPLC (Figure 1). This dataset consisted of samples from the DYFAMED (Dynamics of Atmospheric Fluxes in the Mediterranean Sea) time series included in the MAREDAT global database of HPLC (Peloquin et al., 2013) and the BOUSSOLE (Buoy for the acquisition of a Long-Term Optical Time Series) program (i.e., Antoine et al., 2006). Details of HPLC methods used can be found in the aforementioned references. Here, we only considered samples limited to the first optical depth (Z90), which reduces the number of available pigment inventories to 1,615 samples and comprising the temporal range analyzed (1998–2015). The first optical depth was calculated using daily Kd490 images from OC-CCI data [Z90 = 1/Kd490], which is about 15–35 m on average in the Mediterranean Sea (D'Ortenzio and Ribera d'Alcalá, 2009). The OC-CCI Kd490 product is computed from the inherent optical properties (IOPs) at 490 nm (Lee et al., 2005; Grant et al., 2016).
This comparison is based on many pigments specific to individual phytoplankton taxa or groups (i.e., Gieskes et al., 1988; Goericke and Repeta, 1993; Claustre and Marty, 1995; Jeffrey and Vesk, 1997). For instance, Divinyl Chlorophyll-a (dChla) is a typical marker of prochlorophytes (Goericke and Repeta, 1992; Claustre and Marty, 1995; Vidussi et al., 2001), whereas zeaxanthin (Zeax) is associated with cyanobacteria (Guillard et al., 1985). Fucoxanthin (Fuco) pigment is the principal marker of diatoms (Jeffrey, 1980). For nanoplankton cuantification, Vidussi et al. (2001) used three diagnostic pigments: alloxanthin (Allox), that is a pigment typical of the cryptomonads (Gieskes and Kraay, 1983); 19′-hexanoyloxyfucoxanthin (HexFuco), whose concentration is related to prymnesiophytes and chromophytes nanoflagellates (Wright and Jeffrey, 1987); and 19′-butanoyloxyfucoxanthin (ButFuco), a typical marker of chromophytes nanoflagellates (Wright and Jeffrey, 1987). Other pigments used in this method are total chlorophyll-b (TChlb, chlorophyll b + Divinyl-Chlorophyll b) and peridinin (Perid), which appears in small dinoflagellates (Jeffrey and Hallegraeff, 1987). This approach has been used at global scale (Uitz et al., 2006) and particularly in the Mediterranean Sea (i.e., Vidussi et al., 2001; Marty et al., 2002; Sammartino et al., 2015; Di Cicco et al., 2017; Mayot et al., 2017).
In this study, we have compared the in situ chlorophyll concentration of nanoplankton and diatoms using the method recently applied to the Mediterranean Sea by Di Cicco et al. (2017). Following the DPA procedure, originally proposed by Vidussi et al. (2001) and later refined by Uitz et al. (2006) to scale diagnostic pigments to Chla, it is possible to apply DPA-based approaches to satellite-derived Chla:
where
Alternatively, the method described by Alvain et al. (2005) was used to compare Prochlorococcus and Synechococcus time series, as this method uses the pigment ratio of divinyl-Chla and zeaxanthin, respectively, and has been applied previously for the Mediterranean Sea (Navarro et al., 2014):
where P is the measured pigment concentration (dChla or zeaxhantin), and Chla and dChla are the concentrations of chlorophyll-a and divinyl Chlorophyll-a, respectively.
As HPLC and PHYSAT-Med OC-CCI output data are measured in different units, we used Spearman's rank-order (non-parametric) correlations to assess the strength of the temporal association between both variables for each of the phytoplankton functional types. We used 10,000 bootstrap samples to construct 90% empirical confidence intervals for the correlations (Efron and Tibshirani, 1993). In order to check for possible time lags between the timing of seasonal blooms within the Ligurian Sea, as measured with both methods, we inspected the effect of different time lags in both variables on the strength of the association.
Wavelet Analysis
Wavelet analysis has emerged as a tool for characterizing periodicities in non-stationary time series, as it decomposes a time series both in the frequency and time domains (Percival and Walden, 2000). In this study, wavelet analysis has been used to characterize the different periodic components of the variability in dominance of the major phytoplankton groups in the Mediterranean Sea across time. Wavelet analysis performs a time-scale decomposition of the signal by estimating its frequency characteristics as a function of time (Torrence and Compo, 1998; Grinsted et al., 2004; Winder and Cloern, 2010). In order to normalize time series data and obtain the wavelet power spectrum of the different phytoplankton groups, the continuous Morlet wavelet transform was applied by using the Matlab® toolbox provided by Torrence and Compo (1998) and Grinsted et al. (2004) (http://atoc.Colorado.edu/research/wavelets/). The wavelet power spectrum identifies the periods that are the most important sources of variability across time. Additionally, it is possible to define a global wavelet spectrum, which identifies the variance associated to each period for a given time series, and is similar to Fourier spectra (Percival and Walden, 2000). Wavelet analysis was performed over the 10-day times series of nanoeukaryotes, Prochlorococcus, Synechococcus-like cyanobacteria and diatoms for the entire Mediterranean Sea and for four selected sub-regions (Alboran Sea, Liguarian Sea, Northern Adriatic Sea and Levantine sea).
Results and Discussion
Validation
Figure 4 shows the temporal variability of several diagnostic pigments and PFT in the Ligurian Sea, where DYFAMED and BOUSSOLE sampling stations are located. The comparison exercise covers all range of the PFT analyzed, except for zeaxanthin pigment for which there were no values during 1998. Prochlorococcus showed maximum values in autumn over several years, at the end of the stratification period (Figure 4A). The maxima found by the PHYSAT-Med OC-CCI algorithm were in close agreement with the maxima in the concentrations of the pigment ratio for dChla measured by HPLC method, which is indicative of prochlorophytes (Goericke and Repeta, 1992; Claustre and Marty, 1995; Vidussi et al., 2001). These results agree with the pattern reported by Vaulot et al. (1990) and Marty et al. (2002) estimated by flow cytometry and HPLC analysis, respectively. During summer, also coinciding with the stratification period, the dominant group is Synechococcus, and a maximum in zeaxanthin concentration is observed across the basin all years (Figure 4B). This pigment is associated with cyanobacteria (Guillard et al., 1985) and has been widely used to estimate Synechococcus concentration in the Ligurian Sea (Vidussi et al., 2001; Marty et al., 2002). However, during the spring bloom period, when the mixed layer depth is at its maximum (Marty et al., 2002), the diatom group and diatom Chla concentration also reached its highest value (Figure 4C). Finally, the nanoeukaryotes distribution presented maxima during winter, normally around January, coinciding with the maximum of nanoplankton chlorophyll concentration estimated using Equations 6 and 7 (Figure 4D; Di Cicco et al., 2017). Overall, the broad coincidence between PHYSAT-Med outputs and HPLC pigments in the temporal pattern suggests that the new version of PHYSAT-Med algorithm using OC-CCI v3.0 database is in agreement with the results obtained through long-term monitoring programs for phytoplankton distribution, at least in the Ligurian Sea area.
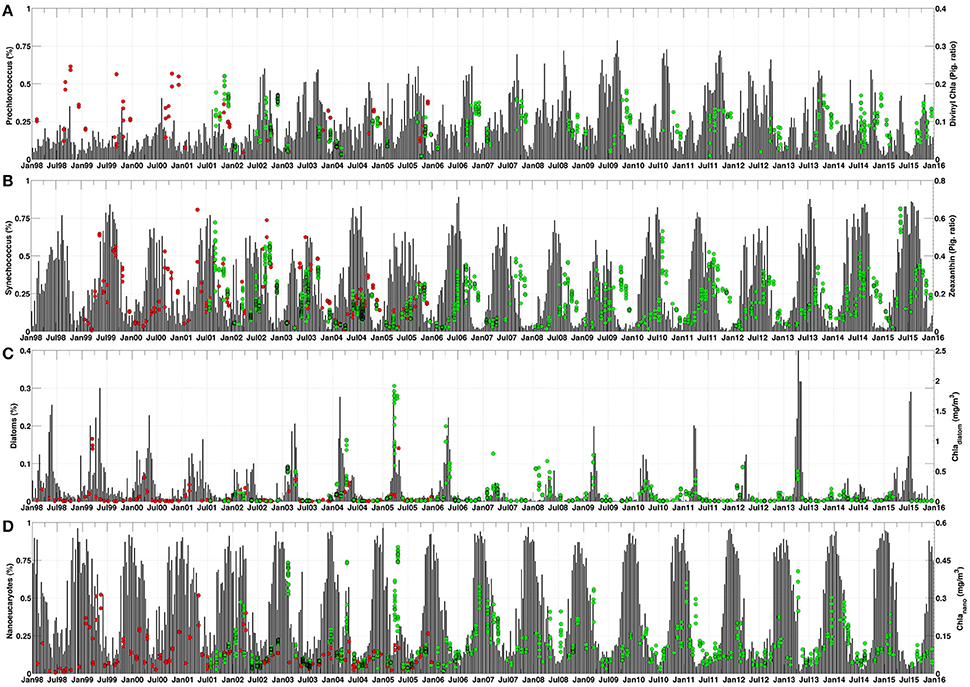
Figure 4. Temporal percentage (10-day) of each PFT (black bars, left axis) and diagnostic pigments (DYFAMED–red dots and BOUSSOLE–green dots, right axis) in the Ligurian Sea. (A) Prochlorococcus and Divinyl-Chla. (B) Synechococcus and zeaxanthin. (C) Diatoms and Chladiatom. (C) Nanoeucaryotes and Chlanano.
Even though the OC-CCI database provided per-pixel errors (RMSE and bias) for all OC-CCI products, this approach is not so common in retrieving phytoplankton functional types, except for the recent works published by Brewin et al. (2017) and Di Cicco et al. (2017) for the Mediterranean Sea. In fact, Di Cicco et al. (2017) showed the improvements obtained from the use of regional models with respect to the global models, with the reduction of bias being of about one order of magnitude. As we described above, the PHYSAT algorithm allows for the detection of dominant PFT. This approach is based on the analysis of the second order variation in nLw measurements after removal of the impact of Chla variation. Alvain et al. (2012) found acceptable results for diatoms (73%) and nanoeucaryotes (82%), but relatively low for Prochlorococcus and cyanobacteria (61 and 57% of successful identification, respectively). For PHYSAT-Med, Navarro et al. (2014) found similar results for Synechococcus and nanoeucaryotes (61 and 74%, respectively).
Table 1 shows the results of the validation exercise. For both nanoeucaryotes and diatoms the correlation between the PHYSAT-Med OC-CCI and the HPLC data is relatively large, with narrow bootstrapped confidence intervals non-overlapping 0. For Synechococcus the correlation is weaker but, again, the confidence interval does not contain 0. In contrast, for Prochlorococcus the association between PHYSAT-Med and HPLC data is weaker, and now the 0 is included within the confidence interval. In this later case, the sample size is clearly lower. The reason might be that the largest Prochlorococcus abundance is located near the deep chlorophyll maximum, deeper than the first optical depth (Siokou-Frangou et al., 2010).
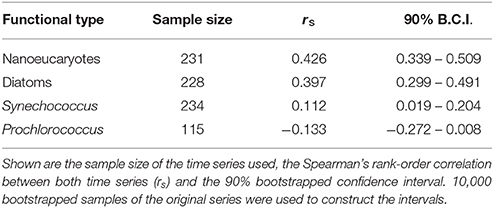
Table 1. Validation results of the PHYSAT-Med dataset with HPLC data from the Ligurian Sea.
Spatio-Temporal Patterns at the Basin Scale
Figure 5 shows the monthly climatology (1998–2015) of the dominant phytoplankton groups in the Mediterranean Sea obtained with the OC-CCI database. These patterns are similar to those obtained by Navarro et al. (2014) using the PHYSAT-Med and the MODIS imagery for the period comprised from July 2002 to May 2013. In addition, the analysis of the PFT is consistent with the previous knowledge of this area (Siokou-Frangou et al., 2010; Uitz et al., 2012; Sammartino et al., 2015; Di Cicco et al., 2017). It is evident that Synechococcus is the most abundant group detected at the basin scale and particularly during spring-summer months, whereas nanoeukaryotes seem to dominate during autumn-winter months. Prochlorococcus is preferentially distinguished during February and October in offshore waters, in opposition to diatoms that prevail in coastal areas, such as the Gulf of Lions, the Ligurian Sea and the northern Adriatic Sea, and mostly during the spring season. This last finding agrees with the microplankton distribution provided by Sammartino et al. (2015) and Di Cicco et al. (2017) who concluded that the fraction of microplankton significantly increases in the Northwestern Mediterranean Sea, reaching values from 30 to 57% (Sammartino et al., 2015). The presence of coccolithophorids in the basin is particularly evident along the Mediterranean coastline and particularly in the surroundings of the large river mouths (Ebro, Rhone and Nile) and in the Adriatic Sea (Figure 5). However, it is worthy to highlight that fluvial inputs of terrestrial matter or suspended solids may slightly mask the signals and affect phytoplankton distribution (Navarro et al., 2014). Even though PHYSAT-Med is also appropriate for detecting Phaeocyctis-like phytoplankton, no signal of this group was found in the current study. These spatio-temporal patterns were subsequently corroborated by the time series of monthly climatology (Figures 6B, 7B, 8B, and 9B) although only nanoeukaryotes, Prochlorococcus, Synechococcus-like cyanobacteria and diatoms were considered because these groups were compared with in situ pigment markers (Figure 4).
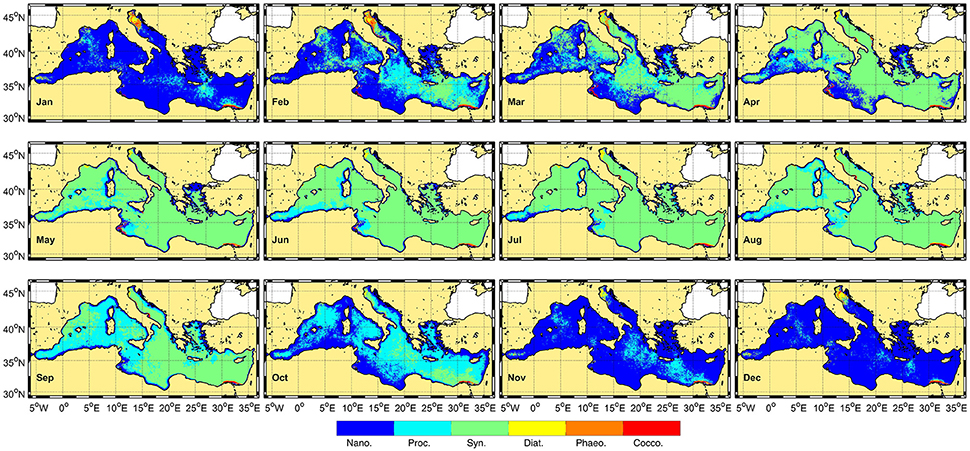
Figure 5. Monthly climatology of the dominant phytoplankton groups detected by PHYSAT-Med OC-CCI during the study period (January 1998–December 2015).
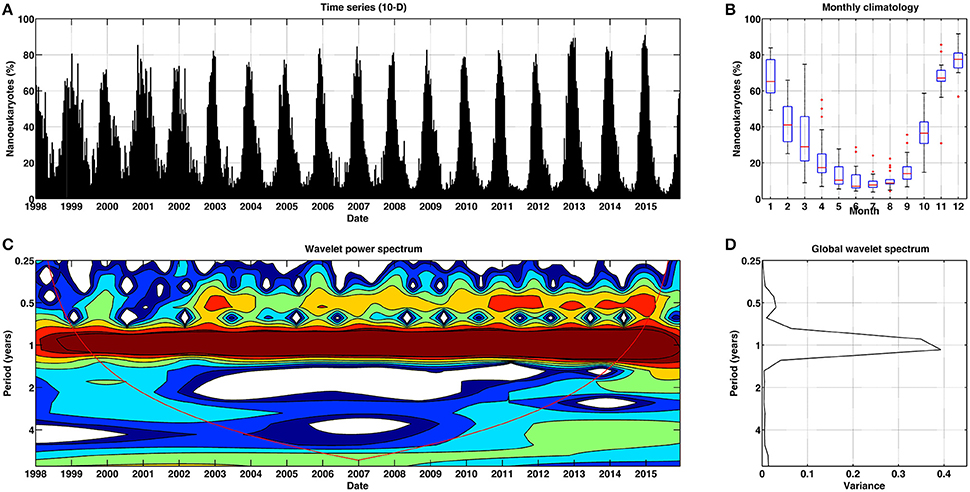
Figure 6. Temporal patterns of variability for nanoeukaryotes for Mediterranean Sea. (A) Temporal percentage (10-day) of nanoeukaryotes. (B) Box plot (red lines stand for the median, blue box spans from the first to the second quartiles, and black lines represent 5th and 95th percentiles, respectively) of monthly climatology of nanoeukaryotes. (C) Continuous wavelet power spectrum for the 10-day time series. Red line indicates the cone of influence, and is the region affected by the edges of the data and should not be considered. (D) Global wavelet spectrum for the 10-day time series.
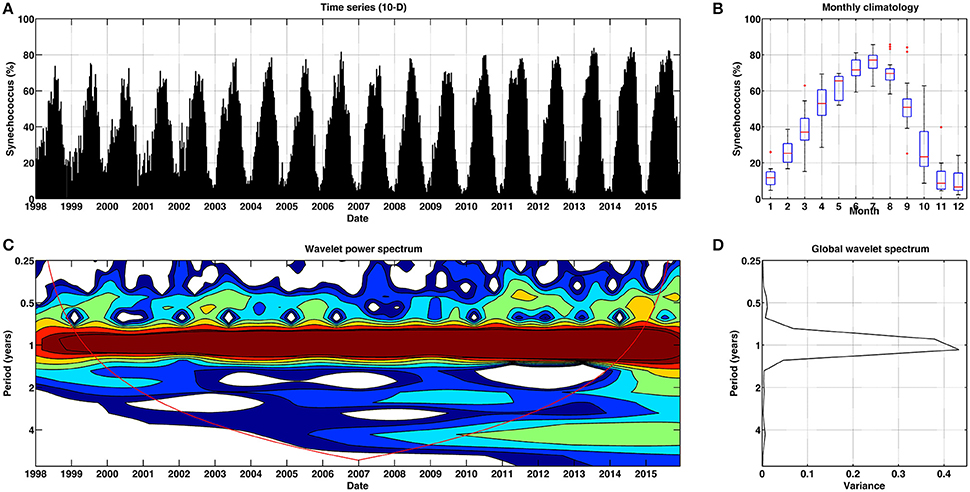
Figure 7. Temporal patterns of variability for Synechococcus for Mediterranean Sea. (A) Temporal percentage (10-day) of Synechococcus. (B) Box plot (red lines stand for the median, blue box spans from the first to the second quartiles, and black lines represent 5th and 95th percentiles, respectively) of monthly climatology of Synechococcus. (C) Continuous wavelet power spectrum for the 10-day time series. Red line indicates the cone of influence, and is the region affected by the edges of the data and should not be considered. (D) Global wavelet spectrum for the 10-day time series.
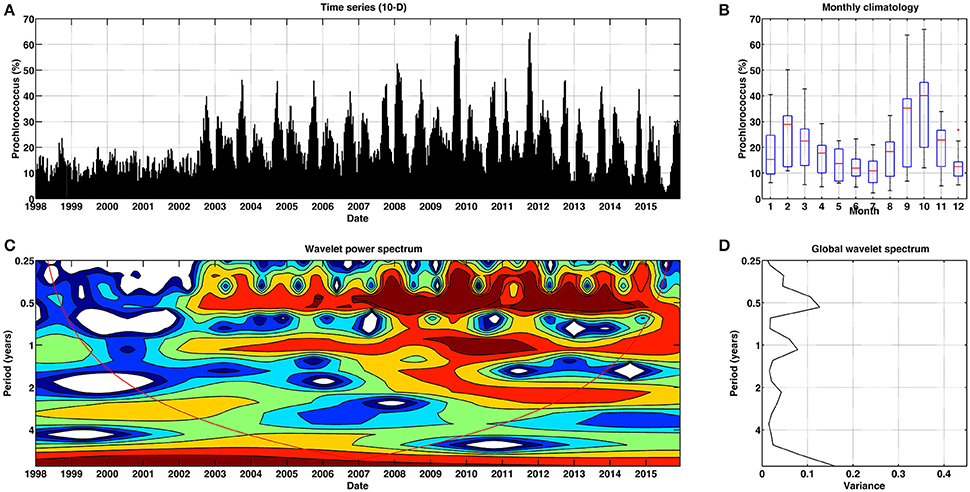
Figure 8. Temporal patterns of variability for Prochlorococcus for Mediterranean Sea. (A) Temporal percentage (10-day) of Prochlorococcus. (B) Box plot (red lines stand for the median, blue box spans from the first to the second quartiles, and black lines represent 5th and 95th percentiles, respectively) of monthly climatology of Prochlorococcus. (C) Continuous wavelet power spectrum for the 10-day time series. Red line indicates the cone of influence, and is the region affected by the edges of the data and should not be considered. (D) Global wavelet spectrum for the 10-day time series.
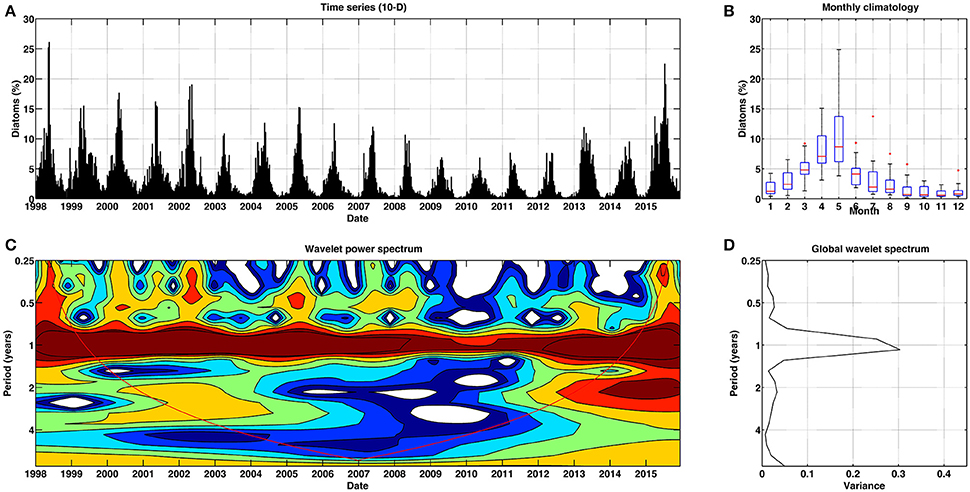
Figure 9. Temporal patterns of variability for diatoms for Mediterranean Sea. (A) Temporal percentage (10-day) of diatoms. (B) Box plot (red lines stand for the median, blue box spans from the first to the second quartiles, and black lines represent 5th and 95th percentiles, respectively) of monthly climatology of diatoms. (C) Continuous wavelet power spectrum for the 10-day time series. Red line indicates the cone of influence, and is the region affected by the edges of the data and should not be considered. (D) Global wavelet spectrum for the 10-day time series.
The abundance of nanoeukaryotes in the Mediterranean Sea (Figure 6A) follows recurrent 12-months cycles across time, as suggested by the power of the wavelet spectrum at this cycle (Figure 6C). Some weaker 6-months cyclic components can be observed during certain particular years (2003, 2006–2014). The mean annual cycle or the monthly climatology for this group (Figure 6B) showed a maximum percentage of abundance during the winter months, mainly November, December and January. The global wavelet spectrum (Figure 6D) demonstrated that the 12-months periodicity was highly significant, with a minor peak at 6-months also contributing to the variance. The amplitude of the seasonal variations of nanoeukaryotes at a basin scale is similar to that described by Sammartino et al. (2015) and Di Cicco et al. (2017), who found minimum values of abundance for nanoplankton during summer and maximum during winter, when the mixed layer depth (MLD) is also deeper (Siokou-Frangou et al., 2010). In the Levantine basin this group was the second most abundant in terms of Chla, but it was the main group in the western basin (Di Cicco et al., 2017). Nanoplankton make a dominant contribution (up to 43–50%) to total primary production throughout the year at the basin scale (Uitz et al., 2012).
For Synechococcus the wavelet power spectrum also revealed a persistent 12-months periodicity (Figures 7C,D), with virtually no secondary 6-months cycles. The higher percentages of Synechococcus abundance were effectively observed during the summer season (Figures 4, 5, and 7B), particularly in June and July, coinciding with the stratification period (Siokou-Frangou et al., 2010).
Interestingly, the temporal patterns of Prochlorococcus (Figure 8A) exhibited a less periodic fluctuation in dominance at the basin scale as compared to those of Synechococcus (Figure 7A).The continuous wavelet spectrum (Figures 8B,C) suggests that prior to 2002, no cyclic component dominated (the time series conformed to a white-noise process). From this year onwards, a 6-months periodicity pattern became apparent, particularly from 2007. An annual cycle also appeared during this period, but the power was smaller as suggested by the global wavelet spectrum (Figure 8D). This indicates that most of the temporal variance in the dominance of Prochlorococcus in the Mediterranean Sea occurs at different periodicities, perhaps dominated by a seasonal period. Synechococcus tends to be more abundant at the surface waters, whereas Prochlorococcus thrives mainly in the deep-chlorophyll maximum (Marty and Chiavérini, 2002; Casotti et al., 2003).
The temporal patterns of diatoms were characterized by a robust periodicity of 12 months across time (Figure 9). In this case, the largest dominance was observed during spring, in agreement with the diatom blooms reported in the basin over this season (Marty and Chiavérini, 2002). In contrast, the minima occurred in September, coinciding with nutrient exhaustion.
Spatio-Temporal Patterns at the Sub-Regional Scale
The PHYSAT-MedOC-CCI approach was also applied in four selected sub-regions in order to track the temporal evolution of phytoplankton groups at smaller spatial scales. To allow for meaningful comparisons, the chosen areas resemble those considered by Sammartino et al. (2015): the Alboran Sea, the Ligurian Sea, the North Adriatic Sea and the Levantine basin (Figure 1). Figure 10 shows the monthly climatology in the percentage of dominance of the four phytoplankton groups for each sub-region. Nanoeukaryotes occurrence exhibited a marked longitudinal gradient, with a higher abundance in the western basin (Alboran Sea and Ligurian Sea) in relation to the Levantine basin. Nonetheless, a marked annual cycle is evident in all sub-regions, which is characterized by the presence of maxima over the winter months and a minimum in summer. This was confirmed by a regional wavelet analysis that clearly revealed a consistent 12-month periodicity (Figure 11). Interestingly however, a longitudinal increase in the importance of 6-months periodicities also became apparent: both in the North Adriatic Sea and in the Levantine basin, recurrent seasonal periods contribute to the overall variability (Figure 11). Nevertheless, the overall abundance of this group kept values above 20%, with the exception of the Levantine basin over summer months. This temporal pattern resembles that of nanoplankton found in the selected areas by Sammartino et al. (2015), and reflects the constant contribution of this group to primary production, as previously reported (Vidussi et al., 2000, 2001; Uitz et al., 2012).
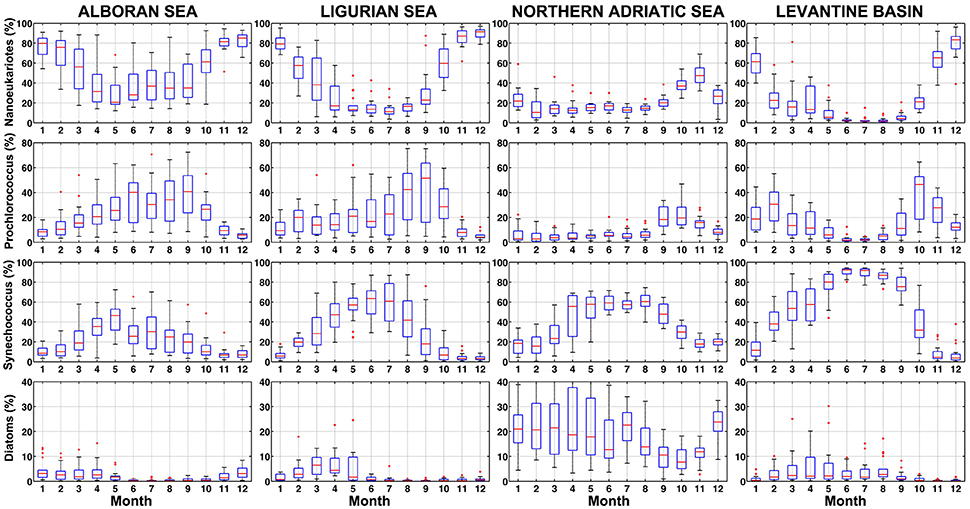
Figure 10. Box plot for monthly climatology for each group in Mediterranean sub-regions. Each row represents each phytoplankton group (nanoeukaryotes, Prochlorococcus, Synechococcus, and diatoms) and each column corresponds to the same sub-region (Alboran Sea, Ligurian Sea, Northern Adriatic Sea, and Levantine Basin). In the box plot figure red lines stand for the median, blue box spans from the first to the second quartiles, and black lines represent 5th and 95th percentiles, respectively, of monthly climatology for each group.
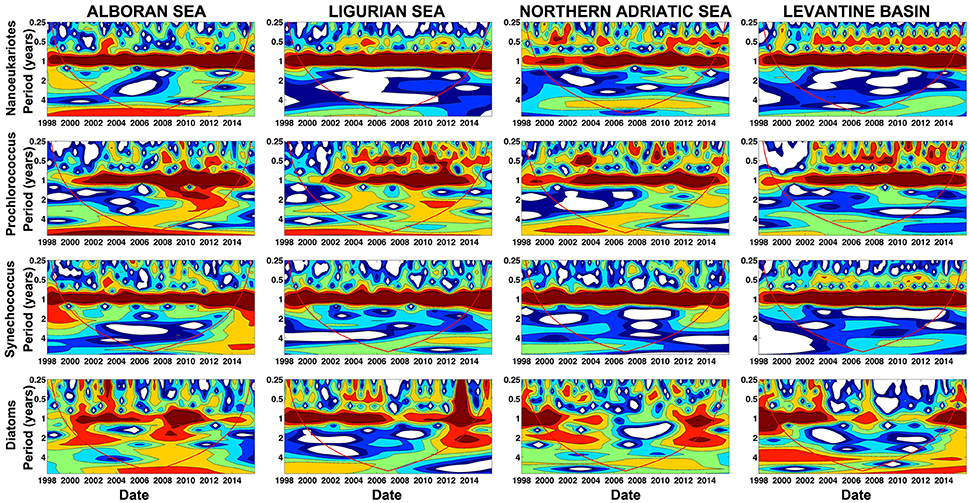
Figure 11. Continuous wavelet power spectrum for the 10-day time series for each group and four sub-regions. Each row represents each phytoplankton group (nanoeukaryotes, Prochlorococcus, Synechococcus, and diatoms) and each column corresponds to the same sub-region (Alboran Sea, Ligurian Sea, Northern Adriatic Sea, and Levantine Basin). Red line indicates the region of time and frequency affected by the edges of the data and should not be considered.
Prochlorococcus abundance in the four regions was higher over the late summer months and similar in terms of percentage between the Western and Eastern basins. This phytoplankton group is, however, less represented in the Northern Adriatic Sea. It is worthy to note that an additional winter peak (February) of Prochlorochoccus can be identified in the Levantine basin. This pattern of abundance at a sub-regional scale coincides with the wavelet analyses (Figure 11). The annual cycle of Synechococcus is also evidenced by the maximum of abundance in the four sub-regions during the summer months coinciding with the stratification period and when Chla concentration in the basin is low (Volpe et al., 2007). During this season, the temporal climatology of Synechococcus reached values close to 100% in the Levantine basin, in agreement with the values given by Sammartino et al. (2015) for picoplankton. These authors indicated that this size class (closely corresponding to Synechococcus) seems to cover homogenously the entire Mediterranean Sea, with percentages of abundance close to 70%, although a decreasing concentration gradient from west to east can be still observed, which was also revealed by our analysis particularly for Prochlorococcus. According to our analysis (Figure 10), Synechococcus dominated in the Eastern basin, where ultraoligotrophic conditions are present and particularly during summer (Siokou-Frangou et al., 2010). During this season, primary production by the picoplankton exhibits a maximum (Uitz et al., 2012. It is well known that due to their high surface/volume ratio, Synechococcus (and also Prochlorococcus) can cope optimally with nutrients-impoverished environments (Le Quéré et al., 2005). The presence of Synechococcus in the Levantine basin has been widely reported (Uitz et al., 2012 and references therein), and the PHYSAT-Med OC-CCI clearly revealed its presence in the ultraoligotrophic Levantine basin and depicted a realistic annual cycle (Figures 10, 11).
As expected, diatoms were the least abundant of the four phytoplankton groups analyzed in the Mediterranean sub-regions. In fact, with the exception of the Northern Adriatic Sea, the percentage of abundance of diatoms fell within the range of 10–20% in the Western sub-regions and in the Levantine basin during the whole year. A moderate spring maximum could be still detected, coinciding with the seasonal blooms normally described for this phytoplankton group along the Mediterranean (Marty and Chiavérini, 2002). As suggested by the wavelet analyses, the annual cycle for diatoms is rather less robust compared to other groups (Figure 11). These findings agree with previous studies, where higher phytoplankton biomass, particularly diatoms, was found in the Adriatic Sea (Socal et al., 1999; Casotti et al., 2003). This group represented an important faction (14%) of phytoplankton only in winter (Socal et al., 1999). Nevertheless, the contribution of picoplankton typically exceeds that of microplankton most of the year except during the winter-spring bloom (Uitz et al., 2012).
According to our assessment using the new OC-CCI database, the most abundant phytoplankton group during the winter months in the Mediterranean Sea was the nanoeukaryotes, but particularly in the sub-regions of the Western Mediterranean, the Alboran and the Ligurian Seas. Regardless of a specific area, the convective mixing in winter over the basin that uplifts deep nutrients to the upper layer triggers the proliferation of the bigger phytoplankton groups (Marty and Chiavérini, 2010), which is evidenced here by the major presence of nanoeukaryotes in winter months (Figures 5, 10). Our data also reproduce the basin-wide diatom peaks of abundance in spring (Figure 9), following the Mediterranean phytoplankton succession previously reported (Marty et al., 2002) and with a consistent pattern every year (Figures 9–11). It should be indicated, however, that our approach presents certain limitations in diatoms detection, as acknowledged by Navarro et al. (2014). Hence, it is likely that diatoms abundance may have been slightly underestimated across the basin although studies on extensive distribution of this group along the Mediterranean are scarce to allow for an accurate comparison. Conversely, Synechococcus and Prochlorococcus, which are more favored by stratification conditions during summer due to their better efficiency under nutrient depleted conditions, were successfully identified both at the basin (Figure 5) and sub-regional scales (Figure 10). Moreover, the well-known dominance of Synechococcus with respect to Prochlorococcus (Schauer et al., 2003), particularly in the ultraoligotrophic Eastern basin, was neatly reproduced in our study.
Overall, the spatio-temporal patterns obtained by applying the PHYSAT-Med to the satellite OC-CCI database are consistent with the previous distributions of the major phytoplankton groups observed in the Mediterranean Sea (Vidussi et al., 2000, 2001; Marty and Chiavérini, 2002, 2010; Marty et al., 2002; Siokou-Frangou et al., 2010; Navarro et al., 2014; Sammartino et al., 2015; Di Cicco et al., 2017). These results suggest that our approach is highly suitable at basin scale and in selected sub-regions. This new dataset for PFT could be an efficient tool for recording and understanding the response of the marine ecosystem to human pressures and thus for detecting eutrophication in the Mediterranean Sea (Vantrepotte and Mélin, 2010; Colella et al., 2016).
Conclusions
This work presents an updated version of the PHYSAT-Med algorithm that has been specifically developed using the OC-CCI database. This ESA initiative aims at gathering ocean color measurements from four sensors since 1997. The distribution of the major phytoplankton groups in the Mediterranean basin during a 18 years period was consistent with the previous knowledge on the distribution patterns of phytoplankton in the basin. In addition, the modeled distributions are in concordance with the distribution of HPLC pigments analyzed in NW Mediterranean Sea for the whole temporal range. The utility of the updated approach was confirmed by the temporal analysis using the wavelet spectrum, which allowed for the identification of shifting patterns of periodicities across time for the dominant phytoplankton groups. Therefore, the new version of the PHYSAT-Med is appropriate for assessing the shifting spatio-temporal patterns of the most abundant phytoplankton groups in the Mediterranean Sea.
Author Contributions
All authors contributed to the final manuscript: GN and IH were responsible for writing and organizing the manuscript. IC and GN implemented the PHYSAT-Med algorithm to new OC-CCI database. PA and AV performed the wavelet analysis. All authors discussed the results and drew the conclusions.
Funding
This work was financially supported by the Junta de Andalucía Projects PR11-RNM-7722, PIE 201530I012 and the National Project CTM2014-58181-R.
Conflict of Interest Statement
The authors declare that the research was conducted in the absence of any commercial or financial relationships that could be construed as a potential conflict of interest.
Acknowledgments
The authors acknowledge the Ocean Colour Climate Change Initiative dataset, Version 3.0, European Space Agency, available online at http://www.esa-oceancolour-cci.org/, for providing access to remote sensing reflectance products. In situ HPLC dataset was obtained from BOUSSOLE Project and MAREDAT database. We are grateful to two reviewers for their invaluable scientific improvements.
Supplementary Material
The Supplementary Material for this article can be found online at: http://journal.frontiersin.org/article/10.3389/fmars.2017.00246/full#supplementary-material
References
Aiken, J., Pradhan, Y., Barlow, R., Lavender, S., Poulton, A., Holligan, P., et al. (2009). Phytoplankton pigments and functional types in the Atlantic Ocean: a decadal assessment, 1995–2005. AMT Spec. Issue. Deep-Sea Res. II 56, 899–917. doi: 10.1016/j.dsr2.2008.09.017
Alvain, S., Le Quéré, C., Bopp, L., Racault, M. F., Beaugrand, G., Dessailly, D., et al. (2013). Rapid climatic driven shifts of diatoms at high latitudes. Remote Sens. Environ. 132, 195–201. doi: 10.1016/j.rse.2013.01.014
Alvain, S., Loisel, H., and Dessailly, D. (2012). Theoretical analysis of ocean color radiances anomalies and implications for phytoplankton groups detection in case 1 waters, Opt. Express 20, 1070–1083. doi: 10.1364/OE.20.001070
Alvain, S., Moulin, C., and Dandonneau, Y. (2008). Seasonal distribution and succession of dominant phytoplankton groups in the global ocean: a satellite view (SeaWiFS 1998–2006). Global Biogeochem. Cycles 22:GB3001. doi: 10.1029/2007GB003154
Alvain, S., Moulin, C., Dandonneau, Y., and Breon, F. M. (2005). Remote sensing of phytoplankton groups in case 1 waters from global SeaWiFS imagery. Deep Sea Res. I 1, 1989–2004. doi: 10.1016/j.dsr.2005.06.015
Alvain, S., Moulin, C., Dandonneau, Y., Loisel, H., and Bréon, F. M. (2006). A species-dependent bio-optical model of case I waters for global ocean color processing. Deep Sea Res. 53(Pt. I), 917–925. doi: 10.1016/j.dsr.2006.01.011
Antoine, D., Chami, M., Claustre, H., d'Ortenzio, F., Morel, A., Becu, G., et al. (2006). BOUSSOLE: A Joint CNRS-INSU, ESA, CNES, and NASA Ocean Color Calibration and Validation Activity. NASA Tech. Memo., 2006–21414, 59.
Arnold, S. R., Spracklen, D. V., Gebhardt, S., Custer, T., Williams, J., Peeken, I., et al. (2010). Relationships between atmospheric organic compounds and air-mass exposure to marine biology. Environ. Chem. 7, 232–241. doi: 10.1071/EN09144
Belviso, S., Masotti, I., Tagliabue, A., Bopp, L., Brockmann, P., Fichot, C., et al. (2012). DMS dynamics in the most oligotrophic subtropical zones of the global ocean. Biogeochemistry 110, 215–241. doi: 10.1007/s10533-011-9648-1
Ben Mustapha, Z., Alvain, S., Jamet, C., Loisel, H., and Dessailly, D. (2014). Automatic classification of water-leaving radiance anomalies from global SeaWiFS imagery: application to the detection of phytoplankton groups in open ocean waters. Remote Sens. Environ. 146, 97–12. doi: 10.1016/j.rse.2013.08.046
Bopp, L., Aumont, O., Cadule, P., Alvain, S., and Gehlen, M. (2005). Response of diatoms distribution to global warming and potential implications: a global model study. Geophys. Res. Lett. 32:L19606. doi: 10.1029/2005GL023653
Bracher, A., Bouman, H. A., Brewin, R. J. W., Bricaud, A., Brotas, V., Ciotti, A. M., et al. (2017). Obtaining Phytoplankton diversity from ocean color: a scientific roadmap for future development. Front. Mar. Sci. 4:55. doi: 10.3389/fmars.2017.00055
Bracher, A., Vountas, M., Dinter, T., Burrows, J. P., Röttgers, R., and Peeken, I. (2009). Quantitative observation of cyanobacteria and diatoms from space using PhytoDOAS on SCIAMACHY data. Biogeosciences 6, 751–764. doi: 10.5194/bg-6-751-2009
Brewin, R. J. W., Ciavatta, S., Sathyendranath, S., Jackson, T., Tilstone, G., Curran, K., et al. (2017). Uncertainty in ocean-color estimates of chlorophyll for phytoplankton groups. Front. Mar. Sci. 4:104. doi: 10.3389/fmars.2017.00104
Brewin, R. J. W., Devred, E., Sathyendranath, S., Lavender, S. J., and Hardman-Mountford, N. J. (2011). Model of phytoplankton absorption based on three size classes. Appl. Opt. 50, 4353–4364. doi: 10.1364/AO.50.004535
Brewin, R. J. W., Sathyendranath, S., Müller, D., Brockmann, C., Deschamps, P. Y., Devred, E., et al. (2015). The ocean colour climate change initiative: III. a round-robin comparison on in-water bio-optical algorithms. Remote Sens. Environ. 162, 271–294. doi: 10.1016/j.rse.2013.09.016
Brewin, R. J., Sathyendranath, S., Hirata, T., Lavender, S. J., Barciela, R. M., and Hardman-Mountford, N. J. (2010). A three-component model of phytoplankton size class for the Atlantic Ocean. Ecol. Modell. 221, 1472–1483. doi: 10.1016/j.ecolmodel.2010.02.014
Bricaud, A., Bosc, E., and Antoine, D. (2002). Algal biomass and sea surface temperature in the Mediterranean basin. intercomparison of data from various satellite sensors, and implications for primary production estimates. Remote Sens. Environ. 81, 163–178. doi: 10.1016/S0034-4257(01)00335-2
Brunet, C., Casotti, R., Vantrepotte, V., Corato, F., and Conversano, F. (2006). Picophytoplankton diversity and photoacclimation in the Strait of Sicily (Mediterranean Sea) in summer. I. Mesoscale variations. Aqua. Microbiol. Ecol. 44, 127–141. doi: 10.3354/ame044127
Casotti, R., Landolfi, A., Brunet, C., D'Ortenzio, F., Mangoni, O., Ribera d'Alcalà, M., et al. (2003). Composition and dynamics of the phytoplankton of the Ionian Sea (eastern Mediterranean). J. Geophys. Res. 108:8116. doi: 10.1029/2002JC001541
Chassot, E., Bonhommeau, S., Dulvy, N. K., Mélin, F., Watson, R., Gascuel, D., et al. (2010). Global marine primary production constrains fisheries catches. Ecol. Lett. 13, 495–505. doi: 10.1111/j.1461-0248.2010.01443.x
Ciotti, A., and Bricaud, A. (2006). Retrievals of a size parameter for phytoplankton and spectral light absorption by colored detrital matter from water-leaving radiances at SeaWiFS channels in a continental shelf region off Brazil. Limnol. Oceanogr. Methods. 4, 237–253. doi: 10.4319/lom.2006.4.237
Claustre, H., and Marty, J. C. (1995). Specific phytoplankton biomasses and their relation to primary production in the Tropical North Atlantic. Deep Sea Res. 42(Pt. I), 1475–1493. doi: 10.1016/0967-0637(95)00053-9
Claustre, H., Morel, A., Hooker, S. B., Babin, M., Antoine, D., Oubelkheir, K., et al. (2002). Is desert dust making oligotrophic waters greener? Geophys. Res. Lett. 29:1469. doi: 10.1029/2001GL014056
Colella, S., Falcini, F., Rinaldi, E., Sammartino, M., and Santoleri, R. (2016). Mediterranean ocean colour chlorophyll trends. PLoS ONE 11:e0155756. doi: 10.1371/journal.pone.0155756
Couto, A. B., Brotas, V., Mélin, F., Groom, S., and Sathyendranath, S. (2016). Inter-comparison of OC-CCI chlorophyll-a estimates with pre-cursor datasets. Int. J. Remote Sens. 37, 4337–4355. doi: 10.1080/01431161.2016.1209313
D'Ortenzio, F., and Ribera d'Alcalá, M. (2009). On the trophic regimes of the Mediterranean Sea: a satellite analysis. Biogeosciences 6, 139–148. doi: 10.5194/bg-6-139-2009
D'Ovidio, F., De Monte, S., Alvain, S., Dandonneau, Y., and Levy, M. (2010). Fluid dynamical niches of phytoplankton types. Proc. Natl. Acad. Sci. U.S.A. 107, 18366–18370. doi: 10.1073/pnas.1004620107
Dandonneau, Y., Montel, Y., Blanchot, J., Giraudeau, J., and Neveux, J. (2006). Temporal variability in phytoplankton pigments, picoplankton and coccolithophores along a transect through the North Atlantic and tropical southwestern Pacific. Deep Sea Res. Oceanogr. Res. Pap. 53(Pt. I), 689–712. doi: 10.1016/j.dsr.2006.01.002
De Monte, S., Soccodato, A., Alvain, S., and D'Ovidio, F. (2013). Can we detect oceanic biodiversity hotspots from space? ISME J. 7, 2054–2056. doi: 10.1038/ismej.2013.72
Demarcq, H., Reygondeau, G., Alvain, S., and Vantrepotte, V. (2012). Monitoring marine phytoplankton seasonality from space. Remote Sens. Environ. 117, 211–222. doi: 10.1016/j.rse.2011.09.019
Di Cicco, A., Sammartino, M., Marullo, S., and Santoleri, R. (2017). Regional empirical algorithms for an improved identification of Phytoplankton Functional Types and Size Classes in the Mediterranean Sea using satellite data. Front. Mar. Sci. 4:126 doi: 10.3389/fmars.2017.00126
D'Ortenzio, F., Marullo, S., Ragni, M., Ribera d'Alcala, M., and Santoleri, R. (2002). Validation of empirical SeaWiFS algorithms for chlorophyll-a retrieval in the Mediterranean Sea: a case study for oligotrophic seas. Remote Sens. Environ. 82, 79–94. doi: 10.1016/S0034-4257(02)00026-3
Efron, B., and Tibshirani, R. J. (1993). An Introduction to the Bootstrap. (New York, NY: Chapman & Hall/CRC).
Field, C. B., Behrenfeld, M. J., Randerson, J. T., and Falkowski, P. (1998). Primary production of the biosphere: Integrating terrestrial and oceanic components. Science 281, 237–240.
Fujiwara, A., Hirawake, T., Suzuki, K., and Saitoh, S. I. (2011). Remote sensing of size structure of phytoplankton communities using optical properties of the Chukchi and Bering Sea shelf region. Biogeosciences 8, 3567–3580. doi: 10.5194/bg-8-3567-2011
Gieskes, W. W. C., and Kraay, G. W. (1983). Dominance of Cryptophyceae during the phytoplankton spring bloom in the central North Sea detected by HPLC analysis of pigments. Mar. Biol. 75, 179–185. doi: 10.1007/BF00406000
Gieskes, W. W. C., Kraay, G. W., Nontji, A., Setiapermana, D., and Sutomo, D. (1988). Monsoonal alternation of a mixed and a layered structure in the phytoplankton of the euphotic zone of the banda sea (Indonesia): a mathematical analysis of algal pigment fingerprints. Neth. J. Sea Res. 22, 123–137. doi: 10.1016/0077-7579(88)90016-6
Goericke, R., and Repeta, D. (1992). The pigments of Prochlorococcus marinus: the presence of divinyl-chlorophylls a and b in a marine prokaryote. Limnol. Oceanogr. 37, 425–433. doi: 10.4319/lo.1992.37.2.0425
Goericke, R., and Repeta, D. (1993). Chlorophylls a and b and divinyl chlorophylls a and b in the open subtropical North Atlantic Ocean. Mar. Ecol. Prog. Ser. 101, 307–313. doi: 10.3354/meps101307
Gorgues, T., Menkes, C., Slemons, L., Aumont, O., Dandonneau, Y., Radenac, M. H., et al. (2010). Revisiting the La Niña 1998 phytoplankton blooms in the equatorial Pacific. Deep Sea Res. Oceanogr. Res. Pap. 57(Pt. I), 567–576. doi: 10.1016/j.dsr.2009.12.008
Grant, M., Jackson, T., Chuprin, A., Sathyendranath, S., Zühlke, M., Groom, S., et al. (2016). Ocean Colour Climate Change Initiative (OC-CCI)—Phase Two. Product User Guide. 2015. Available Online at: ftp://ftp.rsg.pml.ac.uk/occci-v2.0/documentation/OC-CCI-PUG-v2.0.5.pdf (accessed on 4 May 2017).
Gregg, W. W., and Casey, N. W. (2004). Global and regional evaluation of the SeaWiFS chlorophyll data set. Remote Sens. Environ. 93, 463–479. doi: 10.1016/j.rse.2003.12.012
Gregg, W. W., Chen, F. C., Mezaache, A. L., Chen, J. D., and Whiting, J. A. (1993). The Simulated SeaWiFS Data Set. Version 1. SeaWiFS Technical Report Series #9, edited by S.B. Hooker, NASA Technical Memorandum 104566. Greenbelt. Vol.09.
Grinsted, A., Moore, J. C., and Jevrejeva, S. (2004). Application of the cross wavelet transform and wavelet coherence to geophysical time series. Nonlinear Process. Geophys. 11, 561–566. doi: 10.5194/npg-11-561-2004
Guillard, R. R. L., Murphy, L. S., Foss, P., and Liaaen-Jensen, S. (1985). Synechococcus spp. as likely zeaxanthin-dominant ultraphytoplankton in the North Atlantic. Limnol. Oceanogr. 30, 412–414. doi: 10.4319/lo.1985.30.2.0412
Hashioka, T., Vogt, M., Yamanaka, Y., Le Quéré, C., Buitenhuis, E. T., Aita, M. N., et al. (2013). Phytoplankton competition during the spring bloom in four plankton functional type models. Biogeosciences 10, 6833–6850. doi: 10.5194/bg-10-6833-2013
Hirata, T., Hardman-Mountford, N. J., Brewin, R. J. W., Aiken, J., Barlow, R., Suzuki, K., et al. (2011). Synoptic relationships between surface Chlorophyll-a and diagnostic pigments specific to phytoplankton functional types, Biogeosciences 8, 311–327. doi: 10.5194/bg-8-311-2011
Huertas, I. E., Ríos, A. F., García-Lafuente, J., Navarro, G., Makaoui, A., Sánchez-Román, A., et al. (2012). Atlantic forcing of the Mediterranean oligotrophy, Glob. Biogeochem. Cycles 26, GB2022. doi: 10.1029/2011GB004167
IOCCG (2012). Mission Requirements for Future Ocean-Colour Sensors. Reports of the International Ocean-Colour Coordinating Group, No. 13, IOCCG, eds C. R McClain and G. Meister, Dartmouth.
Jackson, T., Sathyendranath, S., and Mélin, F. (in press). An improved optical classification scheme for the Ocean Colour Essential Climate Variable its applications. Remote Sens. Environ. doi: 10.1016/j.rse.2017.03.036
Jeffrey, S. W. (1980). “Algal pigment systems,” in Primary Productivity in the Sea. ed P. Falkowski (New York, NY: Plenum Press), 33–58.
Jeffrey, S. W., and Hallegraeff, G. M. (1987). Phytoplankton pigments, species and light climate in a complex warm-core eddy of the East Australian Current. Deep Sea Res. Part A Oceanogr. Res. Pap. 34, 649–673. doi: 10.1016/0198-0149(87)90029-X
Jeffrey, S. W., and Vesk, M. (1997). “Introduction to marine phytoplankton and their pigment signatures,” in Phytoplankton Pigments in Oceanography, eds S. W. Jeffrey, R. F. C. Mantoura, and S. W. Wright (Paris: U. N. Educ. Sci. and Cult. Org.), 407–428.
Kostadinov, T. S., Siegel, D. A., and Maritorena, S. (2010). Global variability of phytoplankton functional types from space: assessment via the particle size distribution. Biogeosciences 7, 3239–3257. doi: 10.5194/bg-7-3239-2010
Kostadinov, T., Cabré, A., Vedantham, H., Marinov, I., Bracher, A., Brewin, R., et al. (2017). Intercomparison of phytoplankton functional types derived from ocean color algorithms and earth system models: phenology. Remote Sens. Environ. 190, 162–177.doi: 10.1016/j.rse.2016.11.014
Krom, M. D., Kress, N., Brenner, S., and Gordon, L. (1991). Phosphorous limitation of primary productivity in the Eastern Mediterranean Sea. Limnol. Oceanogr. 36, 424–432. doi: 10.4319/lo.1991.36.3.0424
Le Quéré, C., Harrison, S. P., Prentice, I. C., Buitenhuis, E. T., Aumont, O., Bopp, L., et al. (2005). Ecosystem dynamics based on plankton functional types for global ocean biogeochemistry models. Glob. Chang. Biol. 11, 2016–2040. doi: 10.1111/j.1365-2486.2005.1004.x
Lee, Z. P., Darecki, M., Carder, K. L., Davis, C. O., Stramski, D., and Rhea, W. J. (2005). Diffuse attenuation coefficientof downwelling irradiance: an evaluation of remote sensing methods. J. Geophys. Res. Oceans 110:C02017. doi: 10.1029/2004JC002573
Li, W. K. W., SubbaRao, D. V., Harrison, W. G., Smith, J. C., Cullen, J. J., and Irwin, T. (1983). Autotrophic picoplankton in the tropical ocean. Science 219, 292–295. doi: 10.1126/science.219.4582.292
Loisel, H., Vantrepotte, V., Norkvist, K., Mériaux, X., Kheireddine, M., Ras, J., et al. (2011). Characterization of the bio-optical anomaly and diurnal variability of particulate matter, as seen from scattering and backscattering coefficients, in ultra-oligotrophic eddies of the Mediterranean Sea. Biogeosciences 8, 3295–3317. doi: 10.5194/bg-8-3295-2011
Ludwig, W., Dumont, E., Meybeck, M., and Heussner, S. (2009), River discharges of water nutrients tothe Mediterranean Black Sea: Major drivers for ecosystem changes during past future decades? Prog. Oceanogr. 80, 199–217. doi: 10.1016/j.pocean.2009.02.001
Marty, J. C., and Chiavérini, J. (2002). Seasonal and interannual variations in phytoplankton production at DYFAMED time-series station, northwestern Mediterranean Sea. Deep Sea Res. II 49, 2017–2030. doi: 10.1016/S0967-0645(02)00025-5
Marty, J. C., and Chiavérini, J. (2010). Hydrological changes in the Ligurian Sea (NW Mediterranean, DYFAMED site) during 1995–2007 and biogeochemical consequences, Biogeosciences 7, 2117–2128. doi: 10.5194/bg-7-2117-2010
Marty, J. C., Chiavérini, J., Pizay, M. D., and Avril, B. (2002). Seasonal and interannual dynamics of nutrients and phytoplankton pigments in the western Mediterranean Sea at the DYFAMED time-series station (1991–1999). Deep Sea Res. Part II Top. Stud. Oceanogr. 49, 1965–1985. doi: 10.1016/S0967-0645(02)00022-X
Masotti, I., Belviso, S., Alvain, S., Johnson, J. E., Bates, T. S., Tortell, P. D., et al. (2010). Spatial and temporal variability of the dimethylsulfide to chlorophyll ratio in the surface ocean: an assessment based on phytoplankton group dominance determined from space. Biogeosciences 7, 3215–3237. doi: 10.5194/bg-7-3215-2010
Masotti, I., Moulin, C., Alvain, S., Bopp, L., Tagliabue, A., and Antoine, D. (2011). Large-scale shifts in phytoplankton groups in the Equatorial Pacific during ENSO cycles, Biogeosciences 8, 539–550, doi: 10.5194/bg-8-539-2011
Mayot, N., D'Ortenzio, F., Uitz, J., Gentili, B., Ras, J., Vellucci, V., et al. (2017). Influence of the phytoplankton community structure on the spring and annual primary production in the North-Western Mediterranean Sea. J. Geophys. Res. Oceans. doi: 10.1002/2016JC012668. [Epub ahead of print].
McClain, C. R. (2009). A decade of satellite ocean color observations. Annu. Rev. Mar. Sci. 1, 19–42. doi: 10.1146/annurev.marine.010908.163650
Mélin, F., and Sclep, G. (2015). Band shifting for ocean color multi-spectral reflectance data. Opt. Express 23, 2262–2279. doi: 10.1364/OE.23.002262
Mouw, C. B., and Yoder, J. A. (2010). Optical determination of phytoplankton size composition from global SeaWiFS imagery. J. Geophys. Res. 115, C12018. doi: 10.1029/2010JC006337
Mouw, C. B., Hardman-Montford, N., Alvain, S., Bracher, A., Brewin, R., Bricaud, A., et al. (2017). A Consumer's guide to satellite remote sensing of multiple phytoplankton groups in the global ocean. Front. Mar. Sci. 4:41. doi: 10.3389/fmars.2017.00041
Mueller, J. L., and Austin, R. W. (1995). Ocean Optics Protocols for SeaWiFS Validation, Revision 1. NASA Tech. Memo. 104566, Vol. 25, edited by: Hooker, S. B., Firestone, E. R., and Acker, J. G., NASA Goddard Space Flight Center, Greenbelt, Maryland, 67.
Navarro, G., Alvain, S., Vantrepotte, V., and Huertas, I. E. (2014). Identification of dominant phytoplankton functional types in the Mediterranean Sea based on a regionalized remote sensing approach. Remote Sens. Environ. 152, 557–575. doi: 10.1016/j.rse.2014.06.029
Nezlin, N. P., and DiGiacomo, P. M. (2005). Satellite ocean color observations of stormwater runoff plumes alongthe San Pedro Shelf (southern California) during1997–2003. Cont. Shelf Res. 25, 1692–1711. doi: 10.1016/j.csr.2005.05.001
O'Reilly, J. E., Maritorena, S., Mitchell, B. G., Siegel, D. A., Carder, K. L., Garver, S. A., et al. (1998). Ocean color chlorophyll algorithms for SeaWiFS. J. Geophys. Res. 103, 24937–24953. doi: 10.1029/98JC02160
Peloquin, J., Swan, C., Gruber, N., Vogt, M., Claustre, H., and Ras, J. (2013). The MAREDAT global database of high performance liquid chromatography marine pigment measurements. Earth System Science Data 5, 109–123. doi: 10.5194/essd-5-109-2013
Percival, D. B., and Walden, A. T. (2000). Wavelet Methods for Time Series Analysis. Cambridge: Cambridge University Press.
Platt, T., Sathyendranath, S., and Stuart, V. (2006). Why study biological oceanography? Aquabiology 28, 542−557.
Powley, H. R., Dürr, H. H., Lima, A. T., Krom, M. D., and Van Cappellen, P. (2016). Direct Discharges of Domestic Wastewater are a Major Source of Phosphorus and Nitrogen to the Mediterranean Sea. Environ. Sci. Technol. 50, 8722–8730. doi: 10.1021/acs.est.6b01742
Raitsos, D., Lavender, S. J., Maravelias, C. D., Haralambous, J., Richardson, A. J., and Reid, P. C. (2008). Identifying four phytoplankton functional types from space: an ecological approach. Limnol. Oceanogr. 53, 605–613. doi: 10.4319/lo.2008.53.2.0605
Roy, S., Sathyendranath, S., Bouman, H., and Platt, T. (2013). The global distribution of phytoplankton size spectrum and size classes from their light-absorption spectra derived from satellite data. Remote Sens. Environ. 139, 185–197. doi: 10.1016/j.rse.2013.08.004
Sabine, C. L., Feely, R. A., Gruber, N., Key, R. M., Lee, K., Bullister, J. L., et al. (2004). The oceanic sink for anthropogenic CO2, Science 305, 367. doi: 10.1126/science.1097403
Sammartino, M., Di Cicco, A., Marullo, S., and Santoleri, R. (2015). Spatio-temporal variability of micro-, nano- and pico-phytoplankton in the Mediterranean Sea from satellite ocean colour data of SeaWiFS. Ocean Sci. 11, 759–778. doi: 10.5194/os-11-759-2015
Santoleri, R., Volpe, G., Marullo, S., and Nardelli, B. B. (2008). “Open waters optical remote sensing of the Mediterranean Sea,” in Remote Sensing of the European Seas, eds V. Barale and M. Gade (Dordrecht: Springer Netherlands), 103–116.
Sathyendranath, S., Watts, L., Devred, E., Platt, T., Caverhill, C., and Maass, H. (2004). Discrimination of diatoms from other phytoplankton using ocean-colour data. Mar. Ecol. Prog. Ser. 272, 59–68. doi: 10.3354/meps272059
Schauer, M., Balagué, V., Pedrós-Alió, C., and Massana, R. (2003). Seasonal changes in the taxonomic composition of bacterioplankton in a coastal oligotrophic system. Aquat. Microb. Ecol. 31, 163–174. doi: 10.3354/ame031163
Siokou-Frangou, I., Christaki, U., Mazzocchi, M. G., Montresor, M., Ribera d'Alcalá, M., Vaqué, D., et al. (2010). Plankton in the open Mediterranean Sea: a review. Biogeosciences 7, 1543–1586. doi: 10.5194/bg-7-1543-2010
Socal, G., Boldrin, A., Bianchi, F., Civitarese, G., De Lazzari, A., Rabitti, S., et al. (1999). Nutrient, particulate matter and phytoplankton variability in the photic layer of the Otranto strait. J. Mar. Syst. 20, 381–398. doi: 10.1016/S0924-7963(98)00075-X
Storm, T., Boettcher, M., Grant, M., Zühlke, M., Fomferra, N., Jackson, T., et al. (2013). Product User Guide, Ocean Colour Climate Change Initiative. Plymouth: Plymouth Marine Laboratory.
Tanhua, T., Hainbucher, D., Schröder, K., Cardin, V., Álvarez, M., and Civitarese, G. (2013). The Mediterranean Sea system: a review and an introduction to the special issue. Ocean Sci. Discuss. 10, 581–617. doi: 10.5194/osd-10-581-2013
Thuillier, G., Herse, M., Labs, D., Foujols, T., Peetermans, W., Gillotay, D., et al. (2003). The solar spectral irradiance from 200 to 2400 nm as measured by the solspec spectrometer from the ATLAS and EURECA missions. Solar Phys. 214, 1–22. doi: 10.1023/A:1024048429145
Thyssen, M., Alvain, S., Lefebvre, A., Dessailly, D., Rijkeboer, M., Guiselin, N., et al. (2015). High-resolution analysis of a North Sea phytoplankton community structure based on in situ flow cytometry observations and potential implication for remote sensing, Biogeosciences 12, 4051–4066. doi: 10.5194/bg-12-4051-2015
Torrence, C., and Compo, G. P. (1998). A practical guide to wavelet analysis. Bull. Am. Meteorol. Soc. 79, 61–78.
Turley, C. M., Bianchi, M., Christaki, U., Conan, P., Harris, J. R. W., Psarra, S., et al. (2000). Relationship between primary producers and bacteriain an oligotrophic sea - the Mediterranean and biogeochemical implications. Mar. Ecol. Prog. Ser. 193, 11–18. doi: 10.3354/meps193011
Uitz, J., Claustre, H., Morel, A., and Hooker, S. B. (2006). Vertical distribution of phytoplankton communities in Open Ocean: an assessment based on surface chlorophyll. J. Geophys. Res. 111, CO8005. doi: 10.1029/2005JC003207
Uitz, J., Stramski, D., Gentili, B., D'Ortenzio, F., and Claustre, H. (2012). Estimates of phytoplankton class-specific and total primary production in the Mediterranean Sea from satellite ocean color observations. Global Biogeochem. Cycles 26, GB2024. doi: 10.1029/2011GB004055
Vantrepotte, V., and Mélin, F. (2010). Temporal variability in SeaWiFS derived apparent optical properties in European seas. Continent. Shelf Res. 30, 319–334. doi: 10.1016/j.csr.2009.11.012
Vaulot, D., Partensky, F., Neveux, J., Mantoura, F. C., and Llevellyn, C. A. (1990). Winter presence of prochlorophytes in surface waters of the northwestern Mediterranean Sea. Limnol. Oceanogr. 35, 1156–1164. doi: 10.4319/lo.1990.35.5.1156
Vidussi, F., Claustre, H., Manca, B., Luchetta, A., and Marty, J. C. (2001). Phytoplankton pigment distribution in relation to the upper thermocline circulation in the Eastern Mediterranean Sea during winter. J. Geophys. Res. 106, 19939–19956. doi: 10.1029/1999JC000308
Vidussi, F., Marty, J. C., and Chiaverini, J. (2000). Phytoplankton pigment variations during the transition from spring bloom to oligotrophy in the northwestern Mediterranean Sea. Deep-Sea Res. 47, 423–445. doi: 10.1016/S0967-0637(99)00097-7
Volpe, G., Colella, S., Forneris, V., Tronconi, C., and Santoleri, R. (2012). The Mediterranean Ocean Colour Observing System - System development and product validation. Ocean Sci. 8, 869–883. doi: 10.5194/os-8-869-2012
Volpe, G., Santoleri, R., Vellucci, V., Ribera d'Alcalà, M., Marullo, S., and D'Ortenzio, F. (2007). The colour of the Mediterranean Sea: global versus regional bio-optical algorithms evaluation and implication for satellite chlorophyll estimates. Remote Sens. Environ. 107, 625–638. doi: 10.1016/j.rse.2006.10.017
Winder, M., and Cloern, J. E. (2010). The annual cycles of phytoplankton biomass. Philos. Trans. R. Soc. B 365:3215. doi: 10.1098/rstb.2010.0125
Keywords: PHYSAT-Med algorithm, OC-CCI database, phytoplankton functional types, Mediterranean Sea, wavelet analysis
Citation: Navarro G, Almaraz P, Caballero I, Vázquez Á and Huertas IE (2017) Reproduction of Spatio-Temporal Patterns of Major Mediterranean Phytoplankton Groups from Remote Sensing OC-CCI Data. Front. Mar. Sci. 4:246. doi: 10.3389/fmars.2017.00246
Received: 15 March 2017; Accepted: 19 July 2017;
Published: 02 August 2017.
Edited by:
Astrid Bracher, Alfred-Wegener-Institute Helmholtz Center for Polar and Marine Research, GermanyReviewed by:
Alison Palmer Chase, University of Maine, United StatesTakafumi Hirata, Hokkaido University, Japan
Copyright © 2017 Navarro, Almaraz, Caballero, Vázquez and Huertas. This is an open-access article distributed under the terms of the Creative Commons Attribution License (CC BY). The use, distribution or reproduction in other forums is permitted, provided the original author(s) or licensor are credited and that the original publication in this journal is cited, in accordance with accepted academic practice. No use, distribution or reproduction is permitted which does not comply with these terms.
*Correspondence: Gabriel Navarro, Z2FicmllbC5uYXZhcnJvQGljbWFuLmNzaWMuZXM=