 Timothy S. Moore1*
 Colleen B. Mouw2
 James M. Sullivan3Michael S. Twardowski3
 Ashley M. Burtner4Audrey B. Ciochetto2Malcolm N. McFarland3
 Aditya R. Nayak3Danna Paladino4Nicole D. Stockley3Thomas H. Johengen4Angela W. Yu5
 Steve Ruberg6Alan Weidemann7
- 1Ocean Process Analysis Laboratory, University of New Hampshire, Durham, NH, United States
- 2Graduate School of Oceanography, University of Rhode Island, Narragansett, RI, United States
- 3Harbor Branch Oceanographic Institute, Florida Atlantic University, Fort Pierce, FL, United States
- 4Cooperative Institute for Limnology and Ecosystems Research, University of Michigan, Ann Arbor, MI, United States
- 5Department of Geological and Mining Engineering and Sciences, Michigan Technological University, Houghton, MI, United States
- 6NOAA Great Lakes Environmental Research Laboratory, National Oceanic and Atmospheric Administration, Ann Arbor, MI, United States
- 7United States Naval Research Laboratory, Stennis, MS, United States
There is a growing use of remote sensing observations for detecting and quantifying freshwater cyanobacteria populations, yet the inherent optical properties of these communities in natural settings, fundamental to bio-optical algorithms, are not well known. Toward bridging this knowledge gap, we measured a full complement of optical properties in western Lake Erie during cyanobacteria blooms in the summers of 2013 and 2014. Our measurements focus attention on the optical uniqueness of cyanobacteria blooms, which have consequences for remote sensing and bio-optical modeling. We found the cyanobacteria blooms in the western basin during our field work were dominated by Microcystis, while the waters in the adjacent central basin were dominated by Planktothrix. Chlorophyll concentrations ranged from 1 to over 135 μg/L across the study area with the highest concentrations associated with Microcystis in the western basin. We observed large, amorphous colonial Microcystis structures in the bloom area characterized by high phytoplankton absorption and high scattering coefficients with a mean particle backscatter ratio at 443 nm > 0.03, which is higher than other plankton types and more comparable to suspended inorganic sediments. While our samples contained mixtures of both, our analysis suggests high contributions to the measured scatter and backscatter coefficients from cyanobacteria. Our measurements provide new insights into the optical properties of cyanobacteria blooms, and indicate that current semi-analytic models are likely to have problems resolving a closed solution in these types of waters as many of our observations are beyond the range of existing model components. We believe that different algorithm or model approaches are needed for these conditions, specifically for phytoplankton absorption and particle backscatter components. From a remote sensing perspective, this presents a challenge not only in terms of a need for new algorithms, but also for determining when to apply the best algorithm for a given situation. These results are new in the sense that they represent a complete description of the optical properties of freshwater cyanobacteria blooms, and are likely to be representative of bloom conditions for other systems containing Microcystis cells and colonies.
1. Introduction
Freshwater lake systems provide critical roles as ecological habitats for many organisms, a source of drinking water for human and animal life, and as biogeochemical components in Earth system element cycling (Tranvik et al., 2009). These systems respond to environmental change over short and long time scales, which can alter ecosystem dynamics with profound effects (Paerl et al., 2011; Kane et al., 2014). One expected outcome of climate change is an increase in cyanobacteria harmful algal blooms (or cHABs) across freshwater lakes on a global scale (Paerl et al., 2011; Visser et al., 2016). Freshwater cHABs comprise strains with natural toxins and increase health risks for humans and animals from acute and chronic exposures. There are already observed rises of cHABs in some regions such as Lake Erie (Stumpf et al., 2012) and Lake Taihu (Hu et al., 2010) based on trend analysis of remote sensing data sets.
Remote sensing provides information on broad spatial and temporal scales unattainable by other means, and is an attractive tool to monitor short- and long-term change in lakes (e.g., Binding et al., 2007; Hu et al., 2010; Mouw et al., 2015; Sayers et al., 2016). The quality of remote sensing products is critical to interpreting ecological trends and linkages to underlying drivers. This in large part depends on understanding the optical properties of a given water body. Bio-optical algorithms are governed by fundamental principles of light interactions with particles in a medium, and are typically parameterized from relationships between optical and environmental data derived from in situ measurements. However, freshwater cHABs often exhibit unique optical properties, owing in part to enhanced backscatter properties of gas vacuoles within the cells (Matthews and Bernard, 2013) and from amorphous colony structures that aggregate into floating mats (Paerl and Ustach, 1982; Hu et al., 2010; Kudela et al., 2015).
The basic knowledge of the inherent optical properties (IOPs)—the spectral absorption and scattering components—for natural cHAB populations is not well known, despite dedicated cyanobacteria-specific bio-optical algorithms (Kutser, 2004; Simis et al., 2005; Hunter et al., 2008; Randolph et al., 2008; Ruiz-Verdú et al., 2008; Wynne et al., 2010; Matthews et al., 2012; Kudela et al., 2015). While these algorithms were developed from field data collected during cHAB events, measurements were limited in scope in regards to optical properties. Several studies have partial IOP data measurements (Ma et al., 2007, 2009; Campbell et al., 2011; Zhang et al., 2012; Matthews and Bernard, 2013; Li et al., 2015; Soja-Woźniak et al., 2017), but not complete IOP data sets needed to fully understand the light interactions. Radiative transfer models have filled in some of this gap (Metsamaa et al., 2006; Matthews and Bernard, 2013; Robertson Lain et al., 2014), but these studies were based on single cells and did not account for colonial assemblages. The paucity of IOP measurements of cHABs limits the wider use of current bio-optical algorithms with analytical approaches, and there is an overall pressing need to fill in this knowledge gap if remote sensing is going to be used toward developing a deeper understanding of cHAB ecology.
Given that many global cHAB events are dominated by the gas vacuolate genus Microcystis, knowledge of the properties for a given system can have broad application to many other lakes. Lake Erie is a system that has undergone major ecological changes over the last 50 years, with a return of Microcystis cyanobacteria blooms that now occur every summer. Lake Erie is a complex system subject to nutrient enrichment from runoff, intense cyanobacteria blooms, and sediment resuspension events, and covers a large optical and environmental gradient. These phenomena occur across small distances and short time spans, making it an interesting system to study. There are a few published studies that focus on the in-water optical properties of Lake Erie, but are not specific to cHABs. Binding et al. (2008) reported on absorption properties, but non-specific to blooms. O'Donnell et al. (2010) reported on optical properties of the western basin during September 2007, and was not specific to bloom characteristics. Binding et al. (2012) assembled an in situ data set of absorption measurements from all basins of Lake Erie for algorithm retrieval of biomass and sediment loading, non-specific to summer cHABs.
To further understand the optical properties of cHABs in regards to remote sensing and ecological applications, we collected a comprehensive set of inherent and apparent optical properties during cyanobacteria blooms in western Lake Erie in the summers of 2013 and 2014. We measured absorption and scattering properties in and out of bloom areas, providing an interesting contrast of optical conditions from which to establish some baseline characteristics for cyanobacteria blooms. The main questions we sought to address are: (1) What are the inherent optical properties of cyanobacteria blooms? (2) How do they vary across the different regions in Lake Erie? (3) How do they compare to properties of populations of plankton communities in other systems around the globe? (4) What are the specific challenges for bio-optical algorithm development for cHABs?
2. Methodology
2.1. Study Site
The focus area of our study was the western basin of Lake Erie (Figure 1). Lake Erie is the smallest of the Great Lakes in North America, and the western basin is the shallowest region with an average depth of 7.4 m (Millie et al., 2009). The shallowness of the basin and sediment composition—characterized as mostly fine-grain muds and silts (Lick et al., 1994; Haltuch et al., 2000; Dusini, 2005)—makes it prone to sediment resuspension (Binding et al., 2007, 2010). The basin also receives river discharge from the Maumee, Raisin and Detroit Rivers. The Maumee River has the largest drainage basin of any river entering Lake Erie, and is dominated by agricultural land cover (Chaffin et al., 2011; Han et al., 2011). The Detroit River discharges nearly 90% of the inflow into the basin, yet the Maumee River supplies nearly half the river-born nutrient load (IJC, 2014). The Detroit River is actually a connecting channel between Lake Huron and Lake Erie, and not a river in the classic sense, but has a watershed consisting of U.S. and Canadian lands comprising mainly industrial/urban and suburban land cover, along with a smaller portion of woodland and grassland cover (MDEQ, 2008). The water surface is divided by the international boundary, and is designated as an international water body. The U.S. Environmental Protection Agency also views the Detroit River as a Great Lakes subsystem owing to its unique hydrography and ecology (Manny et al., 1988).
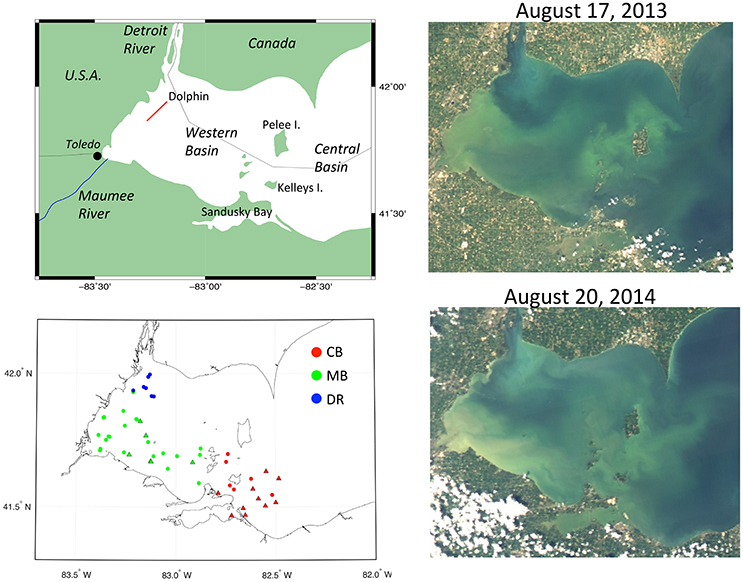
Figure 1. Maps of western Lake Erie with station locations and satellite images. (Top left) Map with labels and Dolphin transect (red line); (Bottom left) station locations from mid-August 2013 and 2014 field measurements coded by hydrographic region (green, Maumee Bay waters; blue, Detroit River waters; red, Central Basin waters) and source (circles, UNH; triangles, NRL); (Top right) MODIS-Aqua true color image from August 17, 2013; (Bottom right) MODIS-Aqua true color image from August 20, 2014 (source: Optical Oceanography Laboratory, University of South Florida).
Since the mid 1990s, cyanobacteria blooms have re-occurred annually after a period of general algal decline starting in the mid 1970s as a response to water management mitigation efforts (Conroy et al., 2005; Kane et al., 2014; Watson et al., 2016). This fundamental shift in the plankton community to cyanobacteria has been linked to several causes, fueled by increased nutrient enrichment from changes in land use practices, introduction of dressinid mussels and changing weather patterns (Paerl, 2009; Paerl et al., 2011; Michalak et al., 2013). The last 10 years has seen a general increase in cHAB intensity (Stumpf et al., 2012), and include a bloom event that triggered the closure of public tap water in the city of Toledo for several days in 2014 as a result of cyanobacteria toxins (Wynne and Stumpf, 2015). The western basin summer blooms have been dominated by Microcystis, while the blooms in Sandusky Bay in the central basin have been dominated by Planktothrix. The two basins can exchange waters depending on local circulation, but the mean flow is from west to east.
2.2. Field Sampling and Measurements
Measurements were collected during peaks in cyanobacteria blooms in mid-August of 2013 (N = 16) and 2014 (N = 20), shown in Figure 1. Additional field samples (N = 14) were obtained from station measurements made by Naval Research Laboratory (NRL, Stennis Space Center, MS) in the central and western basin of Lake Erie during the same time period as our sampling in August 2014. Across both years and data sources, 50 stations were sampled. In both years, the cyanobacteria blooms extended from the southwest corner of the western basin eastward toward the islands. A notable difference between the years was the southern extent of the Detroit River, which was more prominent to the south in 2014 (Figure 1). Geographically, our samples were collected in two different basins—the western basin and central basin (CB), which are separated by several islands, with Pelee Island as the largest. Sample locations in the CB were concentrated to the southeast of Kelleys Island (Figure 1). In the western basin, two distinct domains can be further identified based on hydrographic and optical properties—the Detroit River (DR) in the northwest corner, and waters spanning from Maumee Bay in the southwest corner eastward to the islands which we are collectively calling the Maumee Bay waters (MB). We use these geographic designations in presenting and discussing results to aid in interpretation.
Measurements of environmental and optical properties were made with a variety of state-of-the-art instrumentation systems. Standard station measurements included above-water radiometry, discrete water samples, and vertical profiles of IOP and hydrographic parameters. Phytoplankton cell counts were performed for 2013 and 2014 station data using standard microscopic and digital holographic techniques. An instrument package equipped with IOP sensors known as the Dolphin (Miller et al., 2003) was towed across a transition region separating the Detroit River plume and Maumee Bay waters in August 2013.
2.2.1. Vertical Profiling of IOPs
The vertical profiling system included a WET Labs (Philomath, OR) ac-9 measuring absorption and attenuation at 9 wavelengths: 412, 440, 488, 510, 532, 555, 650, 676, and 715 nm, backscattering meters (WET Labs ECO-VSF, ECO-BB3, and ECO-BB9 sensors), fluorometric chlorophyll a, phycocyanin, and CDOM (WET Labs ECO-FL3), a custom 17-angle volume scattering function device called MASCOT (Multi-Angle Scattering Optical Tool), and a SeaBird (Bellevue, WA) SBE49 CTD. The ac-9 was calibrated with Milli-Q ultrapure water, and absorption a(λ) was corrected for scattering effects using the proportional method of Zaneveld et al. (1994). Data were corrected for temperature and salinity effects using the coefficients of Twardowski et al. (1999) using the CTD data. Particulate scattering bp(λ) was derived from the ac-9 as the difference between attenuation c(λ) and absorption a(λ). Both bp(λ) and c(λ) do not include scattered light from 0 to 0.9° due to the acceptance angle of the c(λ) measurement. The ECO-BB9 wavelengths were 403, 443, 487, 506, 525, 594, 657, 680, and 720 nm. Data were linearly interpolated to match the wavelengths of the ac-9. Volume scattering function data measured with ECO sensors were converted to backscattering coefficients following the protocol in Sullivan et al. (2013). MASCOT resolves scattering at 658 nm, at angles from 10 to 170° in 10° increments, at a sampling rate of 20 Hz (Twardowski et al., 2012). All data were averaged into 1 m depth bins.
2.2.2. Towed Package Measuring IOPs
A ship-towed instrument package called the “Dolphin” (Miller et al., 2003) was deployed in surface waters in August 2013 along a transect in the northwest corner (shown in Figure 1). The transect started in the Detroit River and continued southwest for 13 km, crossing the transition zone between the plume front and waters from the Maumee Bay. The Dolphin was equipped with an ac-9, ECO-BB and ECO-FL3 sensors, and a SBE49 CTD. Although the Dolphin can be towed behind a ship undulating with depth, our deployment was different as we wanted to sample surface properties. For our deployment, a boom held the Dolphin 1 meter off the mid-stern of the ship and at a constant depth near the surface (≈ 0.5–1 m depth). The ships speed was reduced to 5 knots to limit cavitation and bubble interference with the optical instruments.
2.2.3. Phytoplankton Imaging, Identifications and Cell Counts
Phytoplankton populations were identified and counted using traditional microscopy methods and an in situ holographic microscope system (Twardowski et al., 2016; Zamankhan et al., 2016; Nayak et al., 2017). The in situ digital holographic camera system (HOLOCAM) uses in-line holographic illumination techniques (e.g., Katz and Sheng, 2010) to create images that can be further used with pattern recognition software to identify and quantify the size properties of phytoplankton/particles within a size range of ~1 μm to ~10 mm. Phytoplankton identification results for 2014 utilized this processing system. For the 2013 station data, phytoplankton identifications and cell counts were conducted through analysis of discrete samples using standard light microscopy. Whole water samples for phytoplankton cell counts were preserved with 1% Lugol's solution. These samples were settled in an Utermöhl chamber and counted on an inverted microscope at 500X (Hasle, 1978).
2.2.4. Remote Sensing Reflectance Measurements
Above-surface radiance measurements were taken with the Field Spec Pro VNIR-NIR1 portable spectrometer system from Analytical Spectral Devices (Boulder, Colorado). A sequence of gray plaque, water surface and diffuse sky measurements were made with an 8° foreoptic focused at a 40–45° angle downward toward the water and 135° away from the sun. A gray plaque (Lg) reading was taken of a Kodak gray card held parallel to the water surface, then removed and immediately followed by a water surface measurement (Lt) at the same position. The foreoptic was then pointed upward at a 40–45° angle to measure the diffuse sky radiance (Lsky). The Lg measurement was used to estimate spectral downwelling irradiance (Ed), assuming that the gray plaque is a lambertian diffuser:
The Rg derivation from Lg was based on the spectral reflectivity of the gray plaque (nomimal 10% reflection). The Lt and Lsky measurements were used to derive an estimate of spectral water-leaving radiance Lw:
The reflectance, ρ, represents the proportion of incident light, which is reflected by a flat water surface at the angle of observation, as determined by Fresnel's Equation (Kirk, 1994). The Fresnel reflectance for a 40–45° angle of observation used was 0.028 (Austin, 1972), and applicable for wind speeds < 5 m/s (Mobley, 1999). Above surface spectral remote sensing reflectance (Rrs(0, λ)) was calculated as the ratio of Lw(λ) to Ed(λ).
2.2.5. Discrete Measurements
Whole water samples were taken from the surface (0–1 m depth) on station and stored in the dark on ice for up to 4 h. Whole water was kept for microscopic counts (2013 only). Water samples for chlorophyll a concentration (Chl-a), phycocyanin concentration (PC), particulate absorption (PA), and suspend particulate matter (SPM) were filtered (either 50 and 100 mL) onto Whatman glass fiber or polycarbonate filters the same day and stored. Filters for Chl-a, PC and PA were stored in liquid nitrogen until analysis, and SPM filters were stored in a desiccator.
Spectral CDOM, phytoplankton and total particulate absorption were measured spectrophotometrically. Absorption of the CDOM filtrate was measured in a 10 cm cuvette following NASAs Ocean Optics Protocols (Mitchell et al., 2003). For particulate and phytoplankton absorption, the optical density of the filter was measured with a spectrophotometer using an integrating sphere (see below) before (total particulate absorption) and after exposure to sodium hypochlorite (non-algal absorption). While methanol is used on marine systems, sodium hyperchlorite is recommended for freshwater (Binding et al., 2008). The difference of these measurements is the contribution due to phytoplankton. We followed the transmission-reflectance (T-R) method developed by Tassan and Ferrari (1995) that utilizes an integrating sphere to correct measurements for the contribution of scattering. Filters were placed on a quartz slide at the entrance (transmittance) and exit (reflectance) of the sphere and scanned at a speed of 120 nm/min with a slit width of 2 nm. The instrument was zeroed using a blank filter prepared by filtering 5–10 ml of filtrate. Absorption was calculated following Lohrenz (2000).
Processing of Chl-a samples differed slightly by year. For 2013 samples, filters were extracted with N, N-dimethylformamide (Speziale et al., 1984) and for 2014 samples, Chl-a was extracted 90% acetone as per NASA protocols (Trees et al., 2003). All extracts were analyzed on a Turner Designs fluorometer calibrated with Chl-a standards. Filters for phycocyanin determination were extracted in phosphate buffer (Ricca Chemical, pH 6.8) using two freeze-thaw cycles, followed by sonication (Horváth et al., 2013). Relative fluorescence was measured on a Turner Aquafluor fluorometer and converted to PC using a series of dilutions of a commercial standard (Sigma-Aldrich). Total SPM was determined gravimetrically in triplicate after filtering sample water through a pre-dried, pre-weighed polycarbonate filters for 2013 samples, and Whatman GFC 47-mm filters for 2014 samples. For 2014 samples, the filters were then combusted for 4 h at 450°C, cooled, and reweighed to measure volatile (organic) suspended solids (APHA, 1998). The discrete data (Chl-a and absorption) for both years can be accessed at: https://seabass.gsfc.nasa.gov/archive/URI/Mouw/NIH-NSF_Lake_Erie/ (Mouw et al., 2013b, 2014).
2.3. NRL Field Data
Optical and environmental data were also collected by NRL in the central and western basins of Lake Erie between August 18 and August 28, 2014. NRL measurements including profiles with a WET Labs ac-9, surface sample pigment data derived from high pressure liquid chromatography, and above-water radiometer measurements with an ASD radiometer. We include data from 14 stations from this collection within the study region (N = 10 from CB and N = 4 from MB). The combined data set totaled 50 stations with AOP measurements, including 47 with surface Chl-a measurements, 30 stations with IOP profiles, 30 stations with surface SPM measurements and 30 stations with surface absorption measurements.
2.4. NOMAD Data Set
We compared IOP data from Lake Erie to global ocean averages based on the NASA bio-Optical Marine Algorithm Dataset (NOMAD) (Werdell and Bailey, 2005). This data set comprises global ocean optical measurements available to the community for algorithm development and evaluation. A subset (N = 696) of NOMAD contains spatially coincident measurements of spectral absorption components for CDOM, non-algal particulates, and phytoplankton. We used this subset to derive average values for the oceans. These data were obtained from NASA's SeaWiFS Bio-optical Archive and Storage System (SeaBASS) (Werdell and Bailey, 2002).
3. Results and Discussion
3.1. Biomass and Plankton Distributions
We observed large variations in environmental, phytoplankton and optical properties across western Lake Erie in both years, with Chl-a ranging from 1 to over 135 μg/L, PC ranging from 0.01 to over 100 μg/L, and SPM ranging from 1.8 to over 57 g/L. The correlation between Chl-a and PC was high (R = 0.90 over the whole data set), with stations in the DR showing undetectable levels of PC (Figure 2). Strong correlations existed between SPM and Chl-a as well, with R = 0.85 over the whole data set (Figure 2). Overall, the MB had higher mean SPM and Chl-a and a wider range, compared to the CB and DR (Table 1). The number of stations assigned to each region was uneven: N = 27 (MB); N = 14 (CB); N = 7 (DR). Not all stations had the same measurements due to a number of causes, including instrument issues and sensor saturation. There was a much weaker connection between SPM and Chl-a in the DR, which had the lowest Chl-a of the regions. Mean values of absorption and scattering optical properties were higher in the MB compared to the other regions. Of the three regions, the DR had the lowest mean and variation in Chl-a, SPM, absorption and scattering measurements. Strong environmental gradients over short distances were present between the MB and DR, which will be further explored in section 3.4.
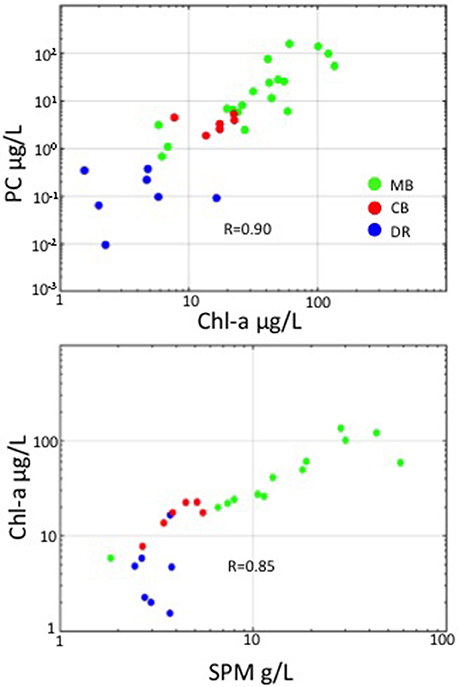
Figure 2. In-water relationships among Chl-a, PC, and SPM. Top: PC versus Chl-a (on log scales); Bottom: Chl-a versus SPM (on log-scale). Points are color-coded by region.
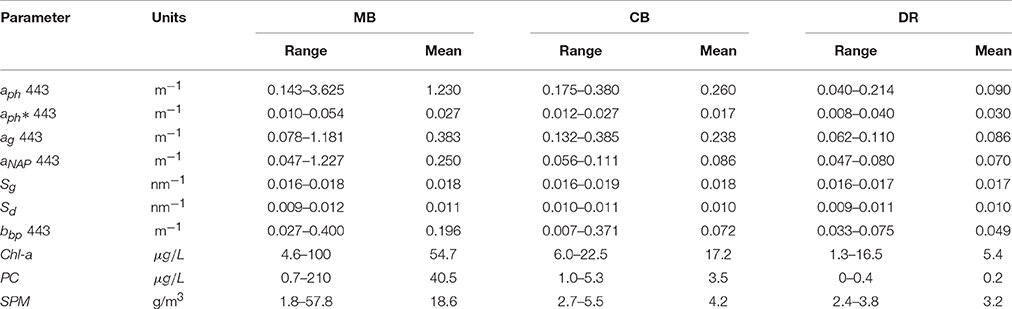
Table 1. Water parameters for three regions in the western basin.
The broad phytoplankton community was dominated by cyanobacteria in both years across the basin except in the Detroit River plume. While mixtures of algal species were usually present at any given station, Microcystis was dominant in the MB with globular colony structure. Microscopic cell counts and identification revealed multiple Microcystis species co-occurring throughout the MB, although it is common to combine and list different Microcystis species as Microcystis aeruginosa (Otsuka et al., 2001; Fahnenstiel et al., 2008). Other prevalent Microcystis species identified from the 2013 data included M. smithii and M. wesenbergii and to lesser extents M. botrys and M. flos-aquae. In contrast, stations in the CB were dominated almost completely by green-pigmented Planktothrix agardhii, likely originating from nearby Sandusky Bay (Davis et al., 2015) with long strand-like shapes. Samples from the DR contained low amounts of cyanobacteria (Planktothrix or Oscilliatoria), likely transported in the river from Lake St. Clair upstream (Manny et al., 1988), with small flagellates relatively dominant. Samples taken near the transition between the MB and the CB in the island region contained both Microcystis and Planktothrix.
Differential particle size distributions (PSDs) were derived from data collected by the holographic system, and three examples are shown for surface waters matching the imagery in Figure 3. The slopes for the PSDs were calculated over the size range 50–150 μm where the log size distribution was linear. Averages for the regions were −3.6 for the DR, and −2.3 for both the CB and the MB. Steeper slope values are typical for nonliving particle fields with conserved volume at all size ranges (Twardowski et al., 2001; Sullivan et al., 2005), reasonable for the DR. In contrast, the flatter mean slope values for the CB and MB indicate a greater amount of large particles, identified as cyanobacteria colonies at various sizes and morphologies. In the CB, the colonies comprised the strand-like Planktothrix, whereas in the MB the colonies comprised amorphous Microcystis aggregates. A curious feature in the size distribution for stations in the MB is seen as a pronounced hump (positive deviation) between 200 and 1,000 μm. The bump feature after 200 μm was present at other MB stations and absent at DR and CB stations, appearing to be a feature in the PSD that corresponds to Microcystis colonies. This feature is interesting because it corresponds with the size range where colonies can enhance vertical migration capacity. Visser et al. (1997) modeled the impact of Microcystis colony size on vertical migration, and determined that maximal migration depth ranges (i.e., the range of migration) were achieved at sizes around 200 μm. Size and toxin production have also been linked, shown to be enhanced with increasing colony size (Harke et al., 2016).
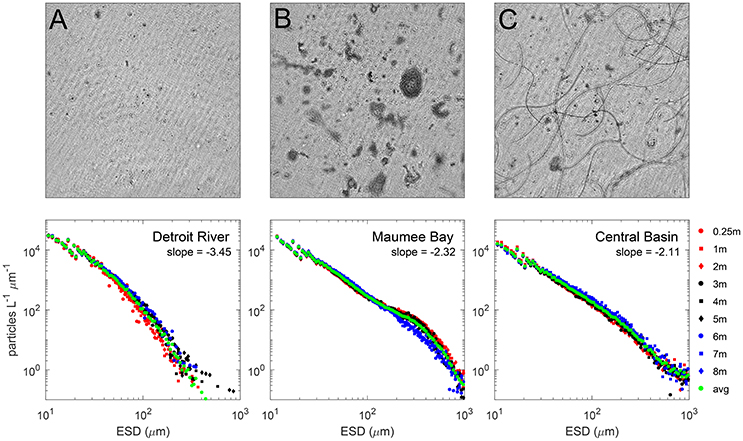
Figure 3. Top row: Holographic composite images of the in situ phytoplankton populations in the Detroit River (A), Maumee Bay waters (B) and southeast of Kelleys Island in the Central Basin (C) during 2014. The composite images are 2-D representations of all particles/phytoplankton in the 3-D holographic image volume. Each image is 7 × 7 mm through a depth of 40 mm (volume ~ 2 mL). Images were constructed with the background average subtracted to enhance particle clarity. The Detroit River waters were dominated by small inorganic particles and flagellates. The Maumee Bay waters were dominated by globular Microcystis colonies and the waters around the Islands were dominated by hair-like Planktothrix cells. Bottom row: Particle size distributions averaged for surface waters for each image. Slopes describing the Junge distribution are higher for the DR, and lower (and equivalent) in the CB and MB.
The holographic profile data showed that cyanobacteria colonies were distributed throughout the vertical water column in the CB and MB. The PSD binned at different depths in Figure 3 shows an absence of the hump for larger particles at the bottom depth, but present at depths for mid and surface waters. We visually observed Microcystis colonies in surface waters at stations in the MB, and noted accumulation at the surface over short periods of time (an hour or less) when winds were low at several stations, although we did not observe any thick scums. The arrangement of layered aggregated Microcystis cells into colonies changes their overall optical properties through package effects on absorption (Kirk, 1994) and enhancing scattering from increased cellular vacuole content (Matthews and Bernard, 2013) if the colonies are surfacing through increased buoyancy (Visser et al., 1997). Nevertheless, the similarities of the Junge slope for the MB and CB indicate that globular and strand-like cyanobacteria colonies have similar size distribution characteristics for particles <200 μm, despite morphological differences. A main difference was the absence of the hump in PSDs at or >200 μm for CB stations.
3.2. IOPs of Western Lake Erie during Cyanobacteria Blooms
3.2.1. Absorption
Spectral absorption properties varied among and across the three region in our data set, driven by different components—phytoplankton (aph), CDOM (aCDOM), and detritus/minerogenic particles (aNAP). Most of the absorption variability (at 443 nm) is driven by phytoplankton from 20 to over 90% (Figure 4), followed by CDOM (from <10–50%), with the MB exhibiting the widest range. The CB and DR stations are clustered together near the midpoint showing equivalent absorption contributions from the three main sources. The CB stations have contributions from aph that range from 35 to 60%, while contributions from aCDOM range from 30 to 55%. Stations from the DR have the highest degree of aNAP from 25 to 40% of total absorption. At high levels of biomass in the MB, absorption is almost entirely due to phytoplankton.
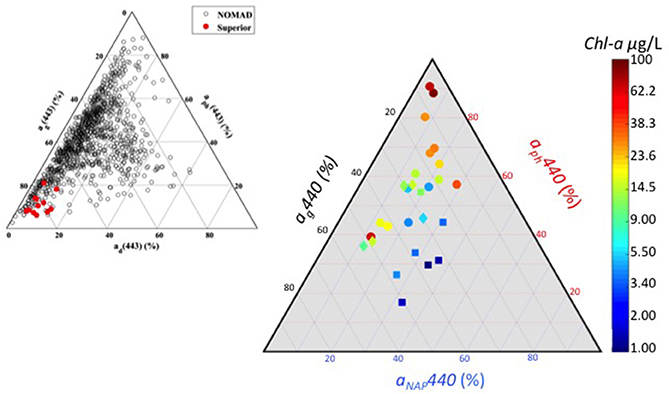
Figure 4. (Right) Ternary plot of absorption color-coded by chlorophyll-a concentration. Symbols indicate region: square Detroit River plume (DR); diamond central basin (CB); circle Maumee Bay waters (MB). (Left) Ternary plot from Mouw et al. (2013a) (their Figure 3) showing absorption properties for Lake Superior (red) and the global oceans from NOMAD (black). Figure inset is being reproduced with permission from the copyright holder.
Our determination of the relative absorption budget for Lake Erie differs significantly compared to similarly depicted data from Lake Superior (Mouw et al., 2013a) and the global oceans (Figure 4 inset). Lake Superior is a system dominated by CDOM absorption with minimal phytoplankton and non-algal particle absorption, and occupies a region in the ternary plot that has no overlap with the Erie data. Although the data spread for the oceans has some overlap with Erie, much of the data is in a region between 20 and 80% CDOM and phytoplankton absorption, and under 20% non-algal particle absorption. The Erie data are shifted toward higher phytoplankton and non-algal particle absorption and away from CDOM absorption. Knowing the relative contribution to absorption provides insight into the retrieval accuracy of individual components from bio-optical algorithms. Mouw et al. (2013a) showed that the accuracy of total absorption was good from algorithm inversions for Lake Superior, while the CDOM absorption component fared better than the phytoplankton absorption component. Given Lake Superior is a CDOM-dominated system with a very small contribution from phytoplankton to the overall absorption budget, the retrieval of chlorophyll concentration via inversion algorithms was not possible due to errors in derived CDOM absorption being greater than phytoplankton absorption values. While the performance of similar algorithms have not been evaluated in Lake Erie, it is a system weighted toward phytoplankton absorption during cyanobacteria blooms.
In the MB, our measurements of aph varied over an order of magnitude, with smaller ranges in the DR and CB (Figure 5A). These values are comparable to observations of Microcystis-dominated cyanobacteria communities from Lake Taihu (Zhang et al., 2012). Compared to the mean value for the global oceans from NOMAD, overall spectral phytoplankton absorption is higher in the MB and CB, while measurements from DR are the lowest regional values and below the NOMAD mean. We observed a positive correlation between aph at 443 nm and Chl-a across all sites (R = 0.79), and a slightly lower correlation between aph at 620 nm and PC (R = 0.75). The 620 nm channel is of interest to bio-optical algorithms for detecting cyanobacteria because it is an absorption peak for phycocyanin. Specific phytoplankton absorption () was derived by normalizing phytoplankton absorption by Chl-a, highlighting absorption shape and revealing aspects of cell physiology at the community level. At 443 nm, varied over a very large range in our data set, from 0.008 to 0.050 m2mg−1, within the range of reported marine field values (Bricaud et al., 1995). While our measurements are lower than those reported by Binding et al. (2008) for Lake Erie, they are comparable to those reported for Green Bay by O'Donnell et al. (2013). Mean at 443 nm from NOMAD is 0.054 m2mg−1, compared to 0.031 m2mg−1 from this data set. Almost all of the Lake Erie spectra are in fact below the NOMAD mean (Figure 5B).
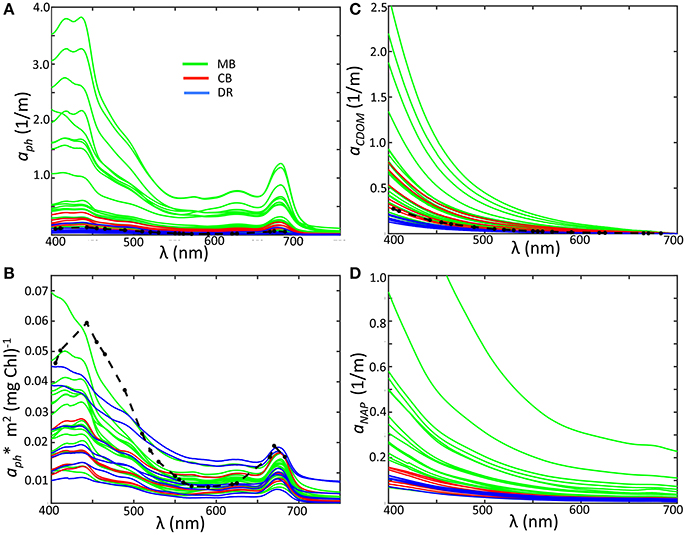
Figure 5. (A) Phytoplankton absorption by region; (B) specific phytoplankton absorption; (C) Absorption of CDOM; (D) Absorption of non-algal particles. Colors indicate sub-region classification: Maumee Bay region, green; Central Basin region, red; Detroit River plume, blue. Ocean averages from the NOMAD data set are plotted as black dashed lines for aph, aCDOM, and aph*.
One effect of high concentrations of Chl-a on the specific phytoplankton absorption is a lowering or flattening of absorption peaks at 443 and 664 nm relative to other wavelengths and lower overall , otherwise known as the “package effect” (Bricaud et al., 1995). Our measurements are reflective of this, with high Chl-a stations in the MB exhibit low , but all regions contained spectra at the low end despite differences in Chl-a (Figure 5B). In fact, based on the global assessment of in Nardelli and Twardowski (2016), spectra were lower than the global mean in all three regions. A closer look shows limited regional clustering of spectra, with CB stations exhibiting a reduced range relative to the other two regions. The coefficients for the DR and the MB also occupied the same range despite very different Chl-a and phytoplankton structure. Shapes of spectra from Microcystis-dominated communities in the MB and Planktothrix-dominated communities from the CB were similar, not unexpected due to their similar pigment sets. Both groups contain phycobilliproteins as well as carotenoids with similar absorption characteristics (Paerl and Ustach, 1982; Sommaruga et al., 2009; Dokuli and Teubner, 2012). The values reported values by Matthews and Bernard (2013) and Zhang et al. (2012) for single cell models and cultures of Microcystis, respectively, are higher than most of our observations from the MB, further indicating some degree of pigment packaging for these cyanobacteria populations. Pigment packaging is dependent on the intracellular structural organization of pigment molecules, along with pigment concentrations. Ibelings et al. (1994) showed Chl-a in Microcystis is more stable and did not vary as much as other pigments in response to changing light levels. If this laboratory behavior holds for the natural populations in Lake Erie, then the variations in as normalized to Chl-a in our observations of the MB are likely a result of the dense colony formations with amorphous structures observed in these regions, which naturally impart self-shading and play an important role in determining overall absorption properties.
Our measurements of aCDOM and aNAP followed the typical exponential or decay with wavelength (Figures 5C,D), and also fit well with a power law. Despite having a high relative contribution to the overall absorption budget from CDOM, the DR stations had the lowest values for aCDOM and aNAP. The MB showed the greatest range for both properties, while aCDOM coefficients for CB stations were high and aNAP coefficients tended toward the lower end. Given the Maumee River is a primary allochthonous source for CDOM, the very large range for in aCDOM for MB is likely a strong indication of local enhancement from autochthonous production. For the whole data set, aCDOM at 443 nm ranged from 0.062 to 1.18 m−1 across the basin and showed a positive correlation with Chl-a. Values are in the range reported by Binding et al. (2008), although they did not find any relationship between CDOM and Chl-a. The exponential slopes for CDOM absorption (SCDOM) and non-algal particles (SNAP) were determined by nonlinear fits over the wavelength range from 400 to 500 nm (Twardowski et al., 2004), and varied from 0.016 to 0.019 with an average of 0.018 (Table 1). There was a weak regional dependency for SCDOM, with the DR mean (0.017), slightly lower than either the MB or CB (0.018 for both). The values for SNAP ranged from 0.009 to 0.013, with an overall mean of 0.011. The mean slopes for the regions also showed weaker variation, with the MB having the highest mean (0.011) compared to the DR or the CB (both at 0.010). Overall, our aNAP and aCDOM coefficients and corresponding slope values are similar to those reported by Binding et al. (2008) and O'Donnell et al. (2010) for western Lake Erie.
3.2.2. Particle Scattering and Backscattering
We screened 34 out of 50 vertical profiles for scattering and backscattering measurements after quality control (limited by instrument problems and detector saturation that occurred at different stations). Spectral bp varied spatially, with bp(443) ranging from 0.46 to 21.74 m−1 with weak spectral dependence, slightly decreasing toward higher wavelengths (Figure 6A). We have chosen to list values at 443 nm where we had the greatest number of returned values. We note that spectral profiles showed some depressions at this wavelength as a result of chlorophyll-a absorption, affecting some stations with high scattering from the MB. Mean bp(443) for the MB was 5.18 m−1, while the mean for the CB was 2.37 m−1. Cyanobacteria bloom patches in the MB and CB contained the highest bp values, while the lowest were observed in the DR for both years with a mean of 2.16 m−1. The range in bp(443) we observed was from about 1.5–10 m−1, and is greater than previously reported for western Lake Erie by O'Donnell et al. (2010) and comparable to coastal ocean regions. Babin et al. (2003) reported bp(443) ranging 0.05 to >20 m−1 for the Atlantic Ocean and coastal European waters, and Sullivan et al. (2005) reported bp(532) between 0.1 and 10 m−1 measured in a variety of U.S. coastal waters, falling in the observed range in this study. In contrast, reported open ocean values are an order of magnitude lower (Barnard et al., 1998).
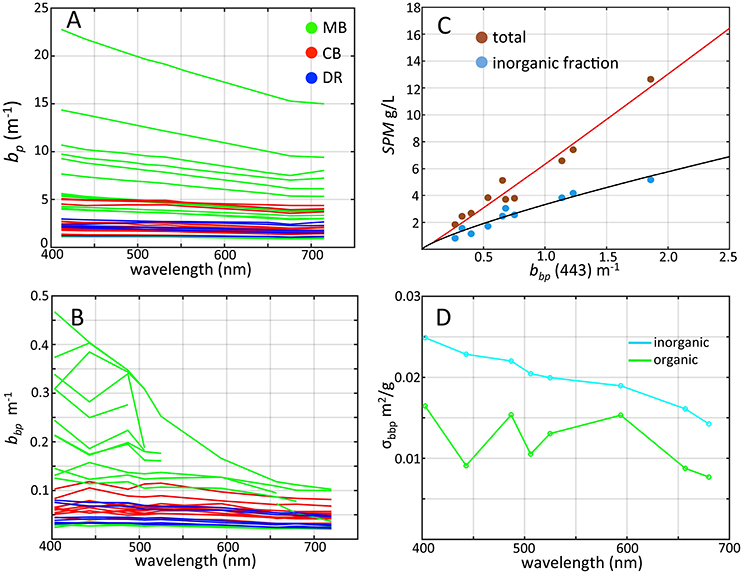
Figure 6. Scattering properties of western Lake Erie as determined from WET Labs bb9 measurements colored by region. (A) Spectral particle scattering bp colored by region; (B) Particle backscattering at 443 nm colored by region; (C) SPM vs. particle scattering ratio at 443 nm (log scale) with nonlinear fit; (D) Mass-specific backscatter cross-section (σbbp) for inorganic (light blue) and organic (green) particle components.
Coefficients for bbp were generally high from our data set, ranging from 0.07 to 0.25 m−1 at 443nm with a mean of 0.097 m−1 (Figure 6B). For stations with bbp(443) values below 0.10 m−1, spectral shape generally decreased slightly with increasing wavelength, with depressions at chlorophyll absorption peaks at 443 and 664 nm, and near 506 nm due to anomalous dispersion effects (Zaneveld and Kitchen, 1995). This latter feature is also consistent with the findings of Raps et al. (1983) which showed an increase in Microcystis absorption at 510 nm in high light environments. For measurements above 0.10 m−1, these spectral depressions in bbp were more pronounced. Mean bbp(443) in the MB was 0.20 m−1 with a maximum of 0.28 m−1, an order of magnitude higher than the DR and CB. These values are consistent with those reported by Effler et al. (2013) for western Lake Erie, and with other shallow estuarine systems (e.g., Lubac and Loisel, 2007; McKee et al., 2009; Doxaran et al., 2012). While our results are in the range of values for coastal oceans with high amounts of suspended sediments (e.g., McKee et al., 2009; Reynolds et al., 2016), the waters of our study area were mixed organic and inorganic particles. In further contrast, mean bbp(443) for ocean measurements from the NOMAD data set is 0.006 m−1, an order of magnitude or more lower than our results.
There was a strong correlation between bbp(443) and SPM across western Lake Erie (Figure 6C, R = 0.97). As in other systems (e.g., McKee et al., 2009; Reynolds et al., 2016), inorganic sediments present in the water samples play a major role in influencing bbp in western Lake Erie (Peng and Effler, 2010; O'Donnell et al., 2013). Based on our limited measurements from stations sampled in 2014, inorganic particles accounted for 20–82% of SPM by weight and varied by region. The DR had the highest inorganic particle composition (63–82%), comparable to values found in a shallow tidal estuary with strong resuspension (McKee et al., 2009). The CB ranged from 43 to 47% or inorganic fraction of SPM, and the MB—the shallowest region and subject to sediment resuspension—ranged from 20 to 58%. The dominant substrate type in the western basin is clay (Lick et al., 1994; Haltuch et al., 2000) with an estimated refractive index of 1.18 (Twardowski et al., 2001), and we assume that clay was the dominant inorganic particle type in surface waters sampled in the MB. Effler et al. (2013) reported that clay comprised 87% of the fraction of inorganic suspended sediments in western Lake Erie after a resuspension event and accounted for 78% of the particle backscattering signal in western Lake Erie. These measurements were based on data collected taken after a fall resuspension event (Peng and Effler, 2010). The high particle scattering and backscattering coefficients were observed in mixed proportions of inorganic/organic particles. Although inorganic particles are typically the dominant component of scattering and backscattering (Stavn and Richter, 2008; McKee et al., 2009; Peng and Effler, 2010), we suspect that the cyanobacteria were playing a strong role in influencing these properties during our sampling as our data indicate increases in bbp were accompanied by decreasing fractions of inorganic SPM (Figure 6C).
It is not possible to directly partition scattering into the contributions from organic and inorganic components with our data set. However, Snyder et al. (2008) and Stavn and Richter (2008) applied linear regression techniques to partition backscattering and scattering coefficients into organic and inorganic fractions from SPM in coastal waters, and were able to derive mass-specific cross-sections for different environments. We applied the Stavn and Richter (2008) Model II multivariate regression method to derive estimates for the fractional contribution of organic and inorganic components to backscatter using bbp, SPM organic and inorganic fractions (N = 10; 2014 data only). We note the organic component comprises a variety of material including all algae, microbes, detritus, and is not just cyanobacteria. The computed mass-specific backscattering cross-sections for organic and inorganic particles are shown in Figure 6D, ranging from 0.008 to 0.015 m2/g for organic particles and from 0.016 to 0.025 m2/g for inorganic particles declining with increasing wavelength, with inorganic values roughly twice as high (i.e., more efficient in backscattering on a particle basis) as the organic component. Both sets of values are higher than those reported in other studies by roughly a factor of 2 or less but within error-adjusted ranges. These properties are dependent on particle assemblage characteristics (e.g., size, chemical composition, index of refraction), and regional variation is expected. Reynolds et al. (2016) reported values of 0.007 and 0.014 m2/g at 550 nm for coastal Arctic waters (Reynolds et al., 2016). Coastal European waters were reported at 0.005 and 0.012 m2/g for organic and inorganic at 650 nm (Neukermans et al., 2016). Values reported by Snyder et al. (2008) varied by location at coastal sites around the U.S. within the ranges reported here and the aforementioned studies, and in some cases higher organic values compared to the inorganic component. The higher organic mass-specific backscatter values found here compared to other studies were expected given the high backscatter efficiency for vacuolate cyanobacteria which dominated the organic component from the MB and CB.
Fractionated contributions to backscatter were derived by multiplying the mass specific cross-section by the corresponding SPM fraction. Choosing values at 525 nm, the mean values for inorganic component contributions to backscattering were 61, 57, and 79% for the MB, CB and DR, respectively. The mean values for organic component contributions to backscattering were thus 39, 43, and 21 % for the MB, CB and DR, respectively. Although this analysis indicates that inorganic matter dominates particle backscatter, cyanobacteria make an almost equivalent contribution in the MB and CB regions. Intuitively, these values appear reasonable, as it would be expected that inorganic particles would dominate the DR where no cyanobacteria are present, and play an increasingly stronger role in the MB and CB regions proportional to abundance. These results are reinforced from analysis of the Dolphin transect (see section 3.4).
A fundamental optical property containing bio-optical/ecological information is the single scattering albedo, .
This property quantifies the probability of photon survival and is important for guiding remote sensing bi-directional assumptions (Morel and Gentili, 1993). High values indicate a more dominant role of photon scattering (survival), while low values indicate a stronger role of photon absorption. Figure 7A shows spectral for all the stations. While bp is spectrally flat except at high values where it decreases with wavelength, shows a broad increase from blue to red wavelengths, except for trough depressions at 443 and 676 nm due to phytoplankton absorption. The largest spectral variation occurs in the blue end of the spectrum decreasing toward the red. Overall, values across Lake Erie are similar to those reported by Babin et al. (2003) for coastal European waters containing sediments, and higher compared to their theoretical values for pure phytoplankton and the Baltic Sea, a system with strong absorption.
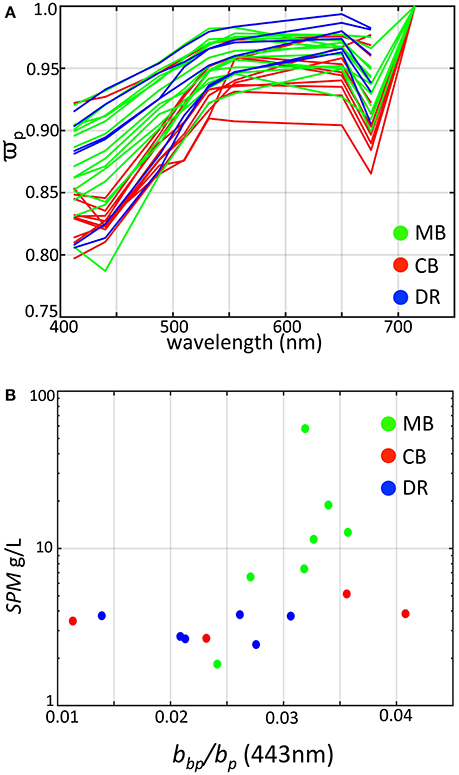
Figure 7. Derived scattering properties of western Lake Erie as determined from WET Labs bb9 measurements colored by region. (A) Single scatter albedo colored by region; (B) SPM vs. particle backscatter ratio at 443 nm.
The high of all measurements indicate a more dominant role for scattering relative to absorption with all values above 0.75 across the spectrum, including dense algal populations comprising cyanobacteria, yet the overall magnitude varies by region. The DR tended toward the high end of , except for two stations near the low end. The MB encompassed the full range from 0.8 to 0.95 at 443 nm, and station measurements were generally higher on average relative to the CB, which had toward the lower end except for one station. The lower in the Planktothrix-dominated CB occurred in waters with relatively higher absorption from CDOM, likely an influence from Sandusky Bay (O'Donnell et al., 2010).
The dimensionless is the ratio of particle backscattering to total scattering defined as:
This parameter is a function of particle size and index of refraction, and is an overall indicator of particle composition independent of particle concentration (Bricaud and Morel, 1986; Twardowski et al., 2001; Boss et al., 2004). Our derived values (at 443 nm) ranged from 0.01 to >0.04 (Figure 7B), consistent with previous measurements from western Lake Erie by O'Donnell et al. (2010, 2013) where reported values ranged between 0.02 and 0.04. In contrast, oceanic waters dominated by phytoplankton and covarying byproducts typically range from 0.005 to 0.01 (Twardowski et al., 2001; Boss et al., 2004; Sullivan et al., 2005), while coastal waters with suspended sediments typically do not exceed 0.025 (Twardowski et al., 2001; Boss et al., 2004; Sullivan et al., 2005; McKee et al., 2009; Doxaran et al., 2012). However, values up to 0.05 were observed by McKee and Cunningham (2005) in the Irish and Celtic Seas and values up to 0.036 were observed in the eastern English Channel and southern North Sea (Lubac and Loisel, 2007), in the same range as our measurements from the MB.
In our data set, the highest values were associated with stations where cyanobacteria were present. Zhou et al. (2012) reported a value of 0.009 from cultures of Microcystis aeruginosa, which is higher relative to other species but seemingly low compared to our results. From modeling experiments, Matthews and Bernard (2013) showed that backscatter efficiency factors for vacuolate cyanobacteria were high (= 0.0156) and were more than two times that of non-vacuolate cells. Our results for differ in key aspects from those reported in the previous study of O'Donnell et al. (2010). Our highest values for were found at sites when the organic fraction of SPM was highest (Figure 8), and generally increased with organic fraction, opposite of O'Donnell et al. (2010). However, their observations were taken in the fall immediately after a wind resuspension event when inorganic particles dominated the water column, and after the cyanobacteria bloom period. Our results for at sites where the inorganic fraction was dominant agree with the values reported in O'Donnell et al. (2010), which ranged from 0.0137 to 0.0375. To achieve higher backscatter ratios we found in a mixed assemblage of organic and inorganic particles (dominated by organics), the organic contribution to backscatter (mostly from vacuolate cyanobacteria) must be higher and above the values for the inorganic particles (i.e., >0.04). The culture and modeling studies of Zhou et al. (2012) and Matthews and Bernard (2013) showed Microcystis to have backscatter probabilities on the order of 1–2%. That is not high enough to explain our observations. Those studies however were conducted on single cells, not aggregated colonies. Our observations indicate that colonies and the impact of colony structure could be the cause of elevated backscatter and ensuing backscatter ratios. Further field and modeling studies are needed to examine the role of vacuolate cyanobacteria colony size on scattering properties.
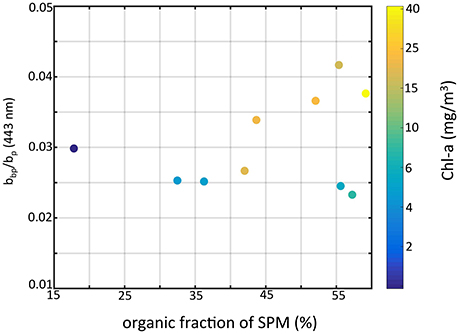
Figure 8. Particle backscattering ratio at 443 nm vs. the fraction of organic particles of SPM color-coded by chlorophyll-a concentration.
3.2.3. Volume Scattering Functions
Volume scattering function (VSF) shapes in the backward direction from western Lake Erie (Figure 9) were generally consistent with the shape Sullivan and Twardowski (2009) found for open ocean and coastal environments. This is remarkable given the presumed unique particle composition associated with dense blooms of cyanobacteria. We note that VSFs from some stations in the MB could not be included because of detector saturation. The only deviation in shape from Sullivan and Twardowski (2009) was at angles >150°, where the Lake Erie functions showed slightly elevated values. This may have an impact on current methods of processing remote sensing image data that are corrected using bidirectional reflectance distribution functions (BRDF). Since scattering angles defined by viewing angle and solar zenith geometries typically fall in the 120–150° range through a full satellite orbit (e.g., for SeaWiFS), the elevated region >150° is not considered problematic for BRDF corrections that reorient all remote sensing measurements to zenith sun, nadir viewing angles (e.g., Morel et al., 2002). Moreover, the close similarity to the Sullivan and Twardowski (2009) function indicates the Gleason et al. (2012) approach for BRDF correction should be viable in western Lake Erie. However, the assumptions on source particle contributions to the BRDF in these Case II waters may need re-visiting, as we are missing some critical information in the most turbid and eutrophic waters inside Maumee Bay.
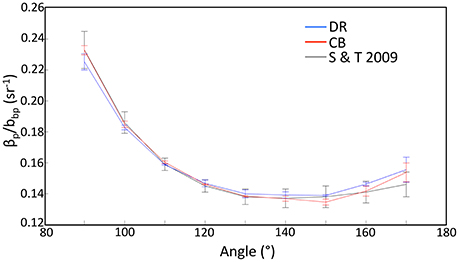
Figure 9. VSF functions from different regions.
3.3. Radiometric Distributions
Regional variations across the basin were observed for Rrs(λ) (Figure 10). The region with the widest range for Rrs(λ) was the MB. Both the MB and CB expressed spectra containing peaks at or near 550, 650, and 710 nm, and troughs at or near 490, 620, and 680 nm. In the DR, there is less spectral variability in Rrs(λ) and in contrast lower overall, with spectral shapes flat or convex from 400 to 550 nm, and no features past 700 nm. There is consistency in spectral shape magnitude in the regions, naturally reflective of the IOP distributions.
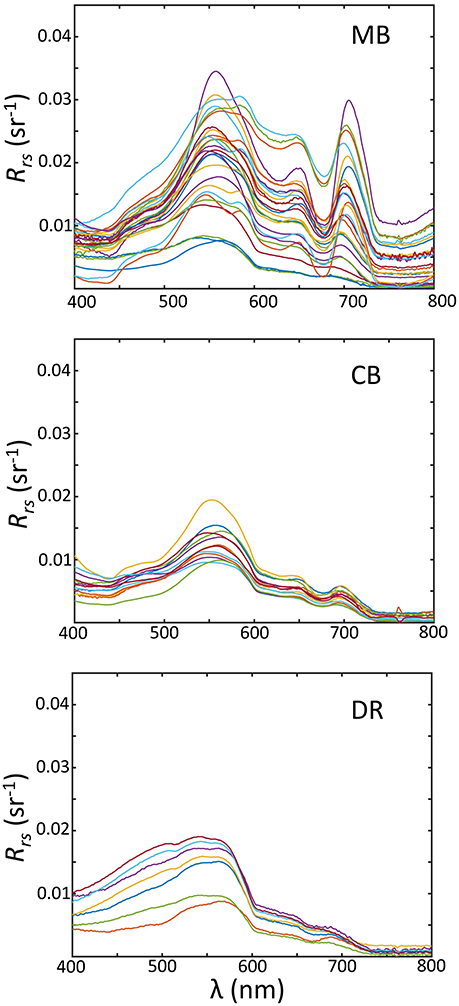
Figure 10. Above-water remote sensing reflectance measurements sorted by geographic/hydrographic regions; (Top) the Maumee Bay region (MB); (Middle) the Central Basin (CB); (Bottom) the Detroit River Plume (DR).
There are several distinguishing features in Rrs(λ) worth noting in regards to cyanobacteria. First, an enhanced U shape between 650 and 710 nm is present in many spectra from the MB and to a lesser degree the CB, a feature that is associated with cyanobacteria and is the basis for a cyanobacteria-specific algorithm (Wynne et al., 2010). Secondly, the peak at 710 nm anchoring this shape is prominent in many observations, and has been associated with high surface Chl-a (Zimba and Gitelson, 2006), which is enhanced for algal cells with gas vacuoles (Matthews et al., 2012; Matthews and Bernard, 2013). Thirdly, the Rrs(λ) is broadly elevated across spectra from the MB compared to the other regions, with another pronounced peak at 555 nm, resulting from higher particle concentrations, enhancing the backscatter coefficient proportional to the particle load.
The shapes and magnitudes of spectra from the DR show elevated blue and lower red reflectance in comparison, a result of a lower particle load and lack of cyanobacteria. The comparisons of spectra between the CB and MB are interesting, as cyanobacteria were abundant in both regions and dominated the phytoplankton communities. The lower spectra in the CB agrees with lower as discussed in section 3.2.2 and predicted by several radiative transfer approximations (e.g., Jerlov, 1976; Zaneveld, 1995). This optical difference between the CB and the MB may have ecological relevance and help explain the variation in cyanobacteria community composition. Planktothrix has shown a preference for low light conditions (Liere and Mur, 1979; Scheffer et al., 1997; Walsby et al., 2004), while Microcystis has shown an ability to adapt to high light (Raps et al., 1983; Paerl et al., 1985). Both cyanobacteria groups possess gas vacuoles internally in cells, and can regulate vertical position. If Planktothrix communities in the CB are maintaining deeper positions, then Rrs(λ) will be lower compared to a Microcystis community that prefers to remain closer to the surface. We believe this was occurring in Lake Erie, at least at the sites we sampled. This differentiation between the MB and CB cyanobacteria communities may be a function of ecological preference, which led to different optical properties in our observations. Further research—both field and laboratory based—is needed to understand the links between cyanobacteria species ecological preferences and optical signals.
3.4. Optical Features across the Detroit River Plume Transition
The optical differences between the Detroit River plume and the rest of the western basin were noteworthy due to the close proximity and high contrast. We were interested in the environmental gradients across the transition to further understand how cyanobacteria populations impacted the optical properties. This is an important region to the basin, as the Detroit River plume is the major source of water entering the western basin, mixing with waters connected to the Maumee Bay and possibly acting as a diluting or damping effect on blooms. However, Chaffin et al. (2011) observed higher algal productivity in the transition region between the Detroit River plume front and Maumee Bay compared to Maumee Bay samples, so the role of mixing processes and the impacts on environmental properties is not well known. The frontal feature separating the river plume water from western basin water is always present, but its position is variable and depends on climatic factors (winds, rainfall, runoff). Since the DR and MB waters have different particle fields, the transition of scattering properties between the DR and the MB can provide further insights into the role of sediments and cyanobacteria in influencing .
We captured the optical and environmental features across the transition from the Detroit River plume region to Maumee Bay waters by the Dolphin tow on August 22, 2013. The Dolphin transect started in the Detroit River and ended in the MB covering about 14 km (Figure 1). The average distance between observations is 5 m, providing fine spatial resolution of the surface properties along the track. Four optical properties observed from the Dolphin are presented in Figure 11 (due to instrument fouling issues, the first 3 km of data are omitted).
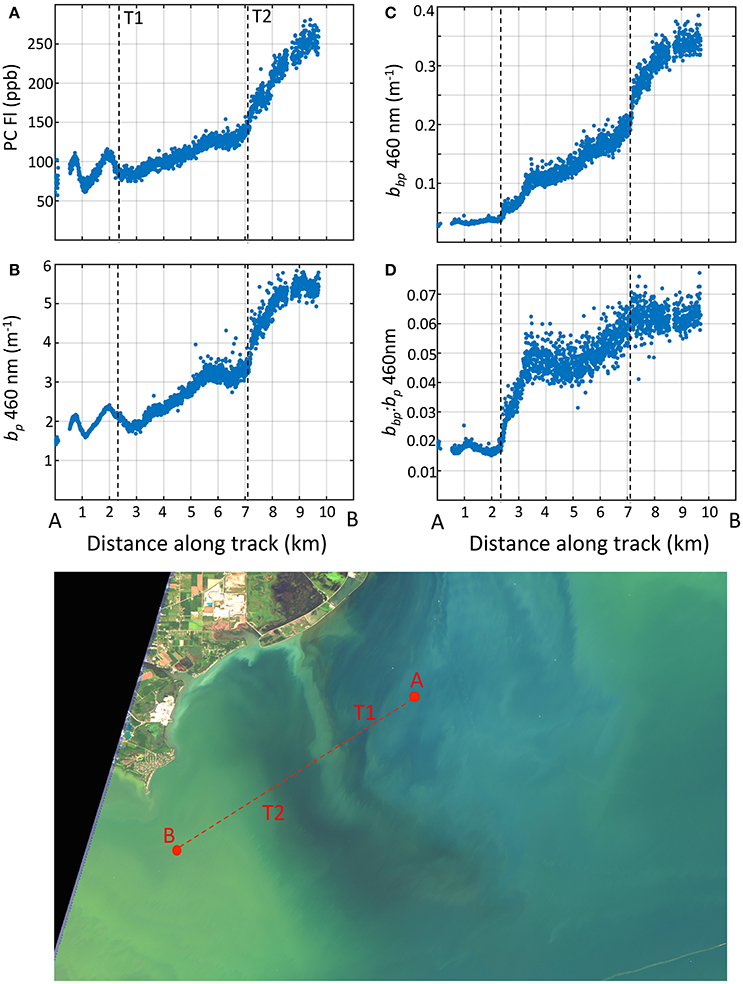
Figure 11. Water properties measured with the towed Dolphin system along a north to south transect crossing the Detroit River plume into the western basin. (A) phycocyanin fluorescence; (B) particle scattering at 460 nm; (C) particle backscattering at 460 nm; (D) backscattering ratio at 460 nm. Bottom image: Raleigh-corrected true color Landsat-8 image captured on Aug. 23, 2013, 1 day after the transect but revealing the general features.
Large optical gradients were observed across the frontal boundary, with contrast in plankton communities and particle fields in each region (DR and MB). The north-south patterns in Figure 11 reveal several transition points over the length of the transect. The first transition occurred at the 2 km mark ending around the 7 km mark. We believe this marks the primary transition from the DR to the waters of the MB. The patterns show an increase in PC and scattering properties across this frontal zone for PC, bp, bbp, and . These trends are consistent with the particle types from the two different waters. Cell counts showed that cyanobacteria were virtually non-existent in the DR plume, but were abundant in the MB south of the plume front. The increase in PC from north to south reflects the change from non-cyanobacteria to cyanobacteria-dominated waters. No cyanobacteria mats were present during the tow, but colonies were visually evident in the surface waters as the tow progressed into the MB. The increase in PC correlated with particle scattering and backscattering, consistent with enhanced scattering from Microcystis cells and colonies (Figure 11). The DR contained a high fraction of inorganic particles and high in the DR (around 0.02), consistent with MASCOT observations (section 3.2.2) and supported by Mie theory for inorganic particles (Twardowski et al., 2001; Peng and Effler, 2010). The rise in coincides with the rise in PC and increases in cell counts of Microcystis, rising to values above 0.04 between the 3 and 4 km mark.
A secondary transition appears between the 7 and 8 km mark, evident as a further increase in PC and scattering properties occurred as cyanobacteria populations became more concentrated in the surface waters further into the MB. We note that water temperature as measured by the Dolphin increased around this mark (not shown), as high sunlight and low wind conditions persisted promoting water conditions for surface cyanobacteria colony accumulation. The derived were the highest recorded anywhere in the basin (omitting stations with sensor saturation), although values >0.06 may be subject to noise and uncertainty considerations (McKee et al., 2009). As noted earlier, these values are higher than those reported for inorganic sediments by Effler et al. (2013). The transition of optical properties along the transect from low to high scatter and backscatter correlates with increasing PC (R = 0.93 for bbp at 530 nm), and lends evidence to support the view that Microcystis plays a leading contribution to particle backscattering. It also further suggests that Microcystis would have to have backscattering ratios above that of inorganic sediment particles to achieve the high values we observed. If this is true, then Microcystis colonies enhance backscatter properties above that of individual Microcystis cells as observed in cultures (Zhou et al., 2012).
4. Conclusions
The results from this study shed light on the inherent and apparent optical properties of natural assemblages of vacuolate cyanobacteria populations comprising Microcystis and Planktothrix during bloom conditions. Microcystis cells, individually small, aggregate into colonies which exhibit particular optical properties that likely differ from individual cells. A distinguishing characteristic is the enhanced backscatter probability, which from our results appears equivalent or higher than inorganic particles that typically dominate the forms of scattering over phytoplankton. This backscatter enhancement is accompanied by high absorption from the algal communities. These properties are attributable to colonial forms of the cyanobacteria, which had pronounced populations ranging from 200 to 1,000 μm in size for Microcystis-dominated communities.
Our results contrast with analyses on single cell scattering properties of Microcystis. Both Zhou et al. (2012) and Matthews and Bernard (2013) report backscatter ratios between 1 and 2%, which is not consistent with our in situ observations. However, our field measurements were taken in mixed assemblages of inorganic and organic particles, dominated by refractive clays and cyanobacteria colonies, respectively. We observed increases in the backscatter ratio with increasing biomass and organic fractions of SPM, in contrast to O'Donnell et al. (2010). To achieve the backscatter ratios for the mixed assemblages, the backscatter properties of the algal communities had to be higher than the laboratory/modeled coefficients for single cell populations. Our results point to the importance of colony size and morphology on the optical properties vs. single cells. The specific absorption coefficients for Microcystis communities we observed indicate the package effect was occurring and decreasing absorption efficiency presumably from colony self-shading. It is very likely that colonies were enhancing backscatter ratios compared to single cells. The characterization of optical properties for vacuolate cyanobacteria in colonial form needs further research and testing.
Within Lake Erie, large ranges in IOPs—both absorption and scattering properties—were observed over a relatively small region. The distributions of optical properties exhibited sub-regional organization, reflecting ecological differences between them. In the western basin, these included two adjacent and interacting sub-regions: a large river plume from the Detroit River entering the north and devoid of cyanobacteria, and the shallow Maumee Bay region that is a source of Microcystis blooms. The adjacent waters of the central basin were dominated by Plantktothrix, another vacuolate cyanobacteria. The Detroit River and the central basin data show tight, coherent optical properties. In contrast, within the region influenced by the Maumee Bay waters, there was a higher degree of optical variability. This was a result of varying mixtures of inorganic and algal particles present in the water column, as well as the vertical positioning of Microcystis colonies. At times, these were actively concentrating near the surface in low wind conditions. At other times, they were more distributed in the water column. When surface concentrations of the cyanobacteria were high, there were larger variations in the remote sensing reflectance signal.
The unique optical properties of blooming cyanobacteria are expressed in the remote sensing reflectance, elevating spectral bands and depressing others coinciding with absorption peaks. This results in spectral variations across the visible and NIR wavelength range. There are existing bio-optical algorithms that use this information to derive indices associated with cyanobacteria, such as the algorithms of Wynne et al. (2010), Matthews et al. (2012), and Hu et al. (2010). It is of interest to examine the details of these algorithms to confirm the exclusivity of remote sensing signals to cyanobacteria. In other words, do cyanobacteria populations, blooming or not, have a distinct “fingerprint” characteristic expressed in the remote sensing reflectance? This answer likely depends on the given environmental situation. For IOPs, this poses a difficulty for solely interpreting as an indicator of particle composition. Gas-vacuolate cyanobacteria and inorganic particles have similar high scattering properties ( > 0.02), although Microcystis appears to elevate above that of inorganic particles alone. Remarkably, VSF shapes in the backward direction were consistent with shapes observed globally in Case I and Case II waters, even though particle composition was often dominated by colony forming, vacuole-containing cyanobacteria. Other information related to the optical drivers, such as bloom phase and wind history, may be required for differentiating sediments from cyanobacteria and toward interpreting their ecological significance in the western basin. Absorption characteristics could also be used in concert with scattering information to discriminate cyanobacteria from other particles (sediments and other algae).
Cyanobacteria blooms dominated by Microcystis occur in freshwater lakes throughout the world, and likely exhibit similar optical properties as we observed in Lake Erie. Our observations are therefore relevant to a much broader set of lakes, and understanding their properties is critical to designing algorithms and interpreting remote sensing data, which is increasing in operational use for cHAB detection and ecological trend analysis. The complexities and ranges of the IOPs we observed in Lake Erie were beyond the ranges of most bio-optical algorithms that produce IOP products, such as NASA's Generalize IOP model (Werdell et al., 2013). Few semi-analytic algorithms have been tested in these conditions, but we believe standard models and algorithms will have high uncertainty. The empirical algorithms currently adapted for cHAB detection incorporate optical channels in the red and NIR wavelength region, and this is likely needed for any semi-analytic algorithm approach such as Mishra et al. (2013) who modified the Quasi Analytic Algorithm (Lee et al., 2002) to incorporate more bands in the green and red spectral region. There is more optical information contained in the signals in this region compared to blue region (400–500 nm) where many algorithms (and satellite sensors) are centered. New models are also needed for phytoplankton absorption and particle backscattering to account for the high absorption as seen in our data. While the VSF shape may be valid for Microcystis colonial particles, the spectral depression of backscattering at peak absorption bands (e.g., 443 nm) will impact the standard particle backscatter model, which is spectrally flat and does not account for spectral features. Furthermore, models designed for these conditions may not work elsewhere, which is expected. In Lake Erie, we observed waters with different optical properties in close proximity. Different optical conditions in these waters will also vary over time, and a bloom-specific algorithms will likely be ineffective in non-bloom conditions. To account for these algorithm issues, an intelligent system to choose the best algorithm is needed, as previously shown with empirical chlorophyll algorithms (Moore et al., 2014). Developing new forms of IOP models may be required if the existing approaches cannot accommodate these optical conditions through simple re-parameterization. Furthermore, will algorithms developed for Microcystis bloom conditions be applicable to other types of cyanobacteria species or non-bloom conditions? In other words, we do not know if an algorithm developed specifically for Microcystis could be applied to Plantktothrix dominated communities, but multiple algorithms could be accommodated by the aforementioned intelligent framework system. The observations and associated optical relationships described here are a step toward improving and developing well-validated algorithms for Microcystis blooms that are problematic in a variety of freshwater systems.
Author Contributions
TM, CM, JS, MT, and SR designed the main field study for both years. TM, CM, JS, MT, AC, NS, and AY collected the field data. SR provided the logistical use of NOAA lab space for instrument assembly and water sample processing, use of the NOAA R/V for our study and field support. CM, TJ, AB, DP, AC, JS, MT, AN, and MM processed and analyzed the discrete water samples. TM and JS made the radiometric measurements. JS, MT, and NS processed and analyzed the MASCOT and Dolphin data. AW designed the NRL field study of 2014 and was responsible for NRL data processing. TM, CM, JS, and MT wrote the paper. All authors commented on and edited the paper.
Funding
Funding for TM, MT, JS, and CM was provided by the National Science Foundation (OCE-1313783) and the National Institute for Environmental Health Sciences (1R01ES021929-01). Funding support for NRLSSC components of this research was provided through the Office of Naval Research (project 73-4628-A6). Additional support for MT was also provided through a Harbor Branch Institute of Oceanography Foundation award, and NASA grants NNX15AR65G and NNX15AN17G. Additional support for JS, MM, and AN was provided by the Harbor Branch Oceanographic Institute Foundation, NASA (NNX15AR65G) and NSF (1634053, 1657332). Funding support for DP, AB, TJ, and SR was provided through the Great Lakes Restoration Initiative. This manuscript is contribution number 1117 for the Cooperative Institute for Great Lakes Research, University of Michigan. This manuscript is NOAA Great Lakes Environmental Research Laboratory contribution No. 1867.
Conflict of Interest Statement
The authors declare that the research was conducted in the absence of any commercial or financial relationships that could be construed as a potential conflict of interest.
Acknowledgments
We would like to thank NOAA GLERL provided ship and lab resources for the field observations in 2013 and 2104, and Captain Tom Joyce for helping guide our sampling strategy. We thank Erin Cafferty for the 2013 microscopy cell counts. We would also like to thank Heidi Dierssen for loaning the ASD radiometer for use in the field, and for guidance on data processing. We would like to thank Tom Bridgeman for conversations on Lake Erie ecology. We also thank the two reviewers and the editors at Frontiers.
References
APHA (1998). Standard Methods for the Examination of Water and Waste Water. Washington, DC: American Public Health Association.
Austin, R. (1972). “The remote sensing of spectral radiance from below the ocean surface,” in Optical Aspects of Oceanography, eds N. Jerlov and S. Nielsen (New York, NY: Academic), 201–213.
Babin, M., Morel, A., Fournier-Sicre, V., Fell, F., and Stramski, D. (2003). Light scattering properties of marine particles in coastal and open ocean waters as related to the particle mass concentration. Limnol. Oceanogr. 48, 843–859. doi: 10.4319/lo.2003.48.2.0843
Barnard, A., Pegau, W., and Zaneveld, J. (1998). Global relationships of the inherent optical properties of the oceans. J. Geophys. Res. 103, 24955–24968. doi: 10.1029/98JC01851
Binding, C., Greenberg, T., and Bukata, R. (2012). An analysis of MODIS-derived algal and mineral turbidity in Lake Erie. J. Great Lakes Res. 38, 107–116. doi: 10.1016/j.jglr.2011.12.003
Binding, C., Jerome, J., Bukata, R., and Booty, W. (2007). Trends in water clarity of the lower Great Lakes from remotely sensed aquatic color. J. Great Lakes Res. 33, 828–841. doi: 10.3394/0380-1330(2007)33[828:TIWCOT]2.0.CO;2
Binding, C., Jerome, J., Bukata, R., and Booty, W. (2008). Spectral absorption properties of dissolved and particulate matter in Lake Erie. Remote Sens. Environ. 112, 1702–1711. doi: 10.1016/j.rse.2007.08.017
Binding, C., Jerome, J., Bukata, R., and Booty, W. (2010). Suspended particulate matter in Lake Erie derived from modis aquatic colour imagery. Int. J. Remote Sens. 31, 5239–5255. doi: 10.1080/01431160903302973
Boss, E., Pegau, W. S., Lee, M., Twardowski, M., Shybanov, E., Korotaev, G., et al. (2004). Particulate backscattering ratio at LEO 15 and its use to study particle composition and distribution. J. Geophys. Res. 109, C01014. doi: 10.1029/2002JC001514
Bricaud, A., Babin, M., Morel, A., and Claustre, H. (1995). Variability in the chlorophyll-specific absorption coefficients of natural phytoplankton: analysis and parameterization. J. Geophys. Res. 100, 13321–13332. doi: 10.1029/95JC00463
Bricaud, A., and Morel, A. (1986). Light attenuation and scattering by phytoplanktonic cells: a theoretical modeling. Appl. Opt. 25, 571–580. doi: 10.1364/AO.25.000571
Campbell, G., Phinn, S., and Daniel, P. (2011). The specific inherent optical properties of three sub-tropical and tropical water reservoirs in Queensland, Australia. Hydrobiologia 25, 233–252. doi: 10.1007/s10750-010-0476-4
Chaffin, J., Bridgeman, T., Heckathorn, S., and Mishra, S. (2011). Assessment of Microcystis growth rate potential and nutrient status across a trophic gradient in western Lake Erie. J. Great Lakes Res. 37, 92–100. doi: 10.1016/j.jglr.2010.11.016
Conroy, J., Edwards, W., Pontius, R., Kane, D., Zhang, H., Shea, J., et al. (2005). Soluble nitrogen and phosphorus excretion of exotic freshwater mussels (Dreissena spp.): potential impacts for nutrient remineralisation in western Lake Erie. Freshwater Biol. 50, 1146–1162. doi: 10.1111/j.1365-2427.2005.01392.x
Davis, T., Bullerjahn, G., Tuttle, T., McKay, R., and Watson, S. (2015). Effects of increasing nitrogen and phosphorus concentrations on phytoplankton community growth and toxicity during Planktothrix blooms in Sandusky Bay, Lake Erie. Environ. Sci. Technol. 49, 7197–7207. doi: 10.1021/acs.est.5b00799
Dokuli, M., and Teubner, K. (2012). Deep living Planktothrix rubescens modulated by environmental constraints and climate forcing. Hydrobiologia 112, 29–46. doi: 10.1007/s10750-012-1020-5
Doxaran, D., Ehn, J., Belanger, S., Matsuoka, A., Hooker, S., and Babin, M. (2012). Optical characterisation of suspended particles in the Mackenzie River plume (Canadian Arctic Ocean) and implications for ocean colour remote sensing. Biogeosciences 9, 3213–3229. doi: 10.5194/bg-9-3213-2012
Dusini, D. (2005). The Effect of Lake Erie Water Level Variation on Sediment Resuspension. Master's thesis, The Ohio State University.
Effler, S. W., Peng, F., O'Donnell, D. M., and Strait, C. (2013). The backscattering coefficient and its components in the Great Lakes: a review and synthesis. J. Great Lakes Res. 39(Suppl. 1), 108–122. doi: 10.1016/j.jglr.2013.02.002
Fahnenstiel, G., Millie, D., Dyble, J., Litaker, R., Tester, P., McCormick, M., et al. (2008). Microcystin concentrations and cell quotas in Saginaw Bay, Lake Huron. Aquat. Ecosyst. Health Manag. 11, 190–195. doi: 10.1080/14634980802092757
Gleason, A., Voss, K., Gordon, H., Twardowski, M., Sullivan, J., Trees, C., et al. (2012). Detailed validation of ocean color bidirectional effects in various case I and case II waters. Opt. Exp. 20, 7630–7645. doi: 10.1364/OE.20.007630
Haltuch, M., Berkman, P., and Garton, D. (2000). Geographic information system (GIS) analysis of ecosystem invasion: exotic mussels in Lake Erie. Limnol. Oceanogr. 9, 1778–1787. doi: 10.4319/lo.2000.45.8.1778
Han, H., Bosch, N., and Allan, J. (2011). Spatial and temporal variation in phosphorus budgets for 24 watersheds in the Lake Erie and Lake Michigan basins. Biogeochemistry 102, 45–58. doi: 10.1007/s10533-010-9420-y
Harke, M., Steffen, M., Gobler, C., Otten, T., Wilhelm, S., Wood, S., et al. (2016). A review of the global ecology, genomics, and biogeography of the toxic cyanobacterium, Microcystis spp. Harmful Algae 54, 4–20. doi: 10.1016/j.hal.2015.12.007
Hasle, G. (1978). “The inverted-microscope method,” in Phytoplankton Manual, Chap. 5.2.1, ed A. Sournia (Paris: United Nations Educational, Scientific and Cultural Organization), 88–96.
Horváth, H., Kovács, A. W., Riddick, C., and Présing, M. (2013). Extraction methods for phycocyanin determination in freshwater filamentous cyanobacteria and their application in a shallow lake. Eur. J. Phycol. 48, 278–286. doi: 10.1080/09670262.2013.821525
Hu, C., Lee, Z., Ma, R., Yu, K., Li, D., and Shang, S. (2010). Moderate resolution imaging spectroradiometer (MODIS) observations of cyanobacteria blooms in Taihu Lake, China. J. Geophys. Res. 115, C04002. doi: 10.1029/2009JC005511
Hunter, P., Tyler, A., Presing, M., Kovacs, A., and Preston, T. (2008). Spectral discrimination of phytoplankton colour groups: the effect of suspended particulate matter and sensor spectral resolution. Remote Sens. Environ. 112, 1527–1544. doi: 10.1016/j.rse.2007.08.003
Ibelings, B., Kroon, B., and Mur, C. (1994). Acclimation of photosystem II in a cyanobacterium and a eukaryotic green alga to high and fluctuating photosynthetic photon flux densities, simulating light regimes induced by mixing in lakes. New Phytol. 128, 407–424. doi: 10.1111/j.1469-8137.1994.tb02987.x
IJC (2014). A Balanced Diet for Lake Erie: Reducing Phosphorus Loadings and Harmful Algal Blooms. Technical Report.
Kane, D., Conroy, J., Richards, R., Baker, D., and Culver, D. (2014). Re-eutrophication of Lake Erie: correlations between tributary nutrient loads and phytoplankton biomass. J. Great Lakes Res. 40, 496–501. doi: 10.1016/j.jglr.2014.04.004
Katz, J., and Sheng, J. (2010). Applications of holography in fluid mechanics and particle dynamics. Annu. Rev. Fluid Mech. 42, 531–555. doi: 10.1146/annurev-fluid-121108-145508
Kirk, J. (1994). Light and Photosynthesis in Aquatic Ecosystems. Cambridge: Cambridge University Press. doi: 10.1017/CBO9780511623370
Kudela, R., Palacis, S., Austerberry, D., Accorsi, E., Guild, L., and Torres-Perez, J. (2015). Application of hyperspectral remote sensing to cyanobacterial blooms in inland waters. Remote Sens. Environ. 167, 196–205. doi: 10.1016/j.rse.2015.01.025
Kutser, T. (2004). Quantitative detection of chlorophyll in cyanobacterial blooms by satellite remote sensing. Limnol. Oceanogr. 49, 2179–2189. doi: 10.4319/lo.2004.49.6.2179
Lee, Z., Carder, K., and Arnone, R. (2002). Deriving inherent optical properties from water color: a multiband quasi-analytical algorithm for optically deep waters. Appl. Opt. 41, 5756–5772. doi: 10.1364/AO.41.005755
Li, L., Li, L., and Song, K. (2015). Remote sensing of freshwater cyanobacteria: an extended IOP inversion model of inland waters (IIMIW) for partitioning absorption coefficient and estimating phycocyanin. Remote Sens. Environ. 157, 9–23. doi: 10.1016/j.rse.2014.06.009
Lick, W., Lick, J., and Ziegler, C. (1994). The resuspension and transport of fine-grained sediments in Lake Erie. J. Great Lakes Res. 20, 599–612. doi: 10.1016/S0380-1330(94)71181-3
Liere, L. V., and Mur, L. (1979). Growth kinetics of Oscillatoria agardhii gomont in continuous culture, limited in its growth by the light energy supply. J. Gen. Microbiol. 115, 153–160. doi: 10.1099/00221287-115-1-153
Lohrenz, S. (2000). A novel theoretical approach to correct for pathlength amplification and variable sampling loading in measurements of particulate spectral absorption by the quantitative filter technique. J. Plankt. Res. 22:639. doi: 10.1093/plankt/22.4.639
Lubac, B., and Loisel, H. (2007). Variability and classification of remote sensing reflectance spectra in the eastern English Channel and southern North Sea. Remote Sens. Environ. 110, 45–58. doi: 10.1016/j.rse.2007.02.012
Ma, R., Pan, D., Duan, H., and Song, Q. (2009). Absorption and scattering properties of water body in Taihu Lake, China: absorption. Int. J. Remote Sens. 30, 2321–2335. doi: 10.1080/01431160802549385
Ma, R., Tang, J., Dai, J., Zhang, Y., and Song, Q. (2007). Absorption and scattering properties of water body in Taihu Lake, China: absorption. Int. J. Remote Sens. 27, 4277–4304. doi: 10.1080/01431160600851835
Manny, B., Edsell, T., and Jaworski, E. (1988). The Detroit River, Michigan: An Ecological Profile. Technical Report.
Matthews, M., and Bernard, S. (2013). Characterizing the absorption properties for remote sensing of three small optically-diverse South African reservoirs. Remote Sens. 5, 4370–4404. doi: 10.3390/rs5094370
Matthews, M., Bernard, S., and Robertson, L. (2012). An algorithm for detecting trophic status (chlorophyll-a), cyanobacterial-dominance, surface scums and floating vegetation in inland and coastal waters. Remote Sens. Environ. 124, 637–652. doi: 10.1016/j.rse.2012.05.032
McKee, D., Chami, M., Brown, I., Calzado, V., and Doxaran, D. (2009). Role of measurement uncertainties in observed variability in the spectral backscattering ratio: a case study in mineral-rich coastal waters. Appl. Opt. 48, 4663–4675. doi: 10.1364/AO.48.004663
McKee, D., and Cunningham (2005). Evidence for wavelength dependence of the scattering phase function and its implication for modeling radiance transfer in shelf seas. Appl. Opt. 44, 126–135. doi: 10.1364/AO.44.000126
MDEQ (2008). Total Maximum Daily Load for E. coli for the Ecorse River Watershed. Technical Report, Wayne County, Michigan.
Metsamaa, L., Kutser, T., and Strombeck, N. (2006). Recognizing cyanobacteria blooms based on their optical signature: a modelling study. Boreal Environ. Res. 11, 493–506.
Michalak, A., Anderson, E., Beletsky, D., Boland, S., Bosch, N., Bridgeman, T., et al. (2013). Record-setting algal bloom in lake erie caused by agricultural and meteorological trends consistent with future conditions. Proc. Natl. Acad. Sci U.S.A. 110, 6448–6452. doi: 10.1073/pnas.1216006110
Miller, R., Twardowski, M., Moore, C., and Casagrande, C. (2003). The dolphin: technology to support remote sensing bio-optical algorithm development and applications. Backscatter 14, 8–12.
Millie, D., Fahnenstiel, G., Dyble-Bressie, J., Pigg, R., Rediske, R., Klarer, D., et al. (2009). Late-summer phytoplankton in western Lake Erie (Laurentian Great Lakes): bloom distributions, toxicity, and environmental influences. Aquat. Ecol. 43, 915–934. doi: 10.1007/s10452-009-9238-7
Mishra, S., Mishra, D., Lee, Z., and Tucker, C. (2013). Quantifying cyanobacterial phycocyanin concentration in turbid productive waters: a quasi-analytical approach. Remote Sens. Environ. 133, 141–151. doi: 10.1016/j.rse.2013.02.004
Mitchell, B., Kahru, M., Wieland, J., and Stramska, M. (2003). Ocean Optics Protocols for Satellite Ocean Color Sensor Validation, Revision 4, Volume IV: Inherent Optical Properties: Instruments, Characterizations, Field Measurements and Data Analysis Protocols. Technical Report.
Mobley, C. (1999). Estimation of the remote-sensing reflectance from above-surface measurements. Appl. Opt. 38, 7442–7455. doi: 10.1364/AO.38.007442
Moore, T., Dowell, M., Bradt, S., and Ruiz-Verdu, A. (2014). A framework for selecting and blending ocean color products in coastal zones and lakes. Remote Sens. Environ. 143, 97–111. doi: 10.1016/j.rse.2013.11.021
Morel, A., Antoine, D., and Gentili, B. (2002). Bidirectional reflectance of oceanic waters: accounting for raman emission and varying particle scattering phase function. Appl. Opt. 41, 6289–6306. doi: 10.1364/AO.41.006289
Morel, A., and Gentili, B. (1993). Diffuse reflectance of oceanic waters. II. Bidirectional aspects. Appl. Opt. 32, 6864–6879. doi: 10.1364/AO.32.006864
Mouw, C., Chen, H., McKinley, G., Effler, S., O'Donnell, D., Perkins, M., et al. (2013a). Evaluation and optimization of bio-optical inversion algorithms for remote sensing of Lake Superiors optical properties. JGR 118, 1696–1714. doi: 10.1002/jgrc.20139
Mouw, C., Ciochetto, A., Moore, T., Twardowski, M., Sullivan, J., and Yu, A. (2013b). NASA SeaWiFS Bio-optical Storage System (SeaBASS). Available online at: https://seabass.gsfc.nasa.gov/archive/URI/Mouw/NIH-NSF_Lake_Erie/URI_Lake_Erie_2013/archive
Mouw, C., Ciochetto, A., Moore, T., Twardowski, M., Sullivan, J., and Yu, A. (2014). NASA SeaWiFS Bio-optical Storage System (SeaBASS). Available online at: https://seabass.gsfc.nasa.gov/archive/URI/Mouw/NIH-NSF_Lake_Erie/URI_Lake_Erie_2013/archive
Mouw, C., Greb, S., Aurin, D., DiGiacomo, P., Lee, Z., Twardowski, M., et al. (2015). Aquatic color radiometry remote sensing of coastal and inland waters: challenges and recommendations for future satellite missions. Remote Sens. Environ. 160, 15–30. doi: 10.1016/j.rse.2015.02.001
Nardelli, S., and Twardowski, M. (2016). Improving assessments of chlorophyll concentration from in situ optical measurements. Opt. Exp. 24, A1374–A1389. doi: 10.1364/OE.24.0A1374
Nayak, A., McFarland, M., Sullivan, J., and Twardowski, M. (2017). Evidence of ubiquitous preferential particle orientation in representative oceanic shear flows. Limnol. Oceanogr. doi: 10.1002/lno.10618. [Epub ahead of print].
Neukermans, G., Loisel, H., Meriaux, X., Astoreca, R., and McKee, D. (2016). In situ variability of mass-specific beam attenuation and backscattering of marine particles with respect to particle size, density, and composition. Limnol. Oceanogr. 57, 124–144. doi: 10.4319/lo.2012.57.1.0124
O'Donnell, D. M., Effler, S. W., Perkins, M., Strait, C., Lee, Z., and Greb, S. (2013). Resolution of optical gradients and pursuit of optical closure for Green Bay, Lake Michigan. J. Great Lakes Res. 39, 161–172. doi: 10.1016/j.jglr.2013.04.002
O'Donnell, D. M., Effler, S. W., Strait, C. M., and Leshkevich, G. A. (2010). Optical characterizations and pursuit of optical closure for the western basin of Lake Erie through in situ measurements. J. Great Lakes Res. 36, 736–746. doi: 10.1016/j.jglr.2010.08.009
Otsuka, S., Suda, S., Shibata, S., Oyaizu, H., Matsumoto, S., and Watanabe, M. (2001). A proposal for the unification of five species of the cyanobacterial genus Microcystis Kutzing ex Lemmermann 1907 under the rules of the bacteriological code. Int. J. Syst. Evol. Microbiol. 51, 873–879. doi: 10.1099/00207713-51-3-873
Paerl, H. (2009). Controlling eutrophication along the freshwatermarine continuum: dual nutrient (N and P) reductions are essential. Estuar. Coasts 32, 593–601. doi: 10.1007/s12237-009-9158-8
Paerl, H., Bland, P., Bowles, D., and Haibach, M. (1985). Adaptation to high-intensity, low-wavelength light among surface blooms of the cyanobacterium Microcystis aeruginosa. Appl. Environ. Microbiol. 49, 1046–1052.
Paerl, H., Hal, N., and Calandrino, E. (2011). Controlling harmful cyanobacterial blooms in a world experiencing anthropogenic and climatic-induced change. Sci. Total Environ. 409, 1739–1745. doi: 10.1016/j.scitotenv.2011.02.001
Paerl, H., and Ustach, J. (1982). Blue-green algal scums: an explanation for their occurrence during freshwater blooms. Limnol. Oceanogr. 21, 212–217. doi: 10.4319/lo.1982.27.2.0212
Peng, F., and Effler, S. (2010). Characterizations of individual suspended mineral particles in western Lake Erie: implications for light scattering and water clarity. J. Great Lakes Res. 36, 686–698. doi: 10.1016/j.jglr.2010.08.003
Randolph, K., Wilson, J., Tedesco, L., Li, L., Pascual, D. L., and Soyeux, E. (2008). Hyperspectral remote sensing of cyanobacteria in turbid productive water using optically active pigments, chlorophyll a and phycocyanin. Remote Sens. Environ. 112, 4009–4019. doi: 10.1016/j.rse.2008.06.002
Raps, S., Wyman, K., Siegelman, H., and Falkwoski, P. (1983). Adaptation of the cyanobacterium Microcystis aeruginosa to light intensity. Plant Physiol. 72, 829–832. doi: 10.1104/pp.72.3.829
Reynolds, R., Stramski, D., and Neukermans, G. (2016). Optical backscattering by particles in Arctic seawater and relationships to particle mass concentration, size distribution, and bulk composition. Limnol. Oceanogr. 61, 1869–1890. doi: 10.1002/lno.10341
Robertson Lain, L., Bernard, S., and Evers-King, H. (2014). Biophysical modelling of phytoplankton communities from first principles using two-layered spheres: equivalent Algal Populations (EAP) model. Opt. Exp. 22, 16745–16758. doi: 10.1364/OE.22.016745
Ruiz-Verdú, A., Simis, S., de Hoyas, C., Gons, H., and Peña-Martinez, R. (2008). An evaluation of algorithms for the remote sensing of cyanobacterial biomass. Remote Sens. Environ. 112, 3996–4008. doi: 10.1016/j.rse.2007.11.019
Sayers, M., Fahnenstiel, G., Shuchman, R., and Whitley, M. (2016). Cyanobacteria blooms in three eutrophic basins of the Great Lakes: a comparative analysis using satellite remote sensing. Int. J. Remote Sens. 37, 4148–4171. doi: 10.1080/01431161.2016.1207265
Scheffer, M., Rinaldi, S., Gragnani, A., Mur, L., and Nes, E. V. (1997). On the dominance of filamentous cyanobacteria in shallow, turbid lakes. Ecology 78, 272–282. doi: 10.1890/0012-9658(1997)078[0272:OTDOFC]2.0.CO;2
Simis, S., Peeters, S., and Gons, H. (2005). Remote sensing of the cyanobacterial pigment phycocyanin in turbid inland water. Limnol. Oceanogr. 50, 237–245. doi: 10.4319/lo.2005.50.1.0237
Snyder, W., Arnone, R., Davis, C., Goode, W., Gould, R., Ladner, S., et al. (2008). Optical scattering and backscattering by organic and inorganic particulates in u.s. coastal waters. Appl. Opt. 47, 666–677. doi: 10.1364/AO.47.000666
Soja-Woźniak, M., Craig, S. E., Kratzer, S., Wojtasiewicz, B., Darecki, M., and Jones, C. T. (2017). A novel statistical approach for ocean colour estimation of inherent optical properties and cyanobacteria abundance in optically complex waters. Remote Sens. 9:343. doi: 10.3390/rs9040343
Sommaruga, R., Chen, Y., and Liu, Z. (2009). Multiple strategies of bloom-forming Microcystis to minimize damage by solar ultraviolet radiation in surface waters. Microb. Ecol. 57, 667–674. doi: 10.1007/s00248-008-9425-4
Speziale, B. J., Schreiner, S. P., Giammatteo, P. A., and Schindler, J. E. (1984). Comparison of N,N-dimethylformamide, dimethyl sulfoxide, and acetone for extraction of phytoplankton chlorophyll. Can J. Fish. Aquat. Sci. 41, 1519–1522. doi: 10.1139/f84-187
Stavn, R., and Richter, S. (2008). Biogeo-optics: particle optical properties and the partitioning of the spectral scattering coefficient of ocean waters. Appl. Opt. 47, 2660–2679. doi: 10.1364/AO.47.002660
Stumpf, R., Wynne, T., Baker, D., and Fahnenstiel, G. (2012). Interannual variability of cyanobacterial blooms in Lake Erie. PLoS ONE 7:e42444. doi: 10.1371/journal.pone.0042444
Sullivan, J., and Twardowski, M. (2009). Angular shape of the oceanic particulate volume scattering function in the backward direction. Appl. Opt. 48, 6811–6819. doi: 10.1364/AO.48.006811
Sullivan, J., Twardowski, M., Donaghay, P., and Freeman, S. (2005). Use of optical scattering to discriminate particle types in coastal waters. Appl. Opt. 44, 1667–1680. doi: 10.1364/AO.44.001667
Sullivan, J., Twardowski, M., Zaneveld, J., and Moore, C. (2013). “Measuring optical backscattering in water,” in Light Scattering Reviews 7: Radiative Transfer and Optical Properties of Atmosphere and Underlying Surface, ed A. A. Kokhanovsky (Berlin: S Praxis Books), 189–224. doi: 10.1007/978-3-642-21907-8_6
Tassan, S., and Ferrari, G. (1995). An alternative approach to absorption measurements of aquatic particles retained on filters. Limnol. Oceanogr. 40, 1358–1368. doi: 10.4319/lo.1995.40.8.1358
Tranvik, L., Downing, J., Cotner, J., Loiselle, S., Striegl, R., Ballatore, T., et al. (2009). Lakes and reservoirs as regulators of carbon cycling and climate. Limnol. Oceanogr. 54, 2298–2314. doi: 10.4319/lo.2009.54.6_part_2.2298
Trees, C., Bidigare, R., Karl, D., Heukelem, L., and Dore, J. (2003). Ocean Optics Protocols for Satellite Ocean Color Sensor Validation, Revision 4, volume IV: Inherent Optical Properties: Instruments, Characterizations, Field Measurements and Data Analysis Protocols. Technical Report.
Twardowski, M., Boss, E., Macdonald, J., Pegau, W., and Barnard, A. (2001). A model for estimating bulk refractive index from the optical backscattering ratio and the implications for understanding particle composition in case I and case II waters. J. Geophys. Res. 106, 14129–14142. doi: 10.1029/2000JC000404
Twardowski, M., Boss, E., Sullivan, J., and Donaghay, P. (2004). Modeling spectral absorption by chromophoric dissolved organic matter (CDOM). Mar. Chem. 89, 69–88. doi: 10.1016/j.marchem.2004.02.008
Twardowski, M., Sullivan, J., and Dalgeish, F. (2016). Novel technologies to study undisturbed particle fields in the ocean. Sea Technol. 57, 15–19.
Twardowski, M., Sullivan, J., Donaghay, P., and Zaneveld, J. (1999). Microscale quantification of the absorption by dissolved and particulate material in coastal waters with an ac-9. J. Atmos. Ocean. Technol. 16, 691–707.
Twardowski, M., Zhang, X., Vagle, S., Sullivan, J., Freeman, S., Czerski, H., et al. (2012). The optical volume scattering function in a surf zone inverted to derive sediment and bubble particle subpopulations. J. Geophys. Res. 117, C00H17. doi: 10.1029/2011JC007347
Visser, P., Passarge, J., and Mur, L. (1997). Modelling vertical migration of the cyanobacterium Microcystis. Hydrobiologia 349, 99–109. doi: 10.1023/A:1003001713560
Visser, P., Verspagen, J., Sandrini, G., Stal, L., Matthijs, H., Davis, T., et al. (2016). How rising CO2 and global warming may stimulate harmful cyanobacterial blooms. Harmful Algae 54, 145–159. doi: 10.1016/j.hal.2015.12.006
Walsby, A. E., Ng, G., Dunn, C., and Davis, P. A. (2004). Comparison of the depth where Planktothrix rubescens stratifies and the depth where the daily insolation supports its neutral buoyancy. New Phytol. 162, 133–145. doi: 10.1111/j.1469-8137.2004.01020.x
Watson, S., Miller, C., Arhonditsis, G., Boyer, G., Carmichael, W., Charlton, M., et al. (2016). The re-eutrophication of Lake Erie: harmful algal blooms and hypoxia. Harmful Algae 56, 44–66. doi: 10.1016/j.hal.2016.04.010
Werdell, P., and Bailey, S. (2002). The SeaWiFS Bio-optical Archive and Storage System (SeaBASS): Current Architecture and Implementation. Technical Report, NASA Goddard Space Flight Center.
Werdell, P., and Bailey, S. (2005). An improved bio-optical data set for ocean color algorithm development and satellite data product validation. Remote Sens. Environ. 98, 122–140. doi: 10.1016/j.rse.2005.07.001
Werdell, P. J., Franz, B. A., Bailey, S. W., Feldman, G. C., Boss, E., Brando, V. E., et al. (2013). Generalized ocean color inversion model for retrieving marine inherent optical properties. Appl. Opt. 52, 2019–2037. doi: 10.1364/AO.52.002019
Wynne, T., and Stumpf, R. (2015). Spatial and temporal patterns in the seasonal distribution of toxic cyanobacteria in western Lake Erie from 20022014. Toxins 7, 1649–1663. doi: 10.3390/toxins7051649
Wynne, T., Stumpf, R., Tomlinson, M., and Dyble, J. (2010). Characterizing a cyanobacterial bloom in western Lake Erie using satellite imagery and meteorological data. Limnol. Oceanogr. 55, 2025–2036. doi: 10.4319/lo.2010.55.5.2025
Zamankhan, H., Westrick, J., Anscombe, F., Stumpf, R., Wynne, T., Sullivan, J., et al. (2016). “Sustainable monitoring of algal blooms,” in Sustainable Water Management and Technologies, ed D. H. Chen (Boca Raton, FL: Taylor and Francis Group), 65–90.
Zaneveld, J. R. V. (1995). A theoretical derivation of the dependence of the remotely sensed reflectance of the ocean on the inherent optical properties. J. Geophys. Res. 100, 13135–13142. doi: 10.1029/95JC00453
Zaneveld, J. R. V., and Kitchen, J. C. (1995). The variation in the inherent optical properties of phytoplankton near an absorption peak as determined by various models of cell structure. J. Geophys. Res. 100, 13309–13320. doi: 10.1029/95JC00451
Zaneveld, J. R. V., Kitchen, J. C., and Moore, C. C. (1994). The scattering error correction of reflecting tube absorption meters. Ocean Opt. XII Proc. SPIE 2258, 44–55. doi: 10.1117/12.190095
Zhang, Y., Yin, Y., Wang, M., and Liu, X. (2012). Effect of phytoplankton community composition and cell size on absorption properties in eutrophic shallow lakes: field and experimental evidence. Opt. Exp. 20, 11882–11898. doi: 10.1364/OE.20.011882
Zhou, W., Wang, G., Sun, Z., Cao, W., Xu, Z., Hu, S., et al. (2012). Variations in the optical scattering properties of phytoplankton cultures. Opt. Exp. 20, 11189–111206. doi: 10.1364/OE.20.011189
Keywords: harmful algal blooms, inherent optical properties, cyanobacteria, freshwater lakes, remote sensing
Citation: Moore TS, Mouw CB, Sullivan JM, Twardowski MS, Burtner AM, Ciochetto AB, McFarland MN, Nayak AR, Paladino D, Stockley ND, Johengen TH, Yu AW, Ruberg S and Weidemann A (2017) Bio-optical Properties of Cyanobacteria Blooms in Western Lake Erie. Front. Mar. Sci. 4:300. doi: 10.3389/fmars.2017.00300
Received: 10 May 2017; Accepted: 31 August 2017;
Published: 27 September 2017.
Edited by:
George S. Bullerjahn, Bowling Green State University, United StatesReviewed by:
Wei Xie, Tongji University, ChinaMaureen Coleman, University of Chicago, United States
Copyright © 2017 Moore, Mouw, Sullivan, Twardowski, Burtner, Ciochetto, McFarland, Nayak, Paladino, Stockley, Johengen, Yu, Ruberg and Weidemann. This is an open-access article distributed under the terms of the Creative Commons Attribution License (CC BY). The use, distribution or reproduction in other forums is permitted, provided the original author(s) or licensor are credited and that the original publication in this journal is cited, in accordance with accepted academic practice. No use, distribution or reproduction is permitted which does not comply with these terms.
*Correspondence: Timothy S. Moore, dGltb3RoeS5tb29yZUB1bmguZWR1