 Gabriela Navarrete Forero1*
 Sara Miñarro2,3
 Tobias Karl Mildenberger4
 Annette Breckwoldt5,6
 Sudirman7
 Hauke Reuter2,8
- 1Escuela Superior Politécnica del Litoral (ESPOL), Centro de Agua y Desarrollo Sustentable, Facultad de Ciencias de la Vida, Guayaquil, Ecuador
- 2Department of Theoretical Ecology and Modelling, Leibniz Centre for Tropical Marine Research (ZMT), Bremen, Germany
- 3Institute of Environmental Science and Technology (ICTA), Universitat Autònoma de Barcelona, Bellaterra, Spain
- 4Section for Ecosystem based Marine Management, National Institute for Aquatic resources, Technical University of Denmark, Lyngby, Denmark
- 5Department of Social Sciences, Leibniz Centre for Tropical Marine Research (ZMT), Bremen, Germany
- 6Science-Stakeholder Interaction Processes, Alfred Wegener Institute Helmholtz Centre for Polar and Marine Research, Bremerhaven, Germany
- 7Department of Fisheries, Faculty of Marine Science and Fisheries, Hasanuddin University, Makassar, Indonesia
- 8Faculty for Biology and Chemistry, University of Bremen, Bremen, Germany
The Spermonde Archipelago holds one of the largest artisanal fisheries in Indonesia, providing livelihoods for local communities and many other people involved in international trade networks of seafood. High demand and a lack of enforcement of existing fisheries regulations turn into high pressure for the coral reef ecosystem, contributing to its overall degradation. Estimations on the ecological impacts of different levels of fishing pressure, as well as fisheries stock assessments and marine resource management require precise information of the spatial distribution of fishing effort, which involves great uncertainty when only anecdotal information is considered. We explored the feasibility of applying participatory boat tracking to complement fisheries data during the NW monsoon season 2014–2015. We conducted interviews, measured catch landings, and distributed GPS data loggers among hook and line fishermen to identify fishing grounds by gear-dependent patterns of boat movement. Most of the fishing activities involved two gears (octopus bait and trolling line for live groupers) and three fishing grounds. The mass of catch landings was dominated by Octopoda (CPUE = 10.1 kg boatday−1) while the most diverse group was the fish family Serranidae, with Plectropomus leopardus being the main target species. In conclusion, boat tracking combined with interviews and catch surveys has proven a useful tool to reduce uncertainty in information on spatial resource use, while allowing a high level of participation by fishermen.
Introduction
Millions of people from coastal communities in Indonesia are directly or indirectly involved in the fisheries sector, with their livelihoods strongly attached to/dependent on the health of the marine ecosystem (e.g., Ferse et al., 2014; Ferrol-Schulte et al., 2015; Baum et al., 2016). Coastal fishing communities are considered among the most vulnerable social-economic groups, particularly in developing countries, because of the inherent occupational risk, exposure to natural disasters, and the uncertainty of the yield, among other factors (Béné, 2006). Increasing efforts are being made to combine knowledge on fisheries and marine ecology with social-economic data in order to address particular problems in a more integrated way, looking both at the natural marine resources and the activities of the human groups depending on them (e.g., Crowder et al., 2008; Cohen and Steenbergen, 2015; Crona et al., 2015; Barclay et al., 2017).
Indonesia supports one of the main capture fisheries in the world, although figures vary among different sources of information. According to FAO (2014), Indonesia reported more than 2.7 million fishermen and 5.4 million tons of marine capture production in 2012, and production increased to 6 million tons by 2015 (FAO, 2017), positioning this country as the second largest capture fishery after China. Pauly and Zeller (2015) ranked Indonesia as the fourth seafood producer after China, the Russian Federation, and the United States of America. The number of overexploited fish stocks has also increased due to the unsustainable use of marine resources and the widespread degradation of Indonesia's marine coastal ecosystems, including coral reefs, seagrass meadows, and mangroves (e.g., Heazle and Butcher, 2007; Ferrol-Schulte et al., 2015). This threatens the livelihoods of coastal communities, but national policies addressing their vulnerability have often failed to provide the intended benefits at the local level due to a lack of comprehensive, integrated management, and development of alternative livelihood options (Ferse et al., 2014; Ferrol-Schulte et al., 2015; Glaser et al., accepted). In addition, complex networks exist between the small-scale artisanal fisheries and the local, regional, and global seafood markets, which pose even more challenges to transform this highly exploitative fishery system into one with sustainable management, fair access, and effective conservation regulations (e.g., Crona et al., 2015; Glaser et al., 2015; Miñarro et al., 2016).
A common informal institution regarded as an important driver of capture fisheries in Indonesia is the patron-client system (Foster, 1961; Crona et al., 2010; Deswandi, 2012; Ferrol-Schulte et al., 2015; Miñarro et al., 2016). In this system, patrons establish a reciprocal agreement with their clients, exchanging goods and services (Foster, 1961). Many fishermen are “clients” of boat owners or fish traders of different levels of the commercial chain, known as “patrons,” and establish agreements based on money loans, social protection, and trust (Deswandi, 2012). Since clients are often indebted to patrons, it has been suggested that the patron-client relationship encourages higher exploitation rates that indirectly worsens the environmental impacts of fishing (Miñarro et al., 2016) and are associated to illegal and destructive fishing practices (Chozin, 2008; Radjawali, 2011; Ferrol-Schulte et al., 2015). The lack of understanding of this structure has caused shortcomings in the achievement of conservation and development goals, particularly due to a lack of focus on the existing networks in fishing and seafood trade and an inability to incorporate them in conservation strategies and policies (Radjawali, 2012).
Artisanal fisheries can have subsistence or commercial purposes, providing for local consumption or export (FAO, 2013). Typical products of commercial coral reef fisheries are live and dead reef fish, sea cucumbers, and ornamental corals, with increasing international demand (e.g., Ferse et al., 2014). Some of the fishing methods used, such as blast and cyanide fishing, are illegal, have destructive effects on the ecosystem, and represent a risk to human health (Pet-Soede and Erdmann, 1998; Chozin, 2008; Radjawali, 2012; Ferse et al., 2014; Hajramurni, 2015). Cyanide fishing is used to anesthetize larger fish mostly for the highly priced Life Reef Food Fish Trade (LRFFT; CTI-CFF, 2015). Indonesia presents a high incidence of illegal, unreported, and unregulated fishing that challenges effective fisheries management (Varkey et al., 2010).
The decline in wild fish catches since the 1990s highlights a worldwide need for evidence-based fisheries management (Jennings et al., 2001; Pauly and Zeller, 2016). Ideally, fishery scientists should provide accurate information for resource managers to choose and configure appropriate management objectives, strategies, controls, and measures (Jennings et al., 2001), but in practice the data are often scarce, non-periodic or nonexistent, and involve great uncertainty, especially in artisanal fisheries (Costello et al., 2012; Baigún, 2013). Fishery scientists use a great variety of models to assess fish stocks, whose accuracy depends on the type and quality of the available data (Koenigstein et al., 2016). Fishery-independent data obtained through scientific surveys are considered more accurate but are more expensive than fishery-dependent data. Fishery-dependent or catch data are relatively easier to obtain but are subject to fisheries inherent processes and properties, such as gear selectivity and fishing in areas where fish abundance is highest as opposed to randomized sampling. In areas with no permanent monitoring programs, fishery-dependent data is still the first option to study the development of a fishery (Jennings et al., 2001). For instance, catch per unit of effort (CPUE) can be used as an abundance index. The use of this index requires a clear definition of effort, which is dependent on gear characteristics, and can vary spatially (Jul-Larsen et al., 2003).
Documenting spatial distribution of fishing effort is a key process both in marine research and management (Stewart et al., 2010). In research, for instance, spatial information can help identify areas under different impact regimes and study their effects on the ecosystem. In management, it may help design appropriate spatial regulations and strategies, including Marine Protected Areas (MPAs). Methods for identifying fishing grounds often rely on anecdotal information provided by fishermen (Daw, 2008; De Freitas and Tagliani, 2009; Teh et al., 2012; Gorris, 2016; Wallace et al., 2016). Although useful for some purposes, this approach lacks precision on the exact location of the fishing grounds and allocation of fishing effort among them. While the use of location technology is widespread under large-scale industrial vessels, this type of monitoring is limited in tropical artisanal fisheries. Other options to document spatial distribution of fishing effort are to conduct census using patrols (Turner et al., 2015) or research vessels (Pet-Soede et al., 2001a), which require a significant budget not always available in developing countries. In this context, small and easy-to-use GPS trackers emerge as a useful tool to precisely quantify and locate fishing with high precision and relatively low cost through participatory sampling (Daw et al., 2011; Alvard et al., 2015; Metcalfe et al., 2016). In this paper, we explore the usefulness of GPS-trackers to collect information on the spatial use of fisheries resources in the Spermonde Archipelago.
The aim of this study is, therefore, to describe the allocation of fishing effort with high spatial and temporal resolutions in an artisanal fleet, thereby: (a) demonstrating the process for fishing ground identification in a multi-gear fishery using GPS-trackers data, (b) quantifying fishing effort per gear and fishing ground, and (c) providing recent CPUE estimations for the study site.
Methods
Study Site
This study was conducted in the Spermonde Archipelago (Figure 1), located in SW Sulawesi, off the coast of its capital city Makassar. It comprises up to 150 coral cays and reef islands in 400,000 ha of coastal waters with a maximum depth of 60 m (Pet-Soede et al., 1999; Jompa and Yusuf, 2012; Schwerdtner Mánez et al., 2012). These islands are on top of a submerged platform extending north-south and parallel to the Makassar Strait, where depth reaches 2,500 m (Imran et al., 2013). There are more than 45,000 people living on 54 of these islands, which are often extremely densely populated. For example, in 2010, 216 and 325 people per ha inhabited the islands of Badi and Barrang Caddi, respectively (Schwerdtner Mánez et al., 2012). Most of the populated islands are situated close to the mainland of SW Sulawesi (Pet-Soede et al., 2001a). Land run-off has been linked to poor water quality and localized eutrophication (Edinger et al., 1998; Teichberg et al., accepted). Households depend largely on fisheries or fishing-related activities for subsistence and income generation. Alternative jobs, such as petty trading or construction play a minor role in the local economies (Ferse et al., 2014; Miñarro et al., 2016). The anthropogenic pressure in Spermonde related to the heavy development of the coastal region has caused a widespread degradation of the coral reefs and heavy exploitation of its natural resources (Pet-Soede et al., 2001b; Ferse et al., 2014; Glaser et al., 2015).
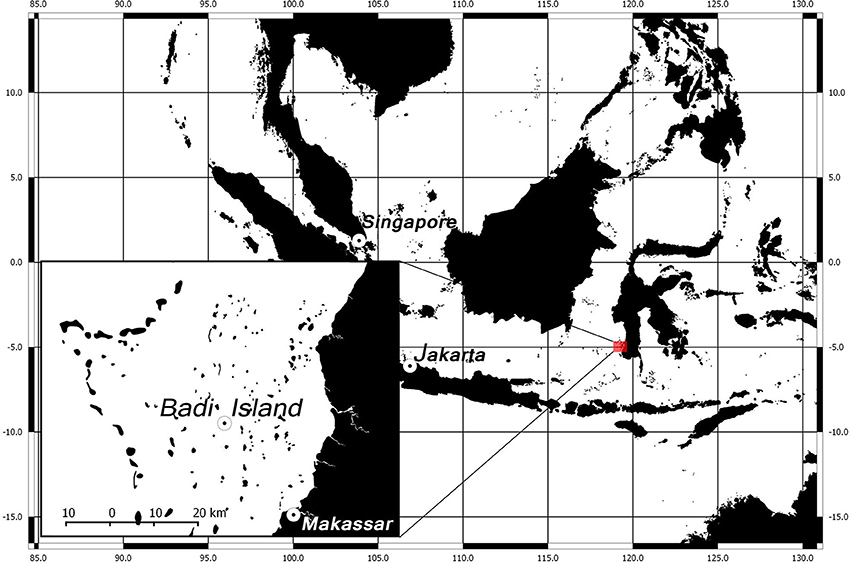
Figure 1. Location of Spermonde Archipelago in SW Sulawesi, Indonesia, and the names of the islands where data for this study was collected.
The Spermonde Archipelago supports one of the largest reef fisheries of Indonesia (Ferse et al., 2014). The artisanal fishery is conducted by functional units consisting of groups or individual fishermen, plus the different boats and gears they use (Pet-Soede et al., 2001a; Deswandi, 2012). Large boats are used to install nets, often combined with light fisheries (pers. obs.). Launches are used to transport traps to be placed on the sea bottom. These boats can also be used with illegal fishing methods, such as blast and cyanide fishing (Deswandi, 2012). Small boats are mainly used with hook-and-line gears (Pet-Soede et al., 2001a). Overall, more than 20 types of fishing methods using different gears are used in Spermonde, which are often changed according to the season or the weather conditions (Breitkopf, 2014). In contrast, boat types are a rather stable feature of the fishing units (Deswandi, 2012).
The intra-annual dynamics in Spemonde's fisheries are related to the occurrence of two weather seasons: the SE Monsoon or dry season from May to September, and the NW Monsoon or wet season from December to March, with transitional weather in April, October, and November. Deswandi (2012) relates the two seasons to different spatial patterns of fishing effort distribution. During the dry season, there are good conditions for sailing, and fishing activities occur mainly toward the western sector. The wet season is characterized by heavy rainfall when fishing activities are limited to the inner areas of the Archipelago, and many fishermen emigrate toward regions with better weather conditions in S and SE Sulawesi (Ferse et al., 2014).
Sampling
Data collection for this study took place from 25 November 2014 to 25 March 2015 on Badi Island (4°58′03″ S, 119°17′16″ E, Figure 1). Badi is located 24 km NW of Makassar and has an extension of 10 ha. According to the demographic statistics published in the communal meeting room, on December 2014 there were 1944 inhabitants and 518 households. Only fishermen using small boats and staying for the entire wet season were chosen as the study group (132 male adults). The boats were in average 6.3 (1.7) m long, made of wood or fiber glass, with a stabilizing side bar and an improvised engine consisting of a 5–10 hp water pump adapted to an axis with a helix. These boats are called kapal katinting, or lepa-lepa and are mainly used by hook and line fishermen (Pet-Soede et al., 2001a; Miñarro et al., 2016).
Participants of the study were grouped according to the type of information they were asked to provide, following the selection procedures listed in Table 1. Key informants included the gate keeper (a former bomb- and now trap-fisherman who cooperates with researchers from University of Hasanuddin and patrols the fishing grounds surrounding Badi), the Community Leader, one experienced fisherman who used to manufacture and sell octopus bait as alternative source of income, and two fish collectors (i.e., patrons). This research was conducted in accordance with all ethical standards outlined in the Amended and Updated White Paper on Safeguarding Good Scientific Practice by the German Research Foundation [Deutsche Forschungsgemeinschaft (DFG), 2013]. At the time of the fieldwork, no ethics approval was needed as per German or Indonesian law or regulations besides those approved in the research permit and by Hasanuddin University. In all cases, the request to provide information included an oral Prior Informed Consent procedure (Wiles et al., 2005) with no economic incentives. In case of questions and concerns that may arise after the study, contact details of the researcher were provided to the Community Leader.
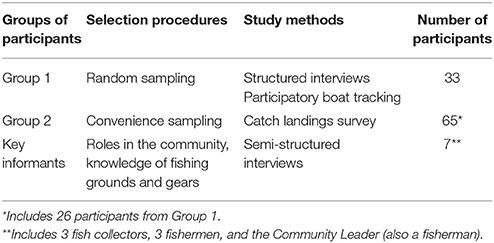
Table 1. Comparative table of study participants.
Boat Tracking
An initial interview for participants of group 1 (Table 1) included general questions regarding fishing practices and personal background. Participants were asked to take GPS trackers on their fishing trips. Ten trackers Conrad GT-750 and five trackers i-gotU GT-120 were set to record coordinates and speed in a 5 s interval. Trackers were not given to the same person on consecutive days to minimize data correlation as described by Pet-Soede et al. (2001a). Trackers were collected the evening after the fishing trip at the participants' residence. A brief interview was conducted to collect data about the number of fishermen onboard during the trip, names of the fishing grounds visited along the route, employed gears in order of use, and their associated catch data (species, numbers of catches per species and their body weight).
During those interviews the fishing grounds were identified only by their names instead of showing a map to the fishermen because the time for collecting the trackers was short (20 min) and not many fishermen were familiar with those types of maps (Deswandi, 2012). To compensate, a bathymetric map was used to ask key informants about the location of the most frequently mentioned fishing grounds. These maps already included local names of individual reefs and islands. Anecdotal information relevant for interpreting the digital spatial data was added to the forms after a pilot study and related to whether the fishermen spent time resting, selling their catch or looking for landmarks instead of fishing (if so, when/where).
Catch Landings Survey
A survey of catch landings was conducted to validate the catch data obtained during boat tracking interviews. The field team awaited fishermen (group 2, Table 1) arriving at a series of previously identified landing spots, usually close to the houses of fish collectors. The landed catch was weighed either by the researchers or by the fish collectors (particularly live-food items as these are easily damaged and get highest prices in international markets), and fishermen were asked to list items sold at sea or on other islands. Species identification was done in situ using Allen's (2009) field guide for catch landings and interviews. Invertebrates and some fishes were identified using photographs to consult experts from University of Hasanuddin and “The Tree of Life” website [Mangold (1992-2003) et al., 2010; Mangold (1922-2003) and Young, 2016].
Data Analysis
Identification of Fishing Grounds and Gears
Fishing grounds were identified on a printed navigation map after comparing the verbal descriptions of the routes with the correspondent GPS-track's animation in Google Earth, and speed vs. traveling time plots in GPS Photo Tagger 1.2.4. New questions arising from these observations regarding names of fishing grounds or differences in boat speed were included in extra interviews with participants from group 1 and key informants.
The main fishing gears for commercial species in which the participants were specialized were “trolling line” (for Spanish mackerel and live grouper) and “octopus bait.” Trolling line is a dynamic fishing method consisting of a hand line with an artificial colorful bait pulled behind a boat in movement at moderate speed. Octopus bait is a static method in which the engine is turned off. It consists of a line with a hand-made plastic bait, filled with plumber and decorated with metallic spoons to produce noise in the water (see also Ferse et al., 2014). Fishermen repeatedly explained that they stay onboard tugging the line “like dancing” to produce sounds that attract octopus, while looking with goggles under the water to pull up the line when an octopus surrounded the bait with its arms because, in their words, “octopus is not always hungry but it is curious.” The boat speeds were allocated to the different fishing techniques based on interview results with fishermen and subsequently used to analyze the spatial data from the tracks.
Unless otherwise specified, GPS data was processed and analyzed by means of the statistical software RStudio (RStudio Inc. RStudio. Boston, USA; 2012) using the R version 3.3.1 (2016-06-21) (R Core Team, 2016). Additionally, the following packages were loaded: maps (Becker et al., 2016b), rgeos (Bivand and Rundel, 2016), mapdata (Becker et al., 2016a), maptools (VanDerWal et al., 2014; Nychka et al., 2015; Bivand and Lewin-Koh, 2016), xlsx (Dragulescu, 2014), rJava (Urbanek, 2016), plyr (Wickham, 2011), car (Fox and Weisberg, 2011), ggplot2 (Wickham, 2009).
The pool of tracks was used to delimit fishing areas following these steps: in R Studio, (1) reduce noise in speed using the smoothing function 3RSR to eliminate two-points length peaks and valleys (Tukey, 1977); (2) produce a histogram to identify the ranges of speed associated with fishing gears and traveling between landing/fishing sites. (3) In QGIS 2.8 Wien (QGIS Development Team, 2014), import tracks as point vector layers and merge into one layer with the plugin mmqgis (Minn, 2015), (4) filter by speed range, (5) rasterize the resulting vector layer using the tool “heatmap” (Cell size: 10 × 10 m square; radius: 500 m; cells with 0 points: transparent; render type: singleband pseudocolor; color interpolation: linear; accuracy: actual; Ghandi, 2015), (6) import a digitalized navigation map as basemap and increase transparency of the heatmap to see both layers, (7) draw polygons around neighboring areas of high density and similar local names. The final polygons will be referred to as “fishing grounds” hereafter. (8) Create a raster with less resolution (to protect the participant's knowledge; Metcalfe et al., 2016) summarizing the spatial distribution of the two fishing speeds with cell color representing the most frequent speed per cell.
Analysis of Fishing Effort
In order to quantify fishing effort, each trip was divided in periods, called fishing “actions,” defined as the part of the GPS track within a fishing ground (polygon in GIS) having a certain speed. Fishing effort per action was estimated by counting the number of points of the track inside the corresponding polygon, within the gears' speed class. The count was multiplied by the tracker's recording frequency (5 s) and transformed to hours of fishing effort. Distance to the home port (Badi) per action was estimated as the distance between the geometric mean latitude and longitude of all the points included in the action.
Potential associations in the use of certain gears at particular fishing grounds were explored in a contingency table analysis (Hammer, 2010). Input data was a matrix with fishing grounds in rows, gears in columns, and number of actions in cells. Gears with insufficient data were excluded. The analysis was done in PAST 2.17c (Hammer et al., 2001).
Differences in the average fishing time per action between different gears and fishing grounds were analyzed by means of the Mann Whitney U-Test in order to account for unequal sample sizes.
Description of Catch Data
Taxonomic composition of the catch was described in terms of percentages of each taxa in the total biomass. Fishes were grouped by families, and cephalopods by order. This was done separately for the two data subsets (boat tracking and catch landings survey) to explore potential sampling-dependent differences in target species. The data subsets were then pooled to measure catch abundance using the Catch per Unit of Effort (CPUE) index (Jul-Larsen et al., 2003). The measurement units were kg boat−1 day−1, meaning the average mass of the daily catch per boat. These units are consistent with previous literature on fisheries of Spermonde (Pet-Soede et al., 2001a). The CPUE estimates represent the total pool of catch data (boat tracking and catch landings survey), excluding the trips with zero catches.
Results
A total number of 157 fishing trips, accounting for 1,148 kg of seafood, were registered in this study. Boat tracking alone accounted for 86 trips, involving 140 actions and 457 fishing hours. Fishing trips lasted mostly 1 day (only two trips lasted 2-days), visiting shallow (< 15 m) and deep grounds (>30 m), locally called “taka” and “garassa,” respectively. Bad weather conditions rarely hindered fishing, which was done 6 days a week. In February and March 2015 some participants stopped fishing and dedicated their time to repairing their houses thanks to a public aid program. The catch was mainly sold to fish collectors linked to export trade networks, and only part of it was consumed locally. Sixty-two percent of the participants were associated to patrons or fish collectors via debts. For 80% of the participants, fishing was the only source of income.
Spatial Segregation of Fishing Gears
The histogram of boat speed values showed a bimodal distribution with one peak at 0 km/h and another at 7 km/h (Figure 2). This confirmed that some gears were used with static boat and others with the boat in movement, as described by the fishermen. Three classes of boat speed (slow, moderate, and fast) are defined and characterized in Table 2.
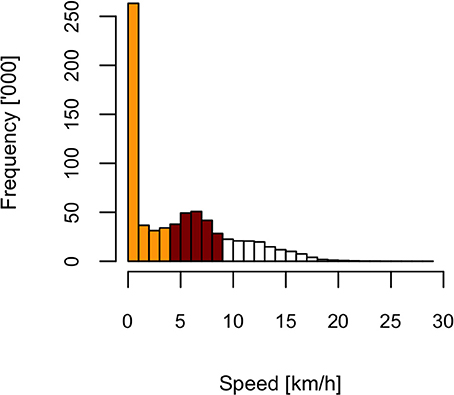
Figure 2. Histogram of speed values recorded with GPS-trackers during fishing trips in small boats. Recording frequency: 5 s. Colored bars represent the two fishing-speed classes used along the study (yellow: slow; red: moderate).
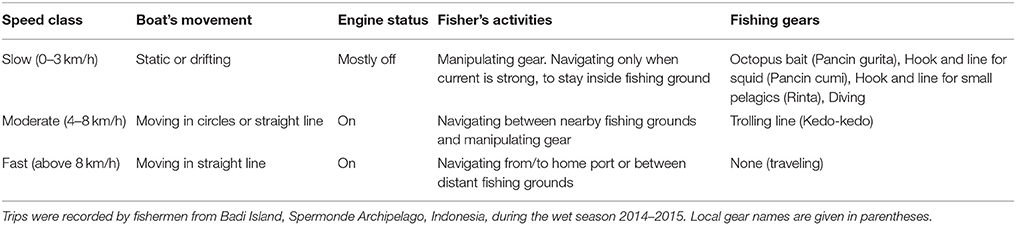
Table 2. Characteristics of the three fishing-boat speed classes derived from a histogram of speed from a pool of GPS tracks (Figure 2).
The total fishing area was divided in seven fishing grounds (Figure 3). Three grounds, called Badi, Tintingan, and Malla'bang (No 1, 4, and 6 in Figure 3), concentrated 84% of the fishing actions. They form a route starting in the shallow reefs (5–10 m) of Badi and Tintingan, until reaching the deeper (50 m) Malla'bang. Those routes were further used for the spatial analyses. The fishing grounds closer to the western border of the Archipelago (Figure 3) were visited before the beginning of the wet season, but were avoided by fishermen later due to safety reasons as the weather conditions worsened. The furthest fishing action was located 36.3 km NW of Badi Island.
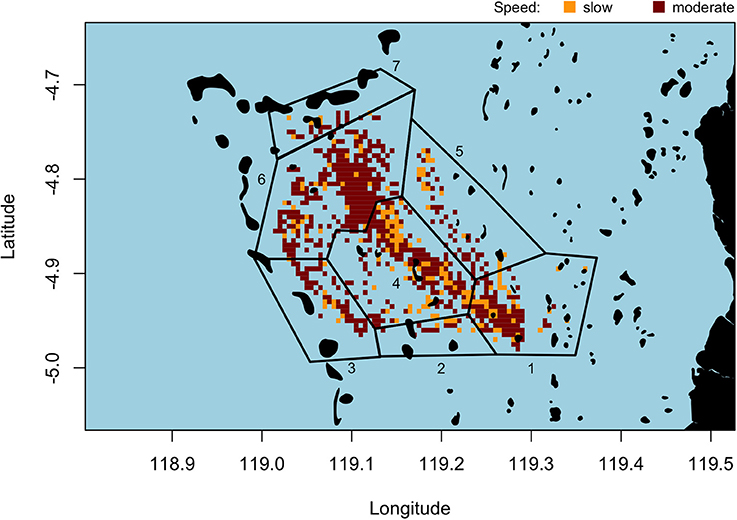
Figure 3. Map of fishing activity of hook and line fishermen from Badi Island, at two speeds associated with different gears. Cell color represents the prevalent fishing speed (slow: 0–3 km/h, moderate 4–8 km/h). Polygon numbers represent names of fishing grounds: (1) Badi, (2) Lumu-lumu, (3) Lanyukan, (4) Tintingan, (5) Sarappo, (6) Malla'bang, (7) Kondongbali. Resolution: 0.05 degrees latitude and longitude.
The main fishing gears represented in the spatial data were “trolling line” and “octopus bait.” In the contingency table results, these gears were significantly associated to specific fishing grounds (Chi2: 58.328, d.f.: 6, p < 0.01). Trolling line was more frequent in Badi, Tintingan, and Malla‘bang, while octopus bait only occurred in Badi and Tintingan. The average fishing time per action varied between 3 and 4 h for both gears in most fishing grounds (Figure 4). However, the fishing time per action of trolling line in Tintingan was with 1.2 h significantly lower than Octopus fishing in the same area (U = 1081, Z = 4.3, p < 0.01, r = 0.63) and trolling line in Malla'bang (U = 1540, Z = 4.6, p < 0.01, r = 0.62), while the differences to Badi were not significant.
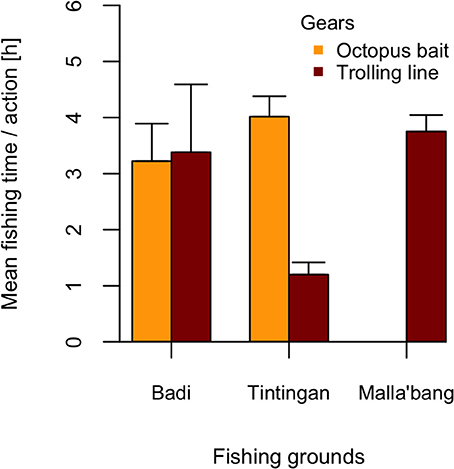
Figure 4. Differences in the mean fishing time per action in hours between two fishing gears and three fishing grounds in Spermonde Archipelago. Bars and error bars represent group mean and standard error, respectively.
Catch Diversity and Abundance
The taxonomic composition was similar between the catch data subsets obtained from interviews and catch landings surveys (Table 3). The highest percentage of biomass was made up by the Octopoda order. Species diversity was dominated by the Serranidae family, with 20 out of the 83 fish species identified. Within Serranidae, the most abundant species were Plectropomus leopardus, Plectropomus areolatus, and Pseudanthias sp. with 52.5, 23.5, and 9.1% of the taxon's catch landings, respectively. The Plectropomus species are sold in the LRFFT while Pseudanthias is used for local consumption.
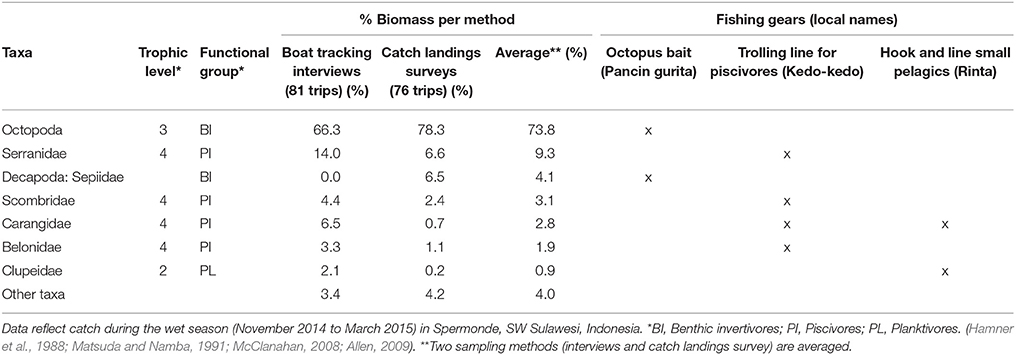
Table 3. Catch composition divided by taxa in relation to fishing gear.
CPUE estimates per fishing gear are presented in Table 4. Octopus bait had the highest CPUE, and exceeded almost 10 times the CPUE of the gear with the lowest CPUE (i.e., Hook and line squid). Trolling line for live grouper had a relatively low CPUE compared to other gears to target fishes.
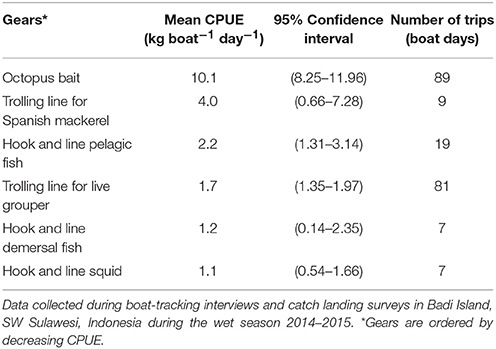
Table 4. Catch per unit of effort (CPUE) of the kapal katinting artisanal fishery in Spermonde.
Discussion
Boat tracking is an underexplored topic in the artisanal fisheries literature which deals with fishing boats which do not have satellite transponders, as opposed to industrial vessels where carrying Automatic Identification Systems (AIS) is standard practice (de Souza et al., 2016). The potential use of multiple gears in one trip hinders attempts to study basic features of fisheries such as fishing grounds and fishing effort allocation due to the uncertainty involved in determining the exact location where each gear was used and the amount of time spent on it. In this study, boat speed from GPS-recorded fishing trips was used as a proxy for fishing gear, anecdotal information from the trips was used to interpret the GPS tracks, and catch landings were described to quantify and map fishing effort in a multi-gear artisanal fishery.
Other studies in tropical artisanal fisheries have used GPS trackers to sample fishing effort in multiple communities, being able to extrapolate their results to a regional scale with direct application to spatial marine resource management (Daw et al., 2011; Metcalfe et al., 2016). Instead, our sampling focused on one island and one boat type, and enabled us to obtain a more detailed description of fishing ground use.
Identification of Fishing Grounds in Multi-gear Artisanal Fisheries Using Boat Speed
The method used to identify fishing grounds in this multi-gear fishery consisted in dividing the trip in shorter periods, and the seascape in fishing zones based on the fishermen's own classification, attempting to capture the decisions they made throughout the fishing day (i.e., what, where, and for how long to fish), and quantify the effort invested. A key element in this approach is boat speed due to its ability to differentiate fishing from non-fishing periods. The potential use of speed for this purpose was already pointed out by Daw et al. (2011) in tracking artisanal boats from East Africa. More recently, Alvard et al. (2015), presented a Partial Sum Method to automatically identify fishing activity based on speed, complementing their boat tracking data with onboard observations in a single-gear artisanal fishery from the Caribbean. In our case, working with speed-based criteria alone was not enough to quantify, because there were multiple fishing gears involved per trip, including cases where a single speed class could involve more than one gear. Therefore, we consider that the inclusion of anecdotal information remains essential in the data analysis for multi-gear artisanal fisheries, and this can be easily included in the sampling protocols by doing brief interviews after the fishermen have rested from work and are willing to talk.
Another reason to include traditional interview methods in boat tracking studies is that artisanal fisheries are very diverse, and GPS setting up and data processing may require different configurations. For instance, Alvard et al. (2015) worked with hand-line fishermen in Dominica, and identified three speed ranges far above the ones described in this study (Table 5), probably because in that case the boats had more powerful engines, and perhaps also for differences in the behavior of target species because they target tuna (Scombridae), marlin (Istiophoridae), and dolphinfishes (Coryphaenidae) that swim faster than the groupers. Therefore, research plans should still include procedures to characterize the fishing gears and fishermen's knowledge on how to use them.
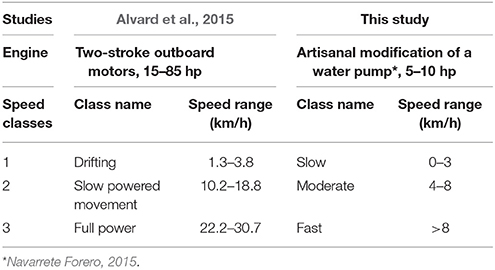
Table 5. Differences in boat speed in two study cases in relation to the type of prevailing engine.
Mapping Fishing Effort Allocation
Characterizing fishing effort and spatial extent of coastal fisheries is important for effective management of marine resources because fishing areas are often overestimated (Stewart et al., 2010), which hinders the design of spatial use regulations. Like in other cases (Daw et al., 2011; Alvard et al., 2015; Metcalfe et al., 2016), the map obtained in this study (Figure 3) clearly shows that fishing effort is not evenly distributed in the area around Badi but focused on specific fishing grounds. This type of information can be useful for spatial zonation for management planning, but should be complemented with GPS tracking data from other islands and seasons, and combined with knowledge of the informal institutions ruling the access to these fishing grounds (Deswandi, 2012; Gorris, 2016). Successful management strategies found in Sulawesi include No-Take Areas in Wakatobi (Unsworth et al., 2007) and area-specific stewardship for a marine territory in Spermonde's Langkai Island (Gorris, 2016), among others, which are routinely monitored by local enforcement mechanisms. However, implementing spatial management strategies in the two main areas identified in this study (Tintingan and Malla'bang) will be extremely challenging because there are no inhabited islands nearby where communities could engage in the enforcement of informal rules to manage these resources and protect them from destructive fishing practices (Glaser et al., 2010).
The distance traveled by participants (up to 35 km) was relatively high compared to the estimates in places like Seychelles, Indian Ocean (< 5 km; Daw et al., 2011) and the Congo (2–20 km; Metcalfe et al., 2016). Pet-Soede et al. (2001a) reported a travel distance of 6.2 km for the gear trolling line for live grouper, but their average represented data collected from fishermen from all over the Archipelago and their sampling methods were different (i.e., based on a research vessel), therefore it is uncertain whether there was an actual increase in travel distance.
Our results on fishing effort allocation among fishing grounds suggest that fishermen associate each area to a group of target species and their corresponding gears. When using the appropriate gear for a certain area, they spent a “standard” amount of time fishing there (in our case, 3–4 h). When they chose a less fit gear in a fishing ground, they spend less time doing so (1 h). The last was the case of fishermen trolling line for live grouper in a shallow reef area like Tintingan (5–10 m), where groupers abundance should not be expected to be optimal since the habitat of this group has been found to be located below 10 m with an abundance peak at 15–20 m depth (Unsworth et al., 2007). Correspondingly, there were no attempts to catch octopi in the deep area of Malla'bang because, according to fishermen, Spermonde's species inhabit shallow waters (Pers. obs.). Considering that Tintingan area is on the way to the hotspot for trolling line (Malla'bang), it might make sense for fishermen to try trolling line in Tintingan despite having low success chances. Perhaps this reflects that other drivers, such as market demand, also affect fishermen's effort allocation decisions. Market information is transferred to fishermen via a chain of exporters, transport middlemen and patrons. Based on this information, fishermen exploit particular fishing grounds in order to obtain the resources, which are then passed through the same chain of traders in reverse order until reaching consumers (Ferse et al., 2014).
Links between Spermonde's Fishing Grounds and Global Seafood Markets
In our study case, catch composition was dominated by species sold in international markets. On one hand, groupers have been target species in Spermonde for decades (Radjawali, 2012; Ferse et al., 2014). We found the same CPUE for trolling line for live groupers (1.7 kg boatday−1) as reported for Spermonde Archipelago by Pet-Soede et al. (2001a). However, the cited study also reported spatial and temporal differences in CPUE throughout the year, and the area where our participants actually fished was reported to have 2.1–3.3 kg boatday−1 CPUE during the rainy season (Pet-Soede et al., 2001a). A decrease in CPUE may be due to several factors (e.g., increase in the number of fishermen and changes in gear efficiency, among others), but it could also reflect a local decrease in groupers' abundance, which would not be surprising given the extended use of cyanide as fishing method to target this group (Radjawali, 2011). To continue supplying the international demand for LRFF, good fishing practices such as the use of trolling line instead of cyanide diving should be encouraged among fishermen.
On the other hand, octopus has only recently appeared in the scientific literature of this region (Ferse et al., 2014; Miñarro et al., 2016) and this study provides the first quantitative report of CPUE for this target group in the area. This reflects the dynamic nature of artisanal fisheries' social-ecological systems in terms of adaptation to new market demands and/or resource availability (Schwerdtner Mánez and Ferse, 2010). Octopus demand from Asian fisheries has increased in recent years, potentially associated with the decline of the Mediterranean octopus production (Pauly and Zeller, 2015). In parallel, increase in octopus abundance worldwide (Doubleday et al., 2016) might be also propelling this fishery. The identification and conservation of the fishing grounds where these species are fished is a key issue for the sustainability of this emerging fishery and can benefit from monitoring programs using GPS tracking technology and the speed ranges reported in this study.
Future Research
The present study represents a step forward in applying tracking technology to the study of artisanal fisheries. This approach can be used in impact assessment studies. Potentially, it could also be used to assess social and economic influences on fishing behavior that are matter of debate in Spermonde, such as the influence of fish traders on the fishing behavior of the fishermen with whom they establish a “patron-client relationship” (Foster, 1961; Chozin, 2008; Deswandi, 2012; Radjawali, 2012; Miñarro et al., 2016). Our findings also point at the importance of conducting stock assessments of commercial species such as groupers and octopi to estimate the fishing effort that could be exerted on these resources without compromising their sustainability. The collection of length-frequency data is particularly suitable in the context of tropical artisanal fisheries and would allow applying length-based stock assessments, as well as investigating the length preferences in the length-selective fisheries for live fish trade (Mildenberger et al., 2017).
Concluding Remarks
This study contributes to the knowledge of Spermonde's artisanal fishery with the identification of the spatial segregation of two of the most important fishing gears in the fishing community of Badi Island. It has shown that effort allocation is different among areas due to differences in availability of target species, and that these must be differentiated to create a realistic interpretation of fishermen's behavior. These findings are important to account for in the design of management strategies to increase their chances of succeeding in this highly complex and dynamic system. The catch composition reveals a rapidly changing fishery that needs effective management, control, and monitoring tools. Participation in the boat tracking exercise was attractive to fishermen, who were concerned about the future of their activity. Their willingness to cooperate in the study, combined with simple and short interviews after the fishing trips allowed a good understanding between fishermen and researchers. This shows that participatory boat tracking is a useful tool to study fishing effort allocation in artisanal fisheries, especially if combined with anecdotal information from participant fishermen.
Author Contributions
HR, SM, AB, and GN: planned the study; GN and SM: designed the field forms and questionnaires; GN: collected the data; S: provided historical datasets of P. leopardus, assisted species identification in Makassar in 2014–2015; TM: implemented the algorithm for spatial analysis and conducted statistical analyses; GN: prepared a first draft of the manuscript including analyses by TM, SM, and HR, a literature review by AB, and all coauthors contributed to the final version.
Funding
This study was carried out within the frame of the Indonesian-German SPICE Program (Science for the Protection of Indonesian Coastal Marine Ecosystems). The SPICE research program is funded by the German Federal Ministry of Education and Research (BMBF, Grant no. FKZ 03F0643A). Also, the German Academic Exchange Service (DAAD) financed part of the study through the scholarship. PKZ: A/13/91883 given to GNF. Studies by SS were supported by Directorate of Higher Education, Republic of Indonesia.
Conflict of Interest Statement
The authors declare that the research was conducted in the absence of any commercial or financial relationships that could be construed as a potential conflict of interest.
Acknowledgments
We thank the kindness and hospitality of Badi Island's Community. Thanks to Andi M. Yusuf, Adriani Mutmainah, Amanda Putri, Zulung Walyandra, Johannes Leins, Budimawan, Dewi, Hafez, Neil Muhammad, Sebastian Ferse, Sainab Husain for support in Indonesia and Bremen. Thanks to Lida Pet-Soede for providing relevant information of Spermonde's octopus fisheries.
References
Allen, G. A. (2009). Field Guide to Marine Fishes of Tropical Australia and South-East Asia, 4th Edn. Weshpool: Western Australian Museum.
Alvard, M., Carlson, D., and McGaffey, E. (2015). Using a partial sum method and GPS tracking data to identify area restricted search by artisanal fishers at moored fish aggregating devices in the Commonwealth of Dominica. PLoS ONE 10:e0115552. doi: 10.1371/journal.pone.0115552
Baigún, C. R. M. (2013). Manual Para la Gestión Ambiental de la Pesca Artesanal y las Buenas Prácticas Pesqueras en la Cuenca del río Paraná, Argentina, 1st Edn, eds M. Andelman and C. Penedo. Barracas: Wetlands International.
Barclay, K., Voyer, M., Mazur, N., Payne, A. M., Mauli, S., Kinch, J., et al. (2017). The importance of qualitative social research for effective fisheries management. Fish. Res. 186, 426–438. doi: 10.1016/j.fishres.2016.08.007
Baum, G., Kusumanti, I., Breckwoldt, A., Ferse, S. C., Glaser, M., Dwiyitno et al. (2016). Under pressure: investigating marine resource-based livelihoods in Jakarta Bay and the Thousand Islands. Mar. Pollut. Bull. 110, 778–789. doi: 10.1016/j.marpolbul.2016.05.032
Becker, R. A., Wilks, A. R., and Brownrigg, R. (2016a). mapdata: Extra Map Databases. R Package Version 2.2-6. Available online at: https://cran.r-project.org/web/packages/mapdata/index.html (Accessed December 30, 2016).
Becker, R. A., Wilks, A. R., Brownrigg, R., Minka, T. P., and Deckmyn, A. (2016b). maps: Draw Geographical Maps. R Package Version 3.1.1. Available online at: https://cran.r-project.org/web/packages/maps/index.html (Accessed December 30, 2016).
Béné, C. (2006). Small-Scale Fisheries : Assessing Their Contribution to Rural Livelihoods in Developing Countries. FAO Fisheries Circular, No. 1008, 57.
Bivand, R., and Lewin-Koh, N. (2016). maptools: Tools for Reading and Handling Spatial Objects. R Package Maptools Version 0.8-40. Comprehensive R Archive Network (CRAN).
Bivand, R., and Rundel, C. (2016). Interface to Geometry Engine - Open Source (GEOS). R Package Rgeos Version 0.3-21. Comprehensive R Archive Network (CRAN).
Breitkopf, V. (2014). The Factors behind the Choice of a Fishing Gear and Fishing Location in Spermonde Archipelago, South Sulawesi, Indonesia. Bremen University, International Studies of Tropical Aquatic Ecology.
Chozin, M. (2008). Illegal but Common: Life of Blast Fishermen in the Spermonde Archipelago, South Sulawesi, Indonesia. Ohio University, Center for International Studies.
Cohen, P. J., and Steenbergen, D. J. (2015). Social dimensions of local fisheries co-management in the Coral Triangle. Environ. Conserv. 42, 278–288. doi: 10.1017/S0376892914000423
Costello, C., Ovando, D., Hilborn, R., Gaines, S. D., Deschenes, O., and Lester, S. E. (2012). Status and solutions for the World's unassessed fisheries. Science 338, 517–520. doi: 10.1126/science.1223389
Crona, B., Nyström, M., Folke, C., and Jiddawi, N. (2010). Middlemen, a critical social-ecological link in coastal communities of Kenya and Zanzibar. Mar. Policy 34, 761–771. doi: 10.1016/j.marpol.2010.01.023
Crona, B. I., Van Holt, T., Petersson, M., Daw, T. M., and Buchary, E. (2015). Using social–ecological syndromes to understand impacts of international seafood trade on small-scale fisheries. Glob. Environ. Change 35, 162–175. doi: 10.1016/j.gloenvcha.2015.07.006
Crowder, L. B., Hazen, E. L., Avissar, N., Bjorkland, R., Latanich, C., and Ogburn, M. B. (2008). The impacts of fisheries on marine ecosystems and the transition to ecosystem-based management. Annu. Rev. Ecol. Evol. Syst. 39, 259–278. doi: 10.1146/annurev.ecolsys.39.110707.173406
CTI-CFF (2015). Coral Triangle Initiative on Coral Reefs, Fisheries and Food Security. Available online at: http://www.coraltriangleinitiative.org/country/indonesia
Daw, T., Maina, J., Cinner, J., Robinson, J., Collaborators, K., Gerry, C., et al. (2011, December). The spatial behaviour of artisanal fishers: Implications for fisheries management and development. Fishers in Space, 1–79.
Daw, T. M. (2008). Spatial distribution of effort by artisanal fishers: exploring economic factors affecting the lobster fisheries of the Corn Islands, Nicaragua. Fish. Res. 90, 17–25. doi: 10.1016/j.fishres.2007.09.027
De Freitas, D. M., and Tagliani, P. R. (2009). The use of GIS for the integration of traditional and scientific knowledge in supporting artisanal fisheries management in southern Brazil. J. Environ. Manage. 90, 2071–2080. doi: 10.1016/j.jenvman.2007.08.026
de Souza, E. N., Boerder, K., Matwin, S., Worm, B., Halpern, B., Walbridge, S., et al. (2016). Improving fishing pattern detection from satellite AIS using data mining and machine learning. PLoS ONE 11:e0158248. doi: 10.1371/journal.pone.0158248
Deswandi, R. (2012). Understanding Institutional Dynamics : The Emergence, Persistence, and Change of Institutions in Fisheries in Spermonde Archipelago, South Sulawesi, Indonesia. Bremen University, Fachbereich Sozialwissenschaften.
Deutsche Forschungsgemeinschaft (DFG) (2013). Safeguarding Good Scientific Practice. Recommendations of the Commission on Professional Self Regulation in Science. Weinheim: WILEY-VCH Verlag GmbH & Co. KGaA.
Doubleday, Z. A., Prowse, T. A., Arkhipkin, A., Pierce, G. J., Semmens, J., Steer, M., et al. (2016). Global proliferation of cephalopods. Curr. Biol. 26, R406–R407. doi: 10.1016/j.cub.2016.04.002
Dragulescu, A. A. (2014). xlsx: Read, Write, Format Excel 2007 and Excel 97/2000/XP/2003 Files. R Package Version 0.5.7. Available online at: https://cran.r-project.org/web/packages/xlsx/index.html (Accessed December 30, 2016).
Edinger, E., Jompa, J., Limmon, G., Widjatmoko, W., and Risk, M. (1998). Reef degradation and coral biodiversity in Indonesia: effects of land-based pollution, destructive fishing practices and changes over time. Mar. Pollut. Bull. 36, 617–630. doi: 10.1016/S0025-326X(98)00047-2
FAO (2013). Types of fisheries, Fisheries and Aquaculture Department Fact sheets. Food and Agriculture Organization of the United Nations. Available online at: http://www.fao.org/fishery/topic/12306/en (Accessed May 18, 2015).
FAO (2014). The State of World Fisheries and Aquaculture. Rome: Food and Agriculture Organization of the United Nations.
FAO (2017). FAO Global Capture Production Database Updated to 2015 - Summary Information. Rome: Food and Agriculture Organization of the United Nations. Available online at: http://www.fao.org/3/a-br186e.pdf (Accessed June 17, 2017).
Ferrol-Schulte, D., Gorris, P., Baitoningsih, W., Adhuri, D. S., and Ferse, S. C. A. (2015). Coastal livelihood vulnerability to marine resource degradation: a review of the Indonesian national coastal and marine policy framework. Mar. Policy 52, 163–171. doi: 10.1016/j.marpol.2014.09.026
Ferse, S. C. A., Glaser, M., Neil, M., and Schwerdtner Mánez, K. (2014). To cope or to sustain? Eroding long-term sustainability in an Indonesian coral reef fishery. Reg. Environ. Change 14, 2053–2065. doi: 10.1007/s10113-012-0342-1
Foster, G. M. (1961). The dyadic contract in Tzintzuntzan, II: patron-client relationship. Am. Anthropol. 65, 1280–1294. doi: 10.1525/aa.1963.65.6.02a00040
Fox, J., and Weisberg, S. (2011). An {R} Companion to Applied Regression, 2nd Edn. Thousand Oaks, CA: Sage. Available online at: http://socserv.socsci.mcmaster.ca/jfox/Books/Companion/ (Accessed December 30, 2016).
Ghandi, U. (2015). Creating Heatmaps, QGIS Tutorials and Tips. Available online at: http://www.qgistutorials.com/es/docs/creating_heatmaps.html (Accessed July 20, 2015).
Glaser, M., Baitoningsih, W., Neil, M., and Ferse, S. (2010). Whose sustainability? Top-down participation and emergent rules in protected area management - Local lessons for MPA design from Indonesia. Mar. Policy 34, 1215–1225. doi: 10.1016/j.marpol.2010.04.006
Glaser, M., Breckwoldt, A., Deswandi, R., Radjawali, I., Baitoningsih, W., and Ferse, S. C. A. (2015). Of exploited reefs and fishers – A holistic view on participatory coastal and marine management in an Indonesian archipelago. Ocean Coast. Manage. 116, 193–213. doi: 10.1016/j.ocecoaman.2015.07.022
Glaser, M., Ferse, S., Neil, M., Plass-Johnson, J., Dewi, Y., Teichberg, M., et al. (accepted). Breaking resilience for a sustainable future: thoughts for the anthropocene. Front. Mar. Sci.
Gorris, P. (2016). Deconstructing the reality of community-based management of marine resources in a small island context in Indonesia. Front. Mar. Sci. 3:120. doi: 10.3389/fmars.2016.00120
Hajramurni, A. (2015). Explosion Kills Two in Makassar. Jakarta Post. Available online at: http://www.thejakartapost.com/news/2015/08/03/explosion-kills-two-makassar.html (Accessed August 3, 2015).
Hammer, Ø. (2010). PAST PAleontological STatistics Version 2.17 Reference Manual. Natural History Museum. University of Oslo, 229. Available online at: http://folk.uio.no/ohammer/past/
Hammer, Ø., Harper, D. A. T., and Ryan, P. D. (2001). PAST: Paleontological statistics software package for education and data analysis. Palaeontol. Electron. 4:9. Available online at: http://folk.uio.no/ohammer/past/past3manual.pdf
Hamner, W. M., Jones, M. S., Carleton, J. H., Hauri, I. R., and McB, D. (1988). Zooplankton, planktivorous fish, and water currents on a windward reef face: great Barrier Reef, Australia. Bull. Mar. Sci. 42, 459–479.
Heazle, M., and Butcher, J. G. (2007). Fisheries depletion and the state in Indonesia: towards a regional regulatory regime. Mar. Policy 31, 276–286. doi: 10.1016/j.marpol.2006.08.006
Imran, A. M., Kaharuddin, M. S., Suriamihardja, D. A., and Sirajuddin, H. (2013). “Geology of spermonde platform,” in Conference: Proceedings of the 7th International Conference on Asian and Pacific Coasts (APAC 2013) (Bali).
Jennings, S., Kaiser, M. J., Reynolds, J. D., Jennings, S., and Kaiser, M. J. (2001). Marine Fisheries Ecology. Oxford; Northampton: Blackwell Publishing.
Jompa, J., and Yusuf, S. (2012). “First quantitative assessment of coral bleaching on indonesian reefs,” in Proceedings of the 12th International Coral Reef Symposium (Cairns, QLD), 1–5.
Jul-Larsen, E., Kolding, J., Overaå, R., Raakjær Nielsen, J. and van Zwieten, P. A. M. (2003). Mangement, co-Management or No Management? Major Dilemmas in Southern African Freshwater Fisheries. 1. Synthesis report, FAO Fisheries Technical paper, No. 426/1, Rome.
Koenigstein, S., Mark, F. C., Gößling-Reisemann, S., Reuter, H., and Poertner, H.-O. (2016). Modelling climate change impacts on marine fish populations: process-based integration of ocean warming, acidification and other environmental drivers. Fish Fish. 17, 972–1004. doi: 10.1111/faf.12155
Mangold (1922-2003). K. M. and Young, R. E. (2016). Sepiidae Keferstein. 1866. Version 29 August 2016 (under construction). Available online at: http://tolweb.org/Sepiidae/19987/2016.08.29 in The Tree of Life Web Project, http://tolweb.org/ (Accessed November 13, 2016).
Mangold (1992-2003), K. M., Young, R. E., and Vecchione, M. (2010). Octopoda Leach, 1818. Octopods or Devilfishes. Version 03 May 2010 (under construction). Available online at: http://tolweb.org/Octopoda/20083/2010.05.03 in The Tree of Life Web Project, http://tolweb.org/ (Accessed November 13, 2016).
Matsuda, H., and Namba, T. (1991). Food web graph of a coevolutionarily stable community. Ecology 72, 267–276. doi: 10.2307/1938920
McClanahan, T. R. (2008). “Food-web structure and dynamics of East African coral reefs,” in Food Webs and the Dynamics of Marine Reefs, eds T. R. McClanahan and G. M. Branch (New York, NY: Oxford University Press), 249.
Metcalfe, K., Collins, T., Abernethy, K. E., Boumba, R., Dengui, J. C., Miyalou, R., et al. (2016). Addressing uncertainty in marine resource management; combining community engagement and tracking technology to characterize human behavior. Conserv. Lett. 10, 460–469. doi: 10.1111/conl.12293
Miñarro, S., Navarrete, G., Reuter, H., Van Putten, I. E., Navarrete Forero, G., Reuter, H., et al. (2016). The role of patron-client relations on the fishing behaviour of artisanal fishermen in the Spermonde Archipelago (Indonesia). Mar. Policy 69, 73–83. doi: 10.1016/j.marpol.2016.04.006
Mildenberger, T. K., Taylor, M., and Wolff, M. (2017). TropFishR: an R package for fisheries analysis with length-frequency data. Methods Ecol. Evol. 8, 1520–1527. doi: 10.1111/2041-210X.12791
Minn, M. (2015). mmqgis. QGIS. Available online at: http://michaelminn.com/linux/mmqgis/
Navarrete Forero, G. (2015). Location, Use and Selection of Fishing Grounds in Spermonde Archipelago, Indonesia : The Case of Hook and Line Fishers from Badi Island. A thesis presented to In partial fulfillment of the requirements in International Studies of Aquatic Tropical Ecolo. University of Bremen & Leibniz Centre for Tropical Marine Research.
Nychka, D., Furrer, R., Paige, J., and Sain, S. (2015). fields:Tools for Spatial Data. Available online at: http://www.image.ucar.edu/fields/ (Accessed December 30, 2016).
Pauly, D., and Zeller, D. (2015). Sea Around Us Concepts, Design and Data (seaaroundus.org). Available online at: http://www.seaaroundus.org/data/#/global?chart=catch-chart&dimension=country&measure=tonnage&limit=10 (Accessed June 17, 2017).
Pauly, D., and Zeller, D. (2016). Catch reconstructions reveal that global marine fisheries catches are higher than reported and declining. Nat. Commun. 7:10244. doi: 10.1038/ncomms10244
Pet-Soede, C., Machiels, M. A. M., Stam, M. A., and Van Densen, W. L. T. (1999). Trends in an Indonesian coastal fishery based on catch and effort statistics and implications for the perception of the state of the stocks by fisheries officials. Fish. Res. 42, 41–56. doi: 10.1016/S0165-7836(99)00034-X
Pet-Soede, C., Van Densen, W. L. T., Hiddink, J. G., Kuyl, S., and Machiels, M. A. M. (2001a). Can fishermen allocate their fishing effort in space and time on the basis of their catch rates? An example from Spermonde Archipelago, SW Sulawesi, Indonesia. Fish. Manage. Ecol. 8, 15–36. doi: 10.1046/j.1365-2400.2001.00215.x
Pet-Soede, C., Van Densen, W. L. T., Pet, J. S., and Machiels, M. A. M. (2001b). Impact of Indonesian coral reef fisheries on fish community structure and the resultant catch composition. Fish. Res. 51, 35–51. doi: 10.1016/S0165-7836(00)00236-8
Pet-Soede, L., and Erdmann, M. (1998). An overview and comparison of destructive fishing practices in Indonesia. SPC Live Reef Fish Information Bulletin, (April), 28–36. Available online at: http://www.spc.int/DigitalLibrary/Doc/FAME/InfoBull/LRF/4/LRF4_28_Pet-Soede.pdf
QGIS Development Team (2014). QGIS Geographic Information System. Open Source Geospatial Foundation Project. Available online at: https://www.qgis.org/
Radjawali, I. (2011). Social networks and Live Reef Food Fish (LRFF) Trade: examining sustainability. J. Indones. Soc. Sci. Human. 4, 67–102. Available online at: https://dspace.library.uu.nl/handle/1874/256165
Radjawali, I. (2012). Examining local conservation and development: live reef food fishing in Spermonde Archipelago, Indonesia. Rev. Gestão Cost. Integr. 12, 545–557. doi: 10.5894/rgci337
R Core Team (2016). R: A Language and Environment for Statistical Computing. Vienna: R Foundation for Statistical Computing.
Schwerdtner Mánez, K., and Ferse, S. C. (2010). The history of makassan trepang fishing and trade. PLoS ONE 5:e11346. doi: 10.1371/journal.pone.0011346
Schwerdtner Mánez, K., Husain, S., Ferse, S. C. A., and Má-ez Costa, M. (2012). Water scarcity in the Spermonde Archipelago, Sulawesi, Indonesia : past, present and future. Environ. Sci. Policy 23, 74–84. doi: 10.1016/j.envsci.2012.07.004
Stewart, K. R., Lewison, R. L., Dunn, D. C., Bjorkland, R. H., Kelez, S., Halpin, P. N., et al. (2010). Characterizing fishing effort and spatial extent of coastal fisheries. PLoS ONE 5:e14451. doi: 10.1371/journal.pone.0014451
Teh, L. C. L., Teh, L. S. L., and Meitner, M. J. (2012). Preferred resource spaces and fisher flexibility: implications for spatial management of small-scale fisheries. Hum. Ecol. 40, 213–226. doi: 10.1007/s10745-012-9464-9
Teichberg, M., Wild, C., Bednarz, V. N., Kegler, H., Lukman, M. J., Gärdes, A., et al. (accepted). Spatio-temporal patterns in coral reef communities of the Spermonde Archipelago, 2012-2014, I: Comprehensive reef monitoring of water and benthic indicators reflect changes in reef health. Front. Mar. Sci.
Tukey, J. W. (1977). Exploratory Data Analysis. Menlo Park, CL; London; Amsterdam; Don Mills, ON; Sydney, NSW: Addison-Wesley.
Turner, R. A., Polunin, N. V. C., and Stead, S. M. (2015). Mapping inshore fisheries: comparing observed and perceived distributions of pot fishing activity in Northumberland. Mar. Policy 51, 173–181. doi: 10.1016/j.marpol.2014.08.005
Unsworth, R. K. F., Powell, A., Hukom, F., and Smith, D. J. (2007). The ecology of Indo-Pacific grouper (Serranidae) species and the effects of a small scale no take area on grouper assemblage, abundance and size frequency distribution. Mar. Biol. 152, 243–254. doi: 10.1007/s00227-007-0675-3
Urbanek, S. (2016). rJava: Low-Level R to Java Interface. R Package Version 0.9-8, 2016. Available online at: https://cran.r-project.org/web/packages/rJava/index.html (Accessed December 30, 2016).
VanDerWal, J., Falconi, L., Januchowski, S., Shoo, L., and Storlie, C. (2014). SDMTools: Species Distribution Modelling Tools: Tools for Processing Data Associated with Species Distribution Modelling Exercises. R Package Version 1.1-221. Available online at: https://cran.r-project.org/web/packages/SDMTools/index.html (Accessed December 30, 2016).
Varkey, D. A., Ainsworth, C. H., Pitcher, T. J., Goram, Y., and Sumaila, R. (2010). Illegal, unreported and unregulated fisheries catch in Raja Ampat Regency, Eastern Indonesia. Mar. Policy 34, 228–236. doi: 10.1016/j.marpol.2009.06.009
Wallace, A. P., Jones, J. P., Milner-Gulland, E. J., Wallace, G. E., Young, R., and Nicholson, E. (2016). Drivers of the distribution of fisher effort at Lake Alaotra, Madagascar. Hum. Ecol. 44, 105–117. doi: 10.1007/s10745-016-9805-1
Keywords: artisanal fisheries, coral reef fisheries, GPS tracking, Indonesia, participatory data collection
Citation: Navarrete Forero G, Miñarro S, Mildenberger TK, Breckwoldt A, Sudirman and Reuter H (2017) Participatory Boat Tracking Reveals Spatial Fishing Patterns in an Indonesian Artisanal Fishery. Front. Mar. Sci. 4:409. doi: 10.3389/fmars.2017.00409
Received: 19 March 2017; Accepted: 29 November 2017;
Published: 12 December 2017.
Edited by:
Simone Libralato, National Institute of Oceanography and Experimental Geophysics, ItalyReviewed by:
Sanja Matic-Skoko, Institute of Oceanography and Fisheries, CroatiaDimitrios K. Moutopoulos, Technological Educational Institute of Messolonghi, Greece
Copyright © 2017 Navarrete Forero, Miñarro, Mildenberger, Breckwoldt, Sudirman and Reuter. This is an open-access article distributed under the terms of the Creative Commons Attribution License (CC BY). The use, distribution or reproduction in other forums is permitted, provided the original author(s) or licensor are credited and that the original publication in this journal is cited, in accordance with accepted academic practice. No use, distribution or reproduction is permitted which does not comply with these terms.
*Correspondence: Gabriela Navarrete Forero, Z25hdmFyckBlc3BvbC5lZHUuZWM=