 Rebecca J. Gast
 Scott A. Fay
 Robert W. Sanders
- 1Biology Department, Woods Hole Oceanographic Institution, Woods Hole, MA, United States
- 2Biology Department, Temple University, Philadelphia, PA, United States
- 3Invitae, San Francisco, CA, United States
Identifying putative mixotrophic protist species in the environment is important for understanding their behavior, with the recovery of these species in culture essential for determining the triggers of feeding, grazing rates, and overall impact on bacterial standing stocks. In this project, mixotroph abundances determined using tracer ingestion in water and sea ice samples collected in the Ross Sea, Antarctica during the summer of 2011 were compared with data from the spring (Ross Sea) and fall (Arctic) to examine the impacts of bacterivory/mixotrophy. Mixotrophic nanoplankton (MNAN) were usually less abundant than heterotrophs, but consumed more of the bacterial standing stock per day due to relatively higher ingestion rates (1–7 bacteria mixotroph−1 h−1 vs. 0.1–4 bacteria heterotroph−1 h−1). Yet, even with these high rates observed in the Antarctic summer, mixotrophs appeared to have a smaller contribution to bacterivory than in the Antarctic spring. Additionally, putative mixotroph taxa were identified through incubation experiments accomplished with bromodeoxyuridine-labeled bacteria as food, immunoprecipitation (IP) of labeled DNA, and amplification and high throughput sequencing of the eukaryotic ribosomal V9 region. Putative mixotroph OTUs were identified in the IP samples by taxonomic similarity to known phototroph taxa. OTUs that had increased abundance in IP samples compared to the non-IP samples from both surface and chlorophyll maximum (CM) depths were considered to represent active mixotrophy and include ones taxonomically similar to Dictyocha, Gymnodinium, Pentapharsodinium, and Symbiodinium. These OTUs represent target taxa for isolation and laboratory experiments on triggers for mixotrophy, to be combined with qPCR to estimate their abundance, seasonal distribution and potential impact.
Introduction
Phagotrophic protists are key constituents of aquatic food webs, transferring energy and organic matter to higher trophic levels (Caron et al., 2012). In the Southern Ocean, protists are reported to remove as much as 100% of the daily bacterial production (Becquevort et al., 2000; Anderson and Rivkin, 2001; Vaqué et al., 2004; Duarte et al., 2005), but compared to other oceanic areas, there are still relatively few data estimating bacterivory in Antarctic marine waters, and even less knowledge of the nature of the bacterivorous community. Information on bacterivorous protist abundance and activity can be realized via the use of fluorescent tracer particles of an appropriate size since this approach allows visual confirmation of phagotrophy. For example, Becquevort (1997) used fluorescently labeled bacteria (FLB) to identify small (<5 μm) heterotrophic nanoflagellates (HNAN), especially dinoflagellates, as important bacterivores during early spring in the Atlantic sector of the Southern Ocean, while small choanoflagellates were the major bacterivores in the Indian Ocean sector (Becquevort et al., 2000). Over the past two decades, Antarctic marine bacterivory studies have used ingestion methods to examine the bacterial grazing rates and impacts of protists, with highly variable results reported (Putt et al., 1991; James et al., 1995; Leakey et al., 1996; Pedrós-Alió et al., 1996; Vaqué et al., 2002; Pearce et al., 2010, 2011). In most of these reports, HNAN had ingestion rates of < 10 bacterial cells HNAN−1 per day, although some were as high as 67 bacterial cells HNAN−1 per day (Vaqué et al., 2002). The impact on daily bacterial production ranged from not detectable to greater than 120%. This variability is not unique to the Antarctic, or polar regions, (Sherr et al., 1989; Sanders et al., 2000; Vaqué et al., 2014) and is likely due to a combination of factors including HNAN species composition (Boenigk and Arndt, 2002), the patchy nature of aquatic environmental samples and the presence, abundance and activity of mixotrophic nanoplankton (MNAN).
Fluorescent tracers have also been important in identifying the widespread impact of phagotrophic phytoflagellates (mixotrophs) as bacterivores. Anecdotal accounts of mixotrophs have long existed, but in the last 30 years there has been a growing recognition of the wide geographic and taxonomic distributions of species that combine photosynthesis with consumption of particulate food (Sanders and Porter, 1988; Havskum and Hansen, 1997; Stoecker et al., 2017). Furthermore, the ecological impact of mixotrophs has the potential to be substantial. Mixotrophic phytoflagellates have been identified as important bacterivores in both coastal oceans and oligotrophic gyres, accounting for up to 70% of bacterivory (Hartmann et al., 2012; Unrein et al., 2014). In Antarctica, Moorthi et al. (2009) used the FLB method in the Ross Sea and found that mixotrophs potentially consumed 11–100% of the bacterial standing stock daily during spring, while Laybourn-Parry and colleagues found large impacts by mixotrophs in some Antarctic lakes (Roberts and Laybourn-Parry, 1999; Bell and Laybourn-Parry, 2003; Laybourn-Parry et al., 2005).
While bacterivory and mixotrophic activity in natural systems can be assessed and some taxonomic groups can be identified using tracer ingestion experiments, determining the identity of most bacterivorous taxa is difficult. This is particularly evident when studying nano- and picophytoplankton that often lack useful morphological features for discriminating between species with epifluorescence/light microscopy. Yet the ability to identify which species are mixotrophic is important in understanding their behavior and ecological roles. Phagotrophic phytoplankton species from culture collections have been valuable for determining the variable triggers of feeding, as well as grazing rates and overall impact on bacterial standing stocks (Rothhaupt, 1996; Gast et al., 2014; Johnson, 2015). However, we still miss much of the mixotroph species diversity in field surveys, which is important because feeding by different species may be stimulated by different mechanisms or resource limitations (Maranger et al., 1998; Wilken et al., 2014; Princiotta et al., 2016). Using molecular methods, we recently showed that three known Antarctic mixotroph species usually comprised only a small portion of the total mixotrophic nanoflagellate assemblage identified by tracer methods (Gast et al., 2014), indicating that there are likely a large number of unidentified species present or that the cultured species are not generally abundant in the environment.
In this project, two goals were addressed. First, to assess polar seasonal and regional differences in mixotroph abundance and activity we compared previously reported ingestion results on the impacts of bacterivory, including mixotrophy, during the austral summer in the Ross Sea (Gast et al., 2014) with data from the Ross Sea in austral spring (Moorthi et al., 2009) and from the Arctic in the fall (Sanders and Gast, 2012). Second, we used incubation experiments with bromodeoxyuridine (BrdU) labeled bacteria as food and the subsequent immunoprecipitation of BrdU-labeled DNA followed by amplification of the eukaryotic portion of the labeled DNA and high throughput sequencing. The incorporation of BrdU into protist DNA allows the identification of bacterivorous organisms, with putative mixotrophs identified by their taxonomic affiliation with phototrophic lineages (Fay et al., 2013). The results expand our understanding of the roles of bacterivorous mixotrophic and heterotrophic protists in the Antarctic marine environment and identify taxa for further study of trophic ecology.
Methods
Sample Collection
Samples for shipboard experiments were collected in the Ross Sea during research cruise NBP-1101 aboard the R/V Nathaniel B. Palmer in the austral summer (20 January through 13 February 2011). Seawater was collected from two depths (surface and deep chlorophyll maximum) at 10 open water stations using 30 liter Niskin bottles on a CTD rosette. Two of those sites were sampled a second time on different dates (Figure 1, Table 1). The deep chlorophyll maximum (CM) was determined by fluorescence (WetLabs FLRTD fluorometer) during the downcast of the CTD and ranged from 30 to 90 m in depth depending on station. For chlorophyll a determination, 100 mL of whole water was filtered onto a 47 mm GF/F filter (Whatman) and frozen at −20°C until analyzed. Filters were later extracted in 90% acetone overnight at −20°C and fluorescence was determined with a Model TD-700 fluorometer (Turner Designs, Sunnyvale, CA, USA). Nutrient data (soluble reactive phosphate, nitrate, nitrate + nitrite, ammonia, silicate) from these stations is available in the Supplementary Material of Gast et al. (2014). In addition to water samples, we collected ice cores from land-fast ice (77° 43.70 S, 166° 08.50 E) with a motorized Sipre corer. Three replicate cores were taken within 15 cm of each other at each of three sites 10–12 m apart along an east-west transect. Core lengths ranged from 105 to 175 cm. For each core, the bottom 10 cm and a 10 cm section from mid-core (ranged from 20 to 80 cm from the top/surface of the core depending on the presence of brine channels or cracks) were removed and stored in separate 3.8 L freezer bags in a cooler until transfer to the ship for processing (see below).
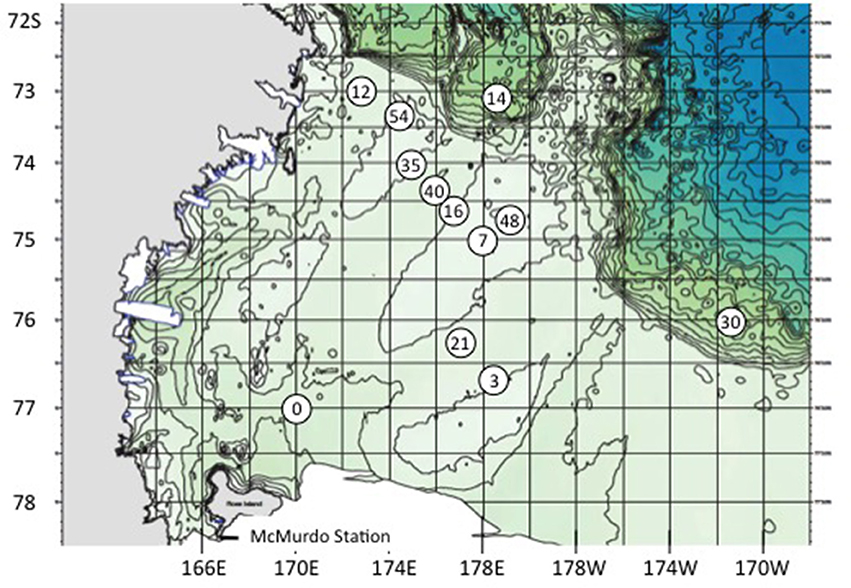
Figure 1. Stations sampled in the Ross Sea, Antarctica, Jan/Feb 2011. BrdU experiments were accomplished at stations 14, 21, 30, and 54. Station 7 is also 61, and 16 is also 24.
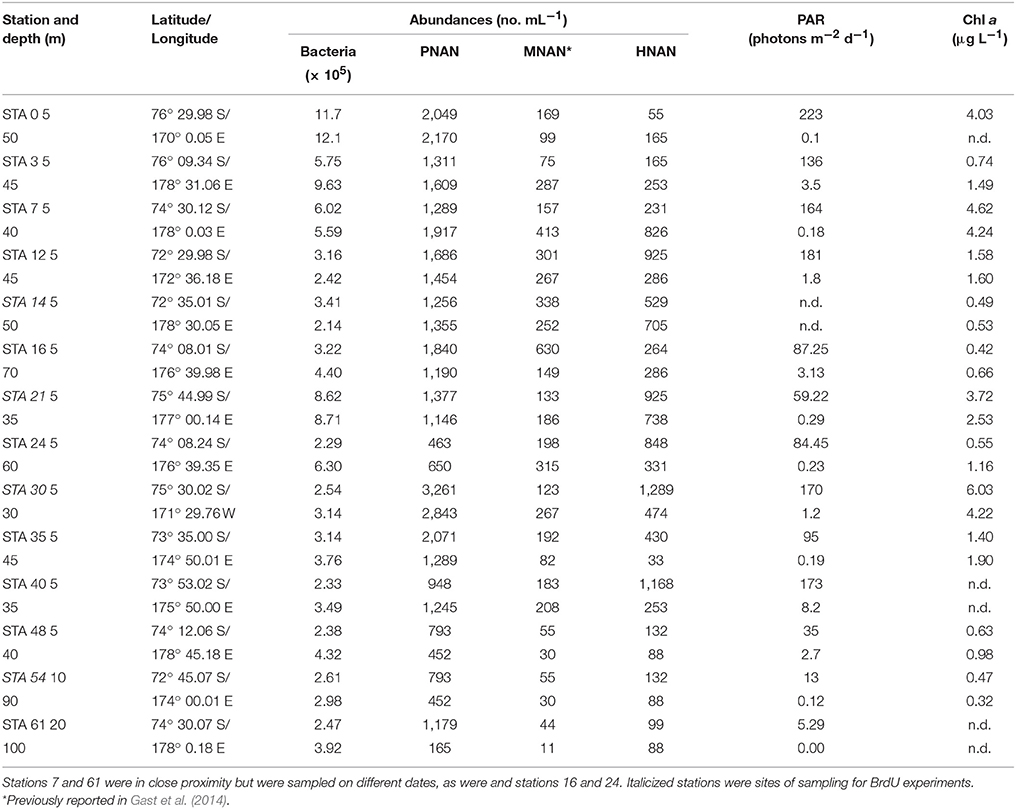
Table 1. Station location, bacterial, and nanoplankton abundances, photosynthetically active radiation (PAR) and chlorophyll a concentrations for NBP-1101 austral summer cruise.
Ingestion Experiments
Seawater samples were gently pre-filtered through acid-washed 200 μm nylon mesh followed by 35 μm Nitex mesh (Wildlife Supply, Yulee, FL, USA) to remove larger zooplankton. Since these experiments require a liquid phase, ice core replicates were pretreated by crushing the sea ice inside zip-lock bags and mixing with 0.2 micron filtered ice-cold seawater (Moorthi et al., 2009).
To determine the appropriate concentration of tracer particles to add, bacterial abundance was assessed by epifluorescence microscopy from samples filtered onto 25 mm black Poretics polycarbonate filters (0.2 μm pore size), stained and mounted with cover slips onto glass slides using VectaShield® mounting medium containing DAPI (Vector Laboratories, Inc., Burlingame, CA, USA). Ingestion experiments were run in triplicate (300 mL prescreened water in 500 mL Whirlpak bags) with 0.6 μm polycarbonate microspheres (Polysciences, Inc., Warrington, PA, USA) added at ~25% of natural bacterial abundance. Fluorescent tracer stock solution was sonicated immediately prior to addition to disperse particles evenly. Replicate bags were incubated at −0.5°C under fluorescent lamps at irradiance levels of 1.5 × 10¹⁵ quanta s−1 cm−2 (for surface samples) and 2.9 × 10¹⁴ quanta s−1 cm−2 (for CM samples). Light level was measured with a QSL-100 Quantum-Scalar Irradiance meter (Biospherical Instruments, Inc., San Diego, CA, USA). To determine bacterivory, replicate bags were sacrificed immediately after particle addition (T0) and at 60 min after particle addition (Tfinal), and fixed using the Lugol's/formaldehyde/Na2S2O3 method to prevent egestion (Sherr et al., 1993). Additional subsamples were taken at T0, fixed in 1% glutaraldehyde and filtered onto 0.2 μm polycarbonate filters with VectaShield® with DAPI as described above to determine bacterial and exact microsphere abundances. Hourly bacterial ingestion rates for both heterotrophic and mixotrophic nanoflagellates were calculated by multiplying the rates of microsphere uptake and the ratio of natural bacteria to microspheres in the sample after subtraction of background (T0), which was always negligible. Grazing impact (bacteria d−1 ml−1) of each nanoflagellate group was estimated by multiplying ingestion rate by abundance. This value was then used to determine the percentage of the bacterial assemblage removed daily as a result of grazing by HNAN or MNAN for comparison to literature values.
Abundances of phototrophic (PNAN), mixotrophic (MNAN), and heterotrophic (HNAN) nanoplankton were determined using 30 mL of sample collected from the WhirlPacs filtered onto 25 mm Poretics polycarbonate membranes (3 μm pore size, GE Osmonics, Minnetonka MN, USA). Filters were stained and mounted on glass slides using VectaShield® with DAPI and frozen at −20°C to reduce loss of chlorophyll fluorescence until enumeration by epifluorescence microscopy at 1,000X magnification onboard the ship. Nanoplankton (3–20 μm) were counted in 20–40 fields per filter, or a minimum of 100 cells. PNAN were distinguished by the presence of a chloroplast and a DAPI stained nucleus, while HNAN were identified by presence of a nucleus and absence of a chloroplast. Mixotrophic cells were defined as those with chlorophyll and at least one ingested fluorescent tracer (microsphere) after background correction based upon the T0 sample. All abundances of protists were calculated per milliliter seawater or milliliter brine. For the latter, the original brine volume was calculated by subtracting the amount of added filtered seawater (FSW, used to wash organisms out of sea ice) from the total amount volume of the experimental FSW/brine mixture drained from ice, assuming the remainder to be pure brine (Moorthi et al., 2009). For the brine experiments, differences in abundance between sites of collection and depth in the ice cores were tested with a two-way analysis of variance, ANOVA; data were (square root + 1)-transformed prior to statistical analysis.
The role of environmental variables in explaining variation in mixotroph abundances in the water samples was assessed using distance-based linear modeling (DistLM) in PERMANOVA+ (McArdle and Anderson, 2001). Mixotroph counts for each sample were square root transformed and a Bray Curtis resemblance matrix was built. Environmental data included temperature, salinity, oxygen, beam attenuation fluorescence, PAR, Julian day, latitude, longitude, total bacteria, soluble reactive phosphate (SRP), nitrate, nitrate + nitrite, ammonium, and silicate. The nutrient analyses of water were accomplished by a contractor technician following standard procedures for SRP (Bernhardt and Wilhelms, 1967), nitrate + nitrite (Armstrong et al., 1967), ammonium (indophenol blue method from ALPKEM), and silicate (Atlas et al., 1971) using a 5-channel Lachat Instruments QuikChem FIA+ 8000s series autoanalyzer in conjunction with a Lachat Instruments XYZ AutoSampler (ASX-500 Series), two Lachat Instruments RP-100 Series peristaltic reagent pumps and OMNION Software, version 3.0.220.02. Depth and fluorescence were square root transformed, and PAR was transformed by log(1+PAR). The DistLM model building run utilized the Stepwise selection procedure and BIC as the selection criteria, with 9999 permutations.
Bacterivore Diversity Experiments (BrdU Incorporation)
A strain of bacteria, Planococcus sp., with a diameter < 1 μm was labeled with BrdU (5′-bromo-2′-deoxyuridine, Sigma B5002) by inoculating into 50 mL of fresh media (1% yeast extract, 0.22 μm filtered seawater) with 20 μM BrdU (Fay et al., 2013). Planococcus for control incubations was treated identically except that BrdU was excluded from the media. The bacterial cells were harvested by centrifugation (3,000 × g, 10 min), washed 3 times, and dispersed and resuspended by pipetting with cold phosphate-buffered saline.
At a subset of stations (14, 21, 30, 54, Table 1), seawater was collected from the surface and the deep chlorophyll maximum, prefiltered through 200 μm nylon mesh screen and distributed into 20 L cubitainers. There were two treatments per experiment; the addition of BrdU-labeled Planococcus and the addition of unlabeled Planococcus. Planococcus was added at 10% of the natural abundance of bacteria for the first experiment and at 20% for the remaining three BrdU incubation experiments.
All cubitainers were incubated at −0.5°C in continuous fluorescent light at ~7 × 10¹⁵ quanta s−1 cm−2 (surface samples) and ~7 × 10¹⁴ quanta s−1 cm−2 (CM samples). Samples (1–2 L) were taken after 72 h of incubation for each depth/replicate, collected on 0.2 μm Durapore filters and frozen at −80°C for later extraction. DNA was extracted following the protocol in Gast et al. (2004), resuspended in 100 μL 1 × Tris/EDTA and stored frozen at −80°C for transport. Immunoprecipitation of BrdU-labeled DNA was performed following the protocol modified and published by Fay et al. (2013). Samples of DNA from incubations that were fed unlabeled bacteria are identified as “Whole,” whereas the samples fed BrdU-labeled bacteria are identified as “IP” (immunoprecipitated).
Primers to amplify the V9 region of the 18S ribosomal RNA gene (Amaral-Zettler et al., 2009; Stoeck et al., 2010) were used to generate products for amplicon high throughput sequencing. For each sample, 3 PCR reactions were performed at a volume of 50 μl each that contained 0.2 μM of each primer (Fay et al., 2013), 1× reaction buffer, 200 μM each dNTP, and 0.5U Phusion DNA Polymerase (New England Biolabs F-553). Cycling conditions were: 98°C for 120 s; 10 cycles of 98°C for 15 s, 67°C decreased by 1°C cycle−1 for 20 s, and 72°C for 15 s; 25 cycles of 98°C for 15 s, 57°C for 20 s, and 72°C for 15 s; and a final extension step of 72°C for 120 s. Each sample was purified with AMPure XP beads (Beckman Coulter A63880) following the manufacturer's protocol. Sequencing was accomplished on pooled triplicate samples at the University of Pennsylvania DNA Sequencing Facility using a “1-way read” approach for amplicon pyrosequencing with the GS Junior emPCR Lib-L kit (454 Life Sciences Corp., 2010) on a Roche/454 GS-FLX. The resulting read data were deposited in the National Center for Biotechnology Information (NCBI) Sequence Read Archive (SRA) under accession number SRP076481.
High Throughput Sequence Analysis
The barcodes, primers and sequences with a quality score below 25 were removed from the 454 data files, and the data de-multiplexed using the split_libraries command in QIIME version 1.9.1 (Caporaso et al., 2010). Operational taxonomic units (OTUs) were clustered at 95% identity, and chimeras were checked for using blast_fragments in QIIME. Taxonomy was assigned to OTUs in QIIME using Blast and the Silva 119 database (all taxa). Singleton, bacterial, archaeal, fungal, higher plant and metazoan OTUs were removed from the final dataset. OTU tables were exported to PRIMER v. 6 (Clarke and Warwick, 2001) for analysis of community similarity. Experiments were also analyzed individually in Excel for the identification of putatively mixotrophic OTUs. The data was normalized by conversion of each OTU to a percentage of the total tag counts from each sample. QIIME analysis pipeline commands are documented in Supplemental Material.
Results and Discussion
Phototrophic, Mixotrophic and Heterotrophic Nanoplankton Abundances and Bacterivory
Phototrophic nanoplankton (PNAN) typically were more abundant than the mixotrophic (MNAN), and heterotrophic (HNAN) nanoplankton combined, with the PNAN abundance usually an order of magnitude greater than either the MNAN or HNAN (Table 1, Figure 2). However, estimates of MNAN are based on presence of an ingested particle and not all MNAN necessarily ingested a particle during the incubations. Thus, the reported abundances of MNAN are considered a minimum estimate. Also, there have been previous studies indicating that some heterotrophic protists discriminate against microspheres based on size, phenotypic traits, motility, or taste (Sherr and Sherr, 1993), although we found that Arctic nanoplankton had higher grazing rates on microspheres than FLB as found in some other environments (Sanders et al., 1989; Sanders and Gast, 2012; Princiotta et al., 2016). In our summer Ross Sea samples, flagellates identified as MNAN were usually less abundant than HNAN (Table 1, Figure 2), but MNAN usually consumed more of the bacterial standing stock per day than the HNAN at both the surface and deep chlorophyll maximum (Figures 2C,D), a phenomena also observed in the Beaufort Sea and Canadian Basin when mixotrophic picoeukayotes (phytoplankton 0.2–2 μm in size) were included (Sanders and Gast, 2012). Comparison of our shipboard experiments in polar regions indicated that mixotrophs comprised 4–34% of the phototrophic and 3–75% of the bacterivorous flagellates (Table 2). However, mixotrophic flagellates are reported to account for 37–95%, 12–72%, and 9–42% of the total protistan bacterivory in the Southern and Northern Atlantic Ocean, Western Pacific Ocean and Northwestern Mediterranean Sea, respectively, suggesting a ubiquitous and major role as bacterivores in the world's oceans (Zubkov and Tarran, 2008; Tsai et al., 2011; Hartmann et al., 2012; Unrein et al., 2014). Three environmental variables explained most of the variation in mixotroph abundance over our samples. The most influential was date of sample collection (Julian day; 76.09% total variation), followed by nitrate + nitrite (1.86% total variation) and depth of sample collection (0.11% total variation).
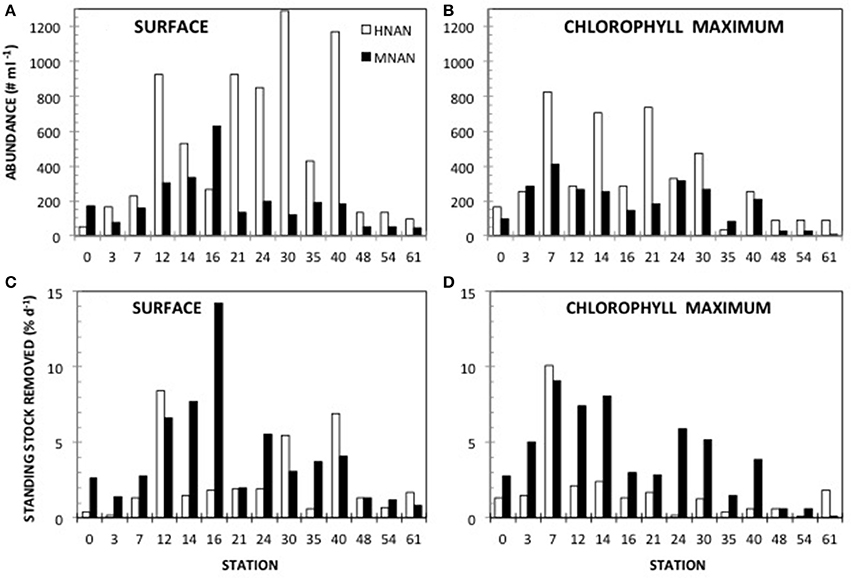
Figure 2. Mixotroph abunance and grazing impact. Abundance of mixotrophic nanoflagellates (MNAN) and heterotrophic nanoflagellates (HNAN) determined by microscopy at (A) the surface and (B) the deep chlorophyll maximum. Amount of bacteria removed by MNAN or HNAN grazing at (C) the surface and (D) the deep chlorophyll maximum.
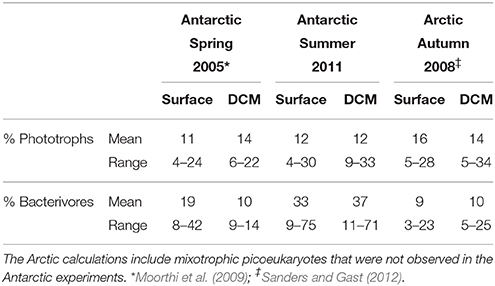
Table 2. Mixotrophs as a percentage of phototrophic and bacterivorous flagellates in different seasons in Polar Oceans.
Comparing our mixotrophy studies in the Antarctic summer, Antarctic spring (Moorthi et al., 2009) and the Arctic autumn (Sanders and Gast, 2012), MNAN in the water column comprised the same percentage of phototrophs on average in all three sample sets, with similar overall abundance in the Antarctic studies, but much lower absolute abundances in the Arctic autumn (Table 2). This similar percentage of MNANs is despite the fact that FLB were used in the Antarctic spring study rather than beads, which could result in different ingestion rates and behavior. Also, the relatively low grazing impact of nanoflagellates in the Arctic was sometimes as high as 25% of bacterioplankton standing stock when mixotrophic picoeukaryotes were considered (Sanders and Gast, 2012). Mixotrophic picoeukaryotes were not observed in our Antarctic fluorescent tracer additions in either spring 2005 or summer 2011.
In the Antarctic summer, mixotrophs tended to have relatively high ingestion rates (1–7 bacteria MNAN−1 h−1, mean 3.4 bacteria HNAN−1 h−1) compared to heterotrophs (0.1–4 bacteria HNAN−1 h−1, mean 2.2 bacteria HNAN−1 h−1) and also made up a greater percentage of the total bacterivores compared to our other polar studies (Table 2). Despite this, the maximum impact on bacterioplankton was only 14 and 9% of the standing stock per day in the surface and chlorophyll maximum layer, respectively. This indicates that the effect of mixotroph bacterivory may be much higher in the Antarctic spring, where we estimated an impact of up to 100% of standing stock calculated from our abundances and a conservative grazing rate of 1 bacterium MNAN−1 h−1 (Moorthi et al., 2009). In the Arctic, MNAN may play a smaller role with respect to bacterivory due to the prevalence of picoeukaryotic phytoplankton that are also mixotrophic, though further study in different seasons is clearly needed. While we noted higher ingestion rates by MNAN than HNAN (mean 5.1 bacteria MNAN−1 h−1 vs. 1.3 bacteria HNAN−1 h−1), this is not always the case. Ingestion rates for HNAN that are higher or equivalent to MNAN have been reported in several environments (Sanders et al., 1989; Unrein et al., 2007; Zubkov and Tarran, 2008). These differences are likely due to varying community composition and to environmental factors, such as light and nutrient concentration, which may be more likely to affect ingestion by MNAN than HNAN. Additionally, MNAN that have not ingested microspheres typically cannot be distinguished from PNAN in field-collected samples and this can lead to an overestimate of MNAN ingestion rates per cell, but not relative grazing impact, compared to HNAN (Sanders and Gast, 2012).
Calculated abundances of nanoflagellates in the brine channels at the fast ice station were generally greater than those observed in open water (Tables 1, 3). Although the ice core samples generally had no visible color, with the exception of a very slight brownish coloration in the bottom 10 cm of the three replicates at site 2, PNAN, MNAN, and HNAN were found in all of the brine channel samples (Table 3). All three protistan groups had significantly greater abundance in the bottom part of the cores relative to mid-core and there also were significant differences in abundance between the three coring sites despite their proximity to each other (ANOVA, p < 0.001). The differences in abundance between depths in the core were consistent in all samples, but the differences between sites were driven by higher overall abundances at site 2, which had the slightly colored cores (Table 3). Across sites, HNAN had the highest abundances, followed by PNAN and mixotrophs (Table 3). A higher abundance of nanoflagellates, especially HNAN, in brine relative to open water was previously observed in the Antarctic spring (Moorthi et al., 2009). Mixotrophic nanoflagellates in the brine comprised 13–26% of all phototrophs (PNAN + MNAN) and 9–19% of all bacterivorous flagellates (Table 3). Similar proportions of mixotrophs were noted by Moorthi et al. (2009) for sea ice brine in widely separated stations in the Ross Sea during the austral spring (5–10% and 3–15% of phototrophs and bacterivorous flagellates, respectively).
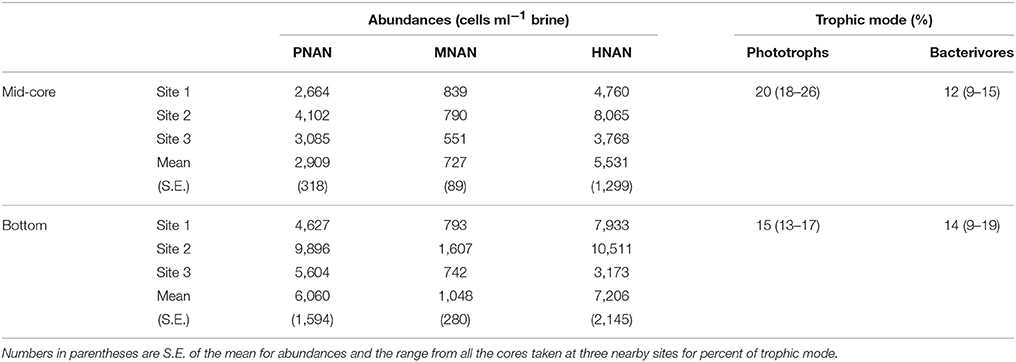
Table 3. Abundances of phototrophic (PNAN), mixotrophic (MNAN) and heterotrophic (HNAN) nanoflagellates in sea ice brine channels (station means of three replicate cores) from the middle and bottom of cores (see Methods) and the relative percentage of mixotrophs as total phototrophs and total bacterivores based on all replicates.
Bacterivory by nanoflagellates from the brine channels was variable. HNAN had low ingestion rates and almost zero impact on bacterial populations at site 1 and 3, despite abundances ranging from 3,000 to 10,000 ml−1. However, at site 2, HNAN could have ingested 4–8% of the bacterial standing stock daily. Conversely, MNAN were at much lower abundances than HNAN (Table 3), but with ingestion rates of 2–6 bacteria MNAN−1 h−1, could potentially have removed 12–18% of the brine standing stock daily, and up to 32% at the bottom of the cores at site 2 where both abundances and ingestion rates were highest. To our knowledge, this is the first report of experimentally-determined bacterivory for protists from brine channels.
Bromodeoxyuridine (BrdU) Experiments—Biodiversity of Protistan Bacterivores
The incubation experiments using BrdU-labeled bacteria as food and subsequent immunoprecipitation and amplification of the eukaryotic portion of the BrdU-labeled DNA allow identification of some of the major bacterivorous taxa. Putative mixotrophic taxa are identified by BrdU-labeling, indicating bacterivory, coupled with their taxonomic relationship to phototrophic organisms. The number of sequence tags and OTUs recovered in the surface and chlorophyll maximum for the total community (whole) and those that were bacterivorous (immunoprecipitated, IP) are given in Table S1. The data are reported both before and after removal of OTUs corresponding to singletons, bacteria, fungi, metazoa and higher plants. No chimeric OTUs were detected. A similar number of total sequences were recovered for each sample, except for Experiment 1 surface Whole and Experiment 2 surface IP, which had about half the number of tags. After removal of non-protistan OTUs, the number of sequences per sample became more variable. This was due to the recovery of a relatively high number of Metazoan sequences in several samples (e.g., Experiment 2 surface whole and Experiment 3 CM whole; Table S1). The number of OTUs identified at 95% similarity varied for each experiment and sample, but in general the Whole samples had more OTUs than the IP samples. The notable exception to this was the CM IP sample from Experiment 3, which had a much greater number of OTUs, before and after removal of non-protistan OTUs (Table S1).
The OTUs with prevalence at >0.5% of the total tags at the Class level for each experiment are given in Supplemental Material (Figure S1), but can be briefly summarized. In experiment 1 (Station 14), diatoms comprise about half of all the sequences in all of the samples, although less in the IP fraction (surface Whole 64%, CM Whole 55%, surface IP 53%, CM IP 46%). Syndiniales (parasitic dinoflagellates) is the second most abundant OTU in all four samples (surface Whole 12%, CM Whole 20%, surface IP 23%, CM IP 36%) followed by the Prymnesiophyte, Phaeocystis antarctica, in the Whole samples (surface 10%, CM 11%). Experiment 2 (Station 21) also shows an abundance of diatom sequences in the Whole samples (surface 75%, CM 68%), but much fewer in the IP samples (surface 20%, CM 25%). Syndiniales sequences are the next most abundant OTUs (surface Whole 14%, CM Whole 16%, surface IP 30%, CM IP 42%), and both they and the dinoflagellates (surface 6%, CM 6%) show an increase in the IP samples (surface 23%, CM 12%). Interestingly, P. antarctica sequences increase in abundance in the IP samples compared to the Whole samples for this experiment (surface Whole 2%, CM Whole 1%, surface IP 10%, CM IP 7%). Diatoms were much less abundant in all samples for Experiment 3 at Station 30 (surface Whole 16%, CM Whole 12%, surface IP 14%, CM IP 14%). The OTUs corresponding to Syndiniales (surface Whole 34%, CM Whole 21%, surface IP 29%, CM IP 31%), free-living dinoflagellates (surface Whole 19%, CM Whole 25%, surface IP 14%, CM IP 34%) and cercozoa (surface Whole 6%, CM Whole 29%, surface IP 23%, CM IP 10%) were the most abundant representatives for Experiment 3. Phaeocystis OTU was only abundant in the surface Whole samples (11%), but did show a slight increase in the CM IP sample (2.8%) for this experiment. In Experiment 4 (Station 54), the diatom OTUs were once again abundant, with a decrease in the IP samples (surface Whole 48%, CM Whole 36%, surface IP 41%, CM IP 9%), followed by the Syndiniales OTUs (surface Whole 19%, CM Whole 13%, surface IP 27%, CM IP 10%). Phaeocystis was only detected in the Whole samples in Experiment 4 (surface Whole 9.6%, CM Whole 4.5%) and the Polycystinea were abundant in the CM whole and IP samples (CM Whole 35%, CM IP 69%).
Identification of Putative Mixotrophs
When comparing the Whole and IP results to examine site similarity and to identify putative mixotrophs, the data were not restricted to the >0.5% fraction, and the taxonomic classification was taken to the lowest available level. In Primer v. 6 the abundance data was normalized to the total for each sample, log(x+1) transformed and then a Bray-Curtis resemblance matrix was created. Cluster analysis with SIMPROF indicated that whole and IP samples from an individual experiment were usually more similar to each other than they were to the same treatment from a different experiment. This was not unexpected considering that the water samples were collected at very different sites (Figure 1), and that the IP samples are expected to represent the bacterivorous subset of the original whole water sample. This was confirmed by the comparison of abundance of individual OTUs (Table S2).
OTUs with a taxonomic similarity to known phototrophs that were present in the IP samples were considered putatively mixotrophic. There were a small number of these OTUs that showed increased abundance in both the surface and CM IP samples compared to the Whole sample (Table 4). In most cases, the OTU abundance in the IP sample was lower than in the Whole sample, or an OTU was present in only one of the IP samples. While the strongest support for putative mixotrophic OTU identification could be argued for ones that showed an increase in abundance in the IP samples from both depths at a station, the fact that the OTU was present in an IP sample suggests that there was mixotrophic activity (Table S2) because it might be differentially stimulated in different parts of the water column. Light and nutrient concentrations can affect ingestion by mixotrophs (e.g., Nygaard and Tobiesen, 1993; McKie-Krisberg et al., 2015) and consequently affect BrdU-labeling of the mixotroph DNA. Since light and nutrients typically vary with depth, differences in the mixotrophs identified from the surface and chlorophyll maximum layer could be a factor of environment as much as of species composition.
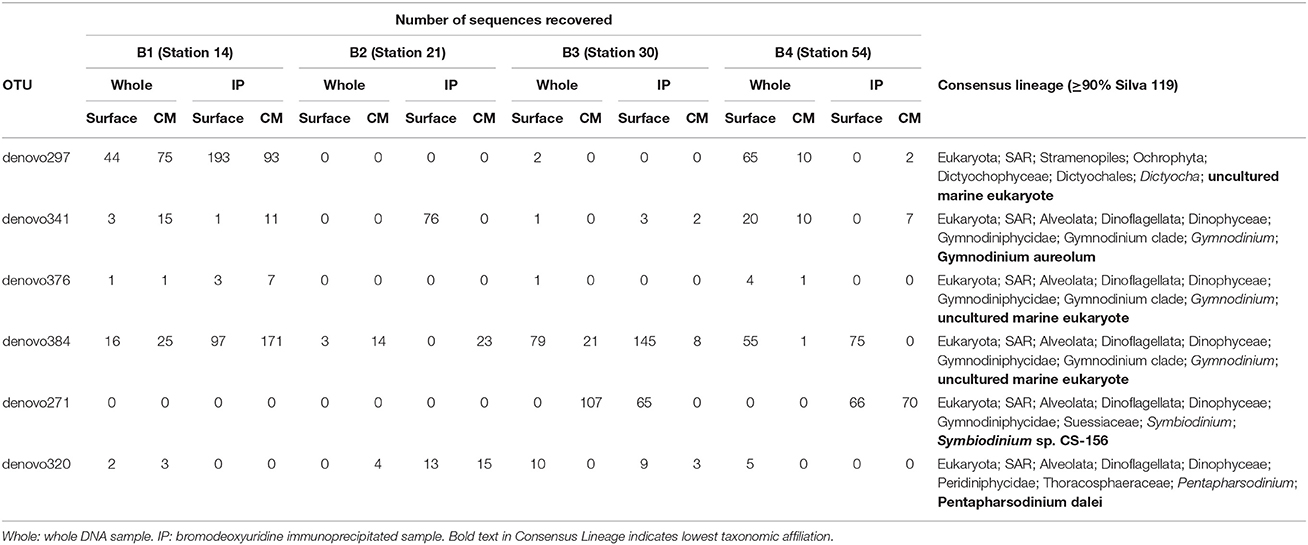
Table 4. Operational taxonomic units (OTUs) that had increased abundance in IP relative to whole samples at both surface and deep chlorophyll maximum depths in at least one of the BrdU experiments (B1–B4).
The presence of dinoflagellate OTUs in the IP samples was not unexpected, as many of these taxa are now considered to be able to consume particles (Jeong et al., 2010). Many of these dinoflagellates were less likely to have been observed in our microsphere ingestion experiments because they may be removed by the 35 μm prescreening or because their abundance was low and not observed on the filters for microscopy. In contrast, the presence of diatom OTUs in the IP samples was surprising as they have never been reported to ingest particles. Diatoms are often very abundant in Antarctic water samples and their DNA may persist through the selection process, although it would be expected to be much less in the IP samples. Another possible reason for the presence of diatom OTUs in the IP samples is that they may take up nucleotides released into the media by bacterivore grazing. The 72 h incubation period that was utilized to enhance incorporation into predator DNA may have increased the potential for breakdown of bacterial DNA and release of dissolved BrdU into the media for uptake by phytoplankton. Again, abundance in the IP sample should be less, and in most cases the number of diatom OTU tags observed in the IP portion was less than in the Whole portion.
The presence of Phaeocystis was noted by microscopy throughout the cruise. This Prymnesiophyte alga exists as both single cells and multicellular colonies, and forms dense blooms. The increase in Phaeocystis OTUs in the IP sample for Experiment 2 was unexpected. Although mixotrophy has never been reported for this particular alga, the presence of the sticky, mucilaginous material in the colonial form makes ingestion experiments difficult to interpret. There is the potential that BrdU nucleotides released by grazing could have been taken up, as is suggested for the diatoms, but why it only occurred in Experiment 2 is not apparent. The difference in experimental results might have reflected the presence of an appropriate (but unknown) trigger for stimulating grazing by the alga. In either case, the result is something to consider in future experiments with laboratory isolates of Phaeocystis.
The potentially parasitic Syndiniales OTUs also appear in IP samples. This leads to questions of whether they are acquiring label from an infected host, whether they consume bacteria when not infecting a host, or whether this OTU is not a parasite at all, but actually a heterotroph. Marine Stramenophile (MAST) OTUs also tend to be enriched in IP samples, as do some ciliates, although not as much as anticipated considering the potential capacity of many ciliates to consume large numbers of bacteria.
The OTUs listed in Table 4 represent a very conservative assessment of mixotrophy and are taxonomically similar to Dictyocha, Gymnodinium, Pentapharsodinium, and Symbiodinium. The silicoflagellates (e.g., Dictyocha) are considered mixotrophic (Quéguiner, 2016) and there is growing experimental support for mixotrophy in many photosynthetic dinoflagellates, including a Symbiodinum strain (Jeong et al., 2010, 2012). We have not observed mixotrophic activity in these groups in our Antarctic ingestion experiments, which may be due to our focus on the more abundant nanoplankton, or that the conditions of our fluorescent-tracer experiments do not favor/induce the behavior in these groups. While it is unlikely that the OTUs with consensus lineages of ≥90% represent the exact taxa that have been assigned to them, they do suggest new target taxa for isolation and laboratory experiments on triggers for mixotrophic activity. The sequence data can also be used to develop qPCR assays to estimate their abundance in archived environmental samples to determine if, and under what conditions, they make up a significant portion of the mixotrophic community. Our previous work showed that three known Antarctic mixotroph species generally were only a small portion of the total mixotroph population identified by ingestion methods (Gast et al., 2014). However, the qPCR data also indicated that a single species, Pyramimonas trychotreta, was responsible for most of the mixotrophic feeding during at least one of the summer experiments (Gast et al., 2014). This indicated that while the overall mixotroph community is diverse, individual taxa have the capacity to dominate when appropriate conditions are met.
In the Antarctic marine environment, photosynthetic microbial eukaryotes sustain the food web. Although mixotrophy has been demonstrated in effectively every freshwater and marine environment for which the nutritional strategy has been studied, only recently has it been proposed as essential to the functioning of marine food webs (Unrein et al., 2007, 2014; Hartmann et al., 2012). When abundant, mixotrophs likely are an important food source for higher trophic levels. Mixotrophs generally have lower carbon to nutrient ratios (C:N, C:P) than strict phototrophs (Katechakis and Stibor, 2006), and protists with low ratios are considered to be better quality food for higher trophic levels (Sterner, 1990; Hessen et al., 2002; Bukovinszky et al., 2012). The quality of phytoplankton food could impact zooplankton growth and reproduction, which in turn would affect fish and other marine vertebrates.
To our knowledge, the only experimental field data on mixotrophy in the Southern Ocean comes from our work using microscopic and molecular approaches (Moorthi et al., 2009; Gast et al., 2014), with this study being the first to taxonomically identify putative mixotrophic species based upon ribosomal sequence data. Microscopy-based methods allow us to detect and enumerate mixotrophic nanoflagellates as a group, as well as determine their grazing rates and the amount of bacteria that they consume, but tell us little about the actual species present. In Antarctic marine systems, the extreme environmental circumstances of seasonal light deprivation (polar night) and depletion of nutrients including iron (after large seasonal blooms of diatoms and Phaeocystis) are conditions that are known to stimulate/enhance mixotrophic activity in cultured nanophytoplankton species (Nygaard and Tobiesen, 1993; Maranger et al., 1998; McKie-Krisberg et al., 2015). The combination of these conditions in the Antarctic may result in a diverse collection of mixotrophic taxa. Consequently, the species present and their relative abundance will alter the impact on the environment. Identifying mixotrophic taxa genetically allows us to target those organisms for recovery in culture and testing of stimulatory conditions that can be used to predict how species may respond to environmental conditions. In conjunction with measurements of bacterial ingestion rates and photosynthetic production, it is also possible to estimate the impact that those particular species may have on the cycling of nutrients. Understanding diversity of mixotrophic species, the amount of their photosynthetic and bacterivorous contributions, and the conditions under which they occur will greatly improve our interpretation of the function of the Antarctic food web.
Author Contributions
All three authors contributed to the conception, design and execution of the work, as well as to the writing of the manuscript.
Funding
This work was supported by National Science Foundation Grants OPP-0838955 (RG) and OPP-0838847 (RS). Any opinions, findings, and conclusions or recommendations expressed in this material are those of the authors and do not necessarily reflect the views of the National Science Foundation.
Conflict of Interest Statement
SF was employed by Invitae at the time of manuscript submission, but was a postdoctoral investigator at Temple during the cruise and data collection portion of this work.
The other authors declare that the research was conducted in the absence of any commercial or financial relationships that could be construed as a potential conflict of interest.
Acknowledgments
We gratefully acknowledge the captain and crew of Nathanial B. Palmer for logistical support and Elizabeth Halliday for assistance during the cruise.
Supplementary Material
The Supplementary Material for this article can be found online at: https://www.frontiersin.org/articles/10.3389/fmars.2018.00013/full#supplementary-material
References
454 Life Sciences Corp. (2010). GS Junior System Guidelines for Amplicon Experimental Design. Branford, CT: 454 Life Sciences.
Amaral-Zettler, L. A., McCliment, E. A., Ducklow, H. W., and Huse, S. M. (2009). A method for studying protistan diversity using massively parallel sequencing of V9 hypervariable regions of small-subunit ribosomal RNA genes. PLoS ONE 4:e6372. doi: 10.1371/journal.pone.0006372
Anderson, M. R., and Rivkin, R. B. (2001). Seasonal patterns in grazing mortality of bacterioplankton in polar oceans: a bipolar comparison. Aquat. Microb. Ecol. 25, 195–206. doi: 10.3354/ame025195
Armstrong, F. A. J., Stearns, C. R., and Strickland, J. D. H. (1967). The measurement of upwelling and subsequent biological processes by means of the Technicon AutoAnalyzer™ and associated equipment. Deep Sea Res. 14, 381–389.
Atlas, E. L., Hager, S. W., Gordon, L. I., and Park, P. K. (1971). A Practical Manual for the Use of the Technicon AutoAnalyzer™ in Seawater Nutrient Analyses: Revised. Corvallis, OR: Oregon State University, Dept of Oceanography.
Becquevort, S. (1997). Nanoprotozooplankton in the Atlantic sector of the Southern Ocean during early spring: biomass and feeding activities. Deep-Sea Res. II 44, 355–373. doi: 10.1016/S0967-0645(96)00076-8
Becquevort, S., Menon, P., and Lancelot, C. (2000). Differences in the protozoan biomass and grazing during spring and summer in the Indian sector of the Southern Ocean. Polar Biol. 23, 309–320. doi: 10.1007/s003000050450
Bell, E. M., and Laybourn-Parry, J. (2003). Mixotrophy in the Antarctic phytoflagellate, Pyramimonas gelidicola (Chlorophyta: Prasinophyceae). J. Phycol. 39, 644–649. doi: 10.1046/j.1529-8817.2003.02152.x
Bernhardt, H., and Wilhelms, A. (1967). The continuous determination of low level iron, soluble phosphate and total phosphate with the AutoAnalyzer. Tech. Symp. 1:386.
Boenigk, J., and Arndt, H. (2002). Bacterivory by heterotrophic flagellates: community structure and feeding strategies. Antoine van Leeuwenhoek 81, 465–480. doi: 10.1023/A:1020509305868
Bukovinszky, T., Verschoor, A. M., Helmsing, N. R., Bezemer, T. M., Bakker, E. S., Vos, M., et al. (2012). The good, the bad and the plenty: interactive effects of food quality and quantity on the growth of different Daphnia species. PLoS ONE 7:e42966. doi: 10.1371/journal.pone.0042966
Caporaso, J. G., Kuczynski, J., and Stombaugh, J. (2010). QIIME allows analysis of high-throughput community sequencing data. Nat. Methods 7, 335–336.doi: 10.1038/nmeth.f.303
Caron, D. A., Countway, P. D., Jones, A. C., Kim, D. Y., and Schnetzer, A. (2012). Marine protistan diversity. Ann. Rev. Mar. Sci. 4, 467–493.doi: 10.1146/annurev-marine-120709-142802
Clarke, K. R., and Warwick, R. M. (2001). Change in Marine Communities: An Approach to Statistical Analysis and Interpretation. Plymouth, UK: Primer-E Ltd.
Duarte, C. M., Agustí, S., Vaqué, D., Agawin, N. S. R., Felipe, J., Casamayor, E. O., et al. (2005). Experimental test of bacteria-phytoplankton coupling in the Southern Ocean. Limnol. Oceanogr. 50, 1844–1854. doi: 10.4319/lo.2005.50.6.1844
Fay, S. A., Gast, R. J., and Sanders, R. W. (2013). Linking bacterivory and phyletic diversity of protists with a marker gene survey and experimental feeding with BrdU-labeled bacteria. Aquat. Microb. Ecol. 71, 141–153. doi: 10.3354/ame01674
Gast, R. J., Dennett, M. R., and Caron, D. A. (2004). Characterization of protistan assemblages in the Ross Sea, Antarctica by denaturing gradient gel Electrophoresis. Appl. Env. Microbiol. 70, 2028–2037. doi: 10.1128/AEM.70.4.2028-2037.2004
Gast, R. J., McKie-Krisberg, Z. M., Fay, S. A., Rose, J. M., and Sanders, R. W. (2014). Antarctic mixotrophic protist abundances by microscopy and molecular methods. FEMS Microb. Ecol. 89, 388–401. doi: 10.1111/1574-6941.12334
Hartmann, M., Grob, C., Tarran, G. A., Martin, A. P., Burkill, P. H., Scanlan, D. J., et al. (2012). Mixotrophic basis of Atlantic oligotrophic ecosystems. Proc. Natl. Acad. Sci.U.S.A. 109, 5756–5760. doi: 10.1073/pnas.1118179109
Havskum, H., and Hansen, A. S. (1997). Importance of pigmented and colourless nano-sized protists as grazers on nanoplankton in a phosphate-depleted Norwegian fjord and in enclosures. Aquat. Microb. Ecol. 12, 139–151. doi: 10.3354/ame012139
Hessen, D. O., Færøvig, P. J., and Andersen, T. (2002). Light, nutrients, and P:C ratios in algae: grazer performance related to food quality and quantity. Ecology 83, 1886–1898. doi: 10.1890/0012-9658(2002)083[1886:LNAPCR]2.0.CO;2
James, M. R., Pridmore, R. D., and Cummings, V. J. (1995). Planktonic communities of melt ponds on the McMurdo Ice Shelf, Antarctica. Polar Biol. 15, 555–567. doi: 10.1007/BF00239647
Jeong, H. J., Yoo, Y. D., and Kang, N. S. (2012). Heterotrophic feeding as a newly identified survival strategy of the dinoflagellate Symbiodinium. Proc. Natl. Acad. Sci.U.S.A. 109, 12604–12609. doi: 10.1073/pnas.1204302109
Jeong, H. J., Yoo, Y. D., Kim, J. S., Seong, K. A., Kang, N. S., and Kim, T. H. (2010). Growth, feeding and ecological roles of the mixotrophic and heterotrophic dinoflagellates in marine planktonic food webs. Ocean Sci. J. 45, 65–91. doi: 10.1007/s12601-010-0007-2
Johnson, M. D. (2015). Inducible mixotrophy in the dinoflagellate Prorocentrum minimum. J. Eukaryot. Microbiol. 62, 431–443.doi: 10.1111/jeu.12198
Katechakis, A., and Stibor, H. (2006). The mixotroph Ochromonas tuberculata may invade and suppress specialist phago- and phototroph plankton communities depending on nutrient conditions. Oecologia 148, 692–701. doi: 10.1007/s00442-006-0413-4
Laybourn-Parry, J., Marshall, W. A., and Marchant, H. J. (2005). Flagellate nutritional versatility as a key to survival in two contrasting Antarctic saline lakes. Freshw. Biol. 50, 830–838. doi: 10.1111/j.1365-2427.2005.01369.x
Leakey, R. J. G., Archer, S. D., and Grey, J. (1996). Microbial dynamics in coastal waters of East Antarctica: bacterial production and nanoflagellate bacterivory. Mar. Ecol. Prog. Ser. 142, 3–17. doi: 10.3354/meps142003
Maranger, R., Bird, D. F., and Price, N. M. (1998). Iron acquisition by photosynthetic marine phytoplankton from ingested bacteria. Nature 396, 248–251. doi: 10.1038/24352
McArdle, B., and Anderson, M. (2001). Fitting multivariate models to community data: a comment on distance-based redundance analysis. Ecol. Lett. 82, 290–297. doi: 10.1890/0012-9658(2001)082[0290:FMMTCD]2.0.CO;2
McKie-Krisberg, Z. M., Gast, R. J., and Sanders, R. W. (2015). Physiological responses of three species of Antarctic mixotrophic phytoflagellates to changes in light and dissolved nutrients. Microb. Ecol. 70, 21–29. doi: 10.1007/s00248-014-0543-x
Moorthi, S., Caron, D. A., Gast, R. J., and Sanders, R. W. (2009). Mixotrophy: a widespread and important ecological strategy for planktonic and sea-ice nanoflagellates in the Ross Sea, Antarctica. Aquat. Microb.Ecol. 54, 269–277. doi: 10.3354/ame01276
Nygaard, K., and Tobiesen, A. (1993). Bacterivory in algae: a survival strategy during nutrient limitation. Limnol. Oceanogr. 38, 273–279. doi: 10.4319/lo.1993.38.2.0273
Pearce, I., Davidson, A. T., Thomson, P. G., Wright, S., and van den Enden, R. (2010). Maring microbial ecology of East Antarctica (30-80 E): rates of bacterial and phytoplankton growth and grazing by heterotrophic protists. Deep Sea Res. II 57, 849–862. doi: 10.1016/j.dsr2.2008.04.039
Pearce, I., Davidson, A. T., Thomson, P. G., Wright, S., and Van den Ende, P. (2011). Marine microbial ecology in the sub-Antarctic Zone: rates of bacterial and phytoplankton growth and grazing by heterotrohpic protists. Deep Sea Res. II 58, 2248–2259. doi: 10.1016/j.dsr2.2011.05.030
Pedrós-Alió, C., Calderón-Paz, J. I., Guixa-Boixereu, N., Estrada, M., and Gasol, J. M. (1996). Microbial plankton across teh Drake Passage. Polar Biol. 16, 613–622. doi: 10.1007/BF02329059
Princiotta, S. D., Smith, B., and Sanders, R. W. (2016). Temperature-dependent phagotrophy and phototrophy in a mixotrophic chrysophyte. J. Phycol. 52, 432–440. doi: 10.1111/jpy.12405
Putt, M., Stoecker, D. K., and Alstatt, J. (1991). Bacterivory in McMurdo Sound: 1. Grazing by heterotrophic nanoflagellates. Antarct. J. 26, 139–140.
Roberts, E. C., and Laybourn-Parry, J. (1999). Mixotrophic cryptophytes and their predators in the Dry Valley lakes of Antarctica. Freshw. Biol. 41, 737–746. doi: 10.1046/j.1365-2427.1999.00401.x
Rothhaupt, K. O. (1996). Laboratory experiments with a mixotrophic chrysophyte and obligately phagotrophic and phototrophic competitors. Ecology 77, 716–724. doi: 10.2307/2265496
Sanders, R. W., Berninger, U.-G., Lim, E. L., Kemp, P. F., and Caron, D. A. (2000). Heterotrophic and mixotrophic nanoplankton predation on picoplankton in the Sargasso Sea and on Georges Bank. Mar. Ecol. Prog. Ser. 192, 103–118. doi: 10.3354/meps192103
Sanders, R. W., and Gast, R. J. (2012). Bacterivory by phototrophic picoplankton and nanoplankton in Arctic waters. FEMS Microbiol. Ecol. 80, 242–253. doi: 10.1111/j.1574-6941.2011.01253.x
Sanders, R. W., and Porter, K. G. (1988). Phagotrophic phytoflagellates. Adv. Microb. Ecol. 10, 167–192. doi: 10.1007/978-1-4684-5409-3_5
Sanders, R. W., Porter, K. G., Bennett, S. J., and DeBiase, A. E. (1989). Seasonal patterns of bacterivory by flagellates, ciliates, rotifers, and cladocerans in a freshwater planktonic community. Limnol. Oceanogr. 34, 673–687. doi: 10.4319/lo.1989.34.4.0673
Sherr, B. F., and Sherr, E. B. (1993). “Protistant grazing rates via uptake of fluorescently labeled prey,” in Handbook of Methods in Aquatic Microbial Ecology, eds P. F Kemp, B. F. Sherr, E. B. Sherr, and J. J. Cole (Boca Raton, FL: CRC Press, LLC), 695-701.
Sherr, B. F., Sherr, E. B., and Pedrós-Alió, C. (1989). Simultaneous measurement of bacterioplankton production and protozoan bacterivory in estuarine water. Mar. Ecol. Prog. Ser. 54, 209–219. doi: 10.3354/meps054209
Sherr, E. B., Caron, D. A., and Sherr, B. F. (1993). “Staining of heterotrophic protists for visualization via epifluorescence microscopy,” in Handbook of Methods in Aquatic Microbial Ecology, eds P. F. Kemp, B. F. Sherr, E. B. Sherr, and J. J. Cole (New York, NY: Lewis Publishers), 213-227.
Sterner, R. W. (1990). The ratio of nitrogen to phosphorus resupplied by herbivores: zooplankton and the algal competitive arena. Am. Nat. 136, 209–229. doi: 10.1086/285092
Stoeck, T., Bass, D., Nebel, M., Christen, R., Jones, M. D. M., Breiner, H.-W., et al. (2010). Multiple marker parallel tag environmental DNA sequencing reveals a highly complex eukaryotic community in marine anoxic water. Mol. Ecol. 19, 21–31. doi: 10.1111/j.1365-294X.2009.04480.x
Stoecker, D. K., Hansen, P. J., Caron, D. A., and Mitra, A. (2017). Mixotrophy in the Marine Plankton. Ann. Rev. Mar. Sci. 9, 315–335. doi: 10.1146/annurev-marine-010816-060617
Tsai, A. Y., Gong, G. C., Sanders, R. W., Chen, W. H., Chao, C. F., and Chiang, K. P. (2011). Relative importance of pigmented- and heterotrophic nanoflagellates grazing on bacteria during the warm season in a coastal subtropical ecosystem of the Western Pacific. Aquat. Microb. Ecol. 63, 9–18. doi: 10.3354/ame01470
Unrein, F., Gasol, J. M., Not, F., Forn, I., and Massana, R. (2014). Mixotrophic haptophytes are key bacterial grazers in oligotrophic coastal waters. ISME J. 8, 164–176. doi: 10.1038/ismej.2013.132
Unrein, F., Massana, R., Alonso-Saez, L., and Gasol, J. M. (2007). Significant year-round effect of small mixotrophic flagellates on bacterioplankton in an oligotrophic coastal system. Limnol. Oceanogr. 52, 456–469. doi: 10.4319/lo.2007.52.1.0456
Vaqué, D., Agustí, S., and Duarte, C. M. (2004). Response of bacterial grazing rates to experimental manipulation of an Antarctic coastal nanoflagellate community. Aquat. Microb. Ecol. 36, 41–52. doi: 10.3354/ame036041
Vaqué, D., Calderón-Paz, J. I., Guixa-Boixereu, N., and Pedrós-Alió, C. (2002). Spatial distribution of microbial biomass and activity (bacterivory and bacterial production) in the northern Weddell Sea during the austral summer (January 1994). Aquat. Microb. Ecol. 29, 107–121. doi: 10.3354/ame029107
Vaqué, D., Alonso-Sáez, L., Arístegui, J., Agustí, S., Duarte, C. M., Montserrate Sala, M., et al. (2014). Bacterial production and losses to predators along an open ocean trophic gradient in the subtropical north east atlantic ocean. J. Plankton Res. 36, 198–213. doi: 10.1093/plankt/fbt085
Wilken, S., Verspagen, J. M. H., Naus-Wiezer, S., Van Donk, E., and Huisman, J. (2014). Comparison of predator–prey interactions with and without intraguild predation by manipulation of the nitrogen source. Oikos 123, 423–432. doi: 10.1111/j.1600-0706.2013.00736.x
Keywords: protist, diversity, mixotrophy, Ross Sea, amplicon sequencing
Citation: Gast RJ, Fay SA and Sanders RW (2018) Mixotrophic Activity and Diversity of Antarctic Marine Protists in Austral Summer. Front. Mar. Sci. 5:13. doi: 10.3389/fmars.2018.00013
Received: 25 July 2017; Accepted: 16 January 2018;
Published: 02 February 2018.
Edited by:
Hongbin Liu, Hong Kong University of Science and Technology, Hong KongReviewed by:
Klaus Jürgens, Leibniz Institute for Baltic Sea Research (LG), GermanyBingzhang Chen, Japan Agency for Marine-Earth Science and Technology, Japan
Copyright © 2018 Gast, Fay and Sanders. This is an open-access article distributed under the terms of the Creative Commons Attribution License (CC BY). The use, distribution or reproduction in other forums is permitted, provided the original author(s) and the copyright owner are credited and that the original publication in this journal is cited, in accordance with accepted academic practice. No use, distribution or reproduction is permitted which does not comply with these terms.
*Correspondence: Rebecca J. Gast, cmdhc3RAd2hvaS5lZHU=