 Angelicque E. White
 Katie S. Watkins-Brandt
 Matthew J. Church
- 1College of Earth, Ocean, and Atmospheric Sciences, Oregon State University, Corvallis, OR, United States
- 2Flathead Lake Biological Station, University of Montana, Polson, MT, United States
In oligotrophic ocean regions such as the North Pacific Subtropical Gyre (NPSG), N2 fixation (i.e., diazotrophy) by a diverse consortium of microorganisms has been shown to contribute significantly to new production and particle export. In 2015 and 2016, we measured near-monthly abundances of the large cell-sized (> 10 μm) diazotrophic genera Trichodesmium and diatom-associated Richelia and Calothrix spp. in the NPSG via microscopy and quantitative PCR of nifH genes. Of these genera, we find Trichodesmium to be the more abundant over our study period, with cell concentrations in the upper water column (0–45 m) ranging from 1 to 5,988 cells L−1, while the sum of Richelia and Calothrix spp. abundances ranged from 4 to 157 heterocysts L−1. Significant discrepancies between absolute abundances were noted between cell and gene-based approaches to biomass determination (nifH copies L−1 were up to 102-103 higher than cell concentrations). Potential explanations for these striking discrepancies are discussed. Using the maximum N fixation rates per cell found in the existing literature for these genera, we estimate potential N2 fixation rates via these large diazotroph communities to be between 0.01 and 1.5 nmol N L−1 d−1. When comparing these rates to available 15N2 tracer measurements, we conclude that large diazotrophs were generally minor (<10%) contributors to bulk N2 fixation in the surface ocean during our study period. Conversely, high concentrations of Trichodesmium observed in fall-winter of 2015 and 2016 were estimated to drive >50% of measured N2 fixation rates. While these large cell-sized and heterogeneously distributed organisms may still disproportionately contribute to export, cell-abundance based rate estimates suggests that other diazotrophs are largely responsible for N2 fixation rates measured in bottle-based incubations.
Introduction
The biological reduction of dinitrogen gas (N2) into ammonia (termed N2 fixation or diazotrophy) by certain genera of oceanic microorganisms represents the largest incoming flux of nitrogen to the global ocean (Galloway et al., 2004). As such, biological N2 fixation plays a significant role in the regulation of oceanic productivity and the export of carbon and nitrogen (N) out of the sun-lit surface waters (Capone and Carpenter, 1982). In open ocean habitats, ambient concentrations of bioavailable N are low (typically 100's of nmol L−1). Hence, the capacity to utilize atmospheric N2 allows diazotrophs to fulfill their N requirements for growth and subsequently contribute new N to the system via trophic transfer, sinking, (Scharek et al., 1999), or the release of ammonia and dissolved organic matter rich in N (Mulholland and Capone, 2001). More than just a conduit for inputs of new N, these organisms can also form large surface blooms, thereby transiently dominating both primary productivity and N cycling (Bowman and Lancaster, 1965; Karl et al., 1992; Capone et al., 1998).
In the oligotrophic North Pacific Subtropical Gyre (NPSG), isotopic models indicate that N2 fixation is directly or indirectly responsible for 26–47% of the particulate N that is exported from the euphotic zone (Böttjer et al., 2017). Diazotrophic organisms in this ecosystem range from unicellular cyanobacterial symbionts (termed Group A, Zehr et al., 1998, 2001) to small and generally free-living cyanobacteria such as Crocosphaera spp. and heterotrophic diazotrophs (Church et al., 2005; Gradoville et al., 2017b), to more conspicuous and large cell-sized diazotrophs such as Trichodesmium and symbioses of Richelia and Calothrix with various diatoms (termed DDAs, diatom-diazotroph assemblages). These latter, larger organisms have been recognized as important contributors to upper ocean productivity and the annual flux of organic matter to the mesopelagic of the NPSG (Scharek et al., 1999; Dore et al., 2002; Karl et al., 2012).
Despite the knowledge of the importance of diazotrophy to new production in the NPSG, there have been few studies assessing the temporal variability of diazotroph biomass in the upper euphotic zone where they predominately reside. Using a quantitative PCR-based (qPCR) time series (2004–2007) targeting the nifH gene, which encodes a component of the nitrogenase enzyme that catalyzes N2 fixation, Church et al. (2009) reported highly variable diazotroph assemblages in the NPSG. Unicellular diazotrophs were typically found to be most abundant whereas episodic increases of DDA's and Trichodesmium were noted. Similar nifH gene-based surveys in the region (Robidart et al., 2014) report highly patchy diazotroph assemblages, with Trichodesmium gene-copies varying up to three orders of magnitude over <30 km and <2 d time scales. While powerful, relationships between gene and cellular abundances remain largely unknown for naturally-occurring marine diazotrophs. Moreover, like several other cyanobacterial classes (Griese et al., 2011), diazotrophs such as Trichodesmium have recently been suggested to be polyploidal (Sargent et al., 2016) and nitrogenase gene-copies per cell can also vary for Richelia spp. (Foster and O'Mullen, 2008) such that gene-based measurements may overestimate cell abundances.
In this study we enumerated the abundance of large diazotrophs in the upper ocean of the NPSG via epifluorescence microscopy and qPCR over a 2-year period (2015–2016). From our measurements of the cellular abundance of these diazotrophs and published values of their N fixation rate per cell, we estimate the potential contributions of these organisms to coincident measurements of 15N2 fixation and N export. All samples were collected at Station ALOHA (A Long-term Oligotrophic Habitat Assessment), the field site for the Hawaii Ocean Time-series (HOT) program. The aim of this work was to describe the temporal variability of large diazotrophs and estimate their potential contributions to new production in the region.
Materials and Methods
Diazotroph Cell Counts
Between April 2015 and December 2016, in coordination with the HOT program, samples were collected to enumerate the abundance of large (> 10 μm) diazotrophs at Station ALOHA (22.75°N, 158°W) in the upper water column. At each depth (5, 25, and 45 m), the entire volume of a PVC rosette bottle was drained directly into clean ~10 L carboys fitted with spigots in order to avoid underestimation of cells due to positive or negative buoyancy (Carpenter et al., 2004). Carboys were covered in dark cloth and the volume was gravity filtered through a 47-mm diameter, 10 μm pore size, black polycarbonate filter with a Sterlitech polyester drain disk (PETEDD47100) as a backing filter. All filtrations lasted <2 h. Following filtration, filter holders were fit with a short section of tubing and a syringe leur fitting on one side and a 2-way valve on the outflow side. For each filter, 5 ml of 2% glutaraldehyde was slowly injected onto the filter and samples were allowed to fix for 30 min. Fixative was drained after this time and 60 ml of air was used to flush all filters. Polycarbonate filters were then mounted onto 3″ × 2″ glass slides with Cargille Series A immersion oil, cover slides were added, and the edges of each cover slip were sealed with quick dry nail polish. All slides were stored at −20°C and counted within 60 days of collection.
Enumeration of diazotrophic taxa was performed using epifluorescence microscopy of phycoerythrin autofluorescence (548 nm excitation/561 nm emission) under 10–40 × magnification using an Olympus epifluorescence BX61 microscope fit with a Cooke Sensicam camera. The entire area of the slide was counted (1735 mm3), such that the detection limit would effectively be ~0.1 cell L−1 for all classes of organisms enumerated. The heterocysts of the diatom-associated genera Richelia and Calothrix were counted and the associated diatom was noted. These included diatoms of the following genera: Rhizosolenia, Hemiaulus, and Chaetoceros. Heterocysts of free Richelia intracellularis were also counted. For ease of presentation, we present total heterocysts L−1, i.e., the sum of Richelia and Calothrix. Trichodesmium filaments were enumerated and the length of each filament was recorded. Trichodesmium cell number was then calculated by dividing filament length by the mean cell length (10 ± 2.5 μm, n = 200). For calculation of cells per filament, as in Letelier and Karl (1996), we consider only intact filaments with rounded apical ends in order to avoid underestimation of cells per filament. For colony morphologies, including puffs and tufts (see Figure 1 for morphology), cell numbers were estimated by counting the number of filaments per colony and dividing by mean cell length.
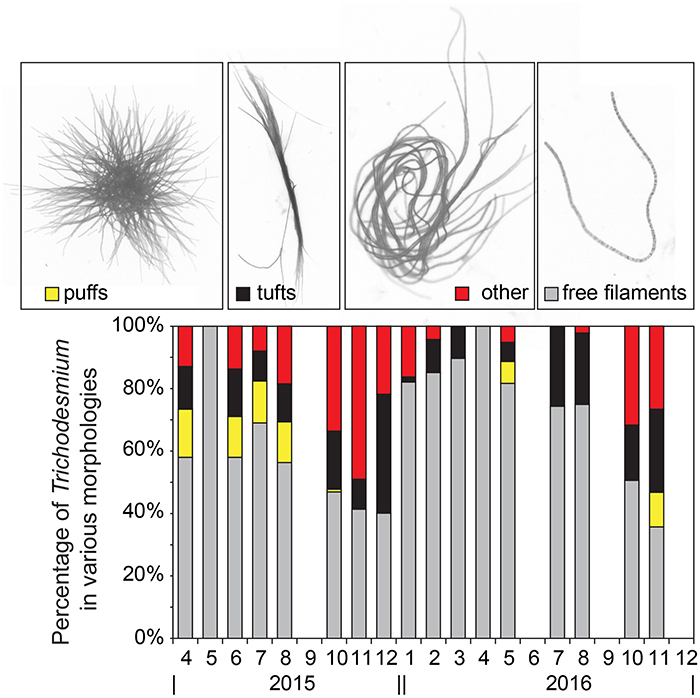
Figure 1. Percentage of Trichodesmium cells in the various morphologies shown in the micrographs on top from left to right: puffs (yellow stacked bar), tufts (black stacked bar), other colonial morphologies (red stacked bar), and free filaments (gray stacked bar).
Quantification of nifH Genes
Abundances of nitrogenase genes (nifH) were quantified by quantitative polymerase chain reaction (qPCR) following procedures described in Church et al. (2009). Seawater for subsequent extraction of DNA was subsampled from CTD rosette bottles (5, 25, and 45 m) into acid-washed, polyethylene 4 L bottles. In the shipboard laboratory, seawater (typically 2 L) was filtered onto 25 mm diameter, 0.2 μm pore size polyethersulfone filters (Pall Supor®) using a peristaltic pump. Filters were placed into 2 mL microcentrifuge tubes containing lysis buffer AP1 (Qiagen) and glass beads (0.1 mm and 0.5 mm), and stored at −80°C until extraction. DNA was extracted and purified using the Qiagen DNeasy Plant Mini Kit, including a bead-beating step. Standards for qPCR assays consisted of dilution series of plasmids containing the target nifH genes; primers and probes for Trichodesmium, Het1, Het2, and Het3 are described in Church et al. (2005, 2008, 2009). Detection limits for these reactions corresponded to ~50 genes L−1 of seawater.
Nitrogen Fixation Rates and Ancillary Data
Rates of N2 fixation were measured during all cruises using the 15N2 assimilation technique (Wilson et al., 2012; Böttjer et al., 2017). To inoculate the seawater samples with the gaseous tracer, the 15N-labeled gas was dissolved in degassed, filtered seawater prior to its addition as per Wilson et al. (2012). The “15N2-enriched seawater” was prepared using filtered surface seawater collected at Station ALOHA and 15N2 gas sourced from Cambridge Isotope Laboratories. The quantity of N isotopes (i.e., N masses equivalent to 28, 29, and 30) was measured in each batch of 15N2-enriched seawater using membrane inlet mass spectroscopy (Kana et al., 1994) using a one-point calibration to air. To conduct the rate measurements in the field, 200 ml of the 15N2-enriched seawater was added to a ~4 L bottle which had been filled with water collected from 5 depths between 5 and 125 m with Niskin bottles attached to a CTD rosette. These bottles were attached to an array and incubated in situ at their approximate collection depths from dawn to dawn. Note that cell counts are only available in the upper 45 m for comparison to rate measurements (5, 25, and 45 m).
Upon termination of all incubations, the entire contents of the ~4 L bottle were filtered via peristaltic pump onto a pre-combusted glass microfiber (Whatman 25 mm GF/F) filter and stored in the −20°C freezer. On land, the filters were dried, pelletized in tin and silver boats, and analyzed for the total mass of N and the δ15N composition analysis using an elemental analyzer-isotope ratio mass spectrometer (Carlo-Erba EA NC2500 coupled with Thermo Finnigan Delta S) at the Stable Isotope Facility of the University of Hawaii as per methods described in Wilson et al. (2012). Internal standards consisting of dried plankton material were included in the analytical run to evaluate instrument drift during analysis.
Station ALOHA records of surface chlorophyll (Chl) concentrations, water column temperature, 14C primary productivity, and sediment trap-based particulate N export at 150 m were obtained from the HOT program (http://hahana.soest.hawaii.edu/hot/). These latter data were only available for 2015.
Estimated Contributions of Large Diazotrophs to Nitrogen Fixation Rates
We have estimated the potential magnitude of N2 fixation associated with these large diazotrophs via a simple biomass-based approach (Tyrrell et al., 2003; Poulton et al., 2009) where the estimated rate is the product of the measured cell concentrations, the upper estimate for the daily duration of N2 fixation (12-h), and cell-specific N2-based N fixation rates derived from the existing literature. For Trichodesmium spp., we consider the upper limit of cell-specific N fixation rates reported by Hutchins et al. (2007) for Pacific and Atlantic isolates of Trichodesmium (25 × 10−6 nmol N cell−1 h−1), whereas for Richelia and Calothrix spp. we use the heterocyst-specific rates (71.5 × 10⁻⁶ nmol N heterocyst−1 h−1) reported by Foster et al. (2011). We have modeled rates using these upper limits and assumed a 12 h photoperiod such that N fixation rates in units nmol N L−1 d−1 are calculated as:
We then compared estimated rates to in situ 15N2 fixation measurements made in the upper 45 m of the water column as well as particulate N export at 150 m as recorded by sediment traps (see Karl and Letelier, 2008 for methods).
Results and Discussion
Trichodesmium Morphology
We have presented all Trichodesmium volumetric concentrations in units of cells L−1; this required consideration of the highly variable morphology of Trichodesmium. For free filaments, we measured the length of each filament from apical end to end (n = 7,586 filaments for the full data record) and divided that length by the mean individual cell length measured from a subset of filaments (10 ± 2.5 μm, range = 4–15 μm, n = 200) to estimate cells per filament. Filament length and width measurements were made using the program Image-Pro Plus, with distance calibrated at each magnification using a standard micrometer. This method follows that of Hynes (2009). Accurate cell length is clearly critical to this calculation. At Station ALOHA, a number of recent papers have observed Clade I to dominate Trichodesmium spp. assemblages (Rouco et al., 2016; Gradoville et al., 2017a). Clade I includes T. thiebautii, T. tenue, T. hildebrandtii, and T. spiralis (Hynes et al., 2012). Within this clade, morphological analyses of seven cultured strains indicate individual cell lengths of 5–22 μm (Hynes et al., 2012). Our measured mean cell length is consistent with these ranges for Clade I species and strains; however, the measured range in cell length (4–15 μm) adds an uncertainty of ~30% to our estimated Trichodesmium cell concentrations.
Measured filament length (i.e., the length of a chain of cells) was log-normally distributed with a mean filament length of 90 μm and a range of 12–6801 μm. Using the measured mean cell length, this equates to a geometric mean and standard deviation of 13.2 ± 2.3 cells filament−1 (range 1.2–685 cells filament−1). This result is significantly less than the mean of 100 cells filament−1 used in modeling studies such as Luo et al. (2012) and reports by Letelier and Karl (1996) for Station ALOHA (100 cells filament−1 average with a range 6–250 cells filament−1, n = 22), which were each based on smaller sample sizes. While the range of filament size we observe is consistent with the oft-used average of 100 cells filament−1, the variability indicates that enumeration of filaments rather than cells will lead to large uncertainties in Trichodesmium biomass.
Of the various morphologies, free filaments dominated the morphological distribution of cells, accounting for 71 ± 26% of all cells on average. The puff and tuft morphologies accounted for 5 ± 15% and 12 ± 16%, respectively, while aggregations not clearly matching either morphological category accounted for the remaining 13 ± 18% (Figure 1). This finding is consistent with Letelier and Karl (1996), where Trichodesmium cells associated with a colony morphology accounted for only 12 ± 11% (n = 11) of the total Trichodesmium biomass. Given that cells were gravity filtered, the possibility of mechanical disruption of colonies and hence overestimation of free filaments is considered low.
In the NPSG, it is clear that free filaments dominate the morphological distribution of Trichodesmium spp. (Maruyama et al., 1970; Marumo and Asaoka, 1974; Letelier and Karl, 1996) and that colonies are observed less frequently. That said, there is no current accepted paradigm for why or how Trichodesmium forms colonies. In culture, there are strains that predominately form colonies (e.g., H-9, Hynes et al., 2012) and there are strong species-specific differences in colony shape (e.g., “puffs” and “tufts”), however the ecological advantages of these differences in morphology are not understood. Unraveling this aspect of Trichodesmium auto-ecology may be the key to understanding bloom formation and decline. A potential clue to colony formation in Trichodesmium, or at least a testable hypothesis, may come from recent research with the freshwater cyanobacteria, Microcystis spp., which showed that certain distinct “specialist bacteria” may trigger extracellular polysaccharide production and colony formation of otherwise single cells of Microcystis spp. (Shen et al., 2011).
Seasonality of Large Diazotrophs
Between 2015 and 2016, cell concentrations for Trichodesmium spp. were <1,000 cells L−1, with the exception of October-December of 2015 and November of 2016 when significant increases (> 2,000 cells L−1) were observed (Table 1, Figure 2). While we do not anticipate absolute cell abundances and gene abundances to agree due to polyploidy (Sargent et al., 2016), variable sampling methodologies, and potential amplification of moribund genetic material from cells that would not be enumerated via epifluorescence, qPCR-based abundances also record high abundances of Trichodesmum gene copies in October–December of 2015 and November of 2016 (Table 1). The ratio of Trichodesmium gene copies to cell abundances (Figure 4) is 130 ± 239 (range = 1.4–1,405) and is higher but not inconsistent with the degree of polyploidy reported by Sargent et al. (2016) (range = 1–120). Notably, the Trichodesmium spp. gene abundances measured in Oct.–Nov. of 2015, when cell abundances were also elevated, were among the highest ever recorded by the HOT program (Church et al., 2009), indicating that qPCR is a sufficient indicator of relative Trichodesmium abundance.
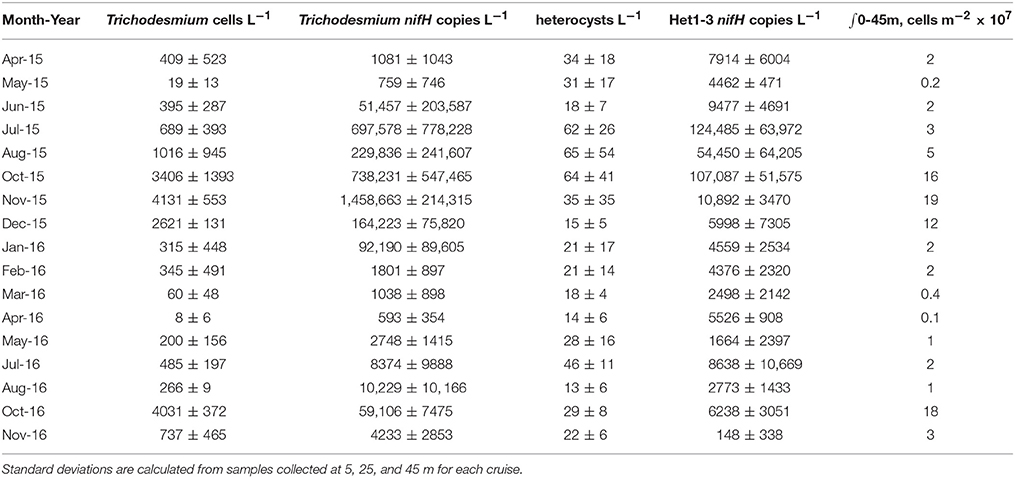
Table 1. Depth-averaged mean and standard deviation of large diazotroph abundance in the upper 45 m as determined via microscopy and qPCR with the depth integrated (∫) abundances of the summed organism classes as determined from microscopy based cell counts.

Figure 2. Box-plots of the monthly time-series of (A) Trichodesmium cells and (B) Richelia + Calothrix heterocysts (the sum of free and diatom-associated heterocysts) in the upper 45 m at Stn. ALOHA. The range of each box spans the 25th−75th percentile of data for each month whereas whiskers are ± 2.7 standard deviations, the red line is the median, and plus symbols are outliers. The dashed vertical line in each panel is the demarcation between years.
The persistent elevation of Trichodesmium spp. cell counts and gene copies observed in late 2015 was unexpected as blooms of this organism are thought to be more episodic and generally occurring in summer-fall months coincident with warm temperatures and strong water column stratification (Capone and Carpenter, 1982; Church et al., 2009). During these bloom phases (Oct.–Dec. 2015), colonial morphologies were also more abundant, accounting for 57 ± 12% of cells when puff, tuft, and other aggregates were summed, relative to the time-series mean of 29 ± 26% for Trichodesmium cells occurring in aggregations (Figure 1). The abundance of colonies appeared to increase after an extended period of water column stratification in 2015 (Table 2, mixed layer depth < 40 m in June–August) and were associated with an increase in fluorometric Chl a (Table 2, 0.16–0.29 μg L−1 between October and December 2015) as well as elevated 14C-based production rates (Table 2, 8.3 ± 0.1 mg C m−3 d−1 in Oct. and 6.3 ± 1.8 mg C m−3 d−1 in December). These values are slightly higher than their respective climatological means: Oct.–Dec. mean Chl = 0.17–0.22 μg L−1 while the climatological mean for production is 6.7 mg C m−3 d−1 in Oct. and 5.5 mg C m−3 d−1 in Dec. This finding of an increase in colony morphologies during periods of enhanced Trichodesmium biomass is consistent with that of Rodier and Le Borgne (2008) who reported a similar shift to colonial morphologies during bloom periods in the lagoons of New Caledonia in the South Pacific. By virtue of a high-frequency sampling strategy, these authors were able to show that growth as well as aggregation led to increased Trichodesmium biomass in the surface mixed layer however colonies accumulated only at the sea surface and not within the mixed layer. Here we cannot discriminate between growth and the potential concentration of cells from deeper in the euphotic zone into the mixed layer, nonetheless it is clear that these blooms coincided with periods when phytoplankton biomass and production were elevated, possibly due to excretion of bioavailable N sources from diazotrophs which fueled non-diazotrophic growth. We also note that our sampling methodology (bottle-based) may have missed surface-trapped cells that would have been captured via net tows.
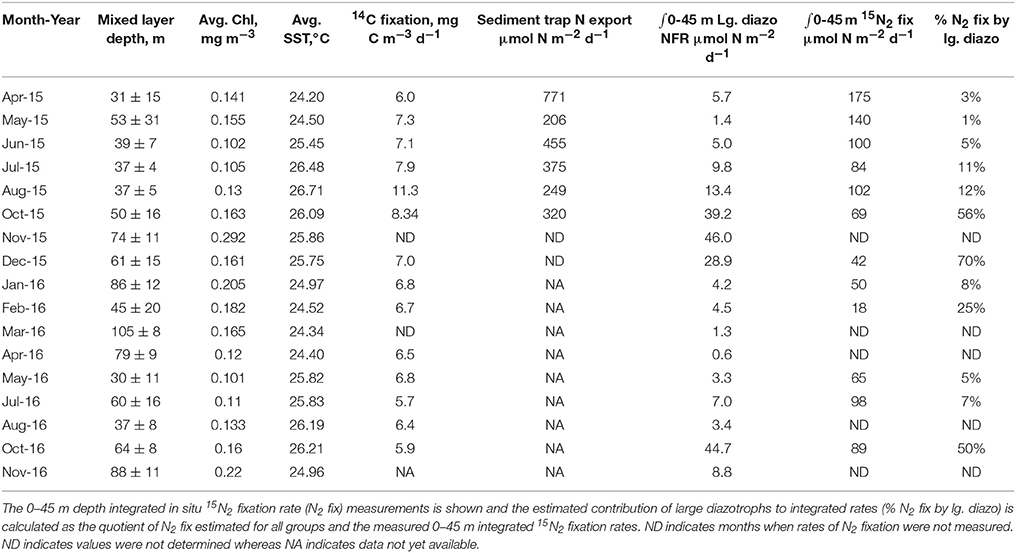
Table 2. Mixed layer depth, mean fluorometric Chl a concentrations (Chl), sea surface temperature (SST), average 14C fixation rates between 5-45 m, and sediment trap particulate N export (at 150 m) for 2015 as recorded by the HOT program.
In comparison, the temporal variability of summed Richelia and Calothrix heterocyst concentrations was less pronounced (Figure 3), with heterocyst abundances in the upper 45 m ranging from 4 to 157 heterocysts L−1. When evaluating specific diatom-symbiont associations (including Rhizosolenia spp., Hemiaulus spp., and Chaetoceros spp.) we found no difference in the percentage of heterocysts associated with individual diatom genera, with the overall mean for heterocysts associated with Rhizosolenia, Hemiaulus, and Chaetoceros, respectively, to be 29 ± 18%, 35 ± 21%, and 29 ± 22% of the total observed and the remaining 2.0 ± 5.0% observed as free filaments. In late summer-fall we do observe elevated abundances of Rhizosolenia-Richelia and Chaetoceros-Richelia particularly in 2015 but also in 2016 for Rhizosolenia-Richelia (Figure 3). Note though that abundances of heterocysts were on average (33 ± 28 heterocysts L−1) significantly lower than that observed for Trichodesmium cells (932 ± 1,364 cells L−1), with the mean concentration of heterocysts associated with Rhizosolenia, Hemiaulus, and Chaetoceros, respectively, to be 9 ± 9 heterocysts L−1, 11 ± 13 heterocysts L−1, and 11 ± 9 heterocysts L−1. When integrating over the upper 45 m, areal distributions of large diazotrophs (Trichodesmium + heterocysts) were on the order of 106-108 cells m−2 (Table 1). These values are consistent with the geometric mean (108 cells m−2) for the sum of Trichodesmium + heterocysts presented in a recently assembled global database (Luo et al., 2012).
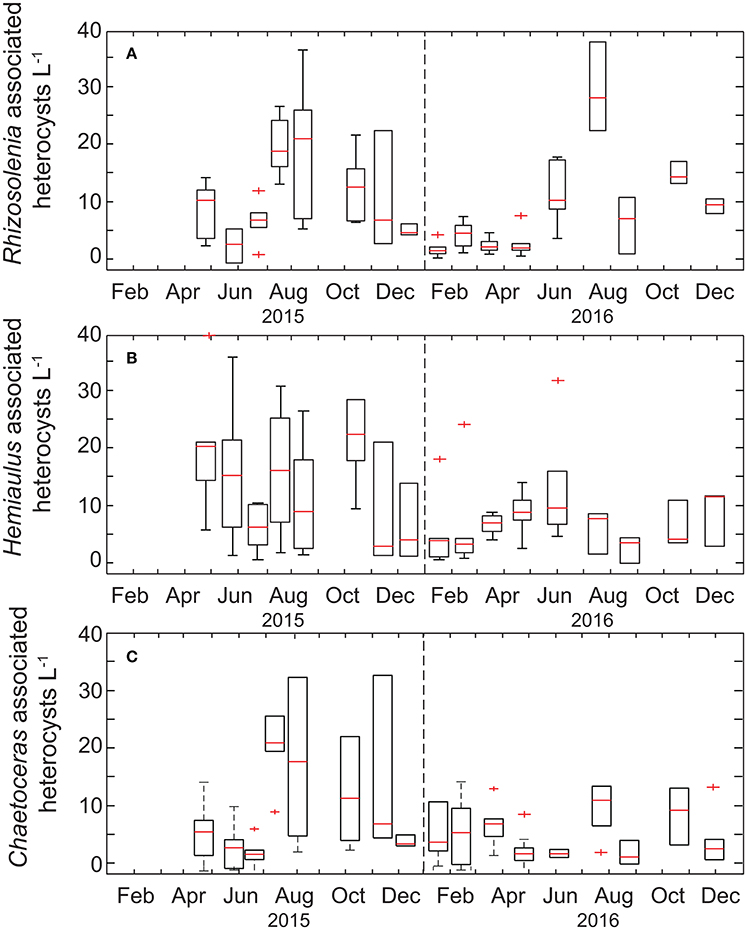
Figure 3. Box-plots of the monthly time-series of heterocysts associated with diatom genera (A) Rhizosolenia, (B) Hemiaulus, and (C) Chaetoceros. The range of each box spans the 25th−75th percentile of data for each month whereas whiskers are ± 2.7 standard deviations, the red line is the median, and plus symbols are outliers.
Notably, gene-based abundances of heterocystous diazotrophs are orders of magnitude greater than cell concentrations (Table 1, Figure 4) although relative change of the two proxies are consistent. A portion of this difference is due to our restriction of cell counts to heterocysts without inclusion of vegetative cells, however given 3–5 vegetative cells per trichome on average (Foster et al., 2007), this methodological difference alone cannot explain the large discrepancy (gene copies: heterocyst counts = 542 ± 811, n = 51). Significantly different volumes were also examined (2 L for qPCR and 10 L for microscopy) and samples were not collected on the same cast such that the natural heterogeneity of these large organisms in the water column may play a role in the observed differences. However, one would expect the larger the volume filtered, the higher the probability of capturing rare or heterogeneously distributed cells. We find the opposite with qPCR suggesting higher cell concentrations than observed via microscopy. The most likely explanation for the discrepancies are variable gene copies per cell. Heterocystous cyanobacteria are known to have more than one gene copy per genome (Foster and O'Mullen, 2008) although it is unclear how variable the relationship between nifH gene copies and cell abundance is in situ. If we adjusted our heterocyst counts by a factor of 5 to include gene copies in vegetative cells, qPCR based abundance are on average more than a 100 × higher than cell-based estimates. Other potential explanations for this disparity include (1) the potential for non-specificity of het-1 and het-2 primers and probes as described in Foster et al. (2007), (2) omission of heterocysts that may have been embedded in Trichodesmium colonies and hence not readily visible via microscopy (Momper et al., 2015), and (3) amplification of moribund DNA that would not have been detected by epifluorescence microscopy. The lack of agreement between gene and cell based abundances is a topic that clearly needs further study.
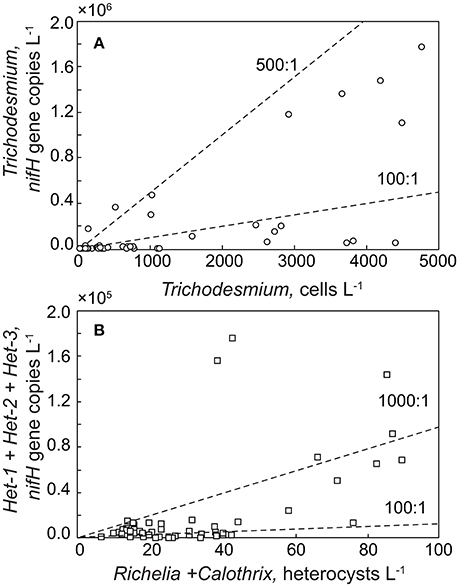
Figure 4. Relationship between cell abundance and gene copies for (A) Trichodesmium and (B) heterocystous cyanobacteria collected in the upper 45 m from Station ALOHA. Note that for heterocystous cells, microscopy-based counts only considered the heterocyst while there are known to be nifH copies in the vegetative cells as well. Isolines of gene copies: cell abundance ratios are noted as dashed lines.
While large diazotrophs were recorded in every sample collected over our study period (Table 1) our findings indicate that neither DDA's nor Trichodesmium spp. were major contributors to plankton biomass. Considering the more abundant of the two classes and the Trichodesmium Chl a content per cell reported by Letelier and Karl (2.6 pg chl a cell−1), the maximum observed Trichodesmium densities in our study would account for <5% of the standing stock of Chl a, significantly less than mean 18% reported by Letelier and Karl (1996) for 1991–1992. Assuming that we have not underestimated large diazotroph biomass, for example by missing surface-trapped cells, our findings indicate that while these relatively rare organisms would not be expected to appreciably contribute to bulk biomass measures, aperiodic enhancement of diazotroph biomass may fuel “echo blooms” as a result of the input of new nitrogen (Walsh and Steidinger, 2001). In contrast to our findings here, other studies have observed significant contributions of large diazotrophs to bulk organic matter. Specifically, Pasulka et al. (2013) microscopically estimated Trichodesmium spp. biovolume at Station ALOHA (2004–2009) in small volume samples (0.5 L filtered and a minimum of 10 ml volume imaged) and concluded that Trichodesmium in the upper 50 m could account for 20–50% of total carbon in late summer to early fall. These authors do note that observations of Trichodesmium were relatively rare events and when observed they were clumped and unevenly distributed on the filters. Additionally, Venrick (1974) recorded up to 2,000 heterocysts L−1 in early transects of the NPSG, and gene-based abundance herein and elsewhere have also reported nifH phylotypes belonging to heterocystous symbionts on the order of ~1000's L−1 (Church et al., 2009; Shiozaki et al., 2017). Keeping in mind the large differences in methodology between prior studies and our own, heterogeneity and aperiodicity appear to be the norm for these large diazotrophs. Future work is necessary to evaluate the environmental triggers that lead to accumulations of these keystone species.
Estimated Contributions of New Production
During the 2015 and 2016 winter blooms, we estimate the upper limit of N fixation rates by Trichodesmium spp. to be ~1.4 nmol N L−1 d−1. During non-bloom periods, rates potentially driven by this genus are estimated to be 0.12 ± 0.21 nmol N L−1 d−1. When N fixation rates measured via 15N2 tracer additions were available (Table 1), we estimate that Trichodesmium productivity generally accounted for ~5% of the measured 0–45 m integrated N2 fixation rates, with the 2015 bloom accounting for 30–90% of measured 15N2 fixation in the upper 45 m. Given the lower abundances of heterocystous diazotrophs compared to Trichodesmium, we estimate reduced group-specific rates of N fixation by these organisms, ranging from 0.01 to 0.13 nmol N L−1 d−1 with contributions to measured 15N2 fixation never exceeding 11%. We have chosen not to make these same calculations using gene-based abundances due to known variability in nifH gene copies per cell. These findings are very similar to findings in the North Atlantic where Martinez-Perez et al. (2016) use single-cell analyses to show that Trichodesmium spp. are generally minor contributors to N fixation (<20%). Importantly these authors (Martinez-Perez et al., 2016) also report high percentages (46%) of non-N2 fixing Trichodesmium spp. and caution that “the large variability observed in Trichodesmium cellular activities indicates that N2 fixation estimates based on the mere abundance should be treated with caution.” If this is the case at Station ALOHA, then our biomass-based rates may over-estimate actual contributions to new production by this enigmatic microorganism.
Particulate N export rates are also available from HOT sediment trap deployments conducted in 2015 (Table 2). We have compared the summed rates of N fixation estimated for these diazotrophs and integrated these rates over the upper 45 m. Comparison of these rates to N export indicate that large diazotrophs would contribute 0.3–17% of the new production reaching the 150 m horizon. These estimates are far less than that predicted by isotopic mass balance (26–47%, Böttjer et al., 2017) indicating that other diazotrophs such as Crocosphaera spp. or Group-A cyanobacteria may fuel the much of the N2 driven new production in this region. This assertion of course assumes our 2-year sampling record is representative of the mean state in the NPSG.
Conclusions
The study of large cell-sized phytoplankton in the oligotrophic ocean is effectively the study of rare species (Chisholm, 1992). While significantly less abundant than the small cyanobacteria that dominate autotrophic community structure in the NPSG (e.g., Prochlorococcus and Synechococcus spp. Campbell and Vaulot, 1993), these large diazotrophs serve unique ecosystem functions. Specifically, these include acting as habitat for a wide array of species, from bacteria to metazoans (O'Neil, 1998; Sheridan et al., 2002; Hewson et al., 2009; Gradoville et al., 2017a) and as a source of “new” nitrogen to an otherwise N starved upper ocean (Karl et al., 1997). Hence, these rare organisms have a disproportionate impact on the ocean metabolism relative to their abundance. By enumerating the cell-based concentrations of Trichodesmium spp. and DDA's over a 2-year period we have characterized the temporal variability of these populations and estimated their impact on measured rates of 15N2 fixation and the export of particles. There are four major findings of our work: (1) the abundance of Trichodesmium spp., is highly variable at monthly time-scales whereas we observed reduced variability and lower concentrations of DDA's in the mixed layer; (2) gene-based and cell-based metrics of diazotroph abundance diverge widely for reasons not fully understood albeit at least in part due to polyploidy and variable genetic content per cell; (3) while colonial morphologies of Trichodesmium spp. generally comprise a minor fraction of the total Trichodesmium cell counts, they are significantly more abundant during bloom periods, and (4) assuming maximum cell-specific N fixation rates from the literature (Hutchins et al., 2007; Foster et al., 2011), we conclude that these large diazotrophs were generally minor contributors to bulk rates of 15N2 fixation as well as N export to 150 m. The exception to this last finding are aperiodic Trichodesmium blooms which appeared to strongly impact upper water column biomass and production in winter months of 2015–2016.
Our first two findings are largely to be expected in the NPSG. Patchiness is a hallmark of Trichodesmium and DDA ecology in oligotrophic regimes (Maruyama et al., 1970; Venrick, 1974; Shiozaki et al., 2017). The more surprising finding of this work is the conclusion that these large diazotrophs are typically minor contributors to both bottle-based 15N2 fixation measurements in this region as well as N export. This conclusion is not isolated; prior studies also indicate a generally minor role for large diazotrophs as contributors to new production. Size-fractionated 15N2 fixation measurements at Station ALOHA indicate that 15N2 fixation in the >10 μm size class accounts for 0–83% of bulk rates with mean contributions of 5, 35, 33, and 12% when seasonally binned for spring, summer, fall, and winter, respectively (Church et al., 2009). Similarly in the West Pacific, Kitajima et al. (2009) measured the abundance of both Trichodesmium cells and Richelia heterocysts ranging from 0 to 436 cells L−1 and report that these genera could only account for <0.7% of the whole-water activity. And as already discussed, recent single-cell analyses in the North Atlantic indicate that Trichodesmium are not uniformly active and contribute generally <20% to total N fixation (Martinez-Perez et al., 2016).
The conundrum then is that a hallmark of Station ALOHA is a predictable and efficient summer export pulse to the deep ocean, presumably driven by large diazotrophs (Karl et al., 2012). Here we try to reconcile these disparate views. Karl et al. (2012) have shown that deep sediment traps record an annual summer pulse of N to ~4000 m in the NPSG which is isotopically, genetically, and elementally consistent with DDA export. Specifically, these authors observed a surface diazotroph community dominated by Group A cyanobacteria whereas nifH genes quantified from particulate matter at 4000 m were dominated by heterocystous phylotypes characteristic of endosymbiotic cyanobacteria. This summer export pulse is thus hypothesized to be driven by rapid, high efficiency export of DDA assemblages in summer (Karl et al., 2012). As a “back of envelope” calculation we can compare the estimated rates of N fixation by the sum of large diazotrophs in the upper water column (~1–46 μmol N m−2 d−1) to measured rates of N export at 4000 m assuming a range of export ratios (export flux/production; Figure 5). Note that the maximum carbon based export ratio at Station ALOHA is 0.15 (measured between 1989 and 2009, Karl et al., 2012). The increase in N flux recorded during the summer export pulse at Station ALOHA is on order of ~ 20 μmol N m−2 d−1 (Karl et al., 2012). In order for estimated production by large diazotrophs alone to account for the level of N export observed in deep traps, the export efficiency would need to be extremely high, e.g., >30%. Alternately, if the export ratio is more consistent with measured ratios (e = 0.02–0.15), then either large diazotroph production would need to be an order of magnitude greater than what we have estimated or other N2-fixing organisms are directly or indirectly contributing to the summer export pulse. While not observed in our study period, there is precedent in the literature for an order of magnitude increase in the concentration of large diazotrophs as discussed earlier (Venrick, 1974; Church et al., 2009; Pasulka et al., 2013; Shiozaki et al., 2017) and presumably their contribution to production and export. And so, while DDA cell abundances were relatively low over our study period and the disparity between cell- and gene-based abundance needs to be reconciled, there are historical records of abundances that are more consistent with summer DDA-driven export than ours. However, given the current knowledge of export ratios, it seems more likely that other smaller diazotrophs may be contributing to the summer export pulse directly or via stimulation of “echo blooms” of non-diazotrophic diatom assemblages. In fact, the water column integrated 15N2 fixation rate measured at Station ALOHA (~ 240 μmol N m−2 d−1), would only require a modest e-ratio (<0.1) to account for the measured increase in N flux. While we do not yet know if a summer export pulse was recorded during our study period, our data indicate that either extremely high export ratios would be required to fuel the observed magnitude of summer export pulses or the abundance and activity of large diazotrophs would need to be significantly greater than observed in this study. Further study of diazotroph abundances in conjunction with cell-specific rate measurements and imaging based records of cell export (e.g., Durkin et al., 2015) in this region is necessary to elucidate the linkages between growth and community structure of diazotrophs in the surface ocean and their relative contributions to particle export.
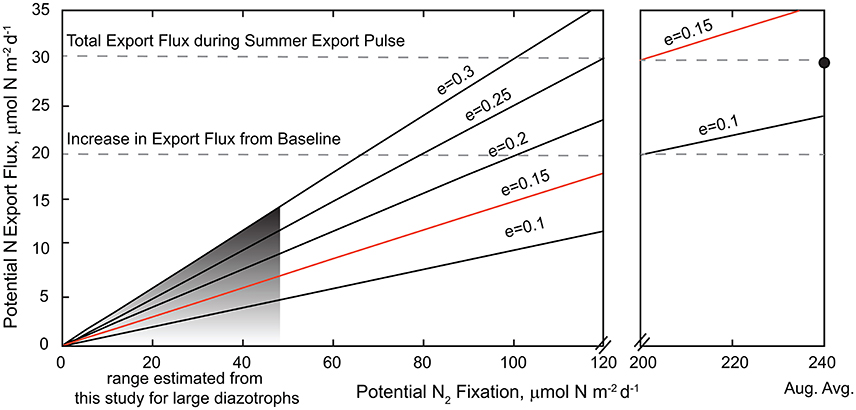
Figure 5. Relationship between potential N2 fixation rates and deep-sea export; note the scale break between 120 and 200 μmol N m−2 d−1. The range of N fixation estimated to be fueled by large diazotrophs (Trichodesmium + DDA's) in the upper 45 m of the water column at Station ALOHA (2015–2016) is shown in gray (~ 1–46 μmol N m−2 d−1). The total water column integrated mean N fixation rate for August (~240 μmol N m−2 d−1) is shown as a filled circle. Potential N export is calculated as a function of potential N2 fixation rates and export ratios ranging from 0.1 to 0.3. The upper range of export ratios (0.15) measured at Station ALOHA is shown in orange. The magnitude of the increase in export flux during the summer export pulse and the total flux are shown as dashed lines. Note that the baseline export flux at Station ALOHA is ~10 mmol N m−2 d−1.
Data Availability Statement
All data are available via the Simons Collaboration on Ocean Processes and Ecology data page (http://scope.soest.hawaii.edu/data/hot/).
Author Contributions
AW: Designed the study and wrote the manuscript; KW-B: Performed all diazotroph cell counts; MC: Contributed nitrogen fixation rate measurements and gene abundances; All authors contributed to editing and revision of the manuscript.
Conflict of Interest Statement
The authors declare that the research was conducted in the absence of any commercial or financial relationships that could be construed as a potential conflict of interest.
“The reviewer RAF declared a past collaboration and co-authorship with one of the authors, AW.”
Acknowledgments
This work was funded by the Simons Foundation (Award 329108 to AW and MC) and made possible via National Science Foundation support of the HOT program (OCE1260164 to MC and DMK). We thank Tara Clemente and the SCOPE operations team for sample collection and shipping. No authors declare any real or perceived financial conflicts of interests.
References
Böttjer, D., Dore, J. E., Karl, D. M., Letelier, R. M., Mahaffey, C., Wilson, S. T., et al. (2017). Temporal variability of nitrogen fixation and particulate nitrogen export at Station ALOHA. Limnol. Oceanogr. 62, 200–216. doi: 10.1002/lno.10386
Bowman, T. E., and Lancaster, L. J. (1965). A bloom of the planktonic blue-green algae, Trichodesmium erythraeum, in the Tonga Islands. Limnol. Oceanogr. 10, 291–293. doi: 10.4319/lo.1965.10.2.0291
Campbell, L., and Vaulot, D. (1993). Photosynthetic picoplankton community structure in the subtropical North Pacific Ocean near Hawaii (station ALOHA). Deep Sea Res. I Oceanogr. Res. Pap. 40, 2043–2060. doi: 10.1016/0967-0637(93)90044-4
Capone, D. G., and Carpenter, E. J. (1982). Nitrogen fixation in the marine environment, Science, 217, 1140–1142. doi: 10.1126/science.217.4565.1140
Capone, D. G., Subramaniam, A., Montoya, J. P., Voss, M., Humborg, C., Johansen, A. M., et al. (1998) An extensive bloom of the N2-fixing cyanobacterium Trichodesmium erythraeum in the central Arabian Sea. Mar. Ecol. Progr. Ser. 172, 281–292. doi: 10.3354/meps172281
Carpenter, E. J., Subramaniam, A., and Capone, D. G. (2004). Biomass and primary productivity of the cyanobacterium Trichodesmium spp. in the tropical N Atlantic ocean. Deep Sea Res. I Oceanogr. Res. Pap. 51, 173–203. doi: 10.1016/j.dsr.2003.10.006
Chisholm, S. W. (1992). “Phytoplankton size,” in Primary Productivity and Biogeochemical Cycles in the Sea. Environmental Science Research, Vol. 43. eds P. G. Falkowski, A. D. Woodhead, and K. Vivirito (Boston, MA: Springer).
Church, M., Björkman, K., Karl, D., Saito, M., and Zehr, J. (2008). Regional distributions of nitrogen-fixing bacteria in the Pacific Ocean. Limnol. Oceanogr. 53:63. doi: 10.4319/lo.2008.53.1.0063
Church, M., Jenkins, B., Karl, D., and Zehr, J. (2005). Vertical distributions of nitrogen-fixing phylotypes at Stn ALOHA in the oligotrophic North Pacific Ocean. Aquat. Microb. Ecol. 38, 3–14. doi: 10.3354/ame038003
Church, M., Mahaffey, C., Letelier, R., Lukas, R., Zehr, J., and Karl, D. (2009). Physical forcing of nitrogen fixation and diazotroph community structure in the North Pacific subtropical gyre. Global Biogeochem. Cycles 23, GB2020. doi: 10.1029/2008GB003418
Dore, J., Brum, J., Tupas, L., and Karl, D. M. (2002). Seasonal and interannual variability in sources of nitrogen supporting export in the oligotrophic subtropical North Pacific Ocean. Limnol. Oceanogr. 47, 1595–1607. doi: 10.4319/lo.2002.47.6.1595
Durkin, C. A., Estapa, M. L., and Buesseler, K. O. (2015). Observations of carbon export by small sinking particles in the upper mesopelagic. Mar. Chem. 175, 72–81. doi: 10.1016/j.marchem.2015.02.011
Foster, R. A., Kuypers, M. M., Vagner, T., Paerl, R. W., Musat, N., and Zehr, J. P. (2011). Nitrogen fixation and transfer in open ocean diatom–cyanobacterial symbioses. ISME J. 5, 1484–1493. doi: 10.1038/ismej.2011.26
Foster, R., and O'Mullen, G. (2008). “Nitrogen-fixing and nitrifying symbioses in the marine environment,” in Nitrogen in the Marine Environment, eds D. Capone, D. Bronk, M. Mulholland, and E. Carpenter (San Diego, CA: Academic Press/Elsevier), 1197–1218.
Foster, R., Subramaniam, A., Mahaffey, C., Carpenter, E., Capone, D., and Zehr, J. (2007). Influence of the Amazon River plume on distributions of free-living and symbiotic cyanobacteria in the western tropical north Atlantic Ocean. Limnol. Oceanogr. 52, 517–532. doi: 10.4319/lo.2007.52.2.0517
Galloway, J. N., Dentener, F. J., Capone, D. G., Boyer, E. W., Howarth, R. W., Seitzinger, S. P., et al. (2004). Nitrogen cycles: past, present, and future. Biogeochemistry 70, 153–226. doi: 10.1007/s10533-004-0370-0
Gradoville, M. R., Crump, B. C., Hase, C., Letelier, R., Zehr, J. P., and White, A. E. (2017b). Diversity and activity of nitrogen-fixing communities across ocean basins. Limnol. Oceanogr. 62, 1895–1909. doi: 10.1002/lno.10542
Gradoville, M. R., Crump, B. C., Letelier, R., Church, M. J., and White, A. E. (2017a). Microbiome of Trichodesmium colonies from the north pacific subtropical gyre. Front. Microbiol. 8:1122. doi: 10.3389/fmicb.2017.01122
Griese, M., Lange, C., and Soppa, J. (2011). Ploidy in cyanobacteria. FEMS Microbiol. Lett. 323, 124–131. doi: 10.1111/j.1574-6968.2011.02368.x
Hewson, I., Poretsky, R. S., Dyhrman, S. T., Zielinski, B., White, A. E., Tripp, H. J., et al. (2009). Microbial community gene expression within colonies of the diazotroph, Trichodesmium, from the Southwest Pacific Ocean. ISME J. 3, 1286. doi: 10.1038/ismej.2009.75
Hutchins, D. A., Fu, F., Zhang, Y., Warner, M. E., Feng, Y., Portune, K., et al. (2007). CO2 control of Trichodesmium N2 fixation, photosynthesis, growth rates, and elemental ratios: implications for past, present, and future ocean biogeochemistry. Limnol. Oceanogr. 52, 1293–1304. doi: 10.4319/lo.2007.52.4.1293
Hynes, A. M. (2009). Diversity of the Marine Cyanobacterium Trichodesmium: Characterization of the Woods Hole Culture Collection and Quantification of Field Populations. Woods Hole, MA: MIT/WHOI.
Hynes, A. M., Webb, E. A., Doney, S. C., and Waterbury, J. B. (2012). Comparison of cultured Trichodesmium (cyanophyceae) with species characterized from the field. J. Phycol. 48, 196–210. doi: 10.1111/j.1529-8817.2011.01096.x
Karl, D. M., Church, M. J., Dore, J. E., Letelier, R. M., and Mahaffey, C. (2012). Predictable and efficient carbon sequestration in the North Pacific Ocean supported by symbiotic nitrogen fixation. Proc. Natl. Acad. Sci. U.S.A. 109, 1842–1849. doi: 10.1073/pnas.1120312109
Kana, T. M., Darkangelo, C., Hunt, M. D., Oldham, J. B., Bennett, G. E., and Cornwell, J. C. (1994). Membrane inlet mass spectrometer for rapid high-precision determination of N2, O2, and Ar in environmental water samples. Anal. Chem. 66, 4166–4170.
Karl, D. M., Letelier, R. M., Hebel, D. V., Bird, D. F., and Winn, C. D. (1992). “Trichodesmium blooms and new nitrogen in the North Pacific gyre,” in Marine Pelagic Cyanobacteria: Trichodesmium and Other Diazotrophs, ed E. J. Carpenter, D. G. Capone, and J. G. Rueter (Dordrecht: Springer), 219–237.
Karl, D., and Letelier, R. (2008). Nitrogen fixation-enhanced carbon sequestration in low nitrate, low chlorophyll seascapes, Mar. Ecol. Prog. Ser. 364, 257–268. doi: 10.3354/meps07547
Karl, D., Letelier, R., Tupas, L., Dore, J., Christian, J., and Hebel, D. (1997). The role of nitrogen fixation in biogeochemical cycling in the subtropical North Pacific Ocean. Nature, 388, 533–538. doi: 10.1038/41474
Kitajima, S., Furuya, K., Hashihama, F., Takeda, S., and Kanda, J. (2009). Latitudinal distribution of diazotrophs and their nitrogen fixation in the tropical and subtropical western North Pacific. Limnol. Oceanogr. 54:537. doi: 10.4319/lo.2009.54.2.0537
Letelier, R. M., and Karl, D. M. (1996). Role of Trichodesmium spp. in the productivity of the subtropical North Pacific Ocean. Mar. Ecol. Progr. Ser. 133, 1–3. doi: 10.3354/meps133263
Luo, Y.-W., Doney, S. C., Anderson, L. A., Benavides, M., Berman-Frank, I., Bode, A., et al. (2012). Database of diazotrophs in global ocean: abundances, biomass and nitrogen fixation rates. Earth Syst. Sci. Data 4, 47–73. doi: 10.5194/essd-4-47-2012
Martinez-Perez, C., Mohr, W., Löscher, C. R., Dekaezemacker, J., Littmann, S., Yilmaz, P., et al. (2016). The small unicellular diazotrophic symbiont, UCYN-A, is a key player in the marine nitrogen cycle. Nat. Microbiol. 1:16163. doi: 10.1038/nmicrobiol.2016.163
Marumo, R., and Asaoka, O. (1974). Distribution of pelagic blue-green algae in the North Pacific Ocean. J. Oceanogr. Soc. Japan 30, 77–85. doi: 10.1007/BF02112896
Maruyama, Y., Taga, N., and Matsuda, O. (1970). Distribution of nitrogen fixing bacteria in the central Pacific Ocean. J. Oceanogr. Soc. Japan 26, 360–366. doi: 10.1007/BF02753907
Momper, L. M., Reese, B. K., Carvalho, G., Lee, P., and Webb, E. A. (2015). A novel cohabitation between two diazotrophic cyanobacteria in the oligotrophic ocean. ISME J. 9, 882–893. doi: 10.1038/ismej.2014.186
Mulholland, M. R., and Capone, D. G. (2001). Stoichiometry of nitrogen and carbon utilization in cultured populations of Trichodesmium IMS101: implications for growth. Limnol. Oceanogr. 46, 436–443. doi: 10.4319/lo.2001.46.2.0436
O'Neil, J. M. (1998). The colonial cyanobacterium Trichodesmium as a physical and nutritional substrate for the harpacticoid copepod Macrosetella gracilis. J. Plankton. Res. 20, 43–59. doi: 10.1093/plankt/20.1.43
Pasulka, A. L., Landry, M. R., Taniguchi, D. A., Taylor, A. G., and Church, M. J. (2013). Temporal dynamics of phytoplankton and heterotrophic protists at station ALOHA. Deep Sea Res. II Top. Stud. Oceanogr. 93, 44–57. doi: 10.1016/j.dsr2.2013.01.007
Poulton, A. J., Stinchcombe, M. C., and Quartly, G. D. (2009). High numbers of Trichodesmium and diazotrophic diatoms in the southwest Indian Ocean. Geophys. Res. Lett. 36:L15610. doi: 10.1029/2009GL039719
Robidart, J. C., Church, M. J., Ryan, J. P., Ascani, F., Wilson, S. T., Bombar, D., et al. (2014). Ecogenomic sensor reveals controls on N2-fixing microorganisms in the North Pacific Ocean. ISME J. 8, 1175–1185. doi: 10.1038/ismej.2013.244
Rodier, M., and Le Borgne, R. (2008). Population dynamics and environmental conditions affecting Trichodesmium spp. (filamentous cyanobacteria) blooms in the south–west lagoon of New Caledonia. J. Exp. Mar. Biol. Ecol. 358, 20–32. doi: 10.1016/j.jembe.2008.01.016
Rouco, M., Haley, S. T., and Dyhrman, S. T. (2016). Microbial diversity within the Trichodesmium holobiont. Environ. Microbiol. 18, 5151–5160. doi: 10.1111/1462-2920.13513
Sargent, E. C., Hitchcock, A., Johansson, S. A., Langlois, R., Moore, C. M., LaRoche, J., et al. (2016). Evidence for polyploidy in the globally important diazotroph Trichodesmium. FEMS Microbiol. Lett. 363:fnw244. doi: 10.1093/femsle/fnw244
Scharek, R., Tupas, L., and Karl, D. M. (1999). Diatom fluxes to the deep sea in the oligotrophic North Pacific gyre at Station ALOHA. Mar. Ecol. Prog. Ser. 182, 55–67. doi: 10.3354/meps182055
Shen, H., Niu, Y., Xie, P., Tao, M., and Yang, X. (2011). Morphological and physiological changes in Microcystis aeruginosa as a result of interactions with heterotrophic bacteria. Freshw. Biol. 56, 1065–1080. doi: 10.1111/j.1365-2427.2010.02551.x
Sheridan, C. C., Steinberg, D. K., and Kling, G. W. (2002). The microbial and metazoan community associated with colonies of Trichodesmium spp.: a quantitative survey. J. Plankton Res. 24, 913–922. doi: 10.1093/plankt/24.9.913
Shiozaki, T., Bombar, D., Riemann, L., Hashihama, F., Takeda, S., Yamaguchi, T., et al. (2017). Basin scale variability of active diazotrophs and nitrogen fixation in the North Pacific, from the tropics to the subarctic Bering Sea. Global Biogeochemical Cycles. 31, 996–1009. doi: 10.1002/2017GB005681
Tyrrell, T., Maranon, E., Poulton, A. J., Bowie, A. R., Harbour, D. S., and Woodward, E. M. S. (2003). Large-scale latitudinal distribution of Trichodesmium spp. in the Atlantic Ocean. J. Plankton Res. 25, 405–416. doi: 10.1093/plankt/25.4.405
Venrick, E. L. (1974). The distribution and significance of Richelia intracellularis Schmidt in the North Pacific Central Gyre. Limnol. Oceanogr. 19, 437–445. doi: 10.4319/lo.1974.19.3.0437
Walsh, J. J., and Steidinger, K. A. (2001). Saharan dust and Florida red tides: the cyanophyte connection. J. Geophys. Res. Oceans 106, 11597–11612. doi: 10.1029/1999JC000123
Wilson, S. T., Böttjer, D., Church, M. J., and Karl, D. M. (2012). Comparative assessment of nitrogen fixation methodologies, conducted in the oligotrophic North Pacific Ocean. Appl. Environ. Microbiol. 78, 6516–6523. doi: 10.1128/AEM.01146-12
Zehr, J. P., Mellon, M. T., and Zani, S. (1998). New nitrogen-fixing microorganisms detected in oligotrophic oceans by amplification of nitrogenase (nifH) genes. Appl. Environ. Microbiol. 64, 3444–3450.
Keywords: nitrogen fixation, Trichodesmium, North Pacific Subtropical Gyre, Richelia, qPCR
Citation: White AE, Watkins-Brandt KS and Church MJ (2018) Temporal Variability of Trichodesmium spp. and Diatom-Diazotroph Assemblages in the North Pacific Subtropical Gyre. Front. Mar. Sci. 5:27. doi: 10.3389/fmars.2018.00027
Received: 31 October 2017; Accepted: 18 January 2018;
Published: 14 February 2018.
Edited by:
Rex Malmstrom, Joint Genome Institute (DOE), United StatesReviewed by:
Julie Robidart, National Oceanography Centre Southampton, United KingdomRachel Ann Foster, Stockholm University, Sweden
Copyright © 2018 White, Watkins-Brandt and Church. This is an open-access article distributed under the terms of the Creative Commons Attribution License (CC BY). The use, distribution or reproduction in other forums is permitted, provided the original author(s) and the copyright owner are credited and that the original publication in this journal is cited, in accordance with accepted academic practice. No use, distribution or reproduction is permitted which does not comply with these terms.
*Correspondence: Angelicque E. White, YW5nZWxpY3F1ZS53aGl0ZUBnbWFpbC5jb20=