 Bjørn E. Grøsvik1*
 Tatiana Prokhorova2Elena Eriksen1
 Pavel Krivosheya2Per A. Horneland1
 Dmitry Prozorkevich2
- 1Norwegian Institute of Marine Research, Bergen, Norway
- 2Knipovich Polar Research Institute of Marine Fisheries and Oceanography, Murmansk, Russia
This study presents a large-scale monitoring of marine litter performed in the joint Norwegian–Russian ecosystem monitoring surveys in the period from 2010 to 2016 and contribute to documentation of the extent of marine litter in the Barents Sea. The distribution and abundance of marine litter were calculated by recordings of bycatch from the pelagic trawling in upper 60 m, from bottom trawling close to the sea floor, and floating marine debris at surface by visual observations. The study is comprehensive regarding coverage and number with registrations from 2,265 pelagic trawls and 1,860 bottom trawls, in addition to surface registration between the stations. Marine litter has been recorded from 301 pelagic and 624 of the bottom trawl catches. In total, 784 visual observations of floating marine debris were recorded during the period. Marine litter has been categorized according to volume or weight of the material types plastic, wood, metal, rubber, glass, paper, and textile. Marine litter is observed in the entire Barents Sea and distribution vary with material densities, ocean currents and depth. Plastic dominated number of observations with marine litter, as 72% of surface observations, 94% of pelagic trawls, and 86% of bottom trawls contained plastic. Observations of wood constituted 19% of surface observations, 1% of pelagic trawls, and 17% of bottom trawls with marine litter. Materials from other categories such as metal, rubber, paper, textile, and glass were observed sporadically. Recordings of wood dominated surface observations (61.9 ± 21.6% by volume) and on seafloor (59.4 ± 35.0% by weight), while plastic dominated marine litter observations in upper 60 m depth (86.4 ± 16.5% by weight) over these 7 years. Based on recordings and volume or area covered, mean levels of plastic in the upper 60 m of the Barents Sea were found to 0.011 mg m−3 (pelagic) and 2.9 kg km−2 at sea floor over the study period. Average levels of marine litter (all material types) at the sea floor were found to be 26 kg km−2.
Introduction
During the last years marine litter has received more attention as an important threat to animal life and ecosystem health. Marine litter is defined as any persistent, manufactured, or processed solid material discarded, disposed of, or abandoned in the marine environment (UNEP, 2009). In 2015, 322 million tons of plastic were produced globally, in addition to 61 million metric tons synthetic fibers (Lusher et al., 2017). It has been estimated that in 2010, between 4.8 and 12.7 million metric tons of plastic waste entered directly into the oceans (Jambeck et al., 2015). Population densities and the effectiveness of waste management systems largely determined which country contributed most to uncaptured waste becoming marine debris (Jambeck et al., 2015).
As part of the objectives in the Marine Strategy Framework to achieve good environmental status in all EU marine waters by 2020, marine litter is listed as descriptor ten of eleven descriptors important for this goal. The aim for marine litter is to ascertain that properties and quantities of marine litter do not cause harm to the coastal and marine environment (EU-MSDF, 2008).
Marine debris and microplastics have been reported everywhere people have investigated its occurrence in the marine environment; at surface, in the water column, in biota, at sea floor and in sediments (GESAMP, 2016; UNEP, 2016). It is a classic transboundary issue, in many cases unseen, but end up in the environment, probably to a large degree on the sea floor. Large variation in occurrence and densities of marine litter at the sea floor have been reported from different areas, dependent on distance to coastline, population densities, distance to shipping routes, rivers, topography, water currents, and circulations. Material densities, fouling processes, size and shape are important for transport distance and sedimentation rate. Highest densities of marine litter have been found in submarine canyons, while continental shelves and ocean ridges have the lowest densities (Galgani et al., 2000; Ramirez-Llodra et al., 2011; Pham et al., 2014; Woodall et al., 2015; Buhl-Mortensen and Buhl-Mortensen, 2017). In the Mediterranean, densities of marine litter collected by trawling from deep water areas (mean depth 1,400–3,000 m) ranged from 400 kg km−2 at the continental slope south of Palma de Mallorca to densities ranging between 70 and 180 kg km−2 at the other sites (Galgani et al., 2000; Pham et al., 2014). In four gulfs in Greece, densities ranged from 7 to 47 kg km−2 (Koutsodendris et al., 2008). Densities of litter in the Ryukuy Trench and in the basin of Okinawa through in the Northwest Pacific ranged from 8 to 121 kg km−2, while shallower continental slopes or abyssal plains ranged from 0.03 to 9 kg km−2 (Shimanaga and Yanagi, 2016). In the European part of the Atlantic Ocean, 43–74 kg km−2 have been recorded in the Bay of Biscay (Lopez-Lopez et al., 2017), while a mean of 123 kg km−2 have been estimated offshore at the Norwegian shelf and slope in the Norwegian Sea, and 154 kg km−2 have been estimated offshore in the Barents Sea (Buhl-Mortensen and Buhl-Mortensen, 2017). For coastal areas, higher levels were recorded; A mean of 2,510 kg km−2 was recorded along the Norwegian coast from Ålesund to Lofoten and 227 kg km−2 from Lofoten to the Russian border (ibid).
The main sources of marine litter in Nordic Seas are sea based from maritime activities, such as fisheries, shipping, oil and gas exploration, and tourism. Discharges of human consumables can origin from both sea- and land based activities (UNEP, 2009). Population densities and intensity of the marine activities are important for how large input of marine litter may be (Pham et al., 2014; Jambeck et al., 2015). Abandoned fish gear lead to ghost fishing and entanglement (Gilardi et al., 2010). A vast number of species has been documented to be entangled in, or having ingested marine litter and die from of damage related to marine litter every year (UNEP, 2009; Gall and Thompson, 2015; Kühn et al., 2015). Species like sea birds, sea mammals, turtles, and fish are susceptible to such effects (ibid.).
The Barents Sea is a transition zone between Atlantic and Arctic conditions and is influenced by strong inflow of Atlantic waters with an annual mean inflow of 2 Sverdrup (Sv) and weaker inflow of coastal (~1 Sv) and Arctic waters (~1 Sv). Since the 1980s the Barents Sea has gone from a situation with high fishing pressure, cold conditions and low demersal fish stock levels, to the current situation with high levels of demersal fish stocks, reduced fishing pressure, and warmer conditions (ICES, 2017). As boreal species like cod, migrate northwards for feeding, cod fisheries also moves in to the northern areas. The Barents Sea is classified as a clean and rich ocean with low levels of environmental pollution (ICES, 2017). Time-series recorded for the last two decades show that the levels of persistent organic pollutants have been stable or decreasing (ICES, 2017). With regards to marine litter, increased concern is directed to this area as oceanographic modeling indicate the Barents Sea to be a potential gyre for marine litter accumulation (van Sebille et al., 2012). Plastic, as other floating marine debris, could be transported by currents along the coast and in to the open sea (Barnes et al., 2009). Recent studies with microplastic measurements at the surface in the Arctic ocean and the Barents Sea added support for this possibility (Cózar et al., 2017).
This study presents a large-scale recording of marine litter performed in the joint Norwegian–Russian ecosystem monitoring surveys in the period from 2010 to 2016. This comprehensive monitoring program (spatial coverage of 350 thousand square nautical miles and sampling effort of >4,000 stations) of marine litter is unique and contribute to documentation of the extent of marine litter in the ecosystem. Marine litter has been categorized according to volume or weight of the material types plastic, wood, metal, rubber, glass, paper, and textile. We investigated spatial pattern of marine litter taken from the two types of trawls (pelagic trawl: covering 0–60 m and bottom trawl: covering bottom and ca. 5 m above) and floating marine debris at surface observed from the ship.
Materials and Methods
Study Area
The Barents Sea is a large shelf area (about 1.6 million km2) located at high latitudes between 70 and 80°N to the north of Norway and Russia. The mean depth is about 230 m and the maximum depth in the western Barents Sea is about 500 m. Two archipelagos (Spitsbergen and Franz Josef Land) are located in the northern Barents Sea. The bottom topography is complex with several larger (Central bank) and smaller (North Cape Bank, Spitsbergen Bank, Thor Iversen Bank and Tidley Bank) banks and deeper trenches (Bear Island Channel, St. Anna Trough, Central Bank Basin and Murman Rise in between. In the western part the Bear Island Trough provides a deeper connection with the Norwegian Sea, and in the northeast the St. Anna Trough provides a deeper connection with the Arctic Ocean via the northern Kara Sea (Figure 1). The bottom topography with banks and basins steers the currents and governs the distribution of water masses in the Barents Sea (Loeng, 1991). Warm and saline Atlantic waters flow into the southwestern Barents Sea from the Norwegian Sea. The North Atlantic Drift splits into two main branches, one flowing into and through the Barents Sea from southwest to northeast, the other flowing around the western and northern flanks of the Barents Sea as the West Spitsbergen Current (Figure 1, Skagseth et al., 2008; Ingvaldsen and Loeng, 2009; Ozhigin et al., 2011). Cold fresh Arctic waters arrive from the Arctic Ocean, entering the Barents Sea between Nordaustlandet and Franz Josef Land and between Franz Josef Land and Novaya Zemlya. The Norwegian Coastal Current flows eastwards following the coastline and bring fresh water from the northern Norwegian and Russian coasts in to the Barents Sea.
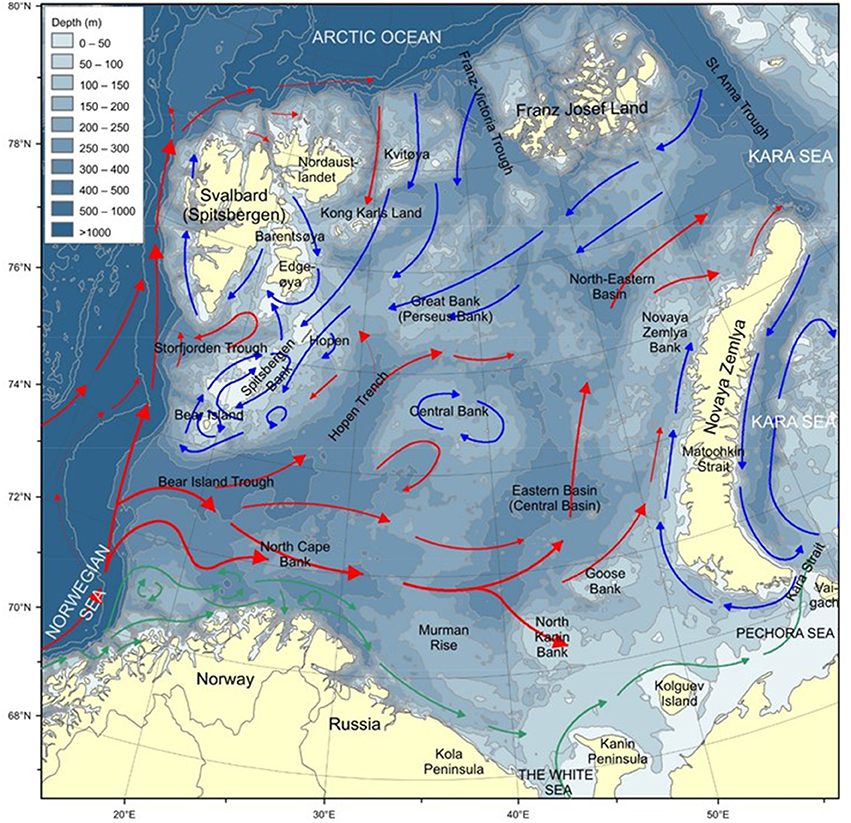
Figure 1. The Barents Sea. Red arrows show Atlantic water currents, blue arrows Arctic currents and green arrows currents of coastal waters. Published with courtesy of Institute of Marine Research, Norway.
The Monitoring Activities and Sampling
The Barents Sea Ecosystem Survey covered the entire Barents Sea with 35 nautical miles between stations (Figure 2, Survey activities 2010–2016; Eriksen et al., 2017). Two to three Norwegian vessels cover the Norwegian economic zone and the Fisheries protection zone around Svalbard, and one to two Russian vessels cover the Russian economic zone. The indicated stations include a bottom trawl haul, a pelagic trawl haul (0–60 m) and other equipment (more detail in Michalsen et al., 2011). All vessels use standard trawls and trawling procedures and data are comparable between vessels and years.
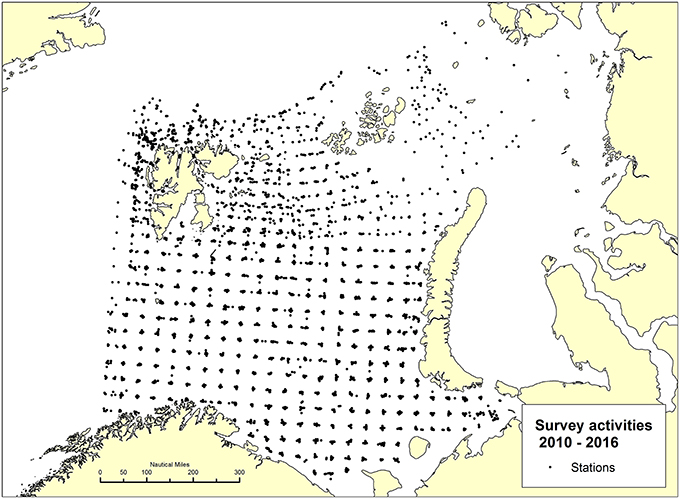
Figure 2. Survey activities 2010–2016. The BESS covers the entire Barents Sea with 35 nautical miles between ecosystem stations. Dots indicate stations, where pelagic and bottom trawl hauls were taken. Location of station varied slightly between years.
Trawling
The distribution and abundance of marine litter in upper 60 m are based on pelagic trawling with a small meshed pelagic trawl “Harstad trawl” with a mouth opening of 20 × 20 m, with seven panels and a cod end. The panels have mesh sizes varying from 100 mm in the first part to 30 mm in the end. Pelagic trawling was carried out at three depths, each over a distance of 0.5 nautical mile, with the headline of the trawl located at 0, 20, and 40 m, respectively, and with trawling speed of three knots.
The distribution and abundance of marine litter near the bottom are based on trawling with the standard research bottom trawl “Campelen 1800 shrimp trawl” with 80 mm (stretched) mesh size in the front, cod-ends of 22 mm mesh size and a cover net of 116 mm meshes. The trawl was equipped with a rockhopper ground gear and sweep wire length of 40 m, plus 12 m wire for connection to the doors. Standard tow duration was 15 min at three knots. Trawl performance was constantly monitored by Scanmar trawl sensors, i.e., distance between the doors, vertical opening of the trawl and bottom contact control. From trawl catches, marine litter were sorted and classified according to material type and weight. When starting up registration of marine litter as bycatch from the Barents Sea ecosystem surveys IMR and PINRO decided to use a simple classification of marine litter: plastic, wood, metal, rubber, glass, paper, and textile (some years). The data were recorded (category and numbers) in standard data base on board and later transferred to the IMR/PINRO data base. The data of marine litter do not include information about sources of (e.g., from fisheries, human consumables, or other).
Visual Observations
During transit between stations (35 nm miles), observations of floating marine debris at surface were recorded by whale observers, and material types and volumes were noted. Visual observations were taken only during day time and when weather and visibility was suitable. Observers recorded approximate volume of the same categories of the floating marine debris. For this reason, data from visual observation have some uncertainties due to several limitations described above and should therefore be interpreted with care, but still contain valuable information. For more information see annual survey reports from the BESS, which are available on https://www.hi.no/tokt/okosystemtokt_i_barentshavet/survey_reports/nb-no.
Data Treatment: Mapping, Composition, and Analyzing
Recordings of marine litter from surface, pelagic trawl and bottom trawl from 2010 to 2016 have been used to prepare GIS maps to map the distribution in the Barents Sea. Figures 2–5 were made with land maps from ESRI and bathymetric contours from GEBCO with ArcGIS 10.5.1. The three or four most abundant material types were plotted to indicate area of occurrence and distribution.
Pelagic catches were standardized by filtered volume of water defined by towing distance for each trawling 0.5 nautical miles (926 m), trawl opening (20 × 20 m) and covered depth (0–60 m). Furthermore, the pelagic marine litter (weight per m3) were calculated by mean weight per haul, frequencies of stations with marine litter and filtered volume. Densities of marine litter at sea floor (weight per km2) were estimated by mean weight and frequencies of stations with marine litter and covered area (distance * trawl width). Towing time was 15 min for three knots.
Visual estimated volume of the floating marine debris was used for mapping and correlations analyses only. Pearson correlation were used to study relation between annual and total occurrence of categories (plastic and wood only), and environmental parameters (latitude and longitude) (for surface, pelagic, and bottom observations) and depth (for bottom observations).
Results
During the joint Norwegian–Russian Barents Sea ecosystem surveys in the period from 2010 to 2016, large scale recordings of marine litter from surface and as bycatch in pelagic and bottom trawls have been performed. Weight of marine litter of different material types have been recorded from 2,265 pelagic trawls and 1,860 bottom trawls in addition to surface observations between the stations by whale observers. Marine litter has been recorded from 301 pelagic and 624 of the bottom trawl catches. In total, 784 visual observations of floating marine debris were recorded during the period. Annual records of marine litter are summarized in Table 1. Plastic dominated number of observations, as 72% of surface observations, 94% of pelagic trawls, and 86% of bottom trawls with marine litter contained plastic. Observations of wood constituted 19% of surface observations, 1% of pelagic trawls with marine litter and 17% of bottom trawls with marine litter. Materials from other categories such as metal, rubber, paper and textile, and glass were observed sporadically.
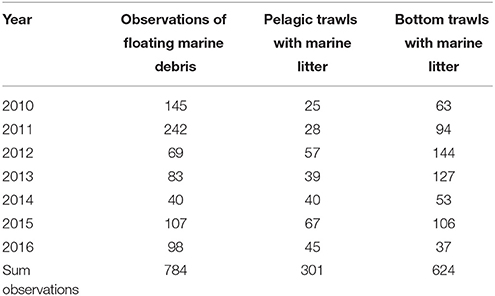
Table 1. Number of observations of floating marine debris and number of trawls, where any kind of marine litter observed given for each years and sum for the studied period 2010–2016.
Surface Observations
Floating marine debris were widely distributed in the Barents Sea, while highest volume of marine litter was observed in the central, eastern and northern areas (Figure 3). Wood dominated the floating marine debris observations (61.9 ± 21.6% by volume), while plastic constituted 34.6 ± 22.3% by volume. Metal, rubber and paper were recorded sporadically (Table 2).
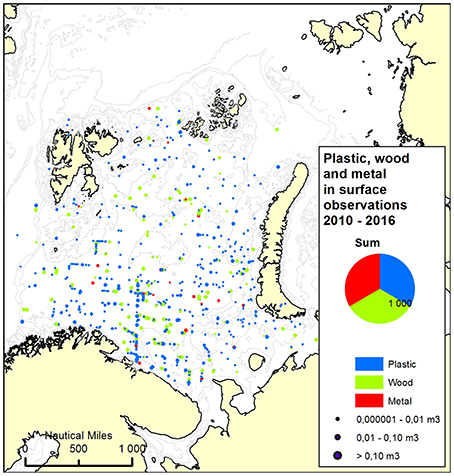
Figure 3. Marine litter from surface observations 2010 to 2016. Observations of plastics (blue), wood (green) and metal (red).
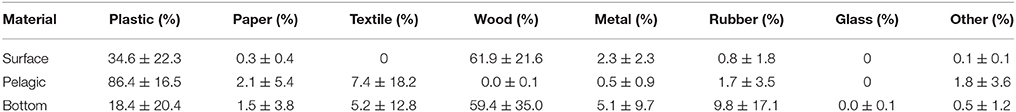
Table 2. Percentage composition of marine litter floating at surface (by volume), or as bycatch in pelagic and bottom trawls (by weight) for the period 2010–2016, presented as mean per year ± SD.
Larger volume of floating wood was observed in 2010, 2011, and 2015, with estimated volumes of 11.9, 17.0, and 8.7 m3, respectively. Floating wood significantly correlated with latitude and longitude some years, and indicated northward distribution in 2011 and 2013, north-eastern in 2014 and 2016, and eastward in 2012 (Table 3). Larger volume of floating plastic was observed in 2011 and 2012 (11.7 and 5.0 m3, respectively). Floating plastic were significantly correlated with latitude and longitude some years, and indicated northward distribution in 2013 and 2016, while westward in 2014 (Table 3).
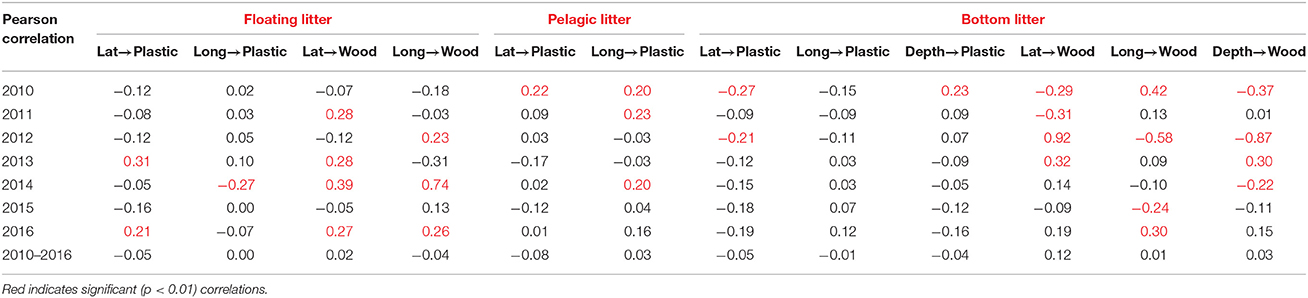
Table 3. Pearson correlations between marine litter and environmental parameters [latitude and longitude (for surface observations, pelagic, and bottom catches) and depth (for bottom catches)].
Pelagic Marine Litter in Upper 60 m
Pelagic marine litter were observed in 13% of all pelagic trawls with a mean of 58 gram per trawl catch (Table 4). Marine litter from pelagic trawls distributed wider in the Barents Sea, while highest catches were distributed in the south western and north central areas, and close to the Norwegian and Svalbard coast (Figure 4).
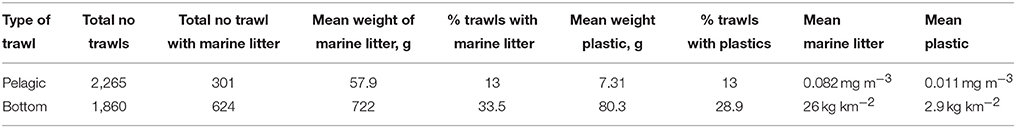
Table 4. Marine litter observations, frequencies, and mean amount in the Barents Sea.
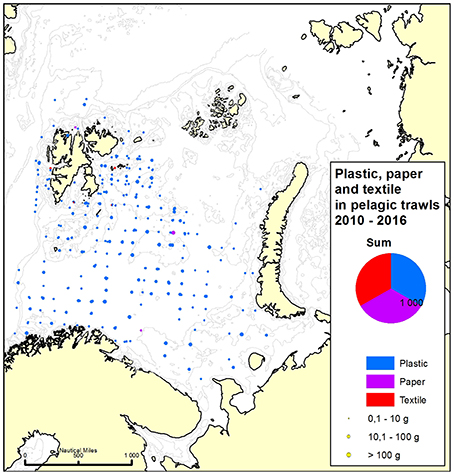
Figure 4. Marine litter from pelagic trawl from 2010 to 2016. Observations of plastics (blue), paper (purple) and textile (red).
Plastic was the bulk (85.1%) of pelagic marine litter observations (Table 2) with mean 0.011 mg m−3 (Table 4). Paper (9.4%) and textile (3.9%) were observed more seldom, while other materials only sporadically (Table 2). Pelagic plastic was significantly correlated with latitude and longitude some years, and indicated north-eastern distribution in 2010, and northern distribution in 2011 and 2014 (Table 3).
Marine Litter From Bottom Trawl
Marine litter as bycatch from bottom trawling were observed in 33.5% of all bottom trawl hauls with a mean of 772 g per haul (Table 4). Marine litter from bottom trawls distributed wider in the Barents Sea, while the highest catches were taken in the western, south eastern, north eastern, and around Svalbard (Figure 5). Plastic were observed from the entire Barents Sea, processed wood in the eastern and northern parts, and metal and rubber in the south east (Figures 5, 6). Processed wood dominated the amount of marine litter from bottom trawls with a mean of 66% of the weight of all catches with any type of marine litter. Plastic constituted 11.4% of the weight, but dominated the number of observations. Metal and rubber consisted ~10% of the weight but from few numbers of observations. On average, 26 kg km−2 of marine litter was found in the Barents Sea, with an average of 2.9 kg km−2 of plastics-only (Table 4).
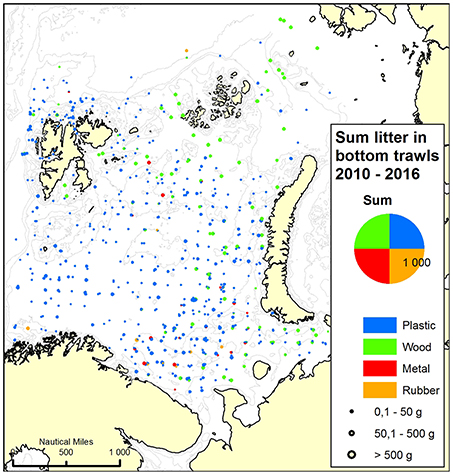
Figure 5. Marine litter from bottom trawl from 2010 to 2016. Observations of plastics (blue), wood (green), metal (red) and rubber (orange).
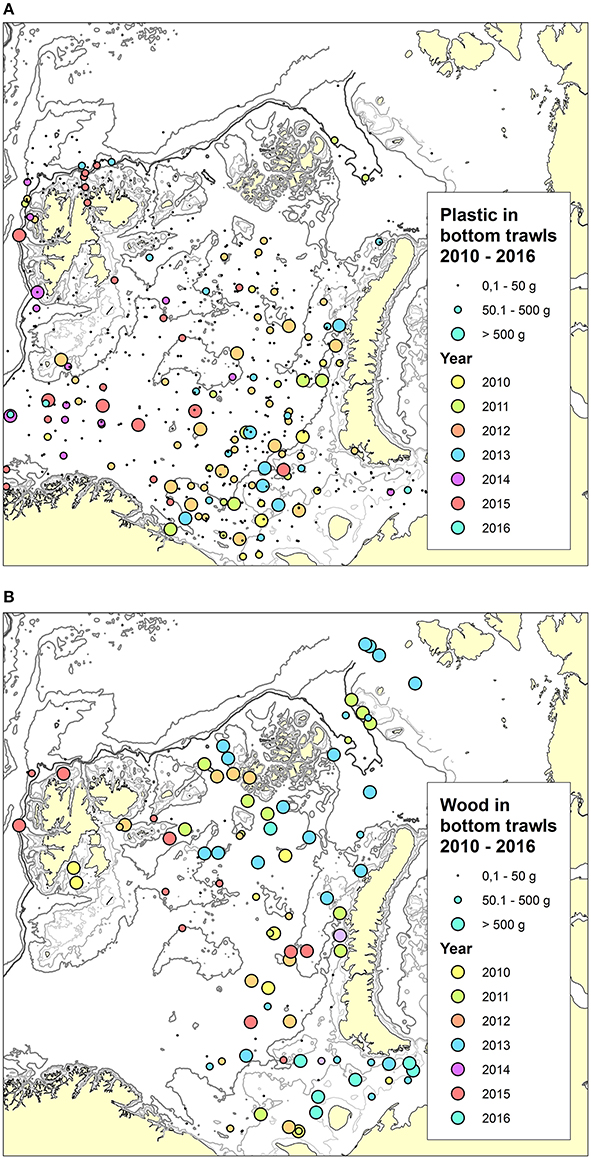
Figure 6. Plastic and wood in bottom trawls from 2010 to 2016, (A) Plastic only. (B) Wood only. Different colors indicated per year.
In 2010 and 2012, plastic from bottom trawling significantly correlated with latitude and indicated southern distribution (Table 3 and Figure 6A). Wood indicated variations in distribution between years (Table 3), but were mainly distributed in the eastern and northern parts of the Barents Sea (Figure 6B).
Plastic from bottom trawls were widely distributed in the Barents Sea (Figures 5, 6A). High number of plastic observations from bottom trawls were found in the areas of 100 to 300 m depth (Figure 7). Large amounts were also found in deeper areas (>400 m, Figure 7), along the north and west part off Svalbard (Figures 5, 6A).
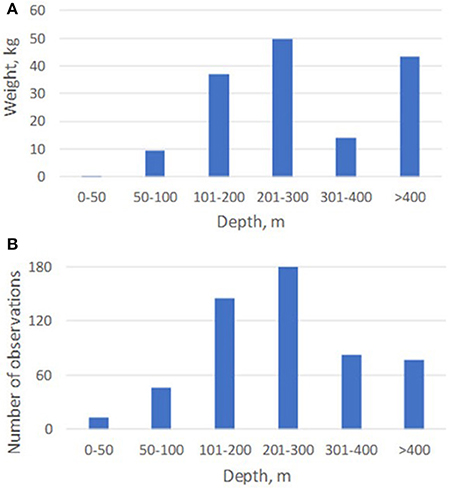
Figure 7. Weight (A) and number of observation (B) of plastic from bottom trawls separated by depth.
Discussion
Occurrence of marine litter, especially plastic and wood, were observed more frequently and over larger areas, while other types (glass, paper, rubber, and textile) were observed seldom and over restricted areas. Wood dominated by weight at surface and on the sea floor, and were most likely transported by rivers, ocean currents, and winds into the open sea. Our results indicate the distribution of marine litter to vary with material densities, ocean currents, and depth. This is in accordance with observation from other areas (Galgani et al., 2000; Barnes et al., 2009; Ramirez-Llodra et al., 2013).
Occurrence of plastic in trawl catches and visual observations increased from the seafloor (11%) to floating at surface (35%) and were highest in the pelagic layer (upper 60 m), with 85% of the recordings. The pelagic layer is an important feeding area during summer-fall, where plankton, juvenile fish, and large pelagic fish stocks occurs, and the accumulation of different type of food sources attract the predators such as larger fish, marine mammals, and sea birds. Plastic particles may be ingested by fish, sea mammals, and sea birds. This could be due to sun reflection resembling reflections in plankton, fish eyes or fish scales, or color (Kühn et al., 2015). Plastic could also resemble the shape of jellyfish, which are a food source for fish and sea birds (ibid). Marine-seasoned microplastics can produce a dimethyl sulfide signature that is also an odorant/smell attractive for living organism to prey (Savoca et al., 2016). Too high levels of ingested marine litter may clog the digestion system and be fatal for the organisms, as has been reported for many organisms like birds, turtles, fish, and sea mammals (Gall and Thompson, 2015; Kühn et al., 2015).
Levels of marine litter at sea floor had mean value of 26 kg km−2 in the Barents Sea, while the mean value of plastic only was 2.9 kg km−2. Levels of marine litter by trawl catch reported in this study is lower compared to estimated average levels of marine litter at sea bottom offshore of the Barents Sea of 154 kg km−2 observed from video recordings over restricted area as reported by Buhl-Mortensen and Buhl-Mortensen (2017). Different approaches for estimations of marine litter at the sea floor demonstrate the challenge in calculating densities for large areas as both methods contain uncertainties, for example mesh size with trawling and visual observations with video recordings.
Marine litter in the Barents Sea can origin from various marine activities such as discharges from fisheries, ship traffic, oil and gas exploration, and tourism in addition to land based discharges. The Barents Sea is a rich and productive area, with high fishing activities during the whole year (Figure 8A). Other marine activities include transportation of goods, oil and gas, and tourism. The main sailing routes are shown in Figure 8B. In addition, there are locations for salmon farming along the coast of Norway. Less ice cover and increased oil and gas activities over the recent years have increased ship traffic in the area (Norwegian Ministry of the Environment, 2011; King et al., 2017). Fisheries and other marine activities are the most likely sources of marine debris in the Barents Sea, as also reported from marine litter registrations at beaches at Svalbard (Bergmann et al., 2017) and from sea bottom recordings (Buhl-Mortensen and Buhl-Mortensen, 2017). Our observations indicated larger occurrence of plastic in areas with high intensity of fisheries and ship traffic, which also are retention areas due to ocean currents and depth.
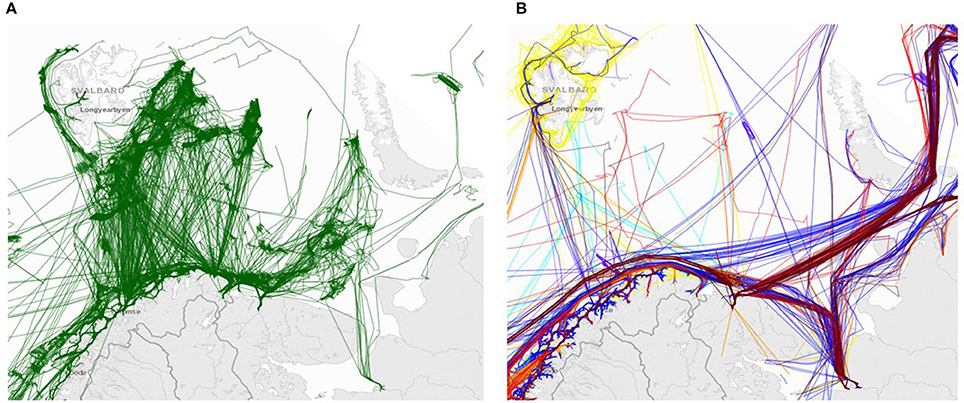
Figure 8. (A) Sailing routes for fisheries (green lines), (B) sailing routes for other than fisheries: oil tankers (brown), chemicals/product tankers (red), bulk ship (orange), general cargo ship (blue), cooling/freezing (magenta), passenger (yellow), other activities (peach). Taken from the website havbase.no, period: August 2016.
Population densities are low in the adjacent land areas to the Barents Sea both in Norway and in Russia. In the two most northern counties of Norway, Troms and Finnmark, the population densities are 6.4 and 1.6 persons km−2, respectively (www.ssb.no). For the Murmansk county, covering the Kola peninsula the population density is 5.2 persons km−2 (https://gov-murman.ru/region/index.php). This is low compared to more densely populated regions as the North Sea and the Mediterranean, and is also reflected in lower discharges from land based activities.
The Barents Sea monitoring documented a wide occurrence of marine debris floating at surface, in the upper 60 m and on the seafloor, and is a comprehensive data set with regards to coverage and number of observations. Even though there are limitations to the catchability and observations, the large number of observation and repeated monitoring strengthens the reliability of the data. Unfortunately, we are at present not able to draw conclusions on whether there are time trends in marine litter during this period. This shows the challenge with interpreting time trends on data from marine litter registrations from a large geographic area, and supports the need for observatory stations to improve the possibility to record changes in deep water environment with time in a defined area (Ruhl et al., 2011). For example, an increase in litter densities at sea floor has been reported from the Arctic deep-sea observatory HAUSGARTEN between 2002 and 2011 (Bergmann and Klages, 2012). On the other hand, studies of microplastics in the surface and the water column in the Baltic Sea (Beer et al., 2017) and at the surface in the North Atlantic subtropical gyre (Law et al., 2010) and East Pacific gyre (Law et al., 2014) has not revealed a trend over the last decades. This warrants further studies on transport of marine litter and microplastics from surface and water column to the sea floor. We need more knowledge of fate of the continuous discharges of marine litter and microplastics to the Oceans and how it may impact ecosystem health.
Author Contributions
BG and EE was responsible for writing the manuscript, BG, TP, EE, PK, PH, and DP contributed substantially with planning, analyzing data, preparing maps and discussions.
Funding
The study was funded by the governments of Norway and Russia as part of the Barents Sea ecosystem monitoring surveys.
Conflict of Interest Statement
The authors declare that the research was conducted in the absence of any commercial or financial relationships that could be construed as a potential conflict of interest.
Acknowledgments
We are very grateful for the help and effort done by crew members and scientific members of the Russian and Norwegian research vessels who participated in the joint Norwegian–Russian ecosystem surveys in the Barents Sea. We thank the reviewers for good and constructive comments.
References
Barnes, D. K. A., Galgani, F., Thompson, R. C., and Barlaz, M. (2009). Accumulation and fragmentation of plastic debris in global environments. Philos. Trans. R. Soc. Lond. B Biol. Sci. 364, 1985–1998. doi: 10.1098/rstb.2008.0205
Beer, A., Garm, A., Huwer, B., Dierking, J., and Nielsen, T. G. (2017). No increase in marine microplastic concentration over the last three decades – a case study from the Baltic Sea. Sci. Tot. Environ. 621, 1272–1279. doi: 10.1016/j.scitotenv.2017.10.101
Bergmann, M., and Klages, M. (2012). Increase of litter at the Arctic deep-sea observatory HAUSGARTEN. Mar. Poll. Bull. 64, 2743–2741. doi: 10.1016/j.marpolbul.2012.09.018
Bergmann, M., Lutz, B., and Gutow, L. (2017). Citizen scientist reveal: marine litter pollutes Arctic beaches and affects wild life. Mar. Poll. Bull. 125, 535–540. doi: 10.1016/j.marpolbul.2017.09.055
Buhl-Mortensen, L., and Buhl-Mortensen, P. (2017). Marine litter in the Nordic Seas: distribution composition and abundance. Mar. Poll. Bull. 125, 260–270. doi: 10.1016/j.marpolbul.2017.08.048
Cózar, A., Martí, E., Duarte, C. M., García-de-Lomas, J., van Sebille, E., Ballatore, T. J., et al. (2017). The Arctic Ocean as a dead end for floating plastics in the North Atlantic branch of the Thermohaline Circulation. Sci. Adv. 3:e1600582. doi: 10.1126/sciadv.1600582
Eriksen, E., Gjøsæter, H., Prozorkevich, D., Shamray, E., Dolgov, A., Skern-Mauritzen, M., et al. (2017). From single species surveys towards monitoring of the Barents Sea ecosystem. Prog. Oceanogr. doi: 10.1016/j.pocean.2017.09.007. [Epub ahead of print].
EU-MSDF (2008). Directive 2008/56/EC of the European Parliament and of the Council of 17 June 2008 establishing a framework for community action in the field of marine environmental policy (Marine Strategy Framework Directive). Off. J. Euro. Union L164, 19–40. Available online at: http://eur-lex.europa.eu/LexUriServ/LexUriServ.do?uri=OJ:L:2008:164:0019:0040:EN:PDF
Galgani, F., Leaute, J. P., Moguedet, P., Souplet, A., Verin, Y., Carpentier, A., et al. (2000). Litter on the sea floor along European coasts. Mar. Poll. Bull. 40, 516–527. doi: 10.1016/S0025-326X(99)00234-9
Gall, S. C., and Thompson, R. C. (2015). The impact of debris on marine life. Mar. Poll. Bull. 92, 170–179. doi: 10.1016/j.marpolbul.2014.12.041
GESAMP. (2016). Sources, Fate and Effects of Microplastics in the Marine Environment: Part Two of a Global Assessment. IMO/FAO/UNESCO-IOC/UNIDO/WMO/IAEA/UN/UNEP/UNDP Joint Group of Experts on the Scientific Aspects of Marine Environmental Protection, eds P. J. Kershaw and C. M. Rochman, Reports and Studies. GESAMP.
Gilardi, K. V. K., Carlson-Bremer, D., June, J. A., Antonelis, K., Broadhurst, G., and Cowan, T. (2010). Marine species mortality in derelict fishing nets in Puget Sound, WA and the cost/benefits of derelict net removal. Mar. Poll. Bull. 60, 376–382. doi: 10.1016/j.marpolbul.2009.10.016
ICES (2017). Report of the Working Group on the Integrated Assessments of the Barents Sea. WGIBAR 2017 Report 16–18 March 2017, Murmansk, Russia. ICES CM 2017/SSGIEA:04. p. 186.
Ingvaldsen, R., and Loeng, H. (2009). “Physical Oceanography,” in Ecosystem Barents Sea, eds E. Sakshaug, G. Johnsen, and K. Kovacs (Trondheim: Tapir Academic Press), 33–64.
Jambeck, J. R., Geyer, R., Wilcox, C., Siegler, T. R., Perryman, M., Andrady, A., et al. (2015). Plastic waste inputs from land into the ocean. Science 347, 768–771. doi: 10.1126/science.1260352
King, J., Spreen, G., Gerland, S., Haas, C., Hendricks, S., Kaleschke, L., et al. (2017). Sea-ice thickness from field measurements in the northwestern Barents Sea. J. Geophys. Res. Oceans 122, 1497–1512. doi: 10.1002/2016JC012199
Koutsodendris, A., Papatheodoru, G., Kougiourouki, O., and Georgiadis, M. (2008). Benthic marine litter in four Gulfs in Greece Eastern Mediterranean; abundance, composition and source identification. Estuar. Coast. Shelf Sci. 77, 501–512. doi: 10.1016/j.ecss.2007.10.011
Kühn, S., Rebolledo, E. L. B., and van Franeker, J. A. (2015). “Deleterious effects of litter on marine life,” in Marine Anthropogenic Litter, eds M. Bergmann, L. Gutow, M. Klages (Berlin: Springer International Publishing), 75–116.
Law, K. L., Morét-Ferguson, S., Goodwin, D. S., Zettler, E. R., DeForce, E., Kukulka, T., et al. (2014). Distribution of surface plastic debris in the Eastern Pacific Ocean from an 11-year data set. Environ. Sci. Technol. 48, 4732–4738. doi: 10.1021/es4053076
Law, K. L., Morét-Ferguson, S., Maximenko, N. A., Proskurowski, G., Peacock, E. E., Hafner, J., et al. (2010). Plastic accumulation in the North Atlantic Subtropical Gyre. Science 329, 1185–1188. doi: 10.1126/science.1192321
Loeng, H. (1991). Features of the physical oceanographic conditions of the Barents Sea. Polar Res. 10, 5–18. doi: 10.3402/polar.v10i1.6723
Lopez-Lopez, L., González-Irusta, J. M., Punzón, A., and Serrano, A. (2017). Benthic litter distribution and deep sea bottoms of the southern Bay of Biscay: analysis of potential drivers. Cont. Shelf Res. 144, 112–119. doi: 10.1016/j.csr.2017.07.003
Lusher, A. L., Hollman, P. C. H., and Mendoza-Hill, J. J. (2017). Microplastics in Fisheries and Aquaculture: Status of Knowledge on Their Occurrence and Implications for Aquatic Organisms and Food Safety. FAO Fisheries and Aquaculture Technical Paper. No. 615. Rome, Italy. p. 147.
Michalsen, K., Dalpadado, P., Eriksen, E., Gjøsæter, H., Ingvaldsen, R., Johannesen, E., et al. (2011). “The joint Norwegian–Russian ecosystem survey: overview and lessons learned,” in Proceeding of the 15th Norwegian–Russian Symposium (Longyearbyen), 247–272.
Norwegian Ministry of the Environment (2011). First update of the Integrated Management Plan for the Marine Environment of the Barents Sea-Lofoten Area. Meld. St. 10 (2010–2011) Report to the Storting (white paper). p. 151. Available online at: https://www.regjeringen.no/contentassets/db61759a16874cf28b2f074c9191bed8/en-gb/pdfs/stm201020110010000en_pdfs.pdf
Ozhigin, V. K., Ingvaldsen, R. B., Loeng, H., Boitsov, V., and Karsakov, A. (2011). “Introduction to the Barents Sea,” in The Barents Sea Ecosystem: Russian-Norwegian Cooperation in Science and Management, eds T. Jakobsen and V. Ozhigin (Trondheim: Tapir Academic Press) 315–328.
Pham, C. K., Ramirez-Llodra, E., Alt, C. H. S., Amaro, T., Bergmann, M., Canals, M., et al. (2014). Marine litter distribution and density in European Seas, from the shelves to deep basins. PLoS ONE 9:e95839. doi: 10.1371/journal.pone.0095839
Ramirez-Llodra, E., De Mol, B., Company, J. B., Coll, M., and Sardà, F. (2013). Effects of natural and anthropogenic processes in the distribution of marine litter in the deep Mediterranean Sea. Prog. Oceanogr. 118, 273–287. doi: 10.1016/j.pocean.2013.07.027
Ramirez-Llodra, E., Tyler, P. A., Baker, M. C., Bergstad, O. A., Clark, M. R., Escobar, E., et al. (2011). Man and the last great wilderness: human impact on the Deep Sea. PLoS ONE 6:e22588. doi: 10.1371/journal.pone.0022588
Ruhl, H. A., Andre, M., Beranzoli, L., Cagatay, M. N., Colaco, A., Cannat, M., et al. (2011). Societal need for improved understanding of climate change, anthropogenic impacts, and geo-hazard warning drive development of ocean observatories in European Seas. Prog. Oceanogr. 91, 1–33. doi: 10.1016/j.pocean.2011.05.001
Savoca, M. S., Wohlfeil, M. E., Ebeler, S. E., and Nevitt, G. A. (2016). Marine plastic debris emits a keystone infochemical for olfactory foraging seabirds. Sci. Adv. 2:e1600395. doi: 10.1126/sciadv.1600395
Shimanaga, M., and Yanagi, K. (2016). The Ryukyu Trench may function as a “depocenter” for anthropogenic marine litter. J. Oceanogr. 72, 895–903. doi: 10.1007/s10872-016-0388-7
Skagseth, Ø., Furoic, T., Ingvaldsen, R., Loeng, H., Mork, K. A., Orvik, K. A., et al (2008). “Volume and heat transports to the Arctic via the Norwegian and Barents Seas,” in Arctic-Subarctic Ocean Fluxes: Defining the role of the Northern Seas in Climate, in eds R. Dickson, J. Meincke, and P. Rhines (Dordrecht: Springer Netherlands), 45–64. doi: 10.1007/978-1-4020-6774-7_3
UNEP (2016). Marine Plastic Debris and Microplastics – Global Lessons and Research to Inspire Action and Guide Policy Change. Nairobi: UNEP.
van Sebille, E., England, M. H., and Froyland, G. (2012). Origin, dynamics and evolution of ocean garbage patches from observed surface drifters. Environ. Res. Lett. 7:044040. doi: 10.1088/1748-9326/7/4/044040
Woodall, L. C., Robinson, L. F., Rogers, A. D., Narayanaswamy, B. E., and Paterson, G. L. J. (2015). Deep-sea litter: a comparison of seamounts, banks and a ridge in the Atlantic and Indian Oceans reveals both environmental and anthropogenic factors impact accumulation and composition. Front. Mar. Sci. 2:3. doi: 10.3389/fmars.2015.00003
Keywords: marine litter, plastic, surface, pelagic, sea floor, Barents Sea
Citation: Grøsvik BE, Prokhorova T, Eriksen E, Krivosheya P, Horneland PA and Prozorkevich D (2018) Assessment of Marine Litter in the Barents Sea, a Part of the Joint Norwegian–Russian Ecosystem Survey. Front. Mar. Sci. 5:72. doi: 10.3389/fmars.2018.00072
Received: 13 October 2017; Accepted: 15 February 2018;
Published: 06 March 2018.
Edited by:
Christopher Kim Pham, University of the Azores, PortugalReviewed by:
Christos Ioakeimidis, United Nations Environment Programme Mediterranean Action Plan (UNEP/MAP), GreeceRui Pedro Vieira, University of Southampton, United Kingdom
Copyright © 2018 Grøsvik, Prokhorova, Eriksen, Krivosheya, Horneland and Prozorkevich. This is an open-access article distributed under the terms of the Creative Commons Attribution License (CC BY). The use, distribution or reproduction in other forums is permitted, provided the original author(s) and the copyright owner are credited and that the original publication in this journal is cited, in accordance with accepted academic practice. No use, distribution or reproduction is permitted which does not comply with these terms.
*Correspondence: Bjørn E. Grøsvik, Ympvcm4uZ3Jvc3Zpa0BpbXIubm8=