 Micha J. A. Rijkenberg1
 Hans A. Slagter1
 Michiel Rutgers van der Loeff2Jan van Ooijen1
 Loes J. A. Gerringa1*
- 1Department of Ocean Systems, NIOZ Royal Institute for Sea Research and Utrecht University, Den Burg, Netherlands
- 2Alfred Wegener Institute for Polar and Marine Research, Bremerhaven, Germany
Global warming resulting from the release of anthropogenic carbon dioxide is rapidly changing the Arctic Ocean. Over the last decade sea ice declined in extent and thickness. As a result, improved light availability has increased Arctic net primary production, including in under-ice phytoplankton blooms. During the GEOTRACES cruise PS94 in the summer of 2015 we measured dissolved iron (DFe), nitrate and phosphate throughout the central part of the Eurasian Arctic. In the deeper waters concentrations of DFe were higher, which we relate to resuspension on the continental slope in the Nansen Basin and hydrothermal activity at the Gakkel Ridge. The main source of DFe in the surface was the Trans Polar Drift (TPD), resulting in concentrations up to 4.42 nM. Nevertheless, using nutrient ratios we show that a large under-ice bloom in the Nansen basin was limited by Fe. Fe limitation potentially prevented up to 54% of the available nitrate and nitrite from being used for primary production. In the Barents Sea, Fe is expected to be the first nutrient to be depleted as well. Changes in the Arctic biogeochemical cycle of Fe due to retreating ice may therefore have large consequences for primary production, the Arctic ecosystem and the subsequent drawdown of carbon dioxide.
Introduction
The Arctic Ocean is the most rapidly changing region of our planet due to recent global warming (IPCC, 2013); yet the central Arctic belongs to the least studied parts of the Earth. Over the last decade, Arctic sea ice has been observed to decline in extent (Stroeve et al., 2012; IPCC, 2014; Serreze et al., 2016) and thickness (Haas et al., 2008; Serreze and Stroeve, 2015) and changed from multi-year sea ice into more first-year sea ice (Maslanik et al., 2011).
The largest decrease occurred between 2007 and 2008 resulting in the export of a large part of the remaining thick ice through Fram Strait (Kwok et al., 2009). The Arctic sea ice reached a record minimum extent of 3.41 million km2 on September 16, 2012 (National Snow and Ice Data Center, 2012) with the fourth lowest minimum on September 11, 2015 (National Snow and Ice Data Center, 2015).
Increased light penetration and nutrient availability during spring from earlier ice breakup enhances primary production in the Arctic Ocean and its adjacent shelf seas (Bhatt et al., 2014). The assumption has been for a long time that primary productivity is negligible in waters beneath ice because of insufficient light (Arrigo and Van Dijken, 2011). However, large under-ice blooms have been observed in the Barents Sea, Beaufort Sea, Canadian Arctic Archipelago, Chukchi Sea and also in the Nansen basin (Strass and Nöthig, 1996; Fortier et al., 2002; Mundy et al., 2009; Arrigo and Van Dijken, 2011; Ulfsbo et al., 2014) suggesting that under-ice blooms are widespread. Most studies expect nitrate to be the next limiting factor to determine primary productivity (Nishino et al., 2011; Vancoppenolle et al., 2013; Fernández-Méndez et al., 2015; Tremblay et al., 2015). However, in the Eurasian basin surface nitrate concentrations are significant and even persist in summer (Codispoti et al., 2013). Light limitation and/or grazing pressure have been suggested to prevent the full use of surface nitrate here (Olli et al., 2007; Bluhm et al., 2015).
Another consequence of global warming is the increase in river discharge (Peterson et al., 2002, 2006) which, combined with net loss of the Greenland ice-cap and melting of sea ice, can contribute to freshening of surface waters and increased stratification. However, the accumulation and distribution of this fresh water is strongly influenced by the Arctic circulation (Rabe et al., 2014). River discharge in the shelf-surrounded Arctic Ocean is a source of nutrients. These nutrients, including dissolved Fe (DFe) complexed by humic organic ligands (Laglera and van den Berg, 2009; Slagter et al., 2017), are transported in the upper 50 m through the Arctic Ocean by the transpolar drift (TPD) from the Eurasian rivers over the central Arctic to Fram Strait (Gordienko and Laktionov, 1969; Gregor et al., 1998). The TPD track varies annually depending on the Arctic Oscillation index (Macdonald et al., 2005).
These climate induced changes will change the biogeochemical cycling and therefore the distribution of many trace elements and isotopes. Of these Fe has proven to be the most important trace element as its low concentrations limit primary production in 30–40% of the global surface ocean and therefore regulates ocean processes such as marine ecosystem dynamics and carbon cycling (Baar et al., 2005; Boyd et al., 2007). We do not directly expect Fe limitation in the Arctic Ocean because of the above mentioned input and transport of DFe, confirmed by Klunder et al. (2012a). However, the results of the present investigation proved otherwise. Arctic Ocean waters form an important part of the global thermohaline circulation (Aagaard et al., 1985; Rudels, 2015; Carmack et al., 2016). Changes in the Arctic biogeochemical cycle of Fe will not only affect the Arctic ecosystem but will affect also the chemical composition of for example the North Atlantic Deep Water. Gerringa et al. (2015) assumed that the Arctic is a source of Fe-binding dissolved organic ligands, since these decreased with distance from Fram Strait.
The deep water composition of DFe depends on the input of Atlantic water (200–900 m) with more elevated DFe in the Nansen Basin, and on slope processes with downwards convection of Fe released from resuspended sediments (Klunder et al., 2012b). A major source in the Nansen Basin is the hydrothermal activity at the Gakkel Ridge (Edmonds et al., 2003; Baker et al., 2004). These three processess are not expected to be rapidly affected by climate change. Scavenging, however, might be prone to changes due to a higher biological activity in the euphotic zone, influencing the flux of sinking particles. According to Klunder et al. (2012b) the reason why DFe in the deep Makarov Basin is so low, is that sources affecting the Nansen Basin are absent.
To investigate if climate change could affect the biogeochemical cycle of Fe in the Arctic Ocean we measured dissolved Fe, nitrate and phosphate throughout the central part of the Eurasian Arctic during the TransArcII expedition between August 15th and October 17th 2015 (FS Polarstern, PS94; Figure 1). We compared the DFe with earlier work of Klunder et al. (2012a,b) on surface and deep concentrations measured in 2007. We found a different hydrothermal source of Fe than discussed by Klunder et al. (2012b). Using nutrient ratios we showed that a large under-ice bloom in the Nansen basin was limited by Fe.
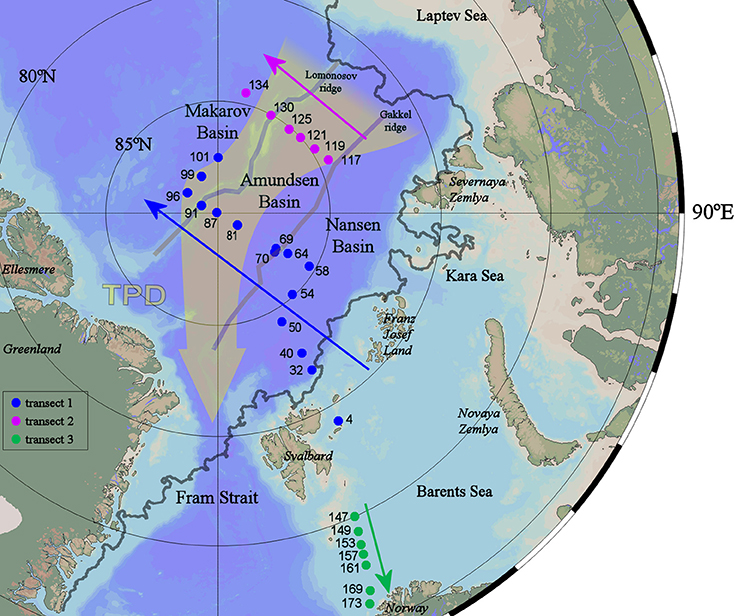
Figure 1. Station map of the ultraclean casts sampled during the TransARC II cruise (PS94) on the German icebreaker RV Polarstern in the summer of 2015.The direction of the Transpolar Drift is indicated with the broad gray-yellow arrow (Slagter et al., 2017). Stations numbers are given in three transects, 1–3, the arrows give the direction in which transects are presented in Figures 2, 5–9. The gray line indicates the sea ice edge at the time of sampling station 32 (23 August 2015, NSIDC database, 2015). Map and all section plots following were generated using Ocean Data View 4 (Schlitzer, 2016).
Methods and Equipment
A total of 28 stations were sampled for DFe during the GEOTRACES TransARC II cruise (PS94) on the German icebreaker RV Polarstern between 17 August and 14 October 2015 (Figure 1). Two CTD systems were used, a standard rosette sampling system equipped with a fluorometer for chl a fluorescence and an “ultraclean CTD” sampling system; both were equipped with a SEABIRD 911 CTD. The temperature and salinity data from the standard sampling system were used for their higher spatial resolution (Rabe et al., 2016). The standard system also employed an uncalibrated fluorometer for CDOM measurement in arbitrary units (a.u.; BackScat, Dr. Haardt). Samples for DFe and nutrients were taken using 24 ultra-trace-metal clean polypropylene samplers of 24L each mounted on an all titanium frame with a SEABIRD 911 CTD system and deployed on a 11 mm Dyneema cable without internal signal transduction cables. We used the SBE 17plus V2 Searam in a titanium housing to provide power, save the CTD data and close the sampling bottles at pre-programmed depths. After deployment, the complete “ultraclean CTD” was immediately placed in an ISO Class 6 clean room container, where samples for dissolved metals were filtered directly from the polypropylene samplers over <0.2 μm Sartobran 300 cartridges (Sartorius) under pressure of filtered N2 (0.7 bar) applied via the top-connector of the polypropylene sampler (de Baar et al., 2008; Rijkenberg et al., 2015). Filters were rinsed with approximately 700 ml seawater before use.
The data can be found in Pangaea (https://www.pangaea.de, CTD data: in https://doi.org/10.1594/PANGAEA.859558) and with the BODC (http://www.bodc.ac.uk/geotraces).
Nutrients
The nutrients phosphate, silicate, nitrite and nitrate were analyzed in a temperature controlled laboratory container with a Technicon TRAACS 800 continuous flow auto analyser (Murphy and Riley, 1962; Strickland and Parsons, 1972; Grasshoff, 1983). Samples were measured unfiltered and immediately after sampling. Measurements were made simultaneously on four channels: phosphate, silicate, nitrate and nitrite together, and nitrite separately. All measurements were calibrated with standards diluted in low nutrient seawater, which was also used as wash-water between the samples. A lab reference cocktail standard is monitored since 2008, showing in-between runs reproducibility better than 1.0%, but typically 0.8% of its average value. A reference material for nutrients in seawater produced by KANSO, lot BU and lot BT, was used to determine detection limits, the accuracy and precision (Table 1). We used the data from the “ultraclean CTD.”
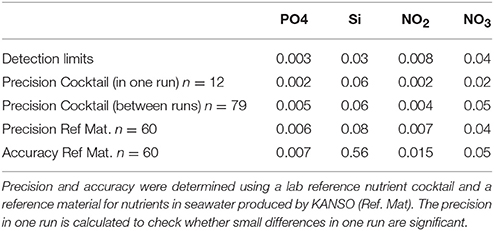
Table 1. Detection limits, precision and accuracy in μM of the nutrients.
Dissolved Fe
Samples for dissolved metals were acidified to a pH of 1.8 using a final concentration of 0.024 M ultraclean Seastar Base-line HCl (Seastar Chemicals). DFe was measured on board using flow injection analysis (FIA) based on luminol chemiluminescence (Rijkenberg et al., 2014). Briefly, to measure DFe, 120 μL of 40 mM H2O2 (Suprapur, Merck 30%) was added to 60 ml sample to ensure the oxidation of any Fe(II) in the sample at least 12 h prior to analysis (Lohan and Bruland, 2006). Next, the acidified sample was pre-concentrated in-line onto a column of immobilized AF-Chelate-650M resin (TosoHaas, Germany). After rinsing with de-ionized water (18.2 MΩ cm, Sartorius) to remove interfering salts, the Fe was eluted from the column with 0.35 M HCl (Suprapur, Merck 30%). Chemiluminescence was induced by mixing the eluent with a 2 M ammonium hydroxide (Suprapur, 25% Merck), 0.3 M hydrogen peroxide (Suprapure, Merck 30%), 0.7 mM luminol (Aldrich), and 2.8 mM triethylenetetramine (Sigma). All solutions were prepared with de-ionized water (18.2 MΩ cm, Sartorius). The chemiluminescence was detected with a Hamamatsu HC135 Photon counter. A five-point calibration in low iron containing seawater and blank determination were made daily. The blank was determined as the intercept of the signals of increasing preconcentration times (5, 10, 15 s) of the seawater used for the calibration. The analytical blank was on average 0.007 ± 0.004 nM DFe (n = 32) and the average detection limit (defined as 3σ of the blank pre-concentrated for 5 s) was 0.012 ± 0.007 nM DFe (n = 32). The Fe added by the Seastar acid (maximum ~0.4 pM) was ignored. Table 2 shows the measured DFe concentrations in SAFe and GEOTRACES reference samples and their consensus values. For the SAFeS1 consensus value our measurements, although low, fall within the uncertainty values (Johnson et al., 2007).
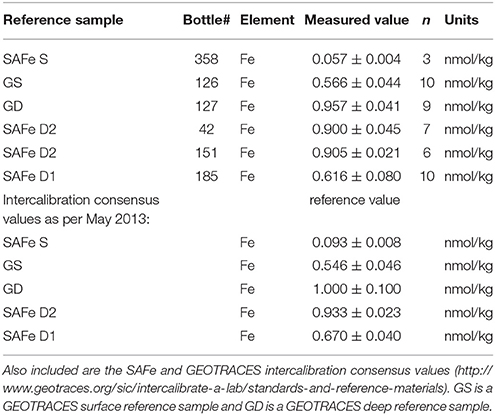
Table 2. The values of SAFe and GEOTRACES reference samples for DFe measured on board using flow injection analysis based on luminol chemiluminescence during cruise PS94 in the Arctic Ocean.
Fe* Calculations
In order to investigate whether Fe can reach growth-limiting values we define,
Fe* = [DFe] − (Fe:GLnut) x [GLnut], where (Fe:GLnut) is the average biological uptake ratio of Fe over the growth-limiting macronutrient (GLnut). Which of the macronutrients is expected to be growth limiting can be determined from N/P plots. Surface waters in many samples outside the TPD are depleted in N, or N will be the first macronutrient to deplete when extrapolating the N/P slope. Therefore, the ratio Fe:GLnut will be the uptake ratio of Fe:N (RFe:N).
As we don't have any information about the Fe:nutrient ratios of the Arctic phytoplankton communities we used two extreme scenarios based on phosphate uptake ratios (RFe:P) from the literature assuming the Arctic phytoplankton community to have Fe:nutrient ratios in between. Using the two extreme scenarios, one with less strict limitation assumptions (RFe:P = 0.47 mmol·mol−1) and one with strict limitation assumptions (RFe:P = 0.18 mmol·mol−1), we show the minimum and maximum potential extent of Fe-limitation in the Nansen Basin. The less strict assumption (maximum extent Fe*) is hereafter indicated as scenario 1, the strict with scenario 2. The RFe:P of 0.47 mmol·mol−1 of scenario 1 was used in studies in Antarctic waters by Blain et al. (2008) and Lannuzel et al. (2011) after Parekh et al. (2005). The RFe:P of 0.18 mmol.mol−1 of scenario 2 was recalculated based on the Redfield ratio (106C:16N:1P), using the average Fe:C ratio of 0.17 μmol·mol−1 in Fe limited Southern Ocean species according to Strzepek et al. (2011), which is close to the 0.18 μmol·mol−1 obtained from Fe:AOU relationships by Sunda (1997). As N is the limiting macronutrient we have converted the reported RFe:P to RFe:N using 14.14, being the slope of the N/P plot at depths below 100 m in the Nansen Basin. A cut off of 100 m was chosen since this is the maximum depth for primary production due to light limitation.
Calculation Percentage Unused Nitrogen due to Fe-Limitation
To calculate the percentage unused nitrogen due to Fe-limitation we integrated the sum of nitrate and nitrite concentrations over the upper 100 m along our transect in the Nansen basin (PS94, Station 40, 50, 54, and 58) and subtracted the nitrogen used when all DFe would be fully used using the RFe:N of scenario 1 and 2 (Table 3). To express this as a percentage we used two estimates of the background nitrogen inventory in absence of a bloom. For the first estimate we integrated the sum of nitrate and nitrite concentrations over the upper 100 m of the Stations 255-1, 258-1, 260-2, 261-1 as measured during ARKXXII/2 (Klunder et al., 2012a). For the second estimate we integrated the sum of nitrate and nitrite concentrations over 100–200 m in the Nansen Basin (PS94, Station 40, 50, 54, and 58).
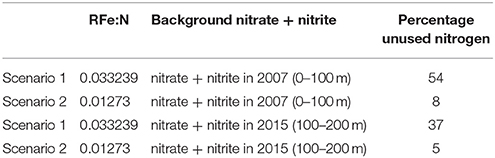
Table 3. The unused nitrogen due to Fe-limitation calculated for the different RFe:N in mmol mol−1 as used in scenario 1 and 2 as percentage of two different estimates of background of the sum of nitrate and nitrite.
Results
Hydrography
The hydrography of the Transects I and II is described by Slagter et al. (2017) using definitions by Rudels (2010, 2012) and is repeated here briefly (Figures 2A,B). The Polar Surface Water (PSW) influenced by sea ice melt and river water is characterized by potential temperatures <0°C and salinities <34.5. In the Central Arctic the PSW flows into the direction of Fram Strait in the TPD (Gordienko and Laktionov, 1969; Gregor et al., 1998; Macdonald et al., 2005). Atlantic Water enters the Arctic Ocean via Fram Strait and is then called Arctic Atlantic Water (AAW), becoming colder and fresher on its flow path along the continental slopes of the Nansen and Amundsen Basins. This water mass between 200 and 900 m has potential temperatures >0°C and higher salinities than the PSW and, in the Eurasian Basin, the underlying deep water. The Lomonosov Ridge (sill depth approximately 2,000 m) separates the Eurasian Basin Deep Water (EBDW) in the Nansen and Amundsen Basin with potential temperatures down to −1°C from the warmer and saltier Canadian Basin Deep Water (CBDW, Figure 2).
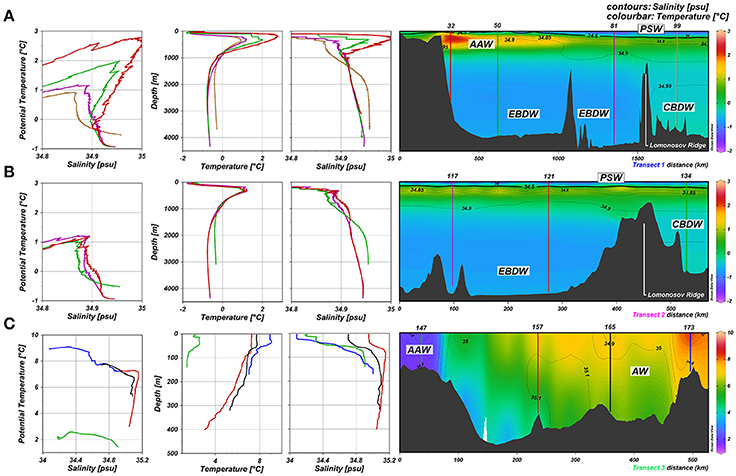
Figure 2. TS profiles and section plots of Transects 1–3 (A–C; Rabe et al., 2016). At the left side property-property plots show potential temperature vs. salinity (T-S, left) followed by depth profiles of potential temperature (middle) and salinity (right) for those stations indicated in the section plots of potential temperature (color bar) and salinity (contours) of the transects (far right). Station numbers are indicated above the transects. Polar Surface Water (PSW), Eurasian Basin Deep Water (EBDW), Canadian Basin Deep Water (CBDW) Atlantic Water (AW), and Arctic Atlantic Water (AAW) are indicated in the temperature sections. T-S plots are scaled to detail small-scale variations to help characterize water masses after Rudels (2010, 2012). Salinities of 34.5 are indicated in a thicker contour denoting the PSW border (Rudels, 2010). Note the difference in scale for the transect 3 color bar.
One branch of the Atlantic water enters the Arctic Ocean via the Barents Sea (Figure 2C) resulting in high potential temperatures and salinities (Rudels, 2012). The potential temperature decreases northward from Stations 173 to the AAW at Station 147, close to Bear Island. However, at the stations close to the Norwegian Coast the salinity in the upper 100 m is lower than at similar depths in the central Barents Sea, pointing to river input.
N was the limiting macronutrient in all surface waters during PS94 (Figure 3).
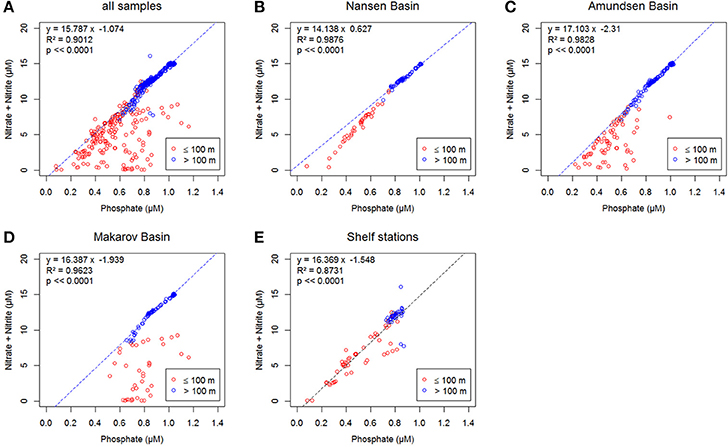
Figure 3. Concentrations of phosphate versus the sum of nitrite and nitrate, in μM. In blue >100 m, in red ≤100 m, the equations in A–D show the linear relation for samples >100 m (blue dashed line), the equation in E shows the linear relation for all depths (black dashed line). (A) All samples; (B) Samples taken in the Nansen Basin at stations 32, 40, 50, 54, 58, and 64; (C) Samples taken in the Amundsen Basin at stations 69, 70,81,87, 91, 117, 119, 121, and 125; (D) Samples taken in the Makarov Basin at stations 96, 99, 101, 130, and 134; (E) Samples taken at the shelf at stations 4, 147, 149, 153, 157, 161, 169, and 173 (see Figure 1 for the station locations).
DFe
In the upper 100 m of the Nansen Basin DFe concentrations were extremely low and ranged between 0.03 and 0.21 nM (Stations 32, 40, 50, 54, 58, 64) (Figures 4A, 5A). At Station 32 in the transition between the Nansen Basin and the Barents Shelf, DFe concentrations were low in the surface but ranged between 0.48 and 0.77 nM at depths below 100 m. These DFe concentrations were higher than those found at similar depths at the more northerly stations in the central Nansen Basin (Stations 40–58, 0.34, and 0.5 nM). This reflects both the inflow of Atlantic water in the upper 1,000 m and the effect of sediment resuspension at depths below 2,600 m, confirming findings by Klunder et al. (2012b) (Figures 4E, 5B). At the Gakkel Ridge (Station 70) a hydrothermal vent (Edmonds et al., 2003; Baker et al., 2004) resulted in deep DFe concentrations between 0.91 and 1.50 nM at depths between 2,300 and 2,850 m (Figures 4E, 5B).
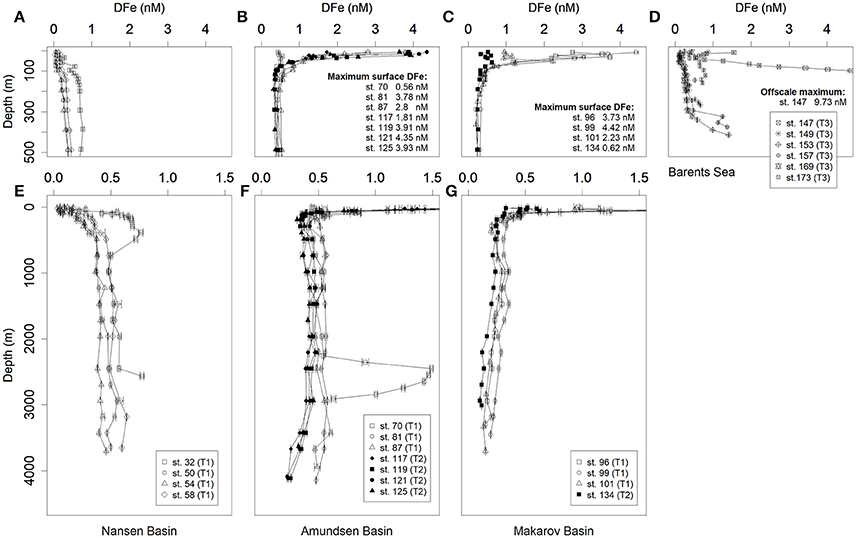
Figure 4. Selected depth profiles of dissolved Fe concentrations (DFe) in nM. (A–C) Upper 500 m of the Nansen, Amundsen and Makarov Basins, respectively; (D) Barents Sea (E–G) full depth profiles in the Nansen, Amundsen and Makarov Basins, respectively. Station numbers, basin names and transects numbers are indicated in the respective legends (see Figure 1). Surface maxima and offscale values are given in the figures. Symbols for Transect 1 are open, for Transect 2 filled and for Transect 3 crossed. Error bars indicate standard deviations (N = 2 or 3). Most error bars fall inside of the symbols.
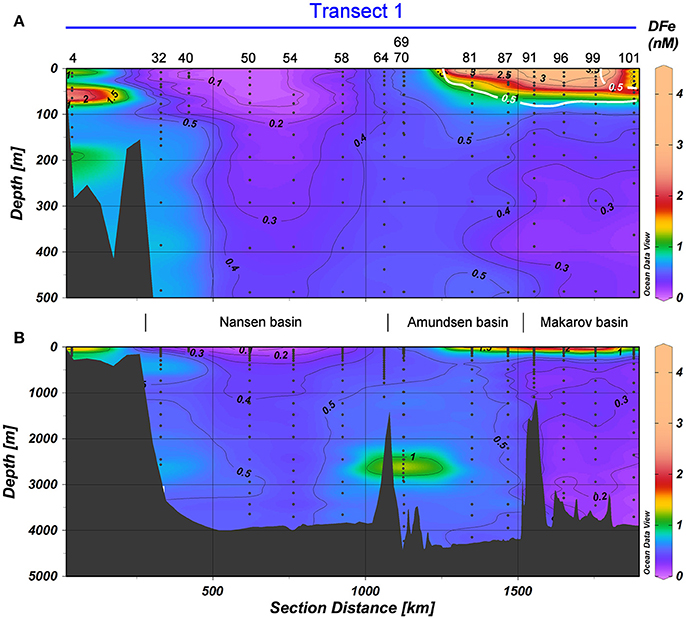
Figure 5. DFe in nM in Transect 1, with (A) the top 500 m and (B) the full depth. Station numbers and basin names are given (see Figure 1). The white contours indicate the border of the TransPolar Drift as defined by Slagter et al. (2017), which was operationally defined as in-situ CDOM fluorescence ≥0.5 a.u. during the same cruise. Black contours indicate DFe and have an equidistance of 0.1 nM for the range 0≤DFe≤0.5 nM and of 0.5 nM for the range 0.5<DFe≤4.5 nM.
In the Amundsen and Makarov Basins, DFe in the upper 100 m was high within the boundaries of the TPD, defined after Slagter et al. (2017) as in-situ CDOM fluorescence ≥ 0.5 a.u. (0.5–4.42 nM, Stations 81–101; Figures 4B,C, 6A). Silicate and phosphate were also high in the TPD whereas nitrate was only slightly elevated compared to the same depths outside the TPD (Slagter et al., 2017). Station 117 at the rim of the TPD had lower DFe concentrations of 0.51–1.81 nM, whereas at Station 134 outside the TPD, DFe was even lower with 0.32–0.62 nM at depths <100 m (Figures 4B,C, 6A). In the Amundsen Basin the deep DFe concentrations remain between 0.5 and 0.6 nM at Stations 81–87 in Transect 1, but are lower between 0.32 and 0.45 nM at Stations 117–125 in Transect 2 in the more Eastern part of the Amundsen Basin (Figures 4F, 5B, 6B). In the Makarov Basin the deep DFe concentrations are even lower (0.10–0.36 nM at Stations 91–101, Figures 4G, 5B and Station 134, Figures 4G, 6B).
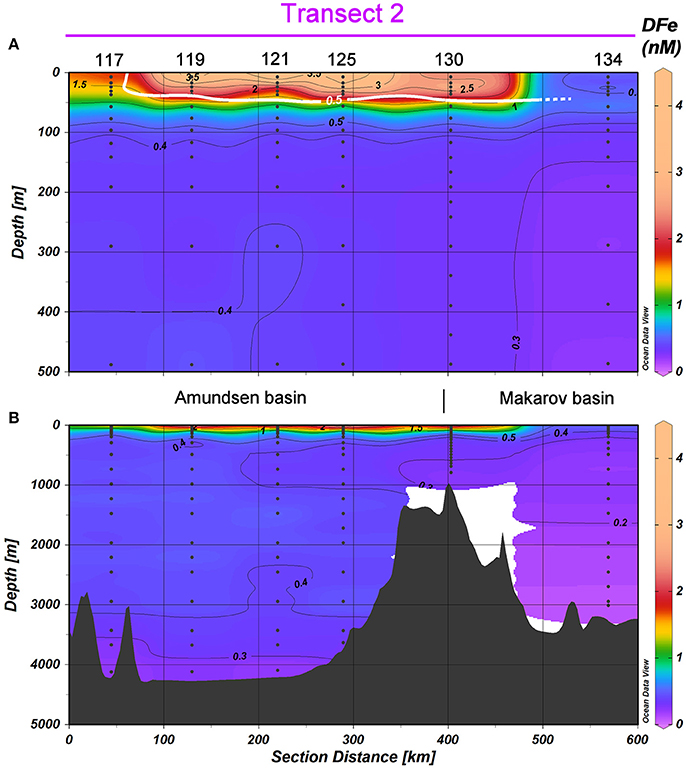
Figure 6. DFe in nM in Transect 2, with (A) the top 500 m and (B) the full depth. Station numbers and basin names are given (see Figure 1). The white contours indicate the border of the TransPolar Drift as defined by Slagter et al. (2017), which was operationally defined as in-situ CDOM fluorescence ≥0.5 a.u. during the same cruise. Black contours indicate DFe and have an equidistance of 0.1 nM for the range 0≤DFe #x02264;0.5 nM and of 0.5 nM for the range 0.5<DFe≤4.5 nM.
The DFe concentrations in the Barents Sea (Transect 3, Figures 4D, 7) are higher than in the central Arctic. Concentrations in the surface vary from 1.54 nM at Station 147 to 0.09–0.24 nM at Stations 149–161 and 0.4 nM at Station 169–172. The deep concentrations vary even more, from 9.73 nM at Station 147 to 0.47–1.41 nM at the other stations.
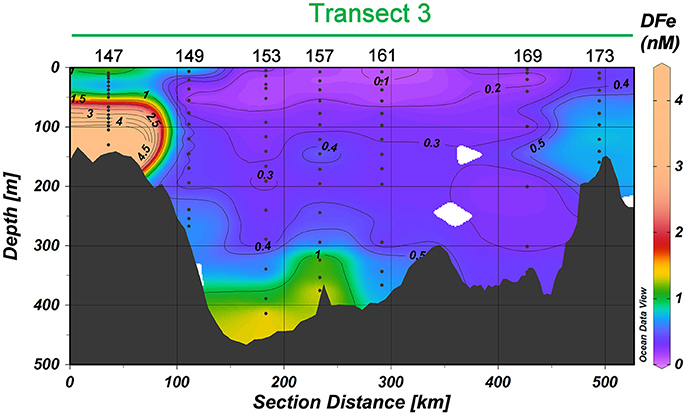
Figure 7. DFe in nM in Transect 3. Station numbers are given (see Figure 1). Black contours indicate DFe and have an equidistance of 0.1 nM for the range 0≤DFe≤0.5 nM and of 0.5 nM for the range 0.5<DFe≤4.5 nM.
Discussion
Deep Basins
Sources of DFe to the deep Arctic are shelf seas, sediments and hydrothermal vents. Klunder et al. (2012b) concluded that Atlantic water transported through Fram Strait carried DFe into the Nansen Basin (Figure 2). This was also the source of the enhanced DFe at station 32 between approximately 75 and 750 m (Figures 4A,E, 5), where elevated DFe concentrations coincided with an increase in the potential temperature and salinity. At our station 32 below 2,000 m DFe was also elevated suggesting local sediment resuspension at the slope as a source of DFe (Figures 4E, 5; Middag et al., 2011; Klunder et al., 2012b).
In general, with the exception of Station 70, we see that DFe concentrations stayed constant or changed slightly between 1,000 m and the bottom throughout the central Nansen and Amundsen basins (Figure 4). Deep DFe concentrations were similar or slightly lower than deep DFe concentrations in the North Atlantic and the North pacific (Moore and Braucher, 2008; Klunder et al., 2012b; Rijkenberg et al., 2014). It is possible that a higher scavenging rate indicated by stronger 230Th scavenging as observed during this same expedition (Valk et al. submitted) explains the lower deep DFe concentrations. In the Makarov basin, DFe concentrations decreased below 100 m toward the bottom (Transect 1 & 2, Figure 4G). The overall low DFe concentrations decreasing toward the bottom are probably due to the absence of Fe sources in the Makarov Basin (Klunder et al., 2012b; Thuróczy et al., 2012). However, not only DFe decreased with depth in the Makarov Basin, also the saturation state of the Fe-binding organic ligands decreased with depth in contrast to the Eurasian Basins (Thuróczy et al., 2012; Slagter et al., 2017). This needs additional explanation and indicates that scavenging might play a role here. Fitzsimmons et al. (2017) showed the important role the dissolved organic ligands play in the exchange between different dissolved and particulate Fe species in a hydrothermal plume in the S-E Pacific. They describe reversible scavenging processes between dissolved species, colloids and particles, where the driving factor is the presence of empty sites of the organic ligands. Scholten et al. (1995) found that the scavenging residence time of 230Th was shorter in the Eurasian Basins than in the Makarov Basin. During the same expedition of the present study Valk (pers. comm.) found even higher 230Th residence times in the Makarov Basin than Scholten et al. (1995). However, the residence time of water in the deep Canadian Basins is longer (~300 years) compared to the Eurasian Basins (~200 years; Tanhua et al., 2009). According to Gerringa et al. (2015) the residence time of Fe-binding organic ligands in the North Atlantic Deep Water is 2.5–4 times that of DFe. So perhaps a longer exposure to less scavenging had a net removal result for organically complexed dissolved Fe, which has not necessarily been recorded in the 230Th signal. Our results again show how important it is to understand and quantify the scavenging of DFe. Tagliabue et al. (2016) raises poorly constrained scavenging rates as key priority for improving the modeling of iron in global ocean biogeochemistry models.
Hydrothermal input was found near the Gakkel Ridge with elevated DFe in the Amundsen Basin (Figures 4F, 5), as was also observed by Middag et al. (2011) and Klunder et al. (2012b). The position of the hydrothermal vent at the Gakkel Ridge in 2007 during ARKXXII/2 was 85°39′N, 84°50′E. We found hydrothermal activity in a more western direction at station 70 at 86°57′N and 55°49′E, one of the many vent positions of the Gakkel Ridge (Edmonds et al., 2003; Baker et al., 2004).
Klunder et al. (2012b) reported average concentrations for the Nansen, Amundsen and Makarov Basins >250 m depth of 0.70 ± 0.25, 0.47 ± 0.11, and 0.39 ± 0.19 nM, respectively, for the 2007 expedition. Averages from the same depth for our 2015 study were 0.47 ± 0.10, 0.51 ± 0.21, 0.24 ± 0.06 nM, respectively. These data compare well although our data were lower in general. Apparently Klunder et al. (2012b) sampled in more hydrothermally influenced areas in the Nansen Basin, than we did in the Amundsen Basin, as shown by higher average concentrations and standard deviations.
Surface and Shelf
Sources of DFe to the surface Arctic Ocean are sea ice melt, atmospheric inputs, lateral input from land with rivers as the main contributor, Atlantic inflow and mixing with deep water.
Sea ice melt is found to be important in the Gulf of Alaska and the Bering Sea (Aguilar-Islas et al., 2008, 2016) which feeds the coastal blooms alleviating Fe limitation; but we did not find distinct proof of the importance of sea ice melt as an Fe source in the Arctic during our cruise. However, Lam et al. (2006) concluded that melting sea ice provided substantial DFe to the water column. The additional DFe input from melting sea ice is thought to become important for biological uptake for under ice and ice edge blooms. Most of our stations in Transects 1 and 2 had sea ice cover (Stations 32-134 were ice covered, Figure 1), and DFe concentrations were low outside the TPD (Figures 4A–C, 5). Apparently microbial utilization hid any contribution from melting sea ice at these locations.
Although the potential influence of dust input is acknowledged not much is known from dust input in the Arctic Ocean (Bullard, 2017). In Transect 3 we did see increased DFe in the surface at Station 147 (Figures 4D, 7). Although this might be due to dust input, as DFe concentrations were high throughout the depth profile, lateral transport from Svalbard, Bear Island (North of Station 147) or sediment resuspension may be more likely explanations. The CTD transmission data (not shown) was slightly lower at stations in the Barents Sea (4.35–4.55 a.u.) compared to the deep open Arctic (4.62–4.63 a.u.). In the Barents Sea the transmission became lower in the 100 m toward the bottom, with a corresponding increase in DFe (Figures 4D, 7) except at Station 169 and 173, where no transmission data was available (Station 173) and DFe did hardly increase near the bottom (both 169 and 173).
According to literature (Lam et al., 2006; Brown et al., 2012) lateral transport from the coast, shelves and land-fast-glaciers, with or without further transport by mesoscale eddies, is feeding the blooms over nearby Canadian Basin. In the present study the major driver of such lateral transport is the TPD (Gordienko and Laktionov, 1969; Gregor et al., 1998; Macdonald et al., 2005). The TPD is the major surface current over the Arctic Ocean transporting sea ice and river water from the Arctic shelf seas toward Fram Strait. Its influence on the distribution of Fe is distinct (Klunder et al., 2012a; Slagter et al., 2017). According to Klunder et al. (2012a) ice melt resulted in a relatively small increase in DFe relative to the effect of the TPD. Outside the TPD, in the Nansen Basin (Stations 32, 40, 50, 54, 58, and 64), surface concentrations of DFe were very low and coinciding with under ice bloom (Figures 5, 8).
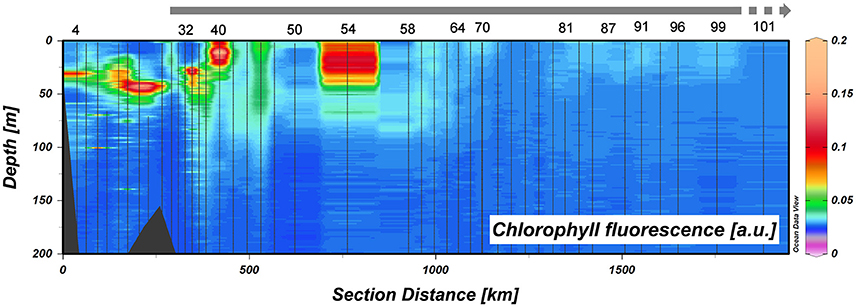
Figure 8. Chlorophyll a fluorescence in arbitrary units in the upper 200 m of Transect 1. Station numbers are given and the thick gray line at the top indicates sea ice cover (see Figure 1).
To investigate if Fe could become a limiting factor for this under ice bloom preventing the full use of the macronutrients, as described in the method section (Fe* < 0), we calculated Fe* for both the Klunder data as well as our own (Parekh et al., 2005; Blain et al., 2008; Lannuzel et al., 2011). Nitrogen is generally considered to be the limiting macro nutrient in the Arctic Ocean (Nishino et al., 2011; Vancoppenolle et al., 2013; Fernández-Méndez et al., 2015; Tremblay et al., 2015) and was the limiting macronutrient during PS94 (Figures 3A–E). Using the data of Klunder et al. (2012a) potentially Fe-limiting waters were only found at depths below 300 m in the Makarov basin. These Fe* values < 0 coincide with low DFe explained by scavenging of DFe by particles (Thuróczy et al., 2011; Klunder et al., 2012b). However, in the present study we do find Fe limitation in the Nansen Basin (Transect 1). All results showed Fe* < 0 in the surface of the Nansen Basin. The extent of potential Fe limitation (Fe* < 0) depends on the assumptions (Figure 9). It is unknown what the biological uptake ratio and its variation is in the Arctic Ocean. Twining et al. (2015) showed that RFe:P varied significantly between phytoplankton species in the North Atlantic Ocean. We show that Fe-limitation exists in the Nansen Basin under any known RFe:P (Figure 9A). However in Transect 2 and 3 only phytoplankton with higher Fe requirements will become Fe limited. Our stringent RFe:P has lower Fe requirements as obtained via N:P found for phytoplankton in the Canadian Basin representative for those shelf seas by Mills (personal communication by Mills referring to Tremblay et al., 2008; Bergeron and Tremblay, 2014; Mills et al., 2015); using that N:P ratio the area of Fe* <0 occurrence would be larger.
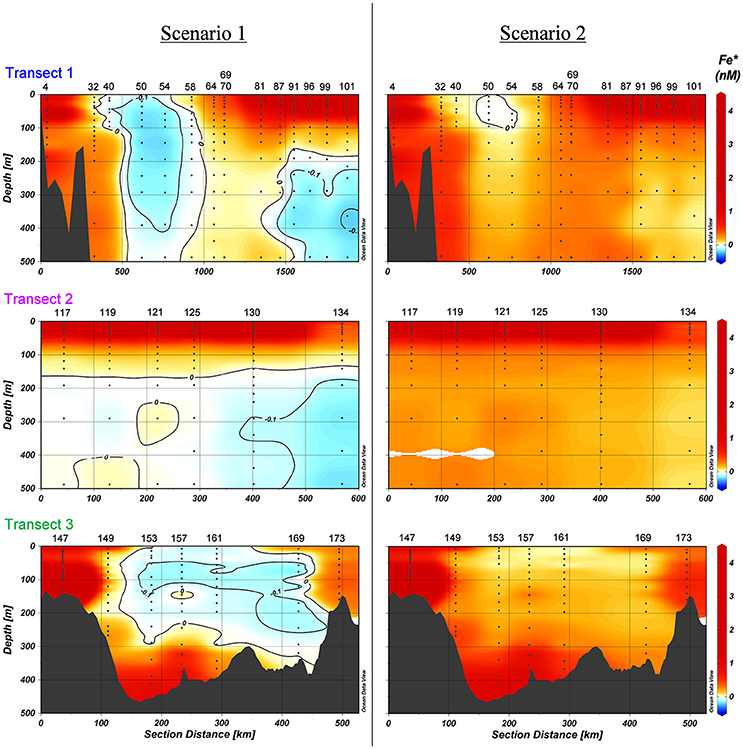
Figure 9. Fe* in nM in the upper 500 m of Transects 1-3 according to two scenarios. Scenario 1 and scenario 2. The black contour indicates where Fe*≤0, with an equidistance of −0.1 nM. Station numbers and basin names are given (see Figure 1).
Along Transect 3 DFe is also low (i.e., 0.08 nM at Station 169 at 10–25 m depth) and the macronutrient concentrations between Stations 153 and 169 are not depleted. The N:P slope for depths >100 m is inconclusive here. Extrapolating the N:P slope for all depths (Figure 3E), nitrogen would be the first to be depleted, but phosphorous would also be low. Like Transects 1 and 2 we used nitrogen as macronutrient to calculate Fe*, and indeed Fe* < 0 also occurs here, though only in scenario 1 (Figure 9).
The increase of light by melting of the sea ice and the subsequent increase of primary production, and as a consequence a larger consumption of available nutrients, has been discussed by others predominantly in the Pacific part of the Arctic Ocean (Arrigo et al., 2008; Tremblay and Gagnon, 2009; Vancoppenolle et al., 2013; Bhatt et al., 2014). Nitrogen limitation has been anticipated to occur (Vancoppenolle et al., 2013; Bluhm et al., 2015). However, the possibility of Fe limitation has not yet had any attention, although Taylor et al. (2013) found co-limitation by light, nitrate, and iron in culture experiments in the Beaufort Sea. In the Eurasian Basin Codispoti et al. (2013) and Bhatt et al. (2014) both mention light and grazing as the reason why macronutrients are not removed, in contrast to our results. Empirically based extrapolations presented by Arrigo and Van Dijken (2011) show that when the Arctic sea ice cover during summer minimum falls to zero, total annual primary production could reach ~730 TgC/year (a ~48% increase over the 1998–2009 average). In a warming Arctic Ocean, ice cover decreases releasing primary producers from light limitation. We here show that Fe may become the next limiting factor. In the Nansen Basin, depending on the RFe:N scenario and the estimate of the background concentration of nitrate + nitrite, between 5 to 54% of available nitrate+nitrite would remain unused for the production of biomass due to Fe limitation (Table 3).
The TPD, driven by Atlantic and Pacific inflow to the shelf seas with an estimated transition time across the Arctic Ocean of 3 years (Gregor et al., 1998), forms an important distribution pathway for DFe from the rivers and the shelves to the surface of the Eurasian Central Arctic. The TPD track and relative contributions of the different shelf seas is known to vary with the Arctic Oscillation index (Macdonald et al., 2005). Surface concentrations of DFe inside the TPD are expected to be dictated by a strong riverine influence (Bauch et al., 2011; Klunder et al., 2012a; Roeske et al., 2012; Rutgers van der Loeff et al., 2012; Slagter et al., 2017). One major impact of climate change is the thaw of permafrost soil (Stedmon et al., 2011; Schuur et al., 2015) resulting in an increase in DOM released into the Arctic Ocean (Vonk et al., 2012, 2013). These rivers also transport Fe containing particles and colloids into the Arctic Ocean contributing to an increase in DFe (Hirst et al., 2017). Slagter et al. (2017) showed that transport of DFe with the TPD through the Arctic Ocean is facilitated by complexation with humic substances as part of DOM. We could therefore expect that the TPD will become more important in the distribution of DFe throughout the Arctic Ocean and via Fram Strait to the Atlantic Ocean.
Conclusions
This study identified sediment resuspension along the continental slope and hydrothermal venting at the Gakkel Ridge as sources of DFe to the deep Nansen and Amundsen basins, respectively, confirming the findings of Klunder et al. (2012b). The longer residence time of the deep water together with the absence of sources of DFe to the deep Makarov basin results in concentrations of DFe decreasing toward the bottom due to the net removal of DFe by scavenging. Scavenging of Fe and other trace elements is the most important sink warranting further research.
The most important source of DFe to the surface of the Arctic Ocean is the TPD, transporting river water with high concentrations of Fe complexed by organic ligands (Slagter et al., 2017) from the Arctic shelf seas toward Fram Strait. As an effect of climate change, the increase of DOM entering the Arctic Ocean with the rivers may allow more Fe to be organically complexed in the dissolved phase and transported by the TPD. Climate change resulting in sea ice melt and therefore increasing light availability will increase DFe uptake by increasing primary production. In the present study we found Fe to be limiting in the Nansen Basin. Depending on the Fe requirements of the Arctic microbial community Fe has the potential to also limit primary production in the Barents Sea. So depending on how climate change will affect the role of the TPD in the provision of DFe to the surface of the Arctic Ocean Fe limitation may either be alleviated or exacerbated in a future Arctic Ocean.
Author Contributions
MR, MRvdL, and LG were responsible for the design of this research. MR and JvO analyzed the data. MR, HS, and LG interpreted data. MR, HS, LG, and MRvdL wrote the paper.
Conflict of Interest Statement
The authors declare that the research was conducted in the absence of any commercial or financial relationships that could be construed as a potential conflict of interest.
Acknowledgments
We would like to thank Captain S. Schwarze and his crew of the RV Polarstern and the chief scientist Ursula Schauer for their efforts and support (AWI-PS94-00). We also would like to thank the members of the ultraclean sampling team Aridane González, Lars-Eric Heimbürger and Michael Staubwasser. Sven Ober enabled sampling with the ultra-clean CTD by keeping our Titan alive. Benjamin Rabe (AWI Bremerhaven) provided the physical oceanographic parameters necessary to interpret our data. The support of Patrick Laan during cruise preparations was invaluable. HS was funded through a grant by the Netherlands Organization for Scientific Research (NWO) under contract number 822.01.018 to LG. Our meeting with our GEOTRACES colleagues on the USCGC Healy at the North Pole was an inspiring highlight of our expedition.
References
Aagaard, K., Swift, J. H., and Carmack, E. C. (1985). Thermohaline circulation in the Arctic Mediterranean Seas. J. Geophys. Res. 90, 4833–4846. doi: 10.1029/JC090iC03p04833
Aguilar-Islas, A. M., Rember, R. D., Mordy, C. W., and Wu, J. (2008). Sea ice-derived dissolved iron and its potential influence on the spring algal bloom in the Bering Sea. Geophys. Res. Lett. 35:L24601. doi: 10.1029/2008GL035736
Aguilar-Islas, A. M., Séguret, M. J. M., Rember, R., Buck, K. N., Proctor, P., Mordy, C. W., et al. (2016). Temporal variability of reactive iron over the Gulf of Alaska shelf. Deep Res. II Top. Stud. Oceanogr. 132, 90–106. doi: 10.1016/j.dsr2.2015.05.004
Arrigo, K. R., and Van Dijken, G. L. (2011). Secular trends in Arctic Ocean net primary production. J. Geophys. Res. Ocean 116, 1–15. doi: 10.1029/2011JC007151
Arrigo, K. R., van Dijken, G., and Pabi, S. (2008). Impact of a shrinking Arctic ice cover on marine primary production. Geophys. Res. Lett. 35, 1–6. doi: 10.1029/2008GL035028
Baar, H. J. W., De, B., Oyd, P. W., Coale, K. H., Landry, M. R., Tsuda, A., et al. (2005). Synthesis of iron fertilization experiments: from the iron age in the age of enlightenment. J. Geophys. Res. 110, 1–24. doi: 10.1029/2004JC002601
Baker, E. T., Edmonds, H. N., Michael, P. J., Bach, W., Dick, H. J. B., Snow, J. E., et al. (2004). Hydrothermal venting in magma deserts: the ultraslow-spreading Gakkel and Southwest Indian Ridges. Geochem. Geophys. Geosyst. 5, 1–29. doi: 10.1029/2004GC000712
Bauch, D., van der Loeff, M. R., Andersen, N., Torres-Valdes, S., Bakker, K., and Abrahamsen, E. P. (2011). Origin of freshwater and polynya water in the Arctic Ocean halocline in summer 2007. Prog. Oceanogr. 91, 482–495. doi: 10.1016/j.pocean.2011.07.017
Bergeron, M., and Tremblay, J.-É. (2014)., Shifts in biological productivity inferred from nutrient drawdown in the southern Beaufort Sea (2003-2011) and northern Baffin Bay (1997-2011), Canadian Arctic. Geophys. Res. Lett. 41, 3979–3987. doi: 10.1002/2014GL059649
Bhatt, U. S., Walker, D. A., Walsh, J. E., Carmack, E. C., Frey, K. E., Meier, W. N., et al. (2014). Implications of Arctic Sea ice decline for the earth system. Annu. Rev. Environ. Resour. 39, 57–89. doi: 10.1146/annurev-environ-122012-094357
Blain, S., Bonnet, S., and Guieu, C. (2008). Dissolved iron distribution in the tropical and sub tropical South Eastern Pacific. Biogeosciences 5, 269–280. doi: 10.5194/bg-5-269-2008
Bluhm, B. A., Kosobokova, K. N., and Carmack, E. C. (2015). A tale of two basins: an integrated physical and biological perspective of the deep Arctic Ocean. Prog. Oceanogr. 139, 89–121. doi: 10.1016/j.pocean.2015.07.011
Boyd, P. W., Jickells, T., Law, C. S., Blain, S., Boyle, E., Buesseler, K. O., et al. (2007). Mesoscale iron enrichment experiments 1993-2005: synthesis and future directions. Science 315, 612–617. doi: 10.1126/science.1131669
Brown, M. T., Lippiatt, S. M., Lohan, M. C., and Bruland, K. W. (2012). Trace metal distributions within a Sitka eddy in the northern Gulf of Alaska. Limnol. Oceanogr. 57, 503–518. doi: 10.4319/lo.2012.57.2.0503
Bullard, J. E. (2017). The distribution and biogeochemical importance of high-latitude dust in the Arctic and Southern Ocean-Antarctic regions. J. Geophys. Res. Atmos. 122, 3098–3103. doi: 10.1002/2016JD026363
Carmack, E. C., Yamamoto-Kawai, M., Haine, T. W. N., Bacon, S., Bluhm, B. A., Lique, C., et al. (2016). Freshwater and its role in the Arctic Marine System: Sources, disposition, storage, export and physical and biogeochemical consequences in the Arctic and global oceans. J. Geophys. Res. Biogeosci. 121, 675–717, doi: 10.1002/2015JG003140
Codispoti, L. A., Kelly, V., Thessen, A., Matrai, P., Suttles, S., Hill, V., et al. (2013). Synthesis of primary production in the Arctic Ocean: III. nitrate and phosphate based estimates of net community production. Prog. Oceanogr. 110, 126–150. doi: 10.1016/j.pocean.2012.11.006
de Baar, H. J. W., Timmermans, K. R., Laan, P., De Porto, H. H., Ober, S., Blom, J. J., et al. (2008). Titan: A new facility for ultraclean sampling of trace elements and isotopes in the deep oceans in the international Geotraces program. Mar. Chem. 111, 4–21. doi: 10.1016/j.marchem.2007.07.009
Edmonds, H. N., Michael, P. J., Baker, E. T., Connelly, D. P., Snow, J. E., Langmuir, C. H., et al. (2003). Discovery of abundant hydrothermal venting on the ultraslow-spreading Gakkel ridge in the Arctic Ocean. Nature 421, 252–256. doi: 10.1038/nature01351
Fernández-Méndez, M., Katlein, C., Rabe, B., Nicolaus, M., Peeken, I., Bakker, K., et al. (2015). Photosynthetic production in the central Arctic Ocean during the record sea-ice minimum in 2012. Biogeosciences 12, 3525–3549. doi: 10.5194/bg-12-3525-2015
Fitzsimmons, J. N., John, S. G., Marsay, C. M., Hoffman, C. L., Nicholas, S. L., Toner, B. M., et al. (2017). Iron persistence in a distal hydrothermal plume supported by dissolved–particulate exchange. Nat. Geosci. 10, 195–201. doi: 10.1038/ngeo2900
Fortier, M., Fortier, L., Michel, C., and Legendre, L. (2002). Climatic and biological forcing of the vertical flux of biogenic particles under seasonal Arctic sea ice. Mar. Ecol. Prog. Ser. 225, 1–16. doi: 10.3354/meps225001
Gerringa, L. J. A., Rijkenberg, M. J. A., Schoemann, V., Laan, P., and de Baar, H. J. W. (2015). Organic complexation of iron in the West Atlantic Ocean. Mar. Chem. 177, 434–446. doi: 10.1016/j.marchem.2015.04.007
Gordienko, P. A., and Laktionov, A. F. (1969). “Circulation and physics of the Arctic basin waters,” in Oceanography: Annals of The International Geophysical Year, Vol. 46, eds A. L. Gordon and F. W. G Baker (London: Pergamon Press), 94–112.
Grasshoff, K. (1983). “Determination of nitrate,” in Methods of Seawater Analysis, eds K. Grasshoff, M. Erhardt, and K. Kremling (Weinheim: Verlag Chemie), 143–187.
Gregor, D. J., Loeng, H., and Barrie, L. (1998). The Influence of Physical and Chemical Processes on Contaminant Transport into and within the Arctic, Arctic Monitoring and Assessment. Report: Arctic Pollution Issues.
Haas, C., Pfaffling, A., Hendricks, S., Rabenstein, L., Etienne, J. L., and Rigor, I. (2008). Reduced ice thickness in Arctic transpolar drift favors rapid ice retreat. Geophys. Res. Lett. 35, 1–5. doi: 10.1029/2008GL034457
Hirst, C., Andersson, P. S., Shaw, S., Burke, I. T., Kutscher, L., Murphy, M. J., et al. (2017). Characterisation of Fe-bearing particles and colloids in the Lena River basin, NE Russia. Geochim. Cosmochim. Acta 213, 553–573. doi: 10.1016/j.gca.2017.07.012
IPCC (2013). “Summary for Policymakers,” in Climate Change 2013: The Physical Science Basis. Contribution of Working Group I to the Fifth Assessment Report of the Intergovernmental Panel on Climate Change, eds T. F. Stocker, D. Qin, G.-K. Plattner, M. Tignor, S. K. Allen, J. Boschung, A. Nauels, Y. Xia, V. Bex, and P. M. Midgley (Cambridge; New York, NY: Cambridge University Press), 1–30.
IPCC (2014). “Climate Change 2014: Synthesis Report. Contribution of Working Groups I, II and III,” in Fifth Assessment Report of the Intergovernmental Panel on Climate Change. Core Writing Team, eds R. K. Pachauri and L. A. Meyer (IPCC, Geneva), 151.
Johnson, K. S., Boyle, E., Bruland, K., Measures, C., Moffett, J., Aquilarislas, A., et al. (2007). Developing standards for dissolved iron in seawater. Eos Transac. Am. Geophys. Union 88, 131–132. doi: 10.1029/2007EO110003
Klunder, M. B., Bauch, D., Laan, P., de Baar, H. J. W., van Heuven, S., and Ober, S. (2012a). Dissolved iron in the Arctic shelf seas and surface waters of the central Arctic Ocean: impact of Arctic river water and ice-melt. J. Geophys. Res. 117:C01027. doi: 10.1029/2011JC007133
Klunder, M. B., Laan, P., Middag, R., de Baar, H. J. W., and Bakker, K. (2012b). Dissolved iron in the Arctic Ocean: important role of hydrothermal sources, shelf input and scavenging removal. J. Geophys. Res. 117:C04014. doi: 10.1029/2011JC007135
Kwok, R., Cunningham, G. F., Wensnahan, M., Rigor, I., Zwally, H. J., and Yi, D. (2009). Thinning and volume loss of the Arctic Ocean sea ice cover: 2003-2008. J. Geophys. Res. Ocean 114, 2003–2008. doi: 10.1029/2009JC005312
Laglera, L. M., and van den Berg, C. M. G. (2009). Evidence for geochemical control of iron by humic substances in seawater. Limnol. Oceanogr. 54, 610–619. doi: 10.4319/lo.2009.54.2.0610
Lam, P. J., Bishop, J. K. B., Henning, C. C., Marcus, M. A., Waychunas, G. A., and Fung, I. Y. (2006). Wintertime phytoplankton bloom in the subarctic Pacific supported by continental margin iron. Glob. Biogeochem. Cycles 20:GB1006. doi: 10.1029/2005GB002557
Lannuzel, D., Bowie, A. R., Remenyi, T., Lam, P., Townsend, A., Ibisanmi, E., et al. (2011)., Distributions of dissolved and particulate iron in the sub-Antarctic and polar frontal Southern Ocean (Australian sector). Deep Sea Res. II Top. Stud. Oceanogr. 58, 2094–2112. doi: 10.1016/j.dsr2.2011.05.027
Lohan, M. C., and Bruland, K. W. (2006). Importance of vertical mixing for additional sources of nitrate and iron to surface waters of the Columbia River plume: implications for biology. Mar. Chem. 98, 260–273. doi: 10.1016/j.marchem.2005.10.003
Macdonald, R. W., Harner, T., and Fyfe, J. (2005). Recent climate change in the Arctic and its impact on contaminant pathways and interpretation of temporal trend data. Sci. Total Environ. 342, 5–86. doi: 10.1016/j.scitotenv.2004.12.059
Maslanik, J., Stroeve, J., Fowler, C., and Emery, W. (2011). Distribution and trends in Arctic sea ice age through spring 2011. Geophys. Res. Lett. 38, 2–7. doi: 10.1029/2011GL047735
Middag, R., de Baar, H. J. W., Laan, P., and Klunder, M. B. (2011). Fluvial and hydrothermal input of manganese into the Arctic Ocean. Geochim. Cosmochim. Acta 75, 2393–2408. doi: 10.1016/j.gca.2011.02.011
Mills, M. M., Brown, Z. W., Lowry, K. E., van Dijken, G. L., Becker, S., Pal, S., et al. (2015). Impacts of low phytoplankton NO3-: PO43- utilization ratios over the Chukchi Shelf, Arctic Ocean. Deep. Res. II Top. Stud. Oceanogr. 118, 105–121. doi: 10.1016/j.dsr2.2015.02.007
Moore, J. K., and Braucher, O. (2008). Sedimentary and mineral dust sources of dissolved iron to the World Ocean. Biogeosciences 5, 631–656. doi: 10.5194/bg-5-631-2008
Mundy, C. J., Gosselin, M., Ehn, J., Gratton, Y., Rossnagel, A., Barber, D. G., et al. (2009). Contribution of under-ice primary production to an ice-edge upwelling phytoplankton bloom in the Canadian Beaufort Sea. Geophys. Res. Lett. 36, 1–5. doi: 10.1029/2009GL038837
Murphy, J., and Riley, J. P. (1962). A modified single solution method for the determination of phosphorous in natural waters. Anal. Chim. Acta 27, 31–36. doi: 10.1016/S0003-2670(00)88444-5
National Snow Ice Data Center (2012). Arctic Sea Ice Extent Settles at Record Seasonal Minimum [WWW Document]. National Snow Ice Data Center. Available online at: http://nsidc.org/arcticseaicenews/2012/09/arctic-sea-ice-extent-settles-at-record-seasonal-minimum/ (Accessed Oct 20, 17).
National Snow Ice Data Center (2015). Arctic Sea Ice Reaches Fourth Lowest Minimum [WWW Document]. National Snow Ice Data Center. Available online: http://nsidc.org/arcticseaicenews/2015/09/2015_arctic-minimum/ (Accessed Oct 20, 17).
Nishino, S., Kikuchi, T., Yamamoto-Kawai, M., Kawaguchi, Y., Hirawake, T., and Itoh, M. (2011). Enhancement/reduction of biological pump depends on ocean circulation in the sea-ice reduction regions of the Arctic Ocean. J. Oceanogr. 67, 305–314. doi: 10.1007/s10872-011-0030-7
Olli, K., Wassmann, P., Reigstad, M., Ratkova, T. N., Arashkevich, E., Pasternak, A., et al. (2007). The fate of production in the central Arctic Ocean - top-down regulation by zooplankton expatriates? Prog. Oceanogr. 72, 84–113. doi: 10.1016/j.pocean.2006.08.002
Parekh, P., Follows, M. J., and Boyle, E. A. (2005). Decoupling of iron and phosphate in the global ocean. Global Biogeochem. Cycles 19, 1–16. doi: 10.1029/2004GB002280
Peterson, B. J., Holmes, R. M., McClelland, J. W., Vörösmarty, C. J., Lammers, R. B., Shiklomanov, A. I., et al. (2002). Increasing river discharge to the Arctic Ocean. Science 298, 2171–2173. doi: 10.1126/science.1077445
Peterson, B. J., McClelland, J. W., Curry, R., Holmes, R. M., Walsh, J. E., and Aagaard, K. (2006). Trajectory Shifts in the Arctic and subarctic freshwater cycle. Science 313, 1061–1066. doi: 10.1126/science.1122593
Rabe, B., Karcher, M., Kauker, F., Schauer, U., Toole, J. M., Krishfield, R. A., et al. (2014). Arctic Ocean basin liquid freshwater storage trend 1992 – 2012. Geophys. Res. Lett. 41, 961–968. doi: 10.1002/2013GL058121
Rabe, B., Schauer, U., Ober, S., Horn, M., Hoppmann, M., Korhonen, M., et al. (2016). Physical Oceanography During POLARSTERN Cruise PS94 (ARK-XXIX/3). Alfred Wegener Institute, Helmholtz Center for Polar and Marine Research, Bremerhaven, PANGAEA.
Rijkenberg, M. J. A., de Baar, H. J. W., Bakker, K., Gerringa, L. J. A., Keijzer, E., Laan, M., et al. (2015). “PRISTINE”, a new high volume sampler for ultraclean sampling of trace metals and isotopes. Mar. Chem. 177, 501–509. doi: 10.1016/j.marchem.2015.07.001
Rijkenberg, M. J. A., Middag, R., Laan, P., Gerringa, L. J. A., Van Aken, H. M., Schoemann, V., et al. (2014). The distribution of dissolved iron in the West Atlantic Ocean. PLoS ONE 9:e0101323. doi: 10.1371/journal.pone.0101323
Roeske, T., Loeff, M. R., Middag, R., and Bakker, K. (2012). Deep water circulation and composition in the Arctic Ocean by dissolved barium, aluminium and silicate. Mar. Chem. 132–133, 56–67. doi: 10.1016/j.marchem.2012.02.001
Rudels, B. (2010). “Arctic Ocean circulation,” in Ocean Currents, A Derivative of the Encyclopedia of Ocean Sciences, eds J. Steele, S. Thorpe, and K. Turekian (Cambridge: Academic Press), 647.
Rudels, B. (2012). Arctic Ocean circulation and variability - advection and external forcing encounter constraints and local processes. Ocean Sci. 8, 261–286. doi: 10.5194/os-8-261-2012
Rudels, B. (2015). Arctic Ocean circulation, processes and water masses: a description of observations and ideas with focus on the period prior to the international polar year 2007–2009. Prog. Oceanogr. 132, 22–67. doi: 10.1016/j.pocean.2013.11.006
Rutgers van der Loeff, M., Cai, P., Stimac, I., Bauch, D., Hanfland, C., Roeske, T., et al. (2012). Shelf-basin exchange times of Arctic surface waters estimated from228Th/228Ra disequilibrium. J. Geophys. Res. Ocean 117:C03024. doi: 10.1029/2011JC007478
Schlitzer, R. (2016). Ocean Data View. Available online at: http://odv.awi.de
Scholten, J. C., Rutgers van der Loeff, M. M., and Michel, A. (1995). Distribution of 230Th and 231Pa in the water column in relation to the ventilation of the deep Arctic basins. Deep. Res. II 42, 1519–1531. doi: 10.1016/0967-0645(95)00052-6
Schuur, E. A. G., McGuire, A. D., Grosse, G., Harden, J. W., Hayes, D. J., Hugelius, G., et al. (2015). Climate change and the permafrost carbon feedback. Nature 520, 171–179. doi: 10.1038/nature14338
Serreze, M. C., and Stroeve, J. (2015). Arctic sea ice trends, variability and implications for seasonal ice forecasting. Philos. Trans. R. Soc. A Math. Phys. Eng. Sci. 373:20140159. doi: 10.1098/rsta.2014.0159
Serreze, M. C., Stroeve, J., Barrett, A. P., and Boisvert, L. N. (2016). Summer atmospheric circulation anomalies over the Arctic Ocean and their influences on September sea ice extent: a cautionary tale. J. Geophys. Res. Atmos. 121:485. doi: 10.1002/2016JD025161
Slagter, H. A., Reader, H. E., Rijkenberg, M. J. A., Rutgers van der Loeff, M., de Baar, H. J. W., and Gerringa, L. J. A. (2017). Organic Fe speciation in the Eurasian basins of the Arctic Ocean and its relation to terrestrial DOM. Mar. Chem 197, 11–25. doi: 10.1016/j.marchem.2017.10.005
Stedmon, C. A., Amon, R. M. W., Rinehart, A. J., and Walker, S. A. (2011). The supply and characteristics of colored dissolved organic matter (CDOM) in the Arctic Ocean: Pan Arctic trends and differences. Mar. Chem. 124, 108–118. doi: 10.1016/j.marchem.2010.12.007
Strass, V. H., and Nöthig, E. M. (1996). Seasonal shifts in ice edge phytoplankton blooms in the Barents Sea related to the water column stability. Polar Biol. 16, 409–422. doi: 10.1007/BF02390423
Strickland, J. D. H., and Parsons, T. R. (1972). A Practical Handbook of Seawater Analysis. Ottawa: Fisheries Research Board of Canada.
Stroeve, J. C., Serreze, M. C., Holland, M. M., Kay, J. E., Malanik, J., and Barrett, A. P. (2012). The Arctic's rapidly shrinking sea ice cover: a research synthesis. Clim. Change 110, 1005–1027. doi: 10.1007/s10584-011-0101-1
Strzepek, R. F., Maldonado, M. T., Hunter, K. A., Frew, R. D., and Boyd, P. W. (2011). Adaptive strategies by Southern Ocean phytoplankton to lessen iron limitation: uptake of organically complexed iron and reduced cellular iron requirements. Limnol. Oceanogr. 56, 1983–2002. doi: 10.4319/lo.2011.56.6.1983
Sunda, W. G. (1997). Control of dissolved iron concentrations in the world ocean, a comment. Mar. Chem. 57, 169–172. doi: 10.1016/S0304-4203(97)00045-5
Tagliabue, A., Aumont, O., DeAth, R., Dunne, J. P., Dutkiewicz, S., Galbraith, E., et al. (2016). How well do global ocean biogeochemistry models simulate dissolved iron distributions? Glob. Biogeochem. Cycles 30, 149–174. doi: 10.1002/2015GB005289
Tanhua, T., Jones, E. P., Jeansson, E., Jutterström, S., Smethie, W. M., Wallace, D. W. R., et al. (2009). Ventilation of the arctic ocean: mean ages and inventories of anthropogenic CO2 and CFC-11. J. Geophys. Res. Ocean 114, 1–11. doi: 10.1029/2008JC004868
Taylor, R. L., Semeniuk, D. M., Payne, C. D., Zhou, J., Tremblay, J.-É., Cullen, J. T., et al. (2013). Colimitation by light, nitrate, and iron in the Beaufort Sea in late summer. J. Geophys. Res. Ocean 118, 3260–3277. doi: 10.1002/jgrc.20244
Thuróczy, C.-E., Alderkamp, A.-C., Laan, P., Gerringa, L. J. A., Mills, M. M., Van Dijken, G. L., et al. (2012). Key role of organic complexation of iron in sustaining phytoplankton blooms in the Pine Island and Amundsen Polynyas (Southern Ocean). Deep. Res. II Top. Stud. Oceanogr. 71–76, 49–60. doi: 10.1016/j.dsr2.2012.03.009
Thuróczy, C.-E., Gerringa, L. J. A., Klunder, M., Laan, P., Le Guitton, M., and de Baar, H. J. W. (2011). Distinct trends in the speciation of iron between the shallow shelf seas and the deep basins of the Arctic Ocean. J. Geophys. Res. 116:C10009. doi: 10.1029/2010JC006835
Tremblay, J. É., Anderson, L. G., Matrai, P., Coupel, P., Bélanger, S., Michel, C., et al. (2015). Global and regional drivers of nutrient supply, primary production and CO2 drawdown in the changing Arctic Ocean. Prog. Oceanogr. 139, 171–196. doi: 10.1016/j.pocean.2015.08.009
Tremblay, J. É., Simpson, K., Martin, J., Miller, L., Gratton, Y., Barber, D., et al. (2008). Vertical stability and the annual dynamics of nutrients and chlorophyll fluorescence in the coastal, southeast Beaufort Sea. J. Geophys. Res. Ocean 113, 1–14. doi: 10.1029/2007JC004547
Tremblay, J.-É., and Gagnon, J. (2009). “The effects of irradiance and nutrient supply on the productivity of Arctic waters: a perspective on climate change,” in Influence of Climate Change on the Changing Arctic and Sub-Arctic Conditions, eds J. C. J. Nihoul and A. G. Kostianoy (Dordrecht: Springer), 73–93.
Twining, B. S., Rauschenberg, S., Morton, P. L., and Vogt, S. (2015). Metal contents of phytoplankton and labile particulate material in the North Atlantic Ocean. Prog. Oceanogr. 137, 261–283. doi: 10.1016/j.pocean.2015.07.001
Ulfsbo, A., Cassar, N., Korhonen, M., Heuven, S., and Van, H. (2014). Latesummernet communityproduction in the central Arctic Ocean using multiple approaches Adam. Glob. Biogeochem. Cycles 28, 1129–1148. doi: 10.1002/2014GB004833
Vancoppenolle, M., Bopp, L., Madec, G., Dunne, J., Ilyina, T., Halloran, P. R., et al. (2013). Future arctic ocean primary productivity from CMIP5 simulations: Uncertain outcome, but consistent mechanisms. Glob. Biogeochem. Cycles 27, 605–619. doi: 10.1002/gbc.20055
Vonk, J. E., Mann, P. J., Davydov, S., Davydova, A., Spencer, R. G. M., Schade, J., et al. (2013). High biolability of ancient permafrost carbon upon thaw. Geophys. Res. Lett. 40, 2689–2693. doi: 10.1002/grl.50348
Keywords: GEOTRACES, dissolved Fe, Arctic Ocean, Fe limitation, climate change
Citation: Rijkenberg MJA, Slagter HA, Rutgers van der Loeff M, van Ooijen J and Gerringa LJA (2018) Dissolved Fe in the Deep and Upper Arctic Ocean With a Focus on Fe Limitation in the Nansen Basin. Front. Mar. Sci. 5:88. doi: 10.3389/fmars.2018.00088
Received: 07 November 2017; Accepted: 02 March 2018;
Published: 27 March 2018.
Edited by:
Christel Hassler, Université de Genève, SwitzerlandReviewed by:
Jessica Nicole Fitzsimmons, Texas A&M University College Station, United StatesLudvig Löwemark, National Taiwan University, Taiwan
Copyright © 2018 Rijkenberg, Slagter, Rutgers van der Loeff, van Ooijen and Gerringa. This is an open-access article distributed under the terms of the Creative Commons Attribution License (CC BY). The use, distribution or reproduction in other forums is permitted, provided the original author(s) and the copyright owner are credited and that the original publication in this journal is cited, in accordance with accepted academic practice. No use, distribution or reproduction is permitted which does not comply with these terms.
*Correspondence: Loes J. A. Gerringa, bG9lcy5nZXJyaW5nYUBuaW96Lm5s