 Birgitte Nilsson
 Per M. Jepsen
 Ann Bucklin
 Benni W. Hansen
- 1Department of Science and Environment, Roskilde University, Roskilde, Denmark
- 2Department of Marine Sciences, University of Connecticut, Groton, CT, United States
Handling animals during experiments potentially affects the differential expression of genes chosen as biomarkers of sub-lethal stress. RNA sequencing was used to examine whole-transcriptome responses caused by laboratory handling of the calanoid copepod, Acartia tonsa. Salinity shock (S = 35 to S = 5) was used as positive stress control; individuals not exposed to handling or other stressors served as negative stress control. All copepods were grown from eggs to adults without being handled or exposed to any stressors prior the experiment. Survival of nauplii and adults was estimated for up to 10 min of exposure to handling stress and salinity shock. Only adults exhibited decreased survival (44 ± 7% with 10 min of exposure) in response to handling stress and were selected for definitive experiments for RNA sequencing. After 10 min of experimental exposures to handling stress or salinity shock, adults were incubated for 15 min or 24 h at normal culture conditions. A small number of significantly differentially expressed genes (DEGs) were observed 15 min after exposure to handling stress (2 DEGs) or salinity shock (7 DEGs). However, 24 h after exposure, handling stress resulted in 276 DEGs and salinity shock resulted in 573 DEGs, of which 174 DEGs were overlapping between the treatments. Among the DEGs observed 24 h after exposure to handling stress or salinity shock, some commonly-used stress biomarkers appeared at low levels. This suggests that a stress-response was induced at the transcriptional level for these genes between 15 min and 24 h following exposure. Since handling stress clearly affects transcriptional patterns, it is important to consider handling when designing experiments, by either including additional controls or avoiding focus on impacted genes. Not considering handling in gene expression studies can lead to inaccurate conclusions. The present study provides a baseline for studying handling stress in future studies using this model organism and others.
Introduction
Copepods provide a principal link in the transfer of energy from phytoplankton to higher trophic levels in the marine food webs, and are preferred prey for predators, such as juvenile fishes and shrimps (Turner, 2004). Given the high natural abundance of copepods and their importance for marine ecosystems, understanding how stressors affect copepods is a concern for estuarine and marine ecology. Copepods are widely used in environmental monitoring as indicators of ecosystem health (Beaugrand, 2009). Hence, stress responses of copepods used for diagnostic (e.g., ecotoxicology testing) or experimental purposes might result in wrong conclusions when interpreting or extrapolating results from procedures that entail experimental handling.
Transcriptional biomarkers that are commonly used to indicate sub-lethal effects of stress include detoxification enzymes (i.e., cytochrome P450 and Glutathionine-S-transferase), as well as stress-related proteins, or chaperones, that protect macromolecules from damage (Davies and Vethaak, 2012; Amiard-Triquet and Berthet, 2015). In general, it is an overlooked issue that some of these biomarkers may respond to stress associated with handling, capture, collection, and other events in the experimental setup of both laboratory and field studies. Failure to consider the effects of experimental handling on gene expression during studies of environmental stress could cause erroneous conclusions about the data, by either increasing the risk of false positive results or by masking treatment-specific effects. Experimentally-induced and handling-related stress has been extensively studied in larger crustaceans (Fotedar and Evans, 2011). To our knowledge, only a few studies, e.g., Aruda et al. (2011) and Rahlff et al. (2017), have examined handling stress in copepods with targeted methods, which entail the evaluation of specific transcriptional biomarkers selected to evaluate certain stressors, typically by real-time quantitative PCR.
The aim of this study is to examine the transcriptome-wide effects of handling stress on the calanoid copepod, Acartia tonsa. Because of the growing interest in A. tonsa as a model species for experimental studies, as well as an indicator species for environmental monitoring, and a valuable live-feed species for aquaculture industries, there are important issues for selecting appropriate biomarkers and establishing an accurate baseline description of a non-stressed copepod (Kwok et al., 2015). In both laboratory and field studies, plankton nets are commonly used for collection and size separation of copepod life stages (Uye and Kuwata, 1983; Rahlff et al., 2017). Because of this, the use of plankton nets was used to represent handling stress in this study.
A. tonsa is a robust species that, when acclimated, can persist in salinities ranging from 1 to 72 S, with an optimal salinity around 15 to 22 S (Holste and Peck, 2006). Even though A. tonsa is more tolerant to salinity variation than other Acartia species, abrupt change in salinity has been documented as a significant stressor (Lance, 1964; Chinnery and Williams, 2004; Calliari et al., 2006). Abrupt changes in salinity that exceed 10-15 S relative to the ambient level of A. tonsa have been shown to decrease survival more than 50% (Cervetto et al., 1999). For a positive-stress control, we used an extreme salinity shock from S = 35 to S = 5 to provoke a response at both the transcriptional and physiological levels.
In addition to the overall lack of data in relation to handling stress, there is no information regarding the extent to which handling will cause changes at the transcriptional level. Since this is a first approach to examine transcriptome-wide handling stress, the treatments used may be considered somewhat “extreme,” and are designed to ensure a response at the transcriptional level. The intention of the present study is to establish a foundation for future studies for this model species and others, in which handling stress can be described in greater detail.
Materials and Methods
Stock Culture
The strain of A. tonsa (identity code: DFH.AT1) has been in culture since 1981, when it was collected from Øresund (56° N; 12° E; Denmark) (Støttrup et al., 1986). The strain has been cultivated at Roskilde University (Denmark) in 60 L polyethylene tanks for >20 years under stable conditions (0.2 μm filtered seawater, S = 35, 17°C, oxygen > 60%, dim lighting). The diet consisted of the microalgae, Rhodomonas salina (identity code: K-1487). R. salina is cultivated in 2 L round-bottom flasks under stable temperature (17°C), with constant aeration and light (PAR ~ 80 μE m−2 s−1). The algal culture is diluted daily with Guillard's F/2 enrichment solution (Guillard and Ryther, 1962).
Experimental Cultures
The experimental design comprised three treatments: control (no stress) (Figure 1A), handling stress (Figure 1B) and salinity shock (Figure 1C). Embryos of mixed age and stage were harvested from three stock cultures and transferred to 2 L Nalgene© polycarbonate bottles (Thermo Fisher Scientific, USA) containing 0.2 μm filtered seawater (S = 35), where they were incubated at 17°C for hatching. For each of the treatments triplicate cultivation flasks were set up as biological replicates. During cultivation, as well as during all experimental treatments, the flasks were kept at 17 ± 1°C, with dim light and gentle aeration. R. salina were fed to the copepods in excess (>800 μg C L−1; Berggreen et al., 1988) daily. Oxygen content was measured daily with a hand-held oxygen-probe (Handy Polaris 2, OxyGuard International A/S, Denmark) and exhibited values ranged from 6.9 to 7.5 mg O2 L−1.
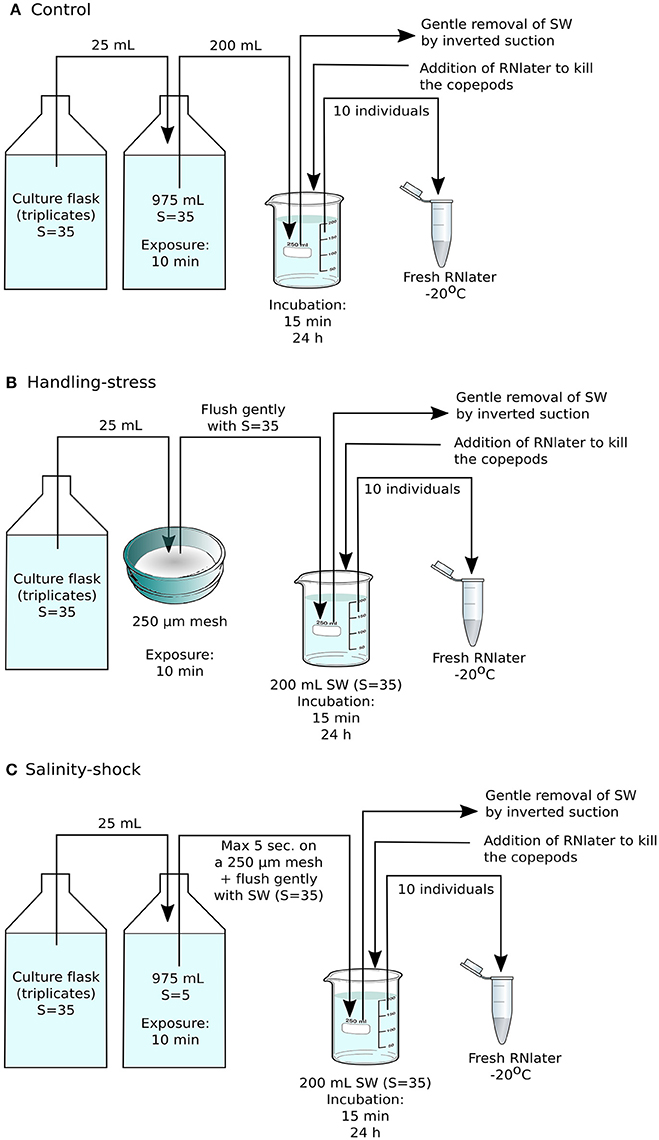
Figure 1. Experimental setup for RNA sequencing. (A) The control consisted of Acartia tonsa grown from eggs to adults prior to the experiment without being handled, followed by incubation at regular culture conditions for 15 min or 24 h, prior to fixation with RNAlater. (B) In the handling stress treatment, adult individuals were placed on Nitex plankton net material with mesh size of 250 μm, and then kept at stock culture conditions for 15 min or 24 h before fixation with RNA later. (C) The salinity shock treatment consisted of animals exposed to salinity S = 5 for 10 min, followed by incubation at stock culture conditions for 15 min or 24 h. Each treatment was performed in triplicate, with each sample containing 10 adult individuals of A. tonsa.
Nauplii (body length: 130 ± 16 μm, 4 days of development n = 45) and adults (prosome length: 730 ± 54 μm, 15 days of development) were monitored for survival. Adults (764 ± 42 μm, 15 days of development n = 48) used for RNA sequencing were grown from eggs to the desired life stage without being handled. Prosome lengths were measured by photographing the copepods with a Nikon SM218 microscope with 13.5x magnification, mounted with a Nikon Digital sight DS-U3 camera (20 × magnification) and subsequently analyzing the images using the software package NIS-Elements BR 4.40 (Nikon Instruments Europe, B.V., The Netherlands).
Experimental Design
The experimental design was repeated twice, once to estimate survival and a second time for RNA sequencing (Figure 1). The initial determination of survival was used to identify both the life-stage and the exposure time for the definitive experiment for RNA sequencing.
For the control, nauplii or adults were removed from the triplicate cultures in Nalgene© bottles using a 25 mL automatic pipettor (NS 29.2/32,Witeg, Germany) and transferred to 1 L glass beakers containing 975 mL seawater, with the same conditions as described for the stock culture. The copepods were held in the control treatment for 25 s or 10 min before being transferred to new glass beakers. The copepods exposed to salinity shock were transferred to seawater with a salinity of S = 5; copepods exposed to handling stress were transferred to a Nitex plankton net (mesh size 54 μm for nauplii, 250 μm for adults) that was not submerged in water. For salinity shock and handling stress, the copepods were exposed for 25 sec, 1, 5, or 10 min before being transferred to glass beakers containing seawater with the same conditions as the stock culture. To distinguish between alive and dead, neutral red stain was added (15 mg/L seawater; Elliott and Tang, 2009). After rinsing with distilled water, dead and alive copepods were counted and survival was estimated. All three treatments were performed with 4 replicates.
Based on the results of the initial survival experiment, the definitive experiment for RNA sequencing was designed to include adult copepods and an exposure time of 10 min for handling stress or salinity shock, after which copepods were incubated for 15 min or 24 h at stock culture conditions. Seawater was then gently removed by inverted suction and the copepods were preserved in 20 mL RNAlater. Ten individuals from each triplicate experimental treatment were immediately transferred to 1 mL fresh RNAlater and stored at −20°C (Figures 1A–C).
Additionally, survival was estimated for copepods 24 h after exposure to 10 min salinity shock or handling stress with a control of non-handled individuals, as described for the initial survival estimation.
Statistical analysis and preparation of graphics were done using R (www.R-project.org, ver. 3.4.0). From the counts of dead and alive copepods, survival (%) was calculated for each exposure time and analyzed by linear regression. Differences between treatments were analyzed based on two-tailed t-tests of the regression coefficients (Sokal and Rohlf, 1995).
RNA Extraction, Library Preparation, and Sequencing
Total RNA was extracted from A. tonsa using the RNeasy Mini Kit (Qiagen GmbH, Hilden, Germany). For each treatment (control, handling stress, salinity shock), three biological replicates were analyzed, each consisting of 10 pooled individuals (prosome length = 758 ± 67 μm).
After removal of excess RNAlater (Sigma Aldrich, St. Louis, MO, USA), the copepods were homogenized in 50 μL RLT buffer using disposable micro-pestles, after which 550 μL RLT buffer was added. The samples were vortexed for 1–2 s, and then processed according to the manufacturer's protocol, with a final elution volume of 30 μL in RNase-free water.
RNA quality was assessed using an Agilent Tapestation 2200 with RNA High Sensitivity Assay (Agilent Technologies, Santa Clara, CA, USA). DNase treatment was not done, since previous extractions treated with the Turbo DNA-free kit (Ambion, Life Technologies, Carlsbad, CA, USA) exhibited significant degradation. The RNA quality profiling of A. tonsa exhibited a merged peak of 18S rRNA and 28S rRNA, presumably resulting from “hidden break” in 28S rRNA typical of many arthropods, which causes 28S rRNA to run at about the same size as 18S rRNA (McCarthy et al., 2015).
Library preparation was done using 360 ng total RNA from each sample following the manufacturer's protocol for the Illumina Stranded mRNA Library Preparation Kit (Illumina, Inc., San Diego, CA, USA). The libraries constructed from the 18 samples (3 treatments × 3 replicates × 2 incubation times) were multiplexed and sequenced in 2 runs across 4 lanes on the NextSeq500 platform (Illumina, San Diego, CA, USA), with a mid-output 150 cycle kit (FC-404-2001, Illumina, Inc., San Diego, CA, USA) with 75 bp paired-end reads and a sequencing depth of 25 million reads per sample. Library preparation and sequencing were carried out at the Center for Genome Innovation at the University of Connecticut (Storrs, CT, USA).
A reference transcriptome was determined from RNA extracted from a single individual of A. tonsa (female, prosome length 722 μm) selected at random from the control with 24 h of incubation. Total RNA (140 ng) was sequenced in 4 lanes on a NextSeq500 platform using a mid-output 300 cycles kit (FC-404-2003, Illumina, Inc., San Diego, CA, USA), with 150 bp paired-end reads resulting in ~350 million reads.
De Novo Transcriptome Assembly and Differential Gene Expression Analysis
FastQC (ver. 0.7; Andrews, 2010) was used to validate the quality of the raw sequence reads. Illumina adapter sequences and low-quality reads (Phred score < 20) were removed using Trimmomatic (ver. 3; Bolger et al., 2014) in paired-end mode, with a sliding window across an average of 4 bases. Initial read biases, introduced by random hexamer priming under cDNA synthesis, were corrected by removing the first 12 bp of each read (Hansen et al., 2010). Reads > 50 bp after quality trimming were retained, resulting in a total of ~225 million reads. The reference transcriptome was assembled de novo with Trinity (ver. 2.3.2; Grabherr et al., 2011) using default parameters for paired-end reads, with normalization to decrease run time and memory requirements.
The completeness of the reference transcriptome was evaluated using the Benchmarking Universal Single-Copy Orthologs (BUSCO, ver. 2; Simão et al., 2015), which defines a set of eukaryotic core genes to test the proportion and completeness of these genes in the transcriptome assembly. Bowtie2 (ver. 2.2.6; Langmead and Salzberg, 2012) was used to examine the RNA sequencing read representation of the assembly by realigning the input reads to the de novo transcriptome. Contig N50 and E90N50 statistics were computed based on the scripts included in the Trinity software package, as well as transcript abundance estimation using Kallisto (ver. 0.43.0; Bray et al., 2016). The A. tonsa Transcriptome Shotgun Assembly project has been deposited at DDBJ/EMBL/GenBank under the accession GFWY00000000. The version described in this paper is the first version, GFWY01000000.
The Trinotate annotation pipeline (ver. 3.0.2; Haas et al., 2013) was used to annotate the reference transcriptome using Swissprot (Bairoch and Apweiler, 1999); Pfam (Finn et al., 2010); eggNOG (Powell et al., 2012); KEGG (Kanehisa et al., 2012); and Gene Ontology (Ashburner et al., 2000).
The reads from the experimental samples were pseudoaligned (i.e., rapid determination of compatibility between reads and targets, without the need for alignment) to the reference transcriptome and quantified using Kallisto (ver. 0.43; Bray et al., 2016), with 100 rounds of bootstrapping. The bootstrapping option in Kallisto accounts for technical variability and is used to estimate the probability of correct assignment to a transcript. Differential gene (and transcript) analysis was performed with Sleuth (ver. 0.29; Pimentel et al., 2017), using the likelihood ratio test (LRT) and the Wald test in R Core Team (2017) to estimate significant results (ver. 3.4.0; R Core Team, 2017). Statistically significant (q-values < 0.05) differential gene expression is reported as beta values, which are bias estimators of the fold-change that accounts for the technical variability of transcripts and are reported as natural log values (Pimentel et al., 2017; see Supplementary Material S4 for results of Sleuth analysis of non-annotated transcripts).
The Trinity transcript identifications for non-annotated transcripts were added into the gene-level analysis in Sleuth. Transcripts showing statistically significant differential expression (q-value < 0.05) were isolated and annotation was attempted using Blast2Go and the RefSeq database with the arthropod taxonomy filter, in order to maximize the proportion of identified genes in the analysis (Götz et al., 2008) (Supplementary Material S2). Based on the BlastX results (E ≤ 10−3), gene symbols for identified transcripts were added to the gene-level analysis in Sleuth. Transcripts that could not be identified were excluded from the analysis of differential gene expression.
Functional enrichment of differentially expressed genes was performed using clusterProfiler (ver. 3.6.0; Yu et al., 2012) for gene ontologies (GO) of cell compartments (CC), biological processes (BP) and, molecular functions (MF). The genes annotated by Trinotate from the reference transcriptome were used as background gene list. Differentially up- and down-regulated genes for handling stress and salinity shock (15 min and 24 h after exposure) were used as input data. The functional enrichment was performed with a Fisher Exact test (p-value < 0.05, FDR < 0.1). Graphs and subsequent data handling was done in R Core Team (2017) using the ggplot2 package (ver. 2.2.1).
Results
Survival
Survival of A. tonsa nauplii was statistically significantly (p < 0.001) affected by salinity shock (i.e., exposure to S = 5 for up to 10 min), in comparison to the control (Figure 2E, Table 1E). Naupliar survival in the control was 91 ± 4% (mean ± SD), while survival after salinity shock after 25 sec exposure was 95 ± 1%, declining to 22 ± 4% after 10 min exposure. Naupliar survival after handling stress was 97 ± 2% for exposure up to 10 min, which did not differ from the control, with an average survival of 97 ± 1% (Figure 2D, Table 1D). Survival for handling stress and salinity shock differed significantly by regression analysis (p < 0.001) (Figure 2F, Table 1F).
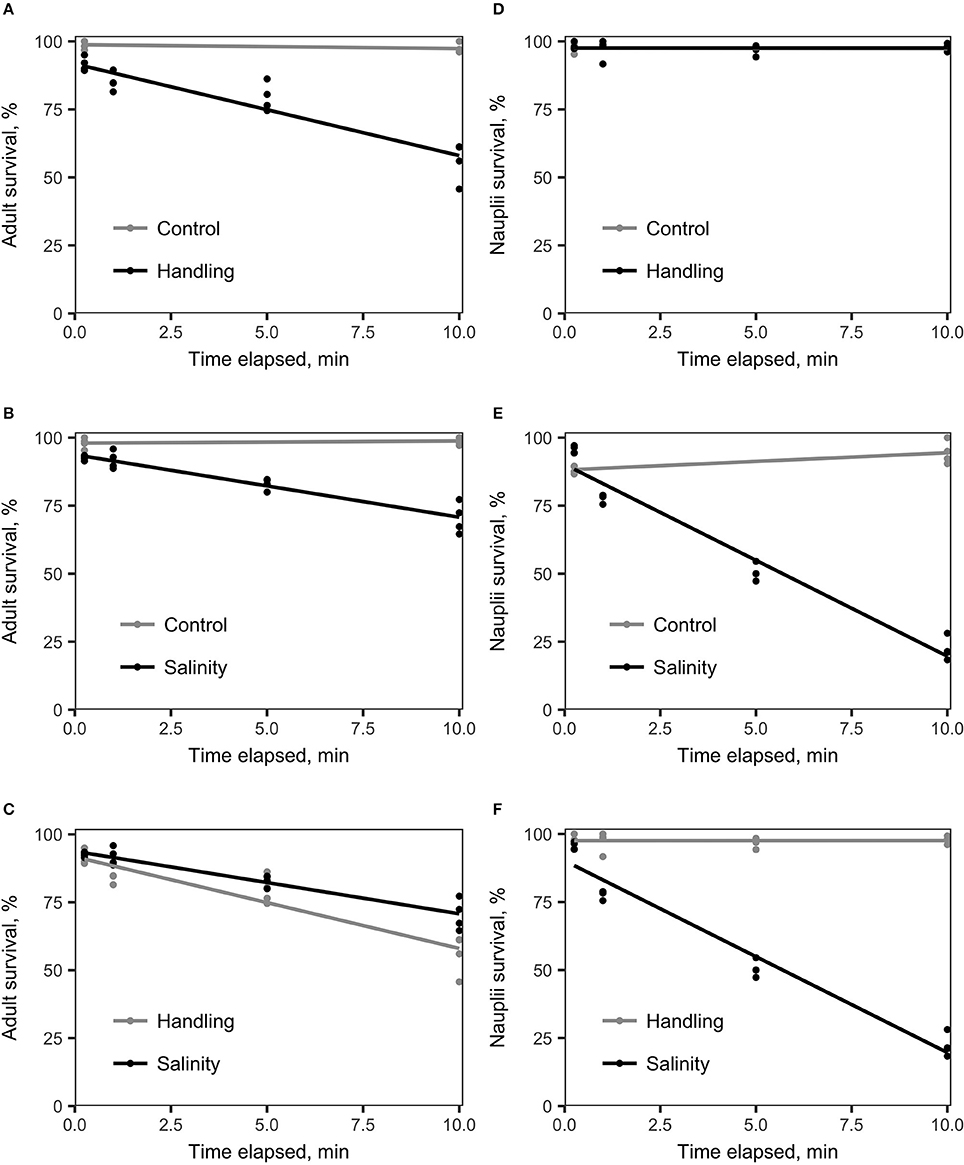
Figure 2. Linear regression analysis of survival (%) vs. time elapsed for various treatments compared to the control treatment. The handling stress treatment consisted of placing copepods on a Nitex plankton net screen (adult mesh size: 250 μm; nauplii mesh size: 54 μm). The salinity shock treatment consisted of exposure of copepods to S = 5. (A) A. tonsa adults exposed to handling stress (black) vs. control (gray). The two treatments differed statistically significantly from each other (Table 1, A). (B) A. tonsa adults exposed to a salinity shock (black) vs. the control (gray). Survival in the two treatments differed statistically significantly (Table 1, B). (C) A. tonsa adults exposed to salinity shock (black) vs. individuals exposed to handling stress (gray). Survival in the two treatments differed statistically significantly from each other (Table 1, C). (D) A. tonsa nauplii exposed to handling stress (black) vs. control (gray). Survival in the two treatments did not differ statistically significantly from each other (see Table 1, D). (E) A. tonsa nauplii exposed the salinity shock (black), vs. control (gray). The two treatments differed statistically significantly from each other (Table 1, E). (F) A. tonsa nauplii exposed to the salinity shock (black) vs. individuals exposed to handling stress (gray). The two treatments differed statistically significantly from each other (Table 1, F).
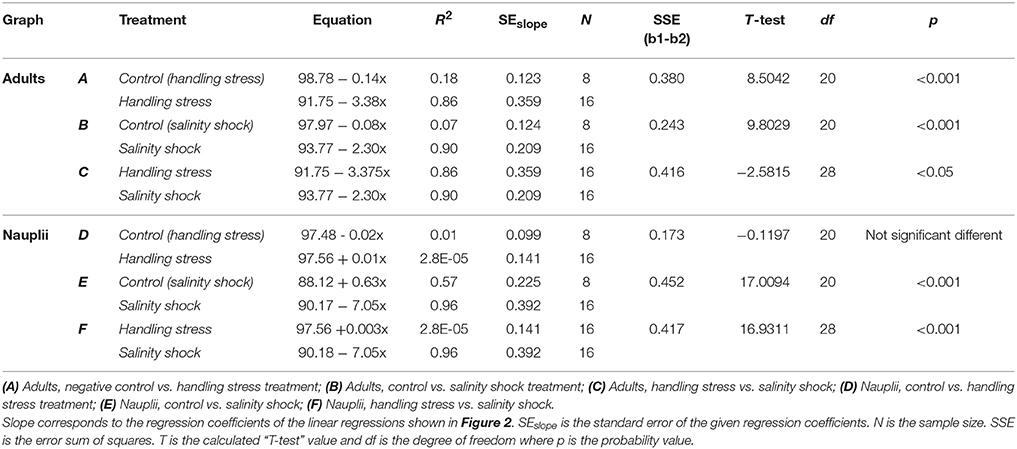
Table 1. T-test comparison of regression coefficients for linear regressions shown in Figure 2.
Adult individuals of A. tonsa were significantly affected both by salinity shock (p < 0.001) and handling stress (p < 0.001) for exposure up to 10 min (Figures 1A,B, Tables 1A,B) in comparison to the control, which exhibited survival of 98 ± 1% up to 10 min exposure time. Survival declined from 91 ± 2% after 25 s to 56 ± 7% after 10 min of exposure to handling stress. Survival declined in the salinity shock from 92 ± 1% after 25 s to 70 ± 5% after 10 min of exposure. Survival was higher when exposed to salinity shock than when exposed to handling stress, and a significant relation was found by regression analysis (p < 0.05, Figure 2C, Table 1C).
Survival of salinity shock and handling stress was estimated 24 h post 10 min of exposure. The control exhibited a survival of 99 ± 1%, salinity shock 47 ± 1% and handling stress 54 ± 2%. In the samples, with individuals exposed to handling stress, 34 ± 1% exhibited physical damage of the antennae, setae and antennules. Of the damaged individuals, 74 ± 3% were categorized as dead during staining. For the salinity shock samples, only 4 ± 3% exhibited damage, of which 53 ± 1% was categorized as dead.
De Novo Reference Transcriptome and Annotation
A total of ~225 million reads >50 bp in length (after quality trimming) was retained for reference transcriptome assembly. The de novo assembled transcriptome consisted of 60,688 contiguous consensus sequences (contigs) grouped into 27,171 Trinity components (“genes”) with a GC content of 38.49%. Statistics based on all transcript contigs had an N50 value of 1,874 bp, with an average contig length of 1,222.45 bp from for a total of 74,188,026 assembled bases (Table 2).
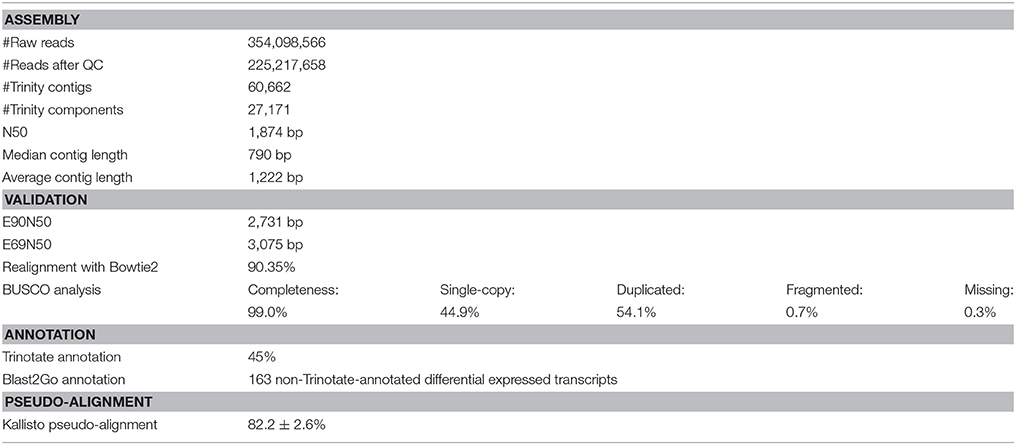
Table 2. Assembly, validation, annotation and pseudo-alignment statistics.
The quality of different Trinity transcriptome assemblies was evaluated using Bowtie2 for realignment of the reads to the reference, BUSCO evaluation of completeness, and E90N50 profiles of contig length (Table 2).
Of the reference input RNA sequencing reads realigned with Bowtie2, 90.35% were represented in the assembly of the chosen reference transcriptome (Table 2). The remaining unassembled reads, likely corresponded to low-expressed transcripts with insufficient coverage to enable assembly, was of low quality or resulted from aberrant reads.
Completeness of the transcriptome was examined by searching for single copy orthologs with 99.0% BUSCO scores. Results from 303 BUSCO groups searched were: single-copy: 44.9%; duplicated: 54.1%, fragmented: 0.7%; missing: 0.3% (Table 2).
The Ex90N50 transcript contig length of 2,731 bp was computed by combining Kallisto (ver. 0.43.0; Bray et al., 2016) and the ExN50 statistic script included in the Trinity package. Since N50 statistics discard read coverage, E90N50 gave an indication of whether deeper sequencing would result in higher quality assembly. The ExN50 profile peaked at N69, with a contig length of 3,075 bp (Table 2).
Considering the overall realignment, BUSCO profile, and ExN50 profile, we evaluated the reference transcriptome to be of acceptable quality for the differential gene expression analysis. The Trinotate annotation pipeline resulted in identification of 45% of the assembled Trinity transcripts (Table 2). The remaining 55% of unidentified transcripts were excluded from the differential gene expression analysis, after ensuring that the significantly differentially expressed transcripts could not be identified in any way (see Supplementary Material S4 for Sleuth analysis including unidentified transcripts.). The average pseudo-alignment of the experimental sample reads to the reference transcriptome using Kallisto was 82.2 ± 2.6% (mean ± SD) (Table 2).
From the Trinotate annotation, 80,047 Gene Ontologies (GO) and 24,463 Kyoto Encyclopedia of Genes and Genomes (KEGG) ontology (KO) terms were associated with the genes. It should be noted that multiple GO-terms could be assigned to the same gene. The GO-terms consisted (p < 0.05, FDR < 0.2) of 48% Biological Processes (BP), 30% Cellular Compartments (CC) and 22% Molecular Functions (MF) (see Supplementary Material S5 for all enriched GO terms).
Differentially Expressed Genes
The patterns of differential gene expression for copepods from the handling stress, salinity shock and control 15 min after exposure were not distinct in the Principal Component Analysis (PCA, Figure 3A). The control exhibited more distinct clustering from handling stress and salinity shock treatments 24 h after exposure (Figure 3B), suggesting that time following exposure has a significant effect on gene expression.
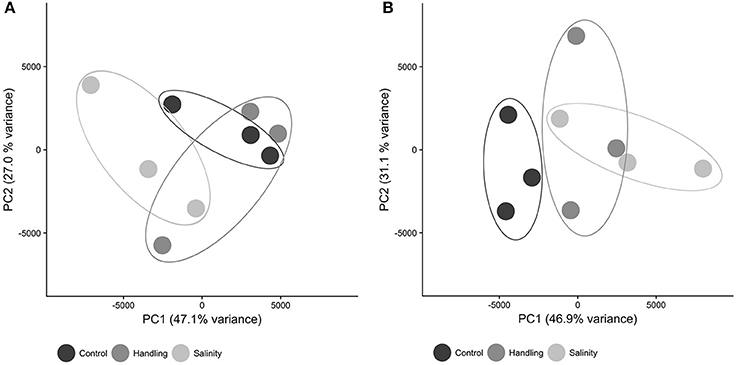
Figure 3. Principal component analysis (PCA) dimensions 1 and 2 of expression values for all contigs in each sample. Symbols are: control (black), handling stress (dark gray); salinity shock (light gray). (A) After 10 min; (B) After 24 h. PCA was computed in R using the Sleuth package.
Two differentially expressed genes (DEGs; q-value < 0.05), one up- and one down-regulated, were identified 15 min after exposure to handling stress (Figures 4, 5, Table 3; see Supplementary Material S1 for b-values; https://figshare.com/articles/S1a_Trinotate_Annotation_A_tonsa_xls/5928799/1). The up-regulated DEG (IPPK, Inositol-pentakisphosphate 2- had two enriched BPs: Melanosome transport and determination of left/right symmetry (Table 4); two CCs: Ciliary basal body and Centrosome (Table 4); one MF: Inositol pentakisphosphate 2-kinase activity (Table 4); and two KOs: Phosphatidylinositol signaling system and Inositol phosphate metabolism (Table 4). The down-regulated DEG (SIDT1, SID1 transmembrane family member 1) was enriched in dsRNA transport (BP, Table 4) and RNA trans-membrane transporter activity (MF, Table 4).
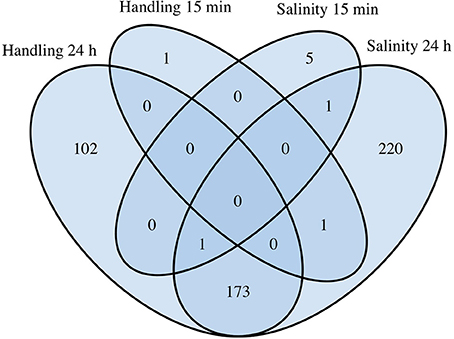
Figure 4. Comparative analysis of differentially expressed genes (DEGs) in Acartia tonsa exposed to 10 min handling stress or 10 min salinity shock after 15 min or 24 h. The Venn diagram was constructed from overlapping transcripts in R with the library VennDiagram (ver. 1.6.17).
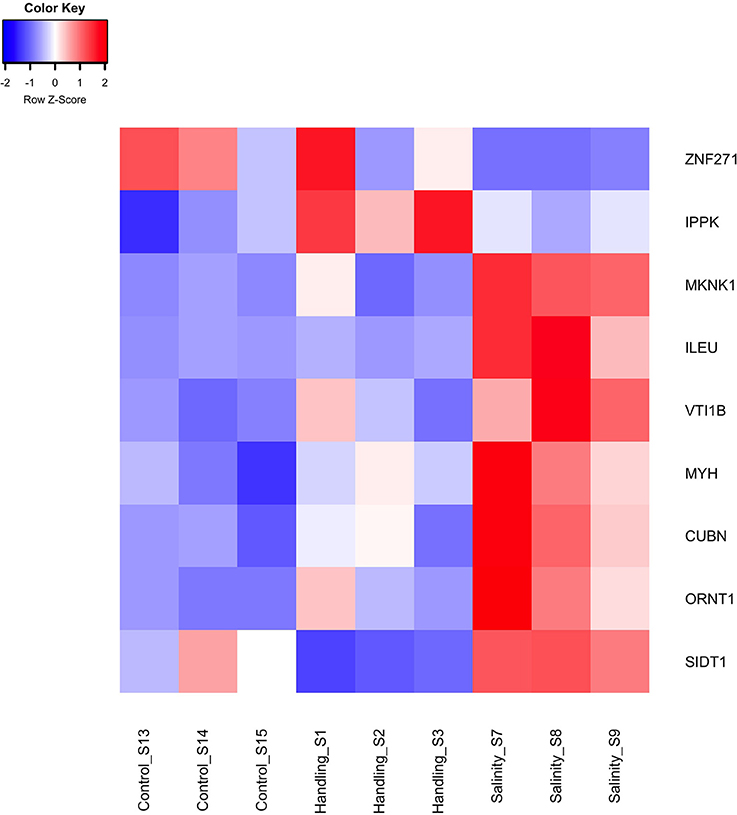
Figure 5. Heat map of differentially expressed genes (q < 0.05) for the handling stress and salinity shock treatments 15 min post exposure relative to the control. The color scale of transcript expressions is normalized as z-scores; up-regulated transcripts are red and down-regulated are blue. The heat map was generated in R using the library gplots (version 3.0.1).
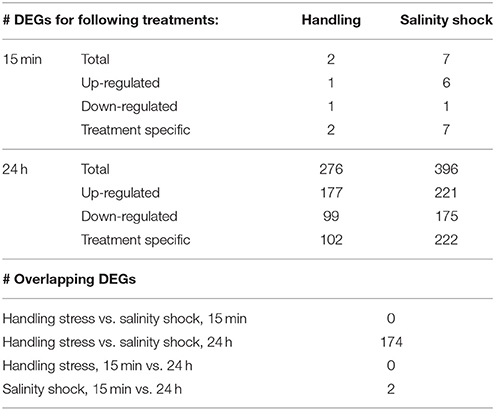
Table 3. Overview of the number (#) of differentially expressed genes (DEGs).
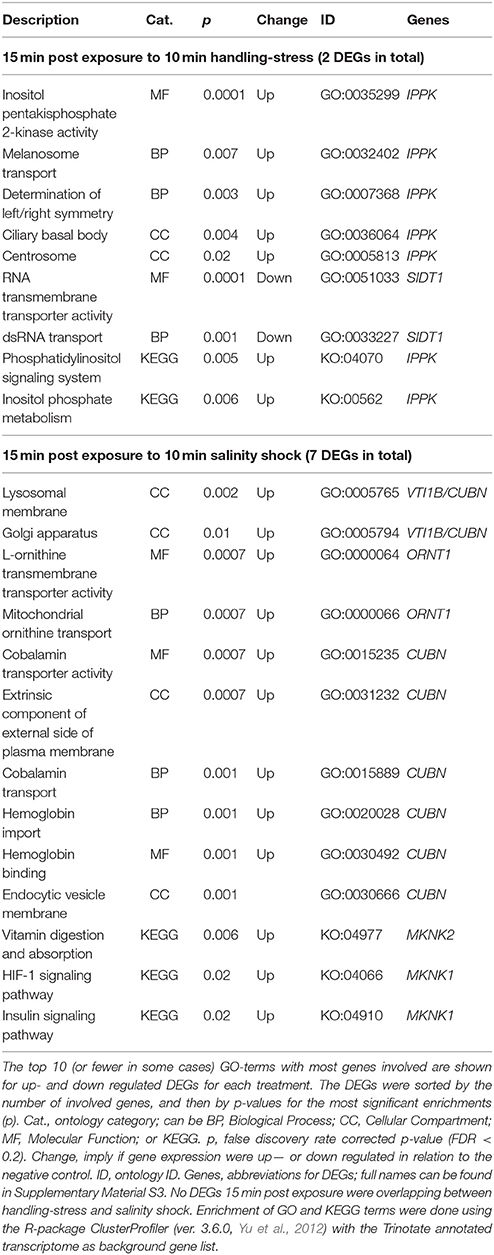
Table 4. Enriched gene ontology (GO) terms and Kyoto Encyclopedia of Genes and Genomes ontologies (KEGG, KO) for differentially expressed genes (DEGs) 15 min post exposure to handling-stress or salinity shock.
Handling stress resulted in 276 DEGs 24 h after exposure, of which 177 were up- and 99 down-regulated (Figures 4, 6, Table 3). None of the same DEGs were overlapping 15 min and 24 h after exposure. The salinity shock resulted in 7 DEGs (6 up- and 1 down-regulated) 15 min after exposure, which increased to 396 DEGs (221 up- and 175 down-regulated) 24 h after exposure (Figure 4, Table 3).
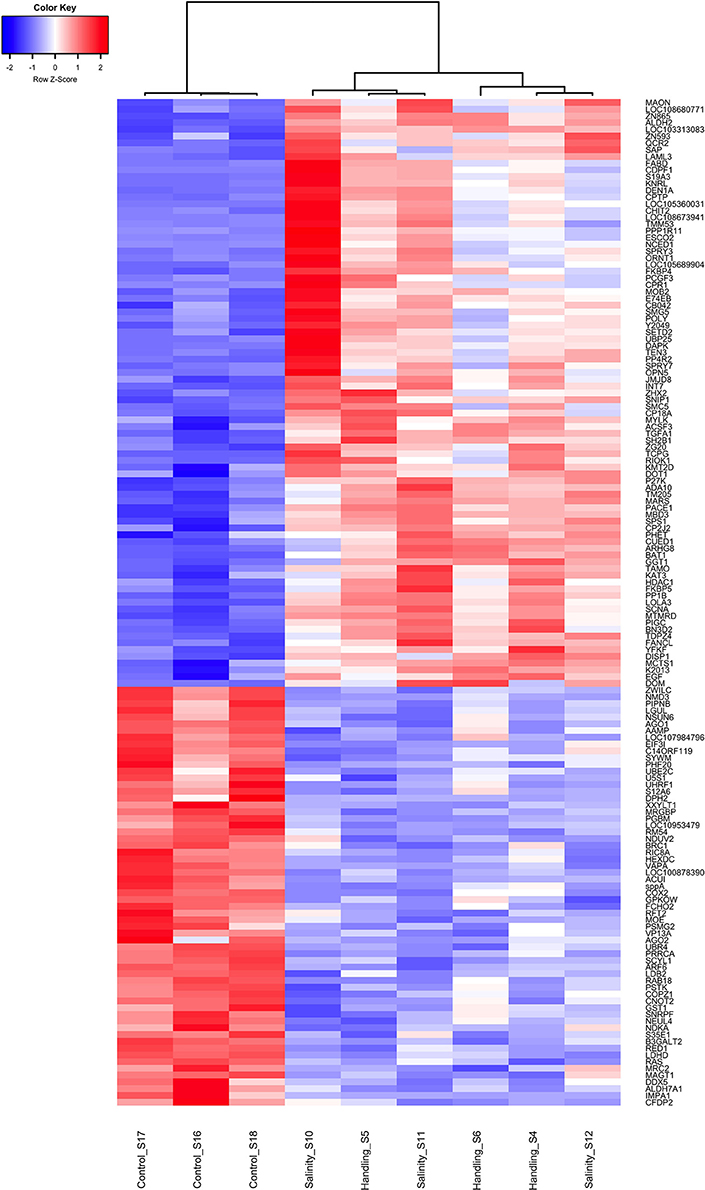
Figure 6. Heat map of overlapping differentially expressed genes (q < 0.05) for the handling stress and salinity shock treatments 24 h post exposure relative to the control. Similarities between samples are shown as a dendrogram, with hierarchical clustering based on Pearson correlation with complete distance determination. The color scale of transcript expressions is normalized as z-scores; up-regulated transcripts are red and down-regulated are blue. The heat map was generated in R using the library gplots (version 3.0.1).
Among the up-regulated DEGs 15 min after exposure to salinity shock, the majority of enriched GO-terms were transport mechanisms, especially related to ER homeostasis and proteins (see Supplementary Material S5 for the full list, Table 4 for top 10 of the GO-terms with most involved genes). The remainder of the enriched GO-terms were related to metabolic, homeostatic, and developmental processes (Table 4, Supplementary Material S5). The majority of these processes took place in the lysosomes (Table 4, Supplementary Material S5), Golgi apparatus (Table 4, Supplementary Material S5), and vesicles (Table 4, Supplementary Material S5). The three enriched KO-terms were related to signaling pathways and vitamin digestion and absorption (Table 4).
Two up-regulated DEGs (ORNT1, Ornithine Transporter 1; MYH, Myosin Heavy chain; Supplementary Material S1; https://figshare.com/articles/S1a_Trinotate_Annotation_A_tonsa_xls/5928799/1, Table 5) were overlapping 15 min and 24 h after exposure to salinity shock. ORNT was enriched in mitochondrial ornithine transport (BP, Table 4) taking place in the mitochondrial inner membrane (CC, Table 4), and related to two enriched MFs: L-ornithine transmembrane transporter activity and thiol-dependent ubiquitinyl hydrolase activity (Table 4).
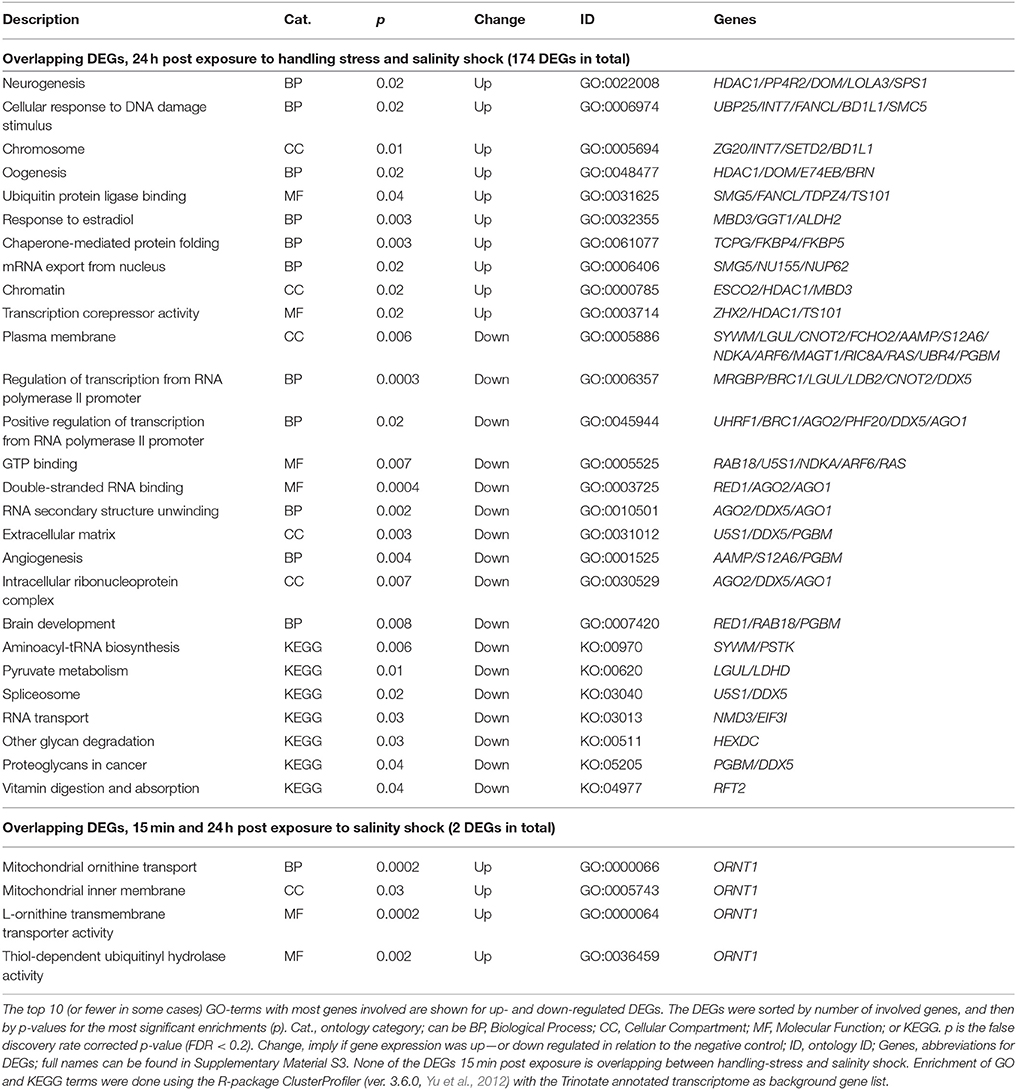
Table 5. Enriched gene ontology (GO) terms and Kyoto Encyclopedia of Genes and Genomes ontologies (KEGG, KO) for overlapping differentially expressed genes (DEGs) 24 h post exposure to handling-stress and salinity shock, as well as overlapping DEGs 15 min and 24 h post exposure to salinity shock.
The overlap between handling stress and salinity shock 24 h after exposure included 174 DEGs. For the overlapping 112 up-regulated DEGs, 223 GO-terms were enriched (see Supplementary Material S5 for the full list, Table 5 for top 10 of the GO-terms with most involved genes). No KO-terms were enriched. For the 62 down-regulated DEGs, 176 GO-, and 7 KEGG terms were enriched (Supplementary Material Table 5, Table 5).
The remaining non-overlapping 102 and 202 DEGs for handling stress and salinity shock 24 h post exposure, respectively, may be stressor-specific see Supplementary Material S5 for the full list, Table 6 for top 10 of the GO-terms with most involved genes). For the 65 up-regulated non-overlapping DEGs 24 h post exposure to handling, 151 GO and 3 KO-terms were enriched. The 37 down-regulated DEGs had 94 enriched GO and 12 KO terms (Supplementary Material S5, Table 6). For non-overlapping DEGs 24 h post exposure to salinity shock, 109 were up- and 113 were down-regulated. The up-regulated DEGs resulted in the enrichment of 173 GO and 8 KO terms, while the down-regulated DEGs resulted in 226 GO and 2 KO terms (Supplementary Material S5, Table 6).
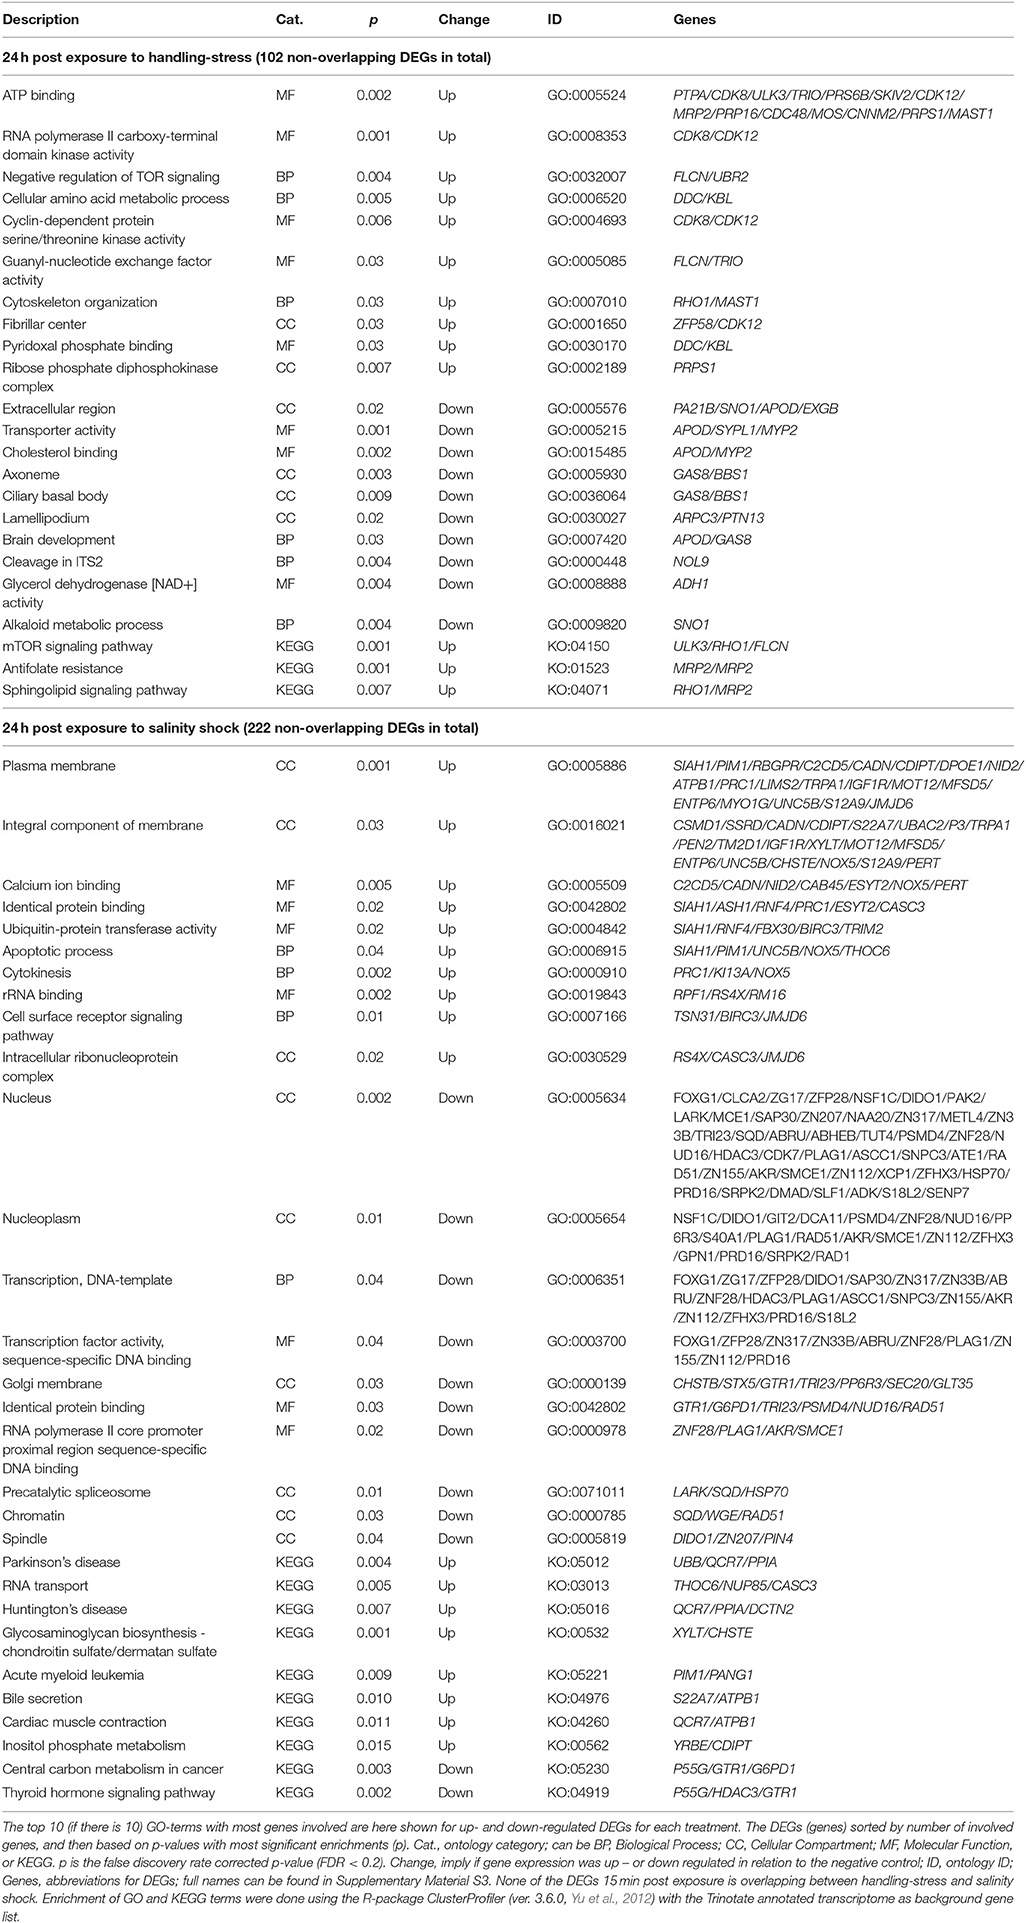
Table 6. Enriched gene ontology (GO) terms and Kyoto Encyclopedia of Genes and Genomes ontologies (KEGG, KO) for non-overlapping differential expressed genes (DEGs) 24 h post exposure to handling-stress and salinity shock.
Inclusion of the Trinity transcript identifications in the Sleuth analysis (Supplementary Material S4) resulted in 350 DEGs (244 up- and 106 down-regulated) for the handling stress treatment after 24 h. The salinity shock resulted in 573 annotated DEGs (376 up- and 197 down-regulated) 24 h after exposure.
Discussion
The results from our examination of transcriptome-wide responses and survival in relation to handling stress and salinity shock in A. tonsa clearly indicate that handling stress is a significant factor for experimental manipulation of this species. Failure to consider this parameter in, for instance, biomarker-related transcriptional studies is likely to lead to inaccurate interpretation of the stressors' impact.
The survival rates of the exposed nauplii were not affected by handling stress. This may be because of their small size and lack of fragile appendages, allowing a boundary layer of seawater to form around them as protection from physical interaction with the plankton net. Since handling stress did not negatively impact naupliar survival, we used only adult individuals of A. tonsa for the definitive experiments for RNA sequencing analysis. The use of adult females is most usual for copepod incubation experiments to obtain physiological rates (e.g., oxygen consumption, grazing, growth, and specific egg production) based on published results.
Adult copepod survival decreased by 44 ± 7% (mean ± SD) after 10 min exposure to handling stress. The average mortality reported by Jepsen et al. (2007) was 17 ± 1% per day, which was considered to result from handling stress in adult individuals of A. tonsa every 12 h during their study. In comparison, other studies have reported constant daily mortality ranging from 5 to 10% (Medina and Barata, 2004; Drillet et al., 2014; Nilsson et al., 2017). The observed handling stress effect on survival in the present study is considered very high and indicative of impacts of handling stress for adult individuals of A. tonsa. Handling of adult copepods should therefore be done carefully—and quickly—in order to minimize the imposed stress, in contrast to nauplii, which do not seem to be affected on survival.
In comparison to handling stress, salinity shock resulted in a slightly higher adult survival (29 ± 5%) after 10 min of exposure. Calliari et al. (2008) found that an abrupt reduction in salinity from S = 35 to S = 4 resulted in 31% decrease in survival, which is comparable to the decrease of 22–35% observed in the present study.
Survival 24 h after exposure to 10 min handling stress or salinity shock declined 45 ± 1.7% and 51 ± 1.6%, respectively. For handling stress, this was an additional decline of ~7% compared to 15 min post exposure. For the salinity shock, the post-exposure period of 24 h resulted in higher mortality than for handling stress, with an additional decline in survival of ~22%. This suggests that handling stress results in higher instant mortality than salinity shock, while salinity shock is more lethal over an extended post-exposure period. Part of the instant mortality may be due to the physical damages (i.e., broken antennae) observed for about one-third of the individuals, most of which were categorized as dead. In addition to the elevated mortality, the higher number of DEGs suggests that salinity shock is more stressful than handling.
In order to replicate the impact of “collection stress” and laboratory handling stress on A. tonsa, it was important to establish a baseline for copepods that were not exposed to handling stress. Since this is the first study examining impacts of handling stress at the transcriptome-wide level, there is no available information on the time course of the copepods' responses after handling stress. To avoid this as a bias in our experiments, we cultured A. tonsa from eggs to the desired life-stages in ideal culture conditions without disturbing the copepods.
For field studies, it is often impossible to know how long the copepods may have been in contact with a plankton net during collection and before preservation (e.g., Mack et al., 2012). According to the field guide by Goswami (2004), it is recommended to collect zooplankton by towing a plankton net at slow speed (1.5–2.0 knots) for 5–10 min. Additional collection time is used in recovering the plankton net and handling the copepods for different experimental purposes. The mortality of field-collected copepods, however, has been shown to range from 0 to 90% based on direct observation and 13–37% based on neutral red staining (Elliott and Tang, 2009). This is within the range of the survival decrease observed in the present study (44 ± 7%) and suggests that observed mortality in field-collected copepods may be the result of handling stress. For laboratory studies, copepods are usually exposed to plankton net screens for shorter periods. But often other tools used for transferring copepods, such as pipettes and tweezers, may also result in physical damage and stress.
Based on the observed mortalities, we chose the exposure time of 10 min for each stressor, which is within the range of handling time described in published studies, although sufficient to ensure that we would induce a transcriptional response (Elliott and Tang, 2009; Mack et al., 2012).
An additional source of uncertainty regarding responses at the transcriptional level was the impact of the length of time post-exposure before preservation for analysis.
We found only two (1 up- and 1 down-regulated) and seven (6 up- and 1 down-regulated) DEGs 15 min after exposure to handling stress and salinity shock, respectively (Figure 5, Table 3). None of these DEGs were in common between the treatments or have previously been used as transcriptional biomarkers. Handling stress resulted in 276 DEGs and salinity shock in 396 DEGs 24 h after exposure. Of these, 174 DEGs (112 up- and 62 down-regulated) were overlapping. The up-regulated expression of these genes may provide general protection against multiple stressors. However, the time period following exposure clearly had significant impact on whether there was a detectable and measureable stress response.
The one up-regulated DEG 15 min after exposure to handling, Inositol-Pentakisphosphate 2-Kinase (IPPK), was assigned two BPs (melanosome transport and determination of left/right symmetry). IPPK in yeast is involved in the transcriptional regulation of responses to environmental and nutritional changes; in plants, it is involved in stress signaling, and in mouse embryonic development (e.g., Tsui and York, 2010). The role of IPPK is thus very diverse among species and therefore the enriched BPs seems difficult to explain. In A. tonsa, the early up-regulation of IPPK may indicate its role in initiating a transcriptional response to handling stress.
The gene product of the down-regulated SID1 Transmembrane Family Member 1 (SIDT1) is involved in RNA-interference (RNAi), by transporting dsRNA across cellular membranes (e.g., Whangbo et al., 2017). The down-regulation suggests that gene silencing of RNAi inhibited genes are being removed, which allows transcription.
The majority of enriched GO terms for up-regulated DEGs 15 min post exposure to salinity were related to protein transport, Endoplasmic Reticulum (ER), and protein homeostasis. This is an indication of ER stress, which typically induces the unfolded protein response (UPR) in order to improve the imbalance between protein load and folding capacity of the ER (Hori et al., 2006; Hetz and Papa, 2017).
Enrichment of GO terms related to metabolic processes indicated the need for cellular energy and is in agreement with the observation by Calliari et al. (2006) that A. tonsa modulates its energy balance in relation to salinity stress. The enrichment of vitamin digestion and absorption (KO, Table 4) for MAP kinase-interacting serine/threonine protein kinase 2 (MAPK) could reflect a need for energy. However, MAPK is also induced in response to environmental stress as a part of a signaling cascade, hence the two signaling pathways in Table 4 (Waskiewicz, 1997).
The KEGG enrichment was done using general KEGG Ontology (KO) terms, which are related to the usual model organisms, human and mouse. The enriched terms and the actual functions may therefore differ in relation to copepods.
Five of the overlapping DEGs 24 h post exposure to handling stress and salinity shock were enriched for the BP, neurogenesis. These include Histone deacetylase 1 (HIDAC1), serine/threonine-protein phosphatase 4 regulatory subunit 2 (PP4R2), helicase domino (DOM), longitudinals lacking protein (LOLA3) and selenide water dikinase (SPS1). Even though they are enriched in the GO-term, neurogenesis, it is noteworthy that only LOLA3 is directly linked to neurogenesis (e.g., Goeke et al., 2003). The gene product resulting from HIDAC1 is mainly a regulator of gene expression for other genes responsible for histone de-acetylation (e.g., Kelly and Cowley, 2013). DOM is, like HIDAC1, also responsible for transcriptional regulation by chromatin remodeling (Sif, 2004). Especially HIDAC1 is also enriched for terms related to chromatin remodeling, like chromatin (CC) and transcription corepressor activity (MF). PP4R2 has functional roles in cell development, differentiation, apoptosis, tumor progression and DNA-repair (e.g., Shui et al., 2007; Nakada et al., 2008; Liu et al., 2012).
In addition to being enriched in GO-terms related to transcriptional regulation, oogenesis is enriched for HDAC1, DOM, Ecdysone-induced protein 74EF isoform B (E74EB) and beta-1,3-galactosyltransferase BRN (BRN). Both E74EF and BRN are involved in oogenesis (Goode et al., 1996; Paul et al., 2005). When exposed to stressful conditions, energy of an individual tends to be reallocated from fecundity and growth to survival mechanisms (López-Maury et al., 2008; de Nadal et al., 2011). Thus, egg production of copepods decreases when the surrounding environment is sub-optimal (Calliari et al., 2006; Peck and Holste, 2006). The up-regulation of oogenesis may indicate that homeostasis in A. tonsa has been restored to such extent that there is energy for egg production.
Even though fecundity-related mechanisms were enriched for up-regulated overlapping DEGs 24 h post exposure to handling stress and salinity shock, stress related mechanisms were also present among the enriched GO-terms (Table 5, Supplementary Material S5). This includes cellular response to DNA damage stimulus, ubiquitin protein ligase binding and chaperone-mediated protein folding (Table 5).
Heat shock proteins (hsps), especially heat shock protein 70 kDa (hsp70), have been frequently used as a transcriptional indicator of stress in copepods (Voznesensky et al., 2004; Tartarotti and Torres, 2009; Lauritano et al., 2011, 2016; Nilsson et al., 2013; Chan et al., 2014; Petkeviciute et al., 2015; Aguilera et al., 2016; Smolina et al., 2016; Rahlff et al., 2017). We found significant, but small, down-regulation of hsp70 in response to salinity shock 24 h after exposure (Supplementary Material S1; https://figshare.com/articles/S1a_Trinotate_Annotation_A_tonsa_xls/5928799/1). Heat shock cognate 71 kDa (hsc70), which is a member of the hsp70 family, was slightly up-regulated for handling stress and salinity shock 24 h after exposure (Supplementary Material S1; https://figshare.com/articles/S1a_Trinotate_Annotation_A_tonsa_xls/5928799/1). Aruda et al. (2011) found that the heat shock proteins, hsp70a, hsp21, and hsp22, had significantly higher expression 3 h after handling with a plankton net, but did not find any significant differences 2 h after exposure. Rahlff et al. (2017) found significant changes in expression of hsp70 in response to handling, which was reduced to negligible levels after 24 h. These prior studies suggest that the expression of hsp70 peaks within 24 h after stress exposure, and may explain why we did not observe an increase in expression level of this gene 24 h after handling stress. Hsp70 responses in relation to other stressors (e.g., temperature) seem to be in agreement with this explanation. Petkeviciute et al. (2015) found a 63.8-fold increase in hsp70 transcripts for A. tonsa after 45 min exposure to 30°C. This corresponds with the findings of Rahlff et al. (2017), where a heat shock of 28°C for 3 h resulted in significant up-regulation of hsp70, which was measurable after 30 min and peaked with a 185-fold increase after 1.5 h. A smaller peak of 60.4-fold increase remained 4 h after the heat shock (Rahlff et al., 2017). The peak in hsp70 expression that occurred a few hours after exposure, which subsequently declined, could explain our findings. In general, the expression levels observed here were low, implying that hsp70 and a number of other genes may show peak up-regulation within 24 h after exposure to stressors.
The down-regulated hsp70 24 h post exposure to salinity was enriched for the nucleus (CC, Table 6), precatalytic spliceosome (CC, Table 6), presynapse (Supplementary Material S5), late endosomal microautophagy (BP, Supplementary Material S5), cellular response to topologically incorrect protein (BP, Supplementary Material S5), and perichromatin fibrils CC, Supplementary Material S5). Many of these terms are stress-related, and could have included additional GO-terms that are relevant in relation to hsp70 “chaperone mediated protein folding” and “de novo protein folding” (Supplementary Material S5).
It is noteworthy that aldehyde-dehydrogenases (ALDH2 and ALDH7A1), ubiquitin, and related genes (e.g., UBP25, FANCL, UBR2, UBR4, UBE2C, Table 5, Supplementary Material S1; https://figshare.com/articles/S1a_Trinotate_Annotation_A_tonsa_xls/5928799/1, Supplementary Material Table 5), which have been used in copepods as transcriptional biomarkers, are among the overlapping DEGs 24 h post exposure to handling stress or salinity shock (e.g., Lauritano et al., 2011, 2016). Biomarkers should, thus, be carefully selected to avoid artifacts caused by handling stress in the analysis of gene expression.
In summary, handling stress clearly affects both biomarkers and transcriptome-wide patterns of differential gene expression of A. tonsa, and these stress responses probably take place within 24 h after exposure to a stressor. Some of the differentially expressed genes were in common between the handling stress and salinity shock treatments, suggesting that these may play an important role in protection against multiple stressors. Due to the small, but significant differences in expression levels of some of the commonly used biomarkers, these genes should be used with caution in stress-related studies, since they potentially peak within 24 h after exposure.
The limited response at the transcriptional level 15 min following exposure to handling stress suggests that organisms collected in plankton tows of short duration and immediately used in incubation experiments or being preserved are likely to exhibit transcriptional profiles that represent their in situ physiological state (e.g., Häfker et al., 2017). It is, however, important to be aware of that handling has the potential to affect gene expression regardless of animal species. Thus, handling should therefore be considered as a factor when examining stress at the transcriptional level.
Data Availability
RNA-Seq data available in the NCBI Sequence Read Archive with the bio-project accession number PRJNA407266.
Author Contributions
BN, PJ, AB, and BH conceived the study; BN, PJ, AB, and BH designed the experiments; BN, PJ, and AB collected and analyzed the data; BN wrote the paper; BN, PJ, AB, and BH contributed substantially to interpreting the data and developing the manuscript, and take full responsibility for the content of the paper.
Funding
This work was supported by the Villum Foundation [Project AMPHICOP no. 8960, to BH].
Conflict of Interest Statement
The authors declare that the research was conducted in the absence of any commercial or financial relationships that could be construed as a potential conflict of interest.
Acknowledgments
We thank Bo Reese and Lu Li at the Institute for Systems Genomics - Center for Genome Innovation (CGI) at the University of Connecticut (Storrs, CT, USA), for assistance and guidance in RNA-Seq data generation. Vijender Singh and Jill L. Wegrzyn at the Institute for Systems Genomics - Computational Biology Core (CBC) at the University of Connecticut (Storrs, CT, USA) provided bioinformatics support.
Supplementary Material
The Supplementary Material for this article can be found online at: https://www.frontiersin.org/articles/10.3389/fmars.2018.00156/full#supplementary-material
References
Aguilera, V. M., Vargas, C. A., Lardies, M. A., and Poupin, M. J. (2016). Adaptive variability to low-pH river discharges in Acartia tonsa and stress responses to high PCO2 conditions. Mar. Ecol. 37, 215–226. doi: 10.1111/maec.12282
Amiard-Triquet, C., and Berthet, B. (2015). “Individual Biomarkers,” in Aquatic Ecotoxicology, eds C. Amiard-Triquet, J.-C. Amiard, and C. Mouneyrac (London: Elsevier), 153–182. doi: 10.1016/B978-0-12-800949-9.00007-3
Andrews, S. (2010). FastQC: A Quality Control Tool for High Throughput Sequence Data. FastQC a Quality Control tool high throughput Sequence data. Available online at: http://www.bioinformatics.babraham.ac.uk/projects/fastqc
Aruda, A. M., Baumgartner, M. F., Reitzel, A. M., and Tarrant, A. M. (2011). Heat shock protein expression during stress and diapause in the marine copepod Calanus finmarchicus. J. Insect Physiol. 57, 665–675. doi: 10.1016/j.jinsphys.2011.03.007
Ashburner, M., Ball, C. A., Blake, J. A., Botstein, D., Butler, H., Cherry, J. M., et al. (2000). Gene Ontology: tool for the unification of biology. Nat. Genet. 25, 25–29. doi: 10.1038/75556
Bairoch, A., and Apweiler, R. (1999). The SWISS-PROT protein sequence data bank and its supplement TrEMBL in 1999. Nucleic Acids Res. 27, 49–54. doi: 10.1093/nar/27.1.49
Beaugrand, G. (2009). Decadal changes in climate and ecosystems in the North Atlantic Ocean and adjacent seas. Deep. Res. Part II 56, 656–673. doi: 10.1016/j.dsr2.2008.12.022
Berggreen, U., Hansen, B., and Kiørboe, T. (1988). Food size spectra, ingestion and growth of the copepod Acartia tonsa during development: implications for determination of copepod production. Mar. Biol. 99, 341–352. doi: 10.1007/BF02112126
Bolger, A. M., Lohse, M., and Usadel, B. (2014). Trimmomatic: a flexible trimmer for Illumina sequence data. Bioinformatics 30, 2114–2120. doi: 10.1093/bioinformatics/btu170
Bray, N. L., Pimentel, H., Melsted, P., and Pachter, L. (2016). Near-optimal probabilistic RNA-seq quantification. Nat. Biotechnol. 34, 525–527. doi: 10.1038/nbt.3519
Calliari, D., Andersen Borg, M. C., Thor, P., Gorokhova, E., and Tiselius, P. (2008). Instantaneous salinity reductions affect the survival and feeding rates of the co-occurring copepods Acartia tonsa Dana and A. clausi Giesbrecht differently. J. Exp. Mar. Bio. Ecol. 362, 18–25. doi: 10.1016/j.jembe.2008.05.005
Calliari, D., Andersen, C., Thor, P., Gorokhova, E., and Tiselius, P. (2006). Salinity modulates the energy balance and reproductive success of co-occurring copepods Acartia tonsa and A. clausi in different ways. Mar. Ecol. Prog. Ser. 312, 177–188. doi: 10.3354/meps312177
Cervetto, G., Gaudy, R., and Pagano, M. (1999). Influence of salinity on the distribution of Acartia tonsa (Copepoda, Calanoida). J. Exp. Mar. Biol. Ecol. 239, 33–45. doi: 10.1016/S0022-0981(99)00023-4
Chan, C., Pankey, S., and Kelly, M. (2014). Identifying the gene(s) that allow Tigriopus californicus to survive under thermal stress. Can. Young Sci. J. 2014, 18–23. doi: 10.13034/cysj-2014-025
Chinnery, F. E., and Williams, J. A. (2004). The influence of temperature and salinity on Acartia (Copepoda: Calanoida) nauplii survival. Mar. Biol. 145, 733–738. doi: 10.1007/s00227-004-1354-2
Davies, I. M., and Vethaak, D. (2012). “Integrated marine environmental monitoring of chemicals and their effects,” in International Council for the Exploration of the Sea, 1st edn. ed E. D. Anderson (Copenhagen), 315:277.
de Nadal, E., Ammerer, G., and Posas, F. (2011). Controlling gene expression in response to stress. Nat. Rev. Genet. 12, 833–845. doi: 10.1038/nrg3055
Drillet, G., Rais, M., Novac, A., Jepsen, P. M., Mahjoub, M.-S., and Hansen, B. W. (2014). Total egg harvest by the calanoid copepod Acartia tonsa (Dana) in intensive culture - effects of high stocking densities on daily egg harvest and egg quality. Aquac. Res. 46, 3028–3039. doi: 10.1111/are.12459
Elliott, D. T., and Tang, K. W. (2009). Simple staining method for differentiating live and dead marine zooplankton in field samples. Limnol. Oceanogr. Methods 7, 585–594. doi: 10.4319/lom.2009.7.585
Finn, R. D., Mistry, J., Tate, J., Coggill, P., Heger, A., Pollington, J. E., et al. (2010). The Pfam protein families database. Nucleic Acids Res. 38, D211–D222. doi: 10.1093/nar/gkp985
Fotedar, S., and Evans, L. (2011). Health management during handling and live transport of crustaceans: a review. J. Invertebr. Pathol. 106, 143–152. doi: 10.1016/j.jip.2010.09.011
Goeke, S., Greene, E. A., Grant, P. K., Gates, M. A., Crowner, D., Aigaki, T., et al. (2003). Alternative splicing of lola generates 19 transcription factors controlling axon guidance in Drosophila. Nat. Neurosci. 6, 917–924. doi: 10.1038/nn1105
Goode, S., Melnick, M., Chou, T. B., and Perrimon, N. (1996). The neurogenic genes egghead and brainiac define a novel signaling pathway essential for epithelial morphogenesis during Drosophila oogenesis. Development 122, 3863–3879.
Goswami, S. (2004). Zooplankton Methodology, Collection & Identification - A Field Manual, 1st Edn., eds V. K. Dhargalkar and X. N. Verlecar Dona Paula (Goa: National Institute of Oceanography). Available online at: http://drs.nio.org/drs/handle/2264/95.
Götz, S., García-Gómez, J. M., Terol, J., Williams, T. D., Nagaraj, S. H., Nueda, M. J., et al. (2008). High-throughput functional annotation and data mining with the Blast2GO suite. Nucleic Acids Res. 36, 3420–3435. doi: 10.1093/nar/gkn176
Grabherr, M. G., Haas, B. J., Yassour, M., Levin, J. Z., Thompson, D. A., Amit, I., et al. (2011). Full-length transcriptome assembly from RNA-Seq data without a reference genome. Nat. Biotechnol. 29, 644–652. doi: 10.1038/nbt.1883
Guillard, R. R., and Ryther, J. H. (1962). Studies of marine planktonic diatoms. I. Cyclotella nana Hustedt, and Detonula confervacea (cleve) Gran. Can. J. Microbiol. 8, 229–239. doi: 10.1139/m62-029
Haas, B. J., Papanicolaou, A., Yassour, M., Grabherr, M., Blood, P. D., Bowden, J., et al. (2013). De novo transcript sequence reconstruction from RNA-seq using the Trinity platform for reference generation and analysis. Nat. Protoc. 8, 1494–1512. doi: 10.1038/nprot.2013.084
Häfker, N. S., Meyer, B., Last, K. S., Pond, D. W., Hüppe, L., and Teschke, M. (2017). Circadian clock involvement in zooplankton diel vertical migration. Curr. Biol. 27, 2194.e3–2201.e3. doi: 10.1016/j.cub.2017.06.025
Hansen, K. D., Brenner, S. E., and Dudoit, S. (2010). Biases in Illumina transcriptome sequencing caused by random hexamer priming. Nucleic Acids Res. 38, e131–e131. doi: 10.1093/nar/gkq224
Hetz, C., and Papa, F. R. (2017). The unfolded protein response and cell fate control. Mol. Cell 69, 169–181. doi: 10.1016/j.molcel.2017.06.017
Holste, L., and Peck, M. A. (2006). The effects of temperature and salinity on egg production and hatching success of Baltic Acartia tonsa (Copepoda: Calanoida): a laboratory investigation. Mar. Biol. 148, 1061–1070. doi: 10.1007/s00227-005-0132-0
Hori, O., Miyazaki, M., Tamatani, T., Ozawa, K., Takano, K., Okabe, M., et al. (2006). Deletion of SERP1/RAMP4, a component of the Endoplasmic Reticulum (ER) translocation sites, leads to ER stress. Mol. Cell. Biol. 26, 4257–4267. doi: 10.1128/MCB.02055-05
Jepsen, P. M., Andersen, N., Holm, T., Jørgensen, A. T., Højgaard, J. K., and Hansen, B. W. (2007). Effects of adult stocking density on egg production and viability in cultures of the calanoid copepod Acartia tonsa (Dana). Aquac. Res. 38, 764–772. doi: 10.1111/j.1365-2109.2007.01730.x
Kanehisa, M., Goto, S., Sato, Y., Furumichi, M., and Tanabe, M. (2012). KEGG for integration and interpretation of large-scale molecular data sets. Nucleic Acids Res. 40, D109–D114. doi: 10.1093/nar/gkr988
Kelly, R. D. W., and Cowley, S. M. (2013). The physiological roles of histone deacetylase (HDAC) 1 and 2: complex co-stars with multiple leading parts. Biochem. Soc. Trans. 41, 741–749. doi: 10.1042/BST20130010
Kwok, K. W. H., Souissi, S., Dur, G., Won, E.-J., and Lee, J.-S. (2015). “Copepods as references species in estuarine and marine waters,” in Aquatic Ecotoxicology, eds C. Amiard-Triquet, J.-C. Amiard, and C. Mouneyrac (London: Elsevier), 281–308. doi: 10.1016/B978-0-12-800949-9.00012-7
Lance, J. (1964). The salinity tolerances of some estuarine planktonic crustaceans. Biol. Bull. 127, 108–118.
Langmead, B., and Salzberg, S. L. (2012). Fast gapped-read alignment with bowtie 2. Nat. Methods 9, 357–359. doi: 10.1038/nmeth.1923
Lauritano, C., Borra, M., Carotenuto, Y., Biffali, E., Miralto, A., Procaccini, G., et al. (2011). Molecular evidence of the toxic effects of diatom diets on gene expression patterns in copepods. PLoS ONE 6:e26850. doi: 10.1371/journal.pone.0026850
Lauritano, C., Romano, G., Roncalli, V., Amoresano, A., Fontanarosa, C., Bastianini, M., et al. (2016). New oxylipins produced at the end of a diatom bloom and their effects on copepod reproductive success and gene expression levels. Harmful Algae 55, 221–229. doi: 10.1016/j.hal.2016.03.015
Liu, J., Xu, L., Zhong, J., Liao, J., Li, J., and Xu, X. (2012). Protein phosphatase PP4 is involved in NHEJ-mediated repair of DNA double-strand breaks. Cell Cycle 11, 2643–2649. doi: 10.4161/cc.20957
López-Maury, L., Marguerat, S., and Bähler, J. (2008). Tuning gene expression to changing environments: from rapid responses to evolutionary adaptation. Nat. Rev. Genet. 9, 583–593. doi: 10.1038/nrg2398
Mack, H. R., Conroy, J. D., Blocksom, K. A., Stein, R. A., and Ludsin, S. A. (2012). A comparative analysis of zooplankton field collection and sample enumeration methods. Limnol. Oceanogr. Methods 10, 41–53. doi: 10.4319/lom.2012.10.41
McCarthy, S. D., Dugon, M. M., and Power, A. M. (2015). “Degraded” RNA profiles in Arthropoda and beyond. PeerJ 3:e1436. doi: 10.7717/peerj.1436
Medina, M., and Barata, C. (2004). Static-renewal culture of Acartia tonsa (Copepoda: Calanoida) for ecotoxicological testing. Aquaculture 229, 203–213. doi: 10.1016/S0044-8486(03)00389-2
Nakada, S., Chen, G. I., Gingras, A. C., and Durocher, D. (2008). PP4 is a γH2AX phosphatase required for recovery from the DNA damage checkpoint. EMBO Rep. 9, 1019–1026. doi: 10.1038/embor.2008.162
Nilsson, B., Jakobsen, H. H., Stief, P., Drillet, G., and Hansen, B. W. (2017). Copepod swimming behavior, respiration, and expression of stress-related genes in response to high stocking densities. Aquac. Rep. 6, 35–42. doi: 10.1016/j.aqrep.2017.03.001
Nilsson, B., Jepsen, P. M., Rewitz, K., and Hansen, B. W. (2013). Expression of hsp70 and ferritin in embryos of the copepod Acartia tonsa (Dana) during transition between subitaneous and quiescent state. J. Plankton Res. 36, 513–522. doi: 10.1093/plankt/fbt099
Paul, R. K., Takeuchi, H., Matsuo, Y., and Kubo, T. (2005). Gene expression of ecdysteroid-regulated gene E74 of the honeybee in ovary and brain. Insect Mol. Biol. 14, 9–15. doi: 10.1111/j.1365-2583.2004.00524.x
Peck, M. A., and Holste, L. (2006). Effects of salinity, photoperiod and adult stocking density on egg production and egg hatching success in Acartia tonsa (Calanoida: Copepoda): optimizing intensive cultures. Aquaculture 255, 341–350. doi: 10.1016/j.aquaculture.2005.11.055
Petkeviciute, E., Kania, P. W., and Skovgaard, A. (2015). Genetic responses of the marine copepod Acartia tonsa (Dana) to heat shock and epibiont infestation. Aquac. Rep. 2, 10–16. doi: 10.1016/j.aqrep.2015.04.001
Pimentel, H., Bray, N. L., Puente, S., Melsted, P., and Pachter, L. (2017). Differential analysis of RNA-seq incorporating quantification uncertainty. Nat. Methods 14, 687–690. doi: 10.1038/nmeth.4324
Powell, S., Szklarczyk, D., Trachana, K., Roth, A., Kuhn, M., Muller, J., et al. (2012). eggNOG v3.0: orthologous groups covering 1133 organisms at 41 different taxonomic ranges. Nucleic Acids Res. 40, D284–D289. doi: 10.1093/nar/gkr1060
Rahlff, J., Peters, J., Moyano, M., Pless, O., Claussen, C., and Peck, M. A. (2017). Short-term molecular and physiological responses to heat stress in neritic copepods Acartia tonsa and Eurytemora affinis. Comp. Biochem. Physiol. A Mol. Integr. Physiol. 203, 348–358. doi: 10.1016/j.cbpa.2016.11.001
R Core Team (2017). R Core Team. R: A Language and Environment for Statistical Computing. Vienna: R Foundation for Statistical Computing. Available online at: https://www.R-project.org/
Shui, J.-W., Hu, M. C.-T., and Tan, T.-H. (2007). Conditional knockout mice reveal an essential role of protein phosphatase 4 in thymocyte development and pre-T-cell receptor signaling. Mol. Cell. Biol. 27, 79–91. doi: 10.1128/MCB.00799-06
Sif, S. (2004). ATP-dependent nucleosome remodeling complexes: enzymes tailored to deal with chromatin. J. Cell. Biochem. 91, 1087–1098. doi: 10.1002/jcb.20005
Simão, F. A., Waterhouse, R. M., Ioannidis, P., Kriventseva, E. V., and Zdobnov, E. M. (2015). BUSCO: assessing genome assembly and annotation completeness with single-copy orthologs. Bioinformatics 31, 3210–3212. doi: 10.1093/bioinformatics/btv351
Smolina, I., Harmer, R., Lindeque, P., and Hoarau, G. (2016). Reduced up-regulation of gene expression in response to elevated temperatures in the mid-Atlantic population of Calanus finmarchicus. J. Exp. Mar. Bio. Ecol. 485, 88–93. doi: 10.1016/j.jembe.2016.09.003
Sokal, R. R., and Rohlf, F. J. (1995). Biometry: The Principles and Practice of Statistics in Biological Research, 3rd Edn. Washington, DC: W.H. Freeman and Company.
Støttrup, J. G., Richardson, K., Kirkegaard, E., and Pihl, N. J. (1986). The cultivation of Acartia tonsa Dana for use as a live food source for marine fish larvae. Aquaculture 52, 87–96. doi: 10.1016/0044-8486(86)90028-1
Tartarotti, B., and Torres, J. J. (2009). Sublethal stress: impact of solar UV radiation on protein synthesis in the copepod Acartia tonsa. J. Exp. Mar. Biol. Ecol. 375, 106–113. doi: 10.1016/j.jembe.2009.05.016
Tsui, M. M., and York, J. D. (2010). Roles of inositol phosphates and inositol pyrophosphates in development, cell signaling and nuclear processes. Adv. Enzyme Regul. 50, 324–337. doi: 10.1016/j.advenzreg.2009.12.002
Turner, J. T. (2004). The importance of small pelagic planktonic copepods and their role in pelagic marine food webs. Zool. Stud. 43, 255–266.
Uye, S., and Kuwata, H. (1983). Size separation of copepods by sieving. J. Oceanogr. Soc. Japan 39, 136–140. doi: 10.1007/BF02070800
Voznesensky, M., Lenz, P. H., Spanings-Pierrot, C., and Towle, D. W. (2004). Genomic approaches to detecting thermal stress in Calanus finmarchicus (Copepoda: Calanoida). J. Exp. Mar. Bio. Ecol. 311, 37–46. doi: 10.1016/j.jembe.2004.04.017
Waskiewicz, A. J. (1997). Mitogen-activated protein kinases activate the serine/threonine kinases Mnk1 and Mnk2. EMBO J. 16, 1909–1920. doi: 10.1093/emboj/16.8.1909
Whangbo, J. S., Weisman, A. S., Chae, J., and Hunter, C. P. (2017). SID-1 domains important for dsRNA i mport in Caenorhabditis elegans. Genes Genomes Genet. 7, 3887–3899. doi: 10.1534/g3.117.300308
Keywords: stress, handling, salinity, Acartia tonsa, copepod, RNA sequencing, environmental monitoring
Citation: Nilsson B, Jepsen PM, Bucklin A and Hansen BW (2018) Environmental Stress Responses and Experimental Handling Artifacts of a Model Organism, the Copepod Acartia tonsa (Dana). Front. Mar. Sci. 5:156. doi: 10.3389/fmars.2018.00156
Received: 21 February 2018; Accepted: 16 April 2018;
Published: 14 May 2018.
Edited by:
Menghong Hu, Shanghai Ocean University, ChinaCopyright © 2018 Nilsson, Jepsen, Bucklin and Hansen. This is an open-access article distributed under the terms of the Creative Commons Attribution License (CC BY). The use, distribution or reproduction in other forums is permitted, provided the original author(s) and the copyright owner are credited and that the original publication in this journal is cited, in accordance with accepted academic practice. No use, distribution or reproduction is permitted which does not comply with these terms.
*Correspondence: Birgitte Nilsson, YmhhbnNlbkBydWMuZGs=