 Masada Tzabari
 Danielle Mayer Mayron
 David Iluz
 Zvy Dubinsky2
 Carynelisa Haspel
- 1Atmospheric Sciences, Fredy and Nadine Herrmann Institute of Earth Sciences, The Hebrew University of Jerusalem, Jerusalem, Israel
- 2The Mina and Everard Goodman Faculty of Life Sciences, Bar-Ilan University, Ramat Gan, Israel
- 3Department of Environmental studies and Agriculture, Beit-Berl College, Kfar Saba, Israel
Light polarization characteristics, i. e., degree of linear polarization (DoLP) and angle of linear polarization (AoLP), were documented in the depth of the littoral cave system of Rosh HaNikra on the northern Mediterranean shore of Israel (33° 5′ 35.24″ N, 35° 6′ 17.16″ E), based on light intensity sampled through polarizing filters at different hours of the day on different days of the year. This is the first study to investigate the state of light polarization in such a unique habitat in which photosynthetic organisms, such as cyanobacteria, microalgae, and macroalgae thrive. Such organisms play an essential ecological role as the energy base for the cave's fauna. Using these two methods, we found unique winter polarization characteristics within the cave, including high values of DoLP in the morning and at noon, reaching 50%, and nearly constant AoLP throughout the day. Given the low levels of light intensity that typically exist within the cave in the winter months, the relatively high DoLP and the nearly constant AoLP throughout the day may play a significant role in improving the ability of photosynthetic organisms within the cave to harvest light by orienting their light-harvesting receptors with respect to the AoLP. Using the polarization photograph analysis method, we were able to determine the polarization characteristics originating from the sky, reflection off of (including refraction into followed by refraction out of) the far sea surface, and reflection off of the cave wall separately. The maximum DoLP values originating from the sky, far ocean, and cave walls were found to be 27, 50, and 35%, respectively. The lowest daily variation in AoLP was that of light reflecting off the cave walls. The present study lays the foundation for any subsequent study of the role of light polarization in the distribution of the algal flora on the cave walls in and out of the water in the Rosh HaNikra cave and in sea caves in general.
Introduction
One of the main factors controlling the distribution of epilithic algae within mid-littoral caves is light (Mayer et al., 2016; Mayer, 2017). Therefore, characterizing the unique properties of the light that enters such caves is essential to understanding the distribution of the algae there.
The main trajectories of light reaching the algae within littoral cave systems consist of (a) sky light directly entering the cave opening, (b) light reflecting off of the ocean surface and propagating into the cave opening, (c) light refracting into the ocean and reemerging from the ocean surface and then propagating into the cave opening, and (d) light that has already entered the cave opening reflecting off of the cave walls. Each one of these paths causes a unique shift in the light spectrum.
The polarization property of electromagnetic radiation refers to the directionality of its plane of vibration, on which the electric field (E-vector) vibrates as the electromagnetic waves propagate in space. In addition to the intensity and frequency of light, the polarization of light is a significant source of information that can help to trace the path of the light from its origin to the point of measurement. As with the light spectrum, the polarization of light may be altered by different manners of interaction with matter, such as scattering, reflection, refraction, absorption, and transmission. Rayleigh (single) scattering in particular has a strong influence on the polarization of light, creating completely polarized light at a scattering angle of 90° (see, e.g., Schwind and Horvath, 1993; Pomozi et al., 2001). Reflection and refraction are also polarizing processes, since both are dependent on the orientation of the plane of vibration of the light wave with respect to the plane of incidence (as described by the Fresnel equations, assuming a smooth dielectric interface, Hecht, 1987).
Midlittoral cave systems are a unique habitat for cyanobacteria, microalgae, and macroalgae, which play an essential ecological role in the upper littoral zone of the cave. Within the littoral cave system, relative humidity is consistently high, which prevents desiccation, to the advantage of the survival and growth of epilithic algae. However, light flux may decrease rapidly as a function of the distance from the cave opening, which is a limiting factor on both the quantity and diversity of algal communities.
Different photosynthetic organisms use various techniques, such as light regulation mechanisms (e.g., Dubinsky and Stambler, 2009), to cope with both damage from high light intensities and low light limitation conditions, termed photoacclimation. It has been shown that photosynthetic organisms can adjust their own orientation and situation or their chloroplast orientation in order to optimize the light harvesting and photosynthetic efficiency of their cells (Foster and Smyth, 1980; Dubinsky, 1992; Wada et al., 1993; Takagi, 2003; Iluz and Dubinsky, 2015). Along with the intensity and spectral distribution of light, the polarization of light has also been found to affect cell and chloroplast orientation (Etzold, 1965; Zurzycki, 1967; Haupt, 1982; Hader, 1987; Kagawa and Wada, 1995). Studies have shown that chloroplasts, thylakoids, and phycobilisomes may have dichroitic polarized absorption properties, due to pigment orientation (Goedheer, 1955; Breton et al., 1973; Haworth et al., 1982; Frackowiak et al., 1985, 1986; Gagliano et al., 1985). The probability of a chloroplast absorbing a photon of light is a function of the orientation of the axis of the chloroplast with respect to the predominant E-vector of the light. When completely unpolarized light is incident, there is at most a 50% probability of the chloroplast absorbing the light. At the opposite extreme, when completely linearly polarized light is incident, the probability of the chloroplast absorbing the light potentially increases to 100% if the axis of the chloroplast is aligned with the E-vector. Thus, when photosynthetic organisms with capabilities of chloroplast orientation adjustment encounter a partially polarized light setting, the probability of their absorption of light increases in proportion to the percent polarization.
The limitation of photosynthesis caused by low light conditions has motivated measurements of the light intensity, photon flux, and illuminance in various low light boundary ecosystems. In studies of cave microbiology, measurements of light irradiance and photon flux gradients within caves and their relation to the algal distribution within the caves have been presented (Vinogradova et al., 1998; Pentecost and Zhaohui, 2001; Mulec et al., 2008; Martinez and Asencio, 2010; Mulec and Kubesova, 2010; Coombes et al., 2015; Mayer, 2017). Such studies generally indicate a significant decrease in both the quantity and diversity of photosynthetic communities with decreasing photon flux to a boundary below which only specific species can exist, mostly types of cyanobacteria, chlorophyta, and red algae. However, to the best of our knowledge, to date there have been no similar studies conducted with respect to the polarization properties of the ambient light in ecosystems such as caves.
While studies of the polarization properties within caves have not previously been conducted, a good number of studies on light polarization patterns in nature in general and the effects such patterns have on the surrounding ecosystem in general and on the polarization-sensitive species in particular have been conducted (See, e.g., Waterman, 1954; Brines and Gould, 1982; Horvath and Varju, 2004; Cronin and Marshall, 2011). These studies have characterized the polarization patterns in the sky and under water, which constitute tools for navigation, and how the polarization patterns vary with latitude, aerosol and hydrosol particle diversity, particle size distribution (including algal blooms), cloud coverage, and turbulence under water (Cronin and Shashar, 2001; Gal et al., 2001; Pomozi et al., 2001; Shashar et al., 2004; Hegedüs et al., 2007; Sabbah and Shashar, 2007). It has also been shown that insects with polarization sensitivity detect water bodies via the polarization contrast between the water and its surroundings and may be affected by anthropogenic sources of polarization such as asphalt roads (Kriska et al., 1998). Given this, it is reasonable to believe that the unique light setting of cave environments will present unique polarization patterns to the ecosystems present there.
In the current study, we document the polarization characteristics within the Rosh HaNikra mid-littoral cave (Israel), based on light intensity sampled through polarizing filters at different hours of the day on different days of the year, as well as differences in the polarization characteristics among the frequency bands of red, green, and blue light. We use two independent methods of determination, a spectrophotometer method which produces the net polarization properties of the light reaching the receptor, and a photograph analysis method, which allows us to separate between polarization properties of light propagating from three different regions, the sky, the far ocean, and the cave walls.
Given that the characterization of light polarization properties in cave ecosystems should play an important part in understanding the full biophysical picture of such ecosystems, the current study lays the groundwork for future research in this important field. We emphasize that the research presented here has been conducted from a physical point of view, and therefore more biological examinations should be conducted in future studies in order to verify the biological implications of the current study.
Methods
Study Site Description
The limestone mid-littoral cave of Rosh HaNikra is situated on the northern border of Israel's east Mediterranean coast. It was formed through the invasion of the ocean into a karst littoral cave system, which had developed in a pre-quaternary era along a fracture (Almagor and Perath, 2012). The cave system consists of two main sections, which connect in the depth of the cave (Figure 1). More than 10 known openings lead into the system, some of which are sub-marine, at between 3 and 5-m depth beneath the sea surface. The maximum distance that the cave penetrates inland is nearly 200 m in the south pointing section.
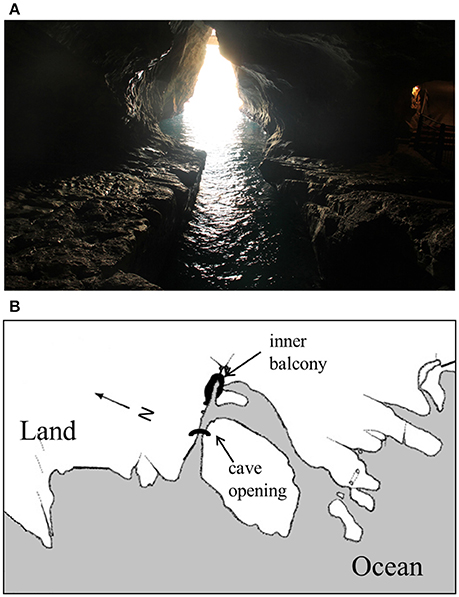
Figure 1. (A) The measuring view, i.e., the view of the cave opening as seen from the inner balcony. (B) A map of Rosh HaNikra grottoes, which shows the geographical set-up of the cave opening and inner balcony, and land-ocean boundaries at sea level (adapted from Sela, 1973).
Light intensities within the depth of the cave are reported by Mayer (2017). According to Mayer (2017), the values of light intensity reach a maximum of nearly 40 μmol· m−2· s−1 in July in the late afternoon, when the sun's course crosses nearest to the opening of the cave, allowing maximal direct illumination, while the values of light intensity reach a maximum of only 9 μmol· m−2· s−1 in the winter months. It is important to note that all of the values of light intensity values measured within the depth of the cave are significantly lower than (less than 5% of) the intensity of light measured outside of the cave. Furthermore, it is important to note that at the times of the measurements presented in the current study, no direct sunlight reached our instruments, i.e., the sun crossed near the opening of the cave in August in the late afternoon but was never positioned exactly at the opening of the cave.
Polarization Measurements
The degree of linear polarization (DoLP) and angle of linear polarization (AoLP) were measured at the inner balcony noted on the cave map (see Figure 1), which is located near the deepest end of the cave system. The direction of all measurements is toward the western cave opening (see Figure 1), i.e., at an azimuthal angle of ~270°. From this viewing position and viewing angle, the cave opening is at a distance of ~50 m from the sensors.
Stokes formalization for linear polarization (Kattawar, 1994) was used, in which the components of the Stokes vector S={I,Q,U}are given by Equation (1):
In Equation (1), I0, I45, and I90 are the values of light intensity filtered through a linear polarizer with its axis oriented vertically, 45°From the vertical, and horizontally, respectively. The components of the Stokes vector are measured at each frequency or in each frequency band separately. The values of DoLP and AoLP are calculated from the components of the Stokes vector according to Equations (2, 3) below, respectively (Kattawar, 1994):
Spectrophotometer Method
In the spectrophotometer method, measurements of I0, I45, and I90 were recorded for a full spectrum of wavelengths between 200 and 1,100 nm, at intervals of 0.27 nm, using the Ocean Optics HR 4000 portable spectrophotometer with software by Spectrasuite (Ocean Optics, Inc.) and filtered through a linear polarizing filter oriented in three different directions, respectively, as described above. A SMA 905 connector and a single-strand long optical fiber probe, as specified by Foster et al. (2017), were used. The numerical aperture of the fiber optic-based probe is 0.22, which corresponds to an angular field of view of ~25.4°. This angular range of the probe excludes the nearest 10 m of the sea surface.
In addition to the full spectra of DoLP and AoLP in the region of photosynthetic active radiation (PAR), DoLP, and AoLP values corresponding to red, green, and blue (RGB) color bands, respectively, were calculated. This RGB calculation enables at least a qualitative comparison of the spectrometer measurements with the photograph image analysis results. To obtain the DoLP and AoLP for the RGB color bands, the Stokes vector for each band was calculated by summing the measured intensity weighted by the spectral sensitivity of the Canon D60 camera (Jiang et al., 2013) to red, green, or blue light, respectively, over the wavelengths (λ) of the respective band (see the section Polarization Photograph Analysis Method below). For wavelengths to which the camera is more sensitive, the spectrophotometer intensities are up-weighted accordingly, while for wavelengths at which the camera is less sensitive, the intensities are down-weighted accordingly. For instance, for the red color band, I0, I45, and I90 were calculated in the following manner:
giving I0sumred, I45sumred, and I90sumred, then I, Q, and U were calculated from I0sumred, I45sumred, and I90sumred according to Equation (1), giving Isumred, Qsumred, and Usumred, and finally, the DoLP and AoLP were calculated according to Equations (2, 3), i.e.,
The AoLP was set to give values in the range of −90° to 90° with respect to the vertical direction, which we define to be AoLP = 0° (as in Horvath and Varju, 1997).
Measurements from the spectrophotometer method are presented for the hours of 10:00, 12:00, 14:00, and 16:00 local time for each of 4 days, November 12th (UTC+2), 2015; February 14th (UTC+2), 2016; April 10th (UTC+3), 2016; and August 10th (UTC+3), 2016.
Polarization Photograph Analysis Method
In the polarization photograph analysis method, in order to obtain the values of I0, I45, and I90, respectively, each measurement consisted of a color photograph taken through the same linear polarizer, oriented vertically, oriented 45°From the vertical axis, and then oriented horizontally, as described above. The camera was situated in the depth of the cave pointing toward the cave opening. RGB values were recorded for each pixel of the scene, and these were converted to intensity values in order to apply Stokes formalism to calculate the DoLP and AoLP, respectively. The conversion from RGB values to intensity is based on the definition of RGB, as follows.
RGB is an array of three values between 0 and 255, which represent the relative intensity of red, green, and blue light, respectively, in a given pixel. For instance, a value of R = 200 in a given pixel indicates that the intensity of red light recorded in that pixel is 200/255 times the maximal intensity of red light that the red sensor in that pixel is able to detect. Since both the numerator and denominator of the expressions in Equations (2, 3) are some fraction of the maximal intensity, the maximal intensity drops out of the calculations of DoLP and AoLP, and we may simply use the R values from each pixel as the values of I0, I45, and I90 in Equations (2, 3), respectively, for red light. Likewise, the G and B values from each pixel can be used as the values of I0, I45, and I90 in Equations (2, 3), respectively, for green and blue light, respectively.
The camera aperture and exposure time were kept constant for each data set. The Stokes vector, DoLP, and AoLP values were then calculated for each pixel, for the red, green, and blue values separately, creating for each a two-dimensional image (map) of DoLP and AoLP for the scene. Since the sky, the far sea surface, and the cave walls occupy different sections of the images (see the section Results and Discussion below), the two-dimensional images provide a means to visually inspect the different contributions of the various physical mechanisms in a qualitative manner, i.e., in the sky section, we see mainly the effects of direct radiation from the sun and scattering by the atmosphere, in the far sea surface section, we see the combined effect of reflection off of the far sea surface and refraction into and reemergence from the far sea surface, and in the cave wall sections, we see the effect of reflection off of the cave walls. The fact that the two-dimensional images provide only a qualitative picture is important to keep in mind particularly with respect to reflection off of the cave walls, since the relative error in the polarization values obtained for individual pixels is highest in the areas with the lowest light intensity values (refer to Results, Polarization Photograph Method, Two-Dimensional Maps of DoLP and AoLP).
From the initial two-dimensional images produced, it was found that a single exposure time was not sufficient to give accurate intensities in all areas of the images, and thus two different exposure times were employed. The polarization of light from high intensity light sources (light entering the cave opening directly from the atmosphere or after interaction with the ocean) was determined from images obtained using a shorter exposure time (1/2000 s), in which there is “darkness saturation” in the cave wall sections of the image, whereas the polarization of light reflected off the cave walls was determined from images obtained using a longer exposure time (1/100 s), in which there is “light saturation” in the high intensity sections of the image. These saturation effects can be seen in the images of the I-component of the Stokes vector, shown in Figure 2.
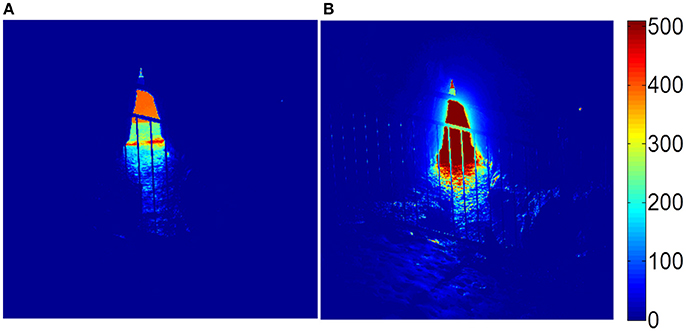
Figure 2. Images of the I-component of the Stokes vector from the cave opening using (A) short exposure, and (B) long exposure. The units are arbitrary.
We note that near ocean surface effects cannot be evaluated by this method due to the constant motion of the water between the photographs. (Likewise, as mentioned above, near ocean surface effects were not captured with the spectrophotometer method). This is unfortunate since the “flashing light” of the near ocean surface may have a substantial effect on microalgae photosynthesis and growth, as has been shown (Abu-Ghosh et al., 2015); we recommend using a polarization camera in future efforts to investigate the influence of the motion of the water in the near ocean on the polarization field within such a cave.
To evaluate the total contributions of the sky, the far ocean, and the cave walls, respectively, to the polarization field, and not just pixel-by-pixel, we also calculated the Stokes vector, the DoLP, and the AoLP, summing the values of I0, I45, and I90 , over all of the pixels in each section of the photograph, respectively. We call the resulting DoLP and AoLP the “mean DoLP” and the “mean AoLP” for each of the three sections of the image. However, it should be kept in mind that these mean values are not obtained by averaging the DoLP and AoLP over the pixels that comprise each of the three sections, but are rather more like weighted averages calculated by summing the components of the Stokes vector, respectively, over the pixels that comprise each of the three sections, and then applying (Equations 2, 3) to the resulting total Stokes vector for each of the three sections, respectively. As opposed to the polarization values in the original two-dimensional images, which we relate to qualitatively, the mean DoLP and mean AoLP are more robust quantitative measures of polarization, with a much lower relative error than the error associated with intensity values in individual pixels, especially low light intensity pixels.
Measurements from the polarization photograph analysis method are presented for the hours of 10:00, 12:00, 14:00, and 16:00 local time for each of 3 days, February 14th (UTC+2, daylight savings time), 2016; April 10th (UTC+3), 2016; and August 10th (UTC+3), 2016.
Results and Discussion
As mentioned above, we use two independent methods to determine the polarization properties of light in the cave. The spectrophotometer method gives the net polarization of the light reaching the receptor, allowing us to estimate the overall polarization to which algae at the specific location of the receptor are exposed. The polarization photograph analysis method, on the other hand, gives an indication of the relative contribution of different areas of the field of view (the sky, the ocean, and the cave walls) to the net polarization and consequently allows us to analyze how different geographical settings may affect the pattern of light polarization within such caves. We note that the polarization values obtained using these two methods are not directly comparable, since the net polarization in the cave is not a simple combination of polarization values in individual pixels, but rather depends on the intensity of light in each pixel and the solid viewing angle of each area.
Spectrophotometer Method
DoLP
The DoLP values as obtained using the spectrophotometer method are presented in Figures 3, 4. The full spectrum DoLP is presented in Figure 3. The dates of the measurements are indicated along the upper horizontal axes of each panel, and the time of measurement is indicated by the color legend. In addition, the absorption spectra of a few main pigments present in the photosynthetic organisms within the caves are overlaid for reference. The pigments presented (reviewed by Takaichi, 2013; Mayer, 2017) are chlorophyll a [which is dominant in cyanobacteria and green algae and present also in red algae; as obtained by Li (1997), As appears in PhotoChemCAD database Prahl (2012)], chlorophyll b [which is dominant in green algae and present in cyanobacteria; as obtained by Taniguchi (2001), As appears in PhotoChemCAD database Prahl (2012)], and phycoerythrin and phycocyanin [which are both dominant in red algae and cyanobacteria; as reviewed by McNamara et al. (2006), and the Arizona Spectra Database Utzinger (2011); we show here the spectra for R-phycoerythrin (RPE) and allophycocyanin (AP)].
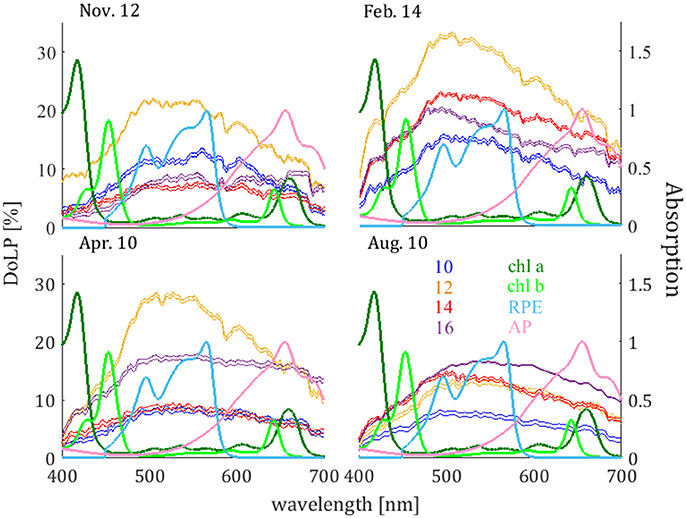
Figure 3. DoLP as obtained from the spectrophotometer method on November 12th 2015, February 14th, 2016, April 10th, 2016, and August 10th, 2016. The dates of each measurement are indicated along the horizontal axis. The time of each measurement is indicated by the color legend. Absorption spectra of chlorophyll a, chlorophyll b, R-phycoerythrin (R-PE), and allophycocyanin (AP), are indicated in the color legend.
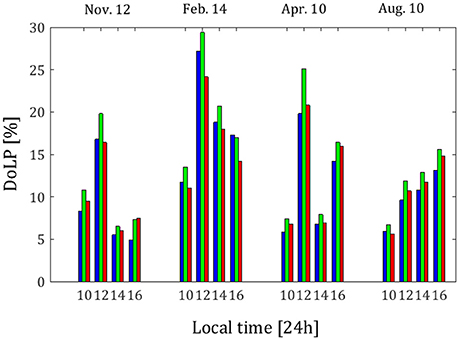
Figure 4. DoLP as obtained from the spectrophotometer method on November 12th 2015, February 14th, 2016, April 10th, 2016, and August 10th, 2016. The dates and time of day of each measurement are indicated along the horizontal axis. From each measurement, weighted values from blue, green and red wavebands are presented (each in its own color).
The weighted DoLP values are presented in Figure 4. The dates and hours of each measurement are indicated along the upper and lower horizontal axes, respectively. The different wavebands are indicated by the bar color (each in its own color).
From Figures 3, 4, one can see that the DoLP from most of the spectrophotometer measurements is highest in the green band (centered at ~540 nm). Since the DoLP is inversely related to the intensity (refer to Equation 2), this is in agreement with the findings of Mayer (2017), who measured light intensity in the same location and found that the relative decrease in intensity of green light with respect to the intensity at the cave opening is higher than the decrease in intensity of red and blue light. Though, as mentioned in the Introduction, mechanisms such as scattering, reflection, refraction, absorption, and transmission influence the polarization of light, no single mechanism for polarizing light mentioned here acts uniquely on green wavelengths of light. Therefore, this difference between wavebands is likely due to a combination of mechanisms (see more on this below).
From Figure 3, though the wavelengths of maximum DoLP values do not coincide with the wavelengths of maximum absorbance by chlorophyll a or chlorophyll b, the polarization can still be significant at the wavelengths of maximum absorbance of these pigments, as can be seen in the case of the February 14th measurements. The positions of the absorption peaks of chlorophyll b appear to provide species containing chlorophyll b with a higher potential for utilizing the light's polarization properties than species containing chlorophyll a.
From Figure 3, the pigment phycoerythrin appears to be even more advantageous, with high values of absorbance over a wide range of wavelengths that include high values of DoLP. This may be particularly advantageous to cyanobacteria and red algae, which contain phycoerythrin (Gagliano et al., 1985). The presence of cyanobacteria and red algae in low-light cave areas has been documented in various cave surveys (Friedmann, 1964; Mulec and Kosi, 2008; Lamprinou et al., 2009; Martinez and Asencio, 2010; Cennamo et al., 2012), and the population of cyanobacteria tends to be more dominant as the intensity of light decreases. Cyanobacteria are known to be able to regulate the flux of light into their cells, exhibiting motion toward or away from light, clustering for shade, or separating from one another in order to escape shade. Such capabilities give cyanobacteria an advantage over other species under low-light conditions. However, the inner structure of cyanobacteria cells can provide even more of an advantage under low-light conditions. The pigments phycoerythrin and phycocyanin are essentially biliprotein contained within phycobilisomes, which are the protein complexes responsible for capturing photosynthetic light in both cyanobacteria and red algae. Cyanobacteria have prokaryotic structure, in which there is no defined chloroplast, and consequently the thylakoids and phycobilisomes are suspended in the cell plasma, giving the phycobilisomes a higher degree of freedom of motion. The freedom of motion of the phycobilisomes within cyanobacteria cells allow the cyanobacteria the additional possibility of orienting their phycobilisomes to the dominant AoLP direction under partially polarized (or fully polarized) light conditions. Red (and green) algae, on the other hand, have eukaryotic structure, in which there is a defined chloroplast to which the phycobilisomes are confined. Nevertheless, though the phycobilisomes are confined to the chloroplast in red algae, red algae may orient their entire cell in order to align their chloroplast to the dominant E-vector direction under partially polarized (or fully polarized) light conditions. Moreover, the amount of phycoerythrin within red algae varies, and this variation is responsible for the large range of color that red algae exhibit, from bright red, to greenish-red, to black; we speculate that in addition to adjusting the orientation of their cells, red algae could also increase the amount of phycoerythrin in their cells in response to low-light conditions.
Although the wavelength of maximum absorbance of the pigment phycocyanin (655 nm) is not within the region of high DoLP, phycocyanin has a wide waveband of relatively high absorbance which ranges into the high DoLP region, and thus we suggest that phycocyanin may also be advantageous to species such as cyanobacteria and red algae under low-light conditions. Mulec et al. (2008) observed a change in chlorophyll a and phycocyanin concentrations within the cells of the cyanobacteria Chroococcus minutus as a function of PAR light flux (their Figure 1), after a cultivation period of 25 days within the Postojnska Cave. Under low light intensities (~<10 μmol · m−2 · s−1), they found that the concentration of chlorophyll a decreases rapidly, while that of phycocyanin increases and can reach concentration values that are higher than those of chlorophyll.
From Figure 4, the values of DoLP throughout the day in the February 14th measurements are higher than the values of DoLP throughout the day from the other measurement dates. This finding is important, because, as mentioned above, it supports the idea that the polarization of the light in the caves can be an advantage to the photosynthetic algae under conditions in which the absolute intensity of light is low, as they are in February. (Data on the light intensity are presented in Mayer, 2017).
From Figure 4, the maximal value of DoLP of 29% occurs near 12:00 local time in February, the closest measurement to exact solar noon. Although the solar elevation is not maximal at 12:00 local time, the angle between the direction of the sun, the horizon as viewed from the caves, and the viewer is consistently near 90° at this hour. [See Figure 5, in which the solar zenith angle (squares) and the solar azimuthal angle (stars) as obtained from the NOAA Solar Calculator (http://www.esrl.noaa.gov/gmd/grad/solcalc/azel.html; last access date 4/5/2018), as well as the sun-horizon-viewer angles for all of the measurements in the current study (diamonds) are presented]. Thus, a high DoLP near 12:00 local time is consistent with the polarization field that results from Rayleigh scattering of light in the atmosphere, which reaches highest values at a scattering angle of 90° from the sun (Schwind and Horvath, 1993; Pomozi et al., 2001).

Figure 5. Solar zenith angle (squares), solar azimuth angle (stars), and the sun-horizon (as viewed from the caves)-viewer angle (diamonds), for all times of the polarization measurements. The solid horizontal lines indicate the angle of 270°, which is the direction of the cave opening, the angle of 90°, at which the DoLP due to Rayleigh scattering is maximum, and the angle of 53.23°, at which the solar zenith angle equals Brewster's angle for an air-water interface.
In the August measurements, the DoLP value grows steadily throughout the day, reaching a maximum at 16:00 local time rather than at 12:00 local time. At 16:00 local time in the August measurements, the sun is positioned closest to the cave opening as viewed from the balcony (see Figure 5; the star for 16:00 local time in the August measurements is closest to the horizontal line indicating 270°). This position of the sun contributes a high percentage of light reflected off of the ocean surface and of light reemerging from the ocean after refraction straight into the cave opening. In addition, the solar zenith angle at this time is 45°, relatively close to the Brewster angle of water (Figure 5; the square for 16:00 local time in the August measurements is closest to the horizontal line indicating 53.23°), which reinforces the contribution of reflection off of the ocean surface to the polarization field.
On November 12th and April 10th, there are two maxima in DoLP, one at 12:00 local time and one at 16:00 local time (Figure 4), indicating that the signatures of both Rayleigh scattering by the atmosphere and reflection and refraction by the ocean are detectable in the polarization field measured within the cave in these months.
AoLP
The weighted values of AoLP as obtained by the spectrophotometer method are presented in Figure 6. The dates and hours of the measurements are indicated, as in Figure 4. We do not present the wavelength dependence of AoLP, since it is relatively constant, with less than a 10° variation over nearly the entire spectrum. However, it is important to note that as a result of this relatively weak dependence, if a photosynthetic organism is able to orient its thylakoids with respect to such a relatively constant AoLP, this would maximize the absorption by all the pigments simultaneously.
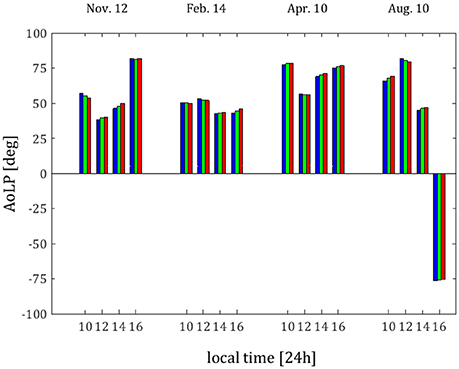
Figure 6. AoLP as obtained from spectrophotometer method on November 12th, 2015, February 14th, 2016, April 10th, 2016, and August 10th 2016. The dates and time of day of each measurement are indicated along the horizontal axis. From each measurement, weighted values from blue, green, and red wavebands are presented (each in its own color).
From Figure 6, the different measurements exhibit different E-vector tendencies. On November 12th and April 10th, the AoLP varies similarly to the solar zenith angle (the squares in Figure 5). On February 14th, the AoLP is nearly constant throughout the day. On August 10th, there is a wide variation in the AoLP; this is most likely due to the length of the summer day during which the angular position of the sun varies greatly between measurements. Note that the Rayleigh-sky AoLP has an asymmetric pattern, in which the asymmetry axis is defined through the solar azimuth (Schwind and Horvath, 1993; Pomozi et al., 2001). Variation in solar azimuthal angle rotates this axis, while variation in the solar zenith angle affects the E-vector distribution. A similar variation in the AoLP in the summer can be seen in the measurements of sky polarization in Tunisia (~36°49′08″N 10°09′56″E) conducted by Pomozi et al. (2001).
The relatively constant AoLP in the February measurements is particularly interesting if seen as supplementing the relatively high DoLP values that exists at the same time. Not only can the degree of linear polarization benefit the photosynthetic algae under conditions of low light intensity, but the nearly constant AoLP would further facilitate the abilities of the photosynthetic algae to align their whole cell, their cell chloroplast, or the thylakoids within, in order to better harvest the limited quantity of light available. As mentioned above, the existence of phototactic abilities of photosynthetic organisms and internal reorientation and organization abilities is known and these abilities are used to better the light conditions of the photosynthetic cells, by changing either position or orientation of the cell or/and of the chloroplasts within it. We suggest that further such studies be conducted in order to confirm whether the algae within such caves indeed use this to their advantage.
Polarization Photograph Method
Two-Dimensional Maps of DoLP and AoLP
The two-dimensional maps of DoLP and AoLP as calculated for the red (R), green (G), and blue (B) color bands, respectively, from the polarization photographs taken at 10:00 local time on February 14th, 2016, with shorter exposure time and with longer exposure time, respectively, are presented in Figures 7, 8, respectively. In Figure 7 (corresponding to the shorter exposure time), we focus on the sky and far ocean. There is a clear boundary between the ocean and sky DoLP, with higher values of DoLP due to reflection off of the ocean surface (~40%) than due to scattering by the atmosphere only (~20%). Although Rayleigh scattering is known to cause high polarization of sky radiance, multiple scattering, and aerosol scattering tend to lower the polarization. Emde et al. (2010) found that the maximal sky polarization decreases to ~15% for an atmosphere containing water soluble aerosol and to ~12% for an atmosphere containing sea salt aerosol. Since both of these aerosol types are prevalent in the area of Rosh HaNikra (e.g., Bardouki et al., 2003), we can assume that such aerosol contribute to the relatively low maximal sky polarization observed in the current study.
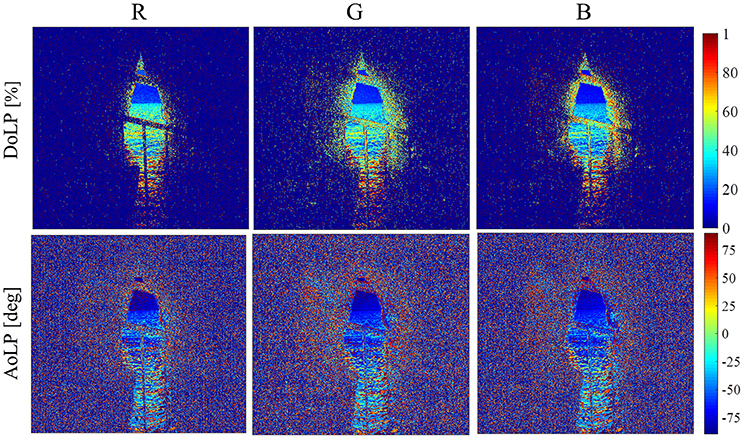
Figure 7. DoLP and AoLP photos from 10:00 local time on February 14th, 2016, for the red (R), green (G), and blue (B) color bands, as obtained with short exposure time.
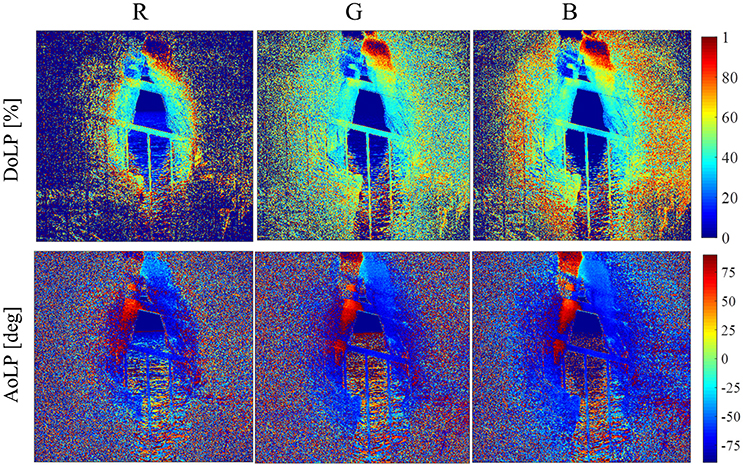
Figure 8. DoLP and AoLP photos from 10:00 local time on February 14th, 2016, for the red (R), green (G), and blue (B) color bands, as obtained with long exposure time.
In Figure 7, there is a slight decrease in DoLP from red band toward the blue band in both the sky and ocean regions of the images. Since Rayleigh scattering is stronger for shorter wavelengths, blue light is more likely to undergo multiple Rayleigh scattering than red light, thereby reducing the DoLP of blue light in comparison to red light (see, e.g., the measurements of Hegedüs et al., 2007). Such multiple scattering can result in the small difference between the DoLP of red light and the DoLP of blue light observed here. Furthermore, as mentioned above, the presence of aerosol particles in the atmosphere influences the DoLP. Pust and Shaw (2012) showed that higher DoLP of red light exists for oceanic regions, while the opposite can occur in desert regions, with the types of aerosol present contributing to this difference.
In Figure 8 (corresponding to the longer exposure time), we focus on the cave walls. Notice that the edges of the cave walls exhibit high polarization values. However, the absolute value of light intensity in these pixels is extremely low, and therefore the uncertainty in the calculations of DoLP is higher for these pixels. (A sample map of the estimated error is shown in Figure 9). This high error can be easily distinguished in the AoLP images in Figure 7, in which the cave walls appear as “static noise.” In Figure 8, the perimeter of this “static” is pushed deep into the darker parts of the cave. The DoLP values for most of the region of the cave walls are in the area of 40%, similar to the DoLP of the ocean. The exceptions are reflections off of the roof of the cave opening, which create extreme values of DoLP that are different on the two sides of the cave opening, high on the upper right side of the cave opening in the image, low on the upper left side of the cave opening in the image. Though we attribute the extreme values to light reflected from the walls and/or scattered between the wall and the lens of the camera, we cannot rule out the small possibility that the extreme values are caused by lens flare or leakage of light from the bright over-exposed region adjacent to it. Furthermore, the values of AoLP in the cave wall section of each image are not uniform; different patches of the cave walls exhibit different AoLPs. There is a distinct difference in AoLP between the two sides of the cave opening, not only on the roof of the cave but on the entirety of the cave walls. On the right-hand-side of the images, the AoLP is in the area of −70°, while on the left-hand-side of the images, there is a long strip of +70° AoLP. This strong variation in AoLP between different patches of the cave walls affects the mean contribution of the cave walls to the DoLP.
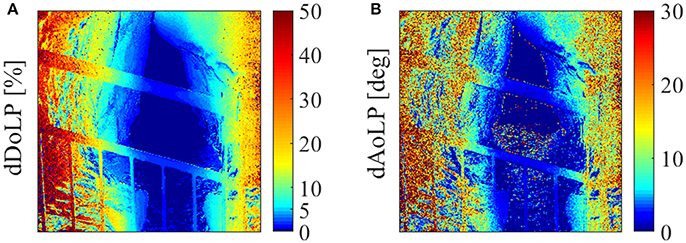
Figure 9. Error estimation of (A) DoLP (dDoLP) and (B) AoLP (dAoLP) of cave walls (long exposure) as calculated per pixel, on April 10th, at 10 a.m.
Mean DoLP and AoLP for Each Section of the Image
Mean values of DoLP and AoLP for the sections of the two-dimensional maps comprising the sky, the far ocean, and the cave walls, respectively, are presented in Figure 10. Overall, the difference between wavebands is much smaller than in the spectrophotometer results (refer to the section Spectrophotometer Method DoLP above), and the prevalence of the green band observed in the spectrophotometer results is not apparent here. The difference is due mostly to the relative contribution of the overall intensity of each waveband and of each section of the image to the net polarization at the point of measurement. At most, the DoLP values for the red band seem to be slightly higher than the values for the green and blue bands for light from the far ocean.
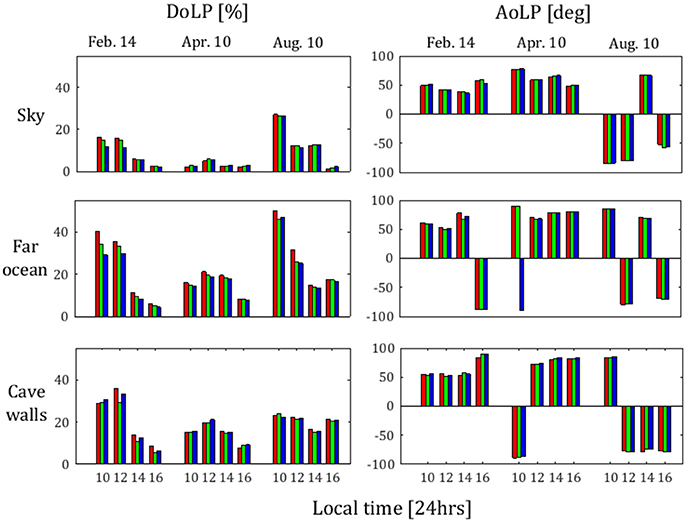
Figure 10. Mean DoLP and mean AoLP for light from sky, far ocean, and cave walls as obtained from polarization photograph method on February 14th, 2016, April 10th, 2016, and August 10th, 2016. The dates and time of day of each measurement are indicated along the horizontal axis. From each measurement values from blue, green, and red wavebands are presented (each in its own color).
From Figure 10, in the mean, the light is least polarized when coming from the direction of the sky (1–27%), more polarized when reflected from the cave walls (5–35%), and most polarized when coming from the direction of the ocean (4–50%). This points to the connection between the geographical setting of the cave and the benefit of light polarization to its inhabitants. The polarization of light entering the cave from the sky region comes with the highest intensity and is therefore one of the most important variables in controlling the net polarization within the cave. The sky polarization is solely a function of scattering. Thus, it is dependent on the azimuth angle of the cave opening and on the latitude-longitude coordinates of the site. Since the orientation of the Rosh HaNikra cave is nearly due west, and the cave is situated at a mid-latitude, the inside of the cave is not exposed to the band of high polarization that is perpendicular to the solar path in the morning and evening hours (see Pomozi et al., 2001, their Figures 1, 2). Rather, the inside of the cave is exposed to the neutral points of polarization in morning and evening hours; we speculate that for the same latitude-longitude coordinates, a south, south-east, north, or north-west facing cave opening would result in lower light intensity in the afternoon hours and an increased exposure to high sky polarization in the morning and evening hours, which due to the decrease in available light at those hours may be of more significance to the photosynthetic organisms within the cave. We recommend repeating such measurements of polarization characterization for cave openings with different azimuth orientations, along with a survey of photosynthetic organisms present in the caves.
The close proximity to the ocean provides a high polarization of light by reflection off of (or refraction into and back out of) the ocean surface. However, the intensity of light reflected off of the ocean is lower than the intensity of light propagating from the sky into the cave. Furthermore, as mentioned above, the presence of marine aerosols may cause a decrease in sky polarization (Emde et al., 2010). Therefore, the proximity of the cave to the ocean may or may not produce a net increase in polarization within the cave. We recommend that future polarization measurements be conducted in caves with different levels of proximity to the ocean, in order to estimate the significance of this factor to the polarization of light within such caves.
The data we present with regards to polarization from reflection off of the cave walls is restricted to the cave opening, due to low light within the caves. At the cave opening, we see that the polarization from reflection off of the cave walls may reach high values. However, the intensity contribution of the walls decreases rapidly toward further inside of the cave. For most hours of the day, the absolute intensity of the light reflected from the cave walls was negligible in comparison to the other sections of the images. Nevertheless, the polarization characteristics of the cave walls may be particularly important. Since the reflections off of the cave walls produce light (however low) in areas that other sources of light do not reach, the DoLP of such light may be of even greater significance than in the more illuminated areas. We also note that in the late afternoon, which is the hour of maximal light intensity within the cave (Mayer, 2017), the DoLP of the cave walls is the highest among the three sections of the image.
In the mean, the basic pattern of DoLP change throughout the day is consistent among the different sections of the images. In most cases, the minimum DoLP is in the evening. In all cases, the maximal DoLP values are in the morning to noon hours, which are the hours of minimal absolute light intensity within the caves.
From Figure 10, the maximum values of DoLP are lowest in the April observations. This may be connected to the fact that cloud coverage was highest in the April measurements (according to NASA LAADS DAAC satellite dataset; https://ladsweb.modaps.eosdis.nasa.gov/search/). As with multiple scattering and scattering by aerosol particles mentioned above, scattering by water clouds can cause a significant depolarization of light (Emde et al., 2010), though the AoLP tends to be less strongly affected (Pomozi et al., 2001; Hegedüs et al., 2007). In addition to the high cloud coverage in April, the wind speed recorded at the time of the April observations was much higher than the wind speed recorded at the time of the other observations. Higher wind speed results in higher ocean surface roughness, which in turn tends to cause depolarization of light reflected off of the ocean surface (see, e.g., Fung, 1966; Valenzuela, 1967, based on the theory of Rice, 1951). Since high wind speed is also a source of increase in sea spray, and thus an increase in sea salt aerosols, the decrease of DoLP due to high wind speed is also relevant to the sky region.
From Figure 10, as in the spectrophotometer measurements, the AoLP is again more variable throughout the day in the August 10th measurements, though for the cave wall reflections, it is nearly constant from 12:00 local time on. The AoLP of the light reflected from cave walls is the most stable throughout the day. This is an important factor in the ability of species to orient their photoreceptors according to the AoLP, especially for algae, which, as described above, have less degrees of freedom of motion of their photoreceptors than cyanobacteria. It is important to point out that the angles of nearly 90° and −90° are essentially the same polarization angle. Therefore, in the cases of February 16:00 local time and April 10:00 local time, the difference in the sign of the AoLP may be disregarded.
Summary and Conclusions
We have examined the characteristics of the polarization of light within the midlittoral cave system of Rosh HaNikra by means of a spectrophotometer method and a polarization photograph analysis method. The latter enabled us to examine the separate polarization characteristics of light coming into the cave from the direction of the sky, the direction of the far ocean, and the direction of the cave walls, respectively.
We observed a few unique polarization characteristics that may be to the advantage of photosynthetic organisms within the cave. The first is high values of DoLP in the morning and at noon in the February measurements, as seen both in the spectrophotometer method and the polarization photograph method. The second is the nearly constant AoLP over all of the measurement hours in the February measurements. This combination of high DoLP and nearly constant AoLP may allow photosynthetic algae to orient their chloroplast or their phycobilisomes with respect to the AoLP in order to optimize light harvesting.
Given that the wavelengths at which the photosynthetic biliprotein pigments exhibit high absorbance overlaps with the wavelengths at which the DoLP from our measurements is relatively high, we noted that the presence of photosynthetic biliprotein pigments in photosynthetic algae is likely to be more beneficial than the presence of chlorophyll a. Furthermore, given than cyanobacteria are endowed with flexibility in the orientation of their inner structure and are highly dependent on the light harvesting capabilities of biliproteins, particularly under low light (Mulec et al., 2008), we suggest that utilizing the polarization of light would be an especially beneficial way for cyanobacteria to cope with low-light conditions.
We note that the high polarization of cave walls and nearly constant daily AoLP emanating from the cave walls may be of similar significance and of particular relevance to areas within the cave that are not at all reached by direct light.
We show the importance of characterizing the light polarization pattern within cave ecosystems as a potential factor for photosynthetic organism distribution, and we encourage further development of this field, which has not yet been sufficiently explored. We emphasize that some of our conclusions from this preliminary study may be specific to the geography, position, orientation, and environment surrounding the Rosh HaNikra mid-littoral caves. To better understand the potential benefit of polarized light to photosynthetic organisms within caves, we suggest that future similar studies incorporate a wider variety of sampling locations and that they be supplemented with photosynthetic surveys and examinations of the reactions of cave algae and cyanobacteria to partially polarized light under low-light conditions.
Author Contributions
MT designed the polarization measuring techniques, performed the polarization measurements, analyzed the data, interpreted the physical aspects of the results, and wrote the paper. DM performed the absolute intensity measurements and assisted in the polarization measurements. DI and ZD assisted in interpreting the biological implications and in putting the work into perspective. CH helped to analyze the data, helped to interpret the physical aspects of the results, and edited the paper to improve the English.
Conflict of Interest Statement
The authors declare that the research was conducted in the absence of any commercial or financial relationships that could be construed as a potential conflict of interest.
Acknowledgments
This research was funded by a grant from the State of Israel Ministry of Science, Technology, and Space, Office of Energy and Water, grant number 3-11110. We thank the staff of the Rosh HaNikra National Park for allowing us to perform the research within the caves and for all of their assistance. We thank Amit Lerner for informative conversations on the topic of polarized light in natural environments. We thank Yeela Gundar for revising Figure 1, the map of the Rosh HaNikra mid-littoral cave. We thank Sharon Victor for her help with formatting the manuscript. We thank Gad Weiss for informative conversations on the topic of light harvesting pigments.
We thank two reviewers for their constructive suggestions.
References
Abu-Ghosh, S., Fixler, D., Dubinsky, Z., and Iluz, D. (2015). Continuous background light significantly increases flashing-light enhancement of photosynthesis and growth of microalgae. Bioresour. Technol. 187, 144–148. doi: 10.1016/j.biortech.2015.03.119
Almagor, G., and Perath, I. (2012). The Mediterranean Sea coast of Israel, 3rd edn., Geological Survey of Israel report GSI/28/2012. Jerusalem.
Bardouki, H., Liakakou, H., Economou, C., Sciare, J., Smolik, J., Zdimal, V., et al. (2003). Chemical composition of size-resolved atmospheric aerosols in the eastern Mediterranean during summer and winter. Atmos. Environ. 37, 195–208. doi: 10.1016/S1352-2310(02)00859-2
Breton, J., Michel-Villaz, M., and Paillotin, G. (1973). Orientation of pigments and structural proteins in the photosynthetic membrane of spinach chloroplasts: a linear dichroism study. Biochim. Biophys. Acta 314, 42–56. doi: 10.1016/0005-2728(73)90062-5
Brines, M. L., and Gould, J. L. (1982). Skylight polarization patterns and animal orientation. J. Exp. Biol. 96, 69–91.
Cennamo, P., Marzano, C., Ciniglia, C., Pinto, G., Cappelletti, P., Caputo, P., et al. (2012). A survey of the algal flora of anthropogenic caves of campi flegrei (naples, italy) archeological district. J. Cave Karst Stud. 74, 243–250. doi: 10.4311/2011JCKS0194
Coombes, M. A., Marca, E. C. L., Naylor, L. A., Piccini, L., De Waele, J., and Sauro, F. (2015). The influence of light attenuation on the biogeomorphology of a marine karst cave: a case study of Puerto Princesa Underground River, Palawan, the Philippines. Geomorphology 229, 125–133. doi: 10.1016/j.geomorph.2014.10.007
Cronin, T. W., and Marshall, J. (2011). Patterns and properties of polarized light in air and water. Philos. Trans. R. Soc. B Biol. Sci. 366, 619–626. doi: 10.1098/rstb.2010.0201
Cronin, T. W., and Shashar, N. (2001). The linearly polarized light field in clear, tropical marine waters: spatial and temporal variation of light intensity, degree of polarization and e-vector angle. J. Exp. Biol. 204, 2461–2467. Available online at: http://jeb.biologists.org/content/204/14/2461.abstract
Dubinsky, Z. (1992). “The functional and optical absorption cross-sections of phytoplankton photosynthesis,” in Primary Productivity and Biogeochemical Cycles in the Sea, eds P. G. Falkowski, A. D. Woodhead, and K. Vivirito (Boston, MA: Environmental Science Research, Springer), 31–45
Dubinsky, Z., and Stambler, N. (2009). Photoacclimation processes in phytoplankton: mechanisms, consequences, and applications. Aquat. Microb. Ecol. 56, 163–176. doi: 10.3354/ame01345
Emde, C., Buras, R., Mayer, B., and Blumthaler, M. (2010). The impact of aerosols on polarized sky radiance: model development, validation, and applications. Atmos. Chem. Phys. 10, 383–396. doi: 10.5194/acp-10-383-2010
Etzold, H. (1965). Der polarotropismus und phototropismus der chloronemen von dryopteris filix mas (L.) schott. Planta 64, 254–280. doi: 10.1007/BF00394953.
Foster, J. J., Temple, S. E., How, M. J., Daly, I. M., Sharkey, C. R., Wilby, D., et al. (2017). Polarization vision: overcoming challenges of working with a property of light we barely see. bioRxiv 207217. doi: 10.1007/s00114-018-1551-3.
Foster, K. W., and Smyth, R. D. (1980). Light antennas in phototactic algae. Microbiol. Rev. 44, 572–630.
Frackowiak, D., Gantt, E., Hotchandani, S., Lipschultz, C. A., and Leblanc, R. M. (1986). Polarized photoacoustic spectra of phycobilisomes in polyvinyl alcohol films. Photochem. Photobiol. 43, 335–337. doi: 10.1111/j.1751-1097.1986.tb05613.x
Frackowiak, D., Lorrain, L., Wrobel, D., and Leblanc, R. M. (1985). Polarized photoacoustic, absorption and fluorescence spectra of chloroplasts and thylakoids oriented in polyvinyl alcohol films. Biochem. Biophys. Res. Commun. 126, 254–261. doi: 10.1016/0006-291X(85)90599-6
Friedmann, I. (1964). Progress in the biological exploration of caves and subterranean waters in Israel. Int. J. Speleol. 1, 29–33.
Fung, A. K. (1966). Scattering and depolarization of Em waves from a rough surface. Proc. IEEE 54, 395–396. doi: 10.1109/PROC.1966.4702
Gagliano, A. G., Hoarau, J., Breton, J., and Geacintov, N. E. (1985). Orientation of pigments in phycobilisomes of Porphyridium sp. Lewin. A linear dichroism study utilizing electric and gel orientation methods. Biochim. Biophys. Acta 808, 455–463. doi: 10.1016/0005-2728(85)90154-9
Gal, J., Horvath, G., Meyer-Rochow, V. B., and Wehner, R. (2001). Polarization patterns of the summer sky and its neutral points measured by full-sky imaging polarimetry in Finnish Lapland north of the Arctic Circle. Proc. R. Soc. A Math. Phys. Eng. Sci. 457, 1385–1399. doi: 10.1098/rspa.2000.0726
Goedheer, J. C. (1955). Orientation of the pigment molecules in the chloroplast. Biochim. Biophys. Acta 16, 471–476. doi: 10.1016/0006-3002(55)90265-1
Hader, D. P. (1987). Polarotaxis, gravitaxis and vertical phototaxis in the green flagellate, Euglena gracilis. Arch. Microbiol. 147, 179–183. doi: 10.1007/BF00415281
Haupt, W. (1982). Light-mediated movement in chloroplasts. Ann. Rev. Plant Physiol. 33, 205–233. doi: 10.1146/annurev.pp.33.060182.001225
Haworth, P., Arntzen, C. J., Tapie, P., and Breton, J. (1982). Orientation of pigments in the thylakoid membrane and in the isolated chlorophyll-protein complexes of higher plants. I. Determination of optimal conditions for linear dichroism measurement. Biochim. Biophys. Acta 679, 428–435. doi: 10.1016/0005-2728(82)90164-5
Hegedüs, R., Akesson, S., and Horváth, G. (2007). Polarization patterns of thick clouds: overcast skies have distribution of the angle of polarization similar to that of clear skies. J. Opt. Soc. Am. A 24, 2347–2356. doi: 10.1364/JOSAA.24.002347
Horvath, G., and Varju, D. (1997). Polarization pattern of freshwater habitats recorded by video polarimetry in red, green and blue spectral ranges and its relevance for water detection by aquatic insects. J. Exp. Biol. 200, 1155–1163.
Horvath, G., and Varju, D. (2004). Polarized Light in Animal Vision: Polarization Patterns in Nature. Heidelberg: Springer-verlag.
Iluz, D., and Dubinsky, Z. (2015). Coral photobiology: new light on old views. Zoology 118, 71–78. doi: 10.1016/j.zool.2014.08.003
Jiang, J., Liu, D., Gu, J., and Susstrunk, S. (2013). “What is the space of spectral sensitivity functions for digital color cameras?,” in 2013 IEEE Workshop on Applications of Computer Vision (WACV) (Clearwater, FL), 168–179.
Kagawa, T., and Wada, M. (1995). Polarized light induces nuclear migration in prothallial cells of Adiantum capillus-veneris L. Planta 196, 775–780. doi: 10.1007/BF01106773
Kattawar, G. W. (1994). “Polarization of light in the ocean,” in Ocean Optics, eds R. W. Spinrad, K. L. Carder, and M. J. Perry (Oxford: Oxford University), 202–225.
Kriska, G., Horváth, G., and Andrikovics, S. (1998). Why do mayflies lay their eggs en masse on dry asphalt roads? Water-imitating polarized light reflected from asphalt attracts Ephemeroptera. J. Exp. Biol. 201, 2273–2286.
Lamprinou, V., Pantazidou, A., Papadogiannaki, G., Radea, C., and Economou-Amilli, A. (2009). Cyanobacteria and associated invertebrates in Leontari Cave, Attica Greece. Fottea 9, 155–164. doi: 10.5507/fot.2009.014
Martinez, A., and Asencio, A. D. (2010). Distribution of cyanobacteria at the Gelada Cave (Spain) by physical parameters. J. Cave Karst Stud. 72, 11–20. doi: 10.4311/jcks2009lsc0082
Mayer, D. (2017). Light Limitation on Epilithic Algae in Mid-Littoral Caves. MSc. thesis, Bar-Ilan University, Ramat-Gan.
Mayer, D., Dubinsky, Z., and Iluz, D. (2016). Light as a limiting factor for epilithic algae in the supralittoral zone of littoral caves. Front. Mar. Sci. 3:18. doi: 10.3389/fmars.2016.00018
McNamara, G., Gupta, A., Reynaert, J., Coates, T. D., and Boswell, C. (2006). Spectral imaging microscopy web sites and data. Cytom. 69, 863–871. doi: 10.1002/cyto.a.20304
Mulec, J., and Kosi, G. (2008). Algae in the aerophytic habitat of Račiške ponikve cave (Slovenia). Nat. Slov. 10, 39–49. Available online at: http://web.bf.uni-lj.si/bi/NATURA-SLOVENIAE/pdf/NatSlo_10_1_3.pdf
Mulec, J., Kosi, G., and Vrhovšek, D. (2008). Characterization of cave aerophytic algal communities and effects of irradiance levels on production of pigments. J. Cave Karst Stud. 70, 3–12. Available online at: https://nss2013.caves.org/pub/journal/PDF/v70/cave-70-01-3.pdf
Mulec, J., and Kubesova, S. (2010). Diversity of bryophytes in show caves in Slovenia and relation to light intensities. Acta Carsol. 39, 587–596. doi: 10.3986/ac.v39i3.86
Pentecost, A., and Zhaohui, Z. (2001). The distribution of plants in Scoska Cave, North Yorkshire, and their relationship to light intensity. Int. J. Speleol. 30:3. doi: 10.5038/1827-806X.30.1.3
Pomozi, I., Horvath, G., and Wehner, R. (2001). How the clear-sky angle of polarization pattern continues underneath clouds: full-sky measurements and implications for animal orientation. J. Exp. Biol. 204, 2933–2942. Available online at: http://jeb.biologists.org/content/204/17/2933.abstract
Prahl, S. (2012). PhotoChemCAD Chemicals. Available online at: https://omlc.org/spectra/PhotochemCAD/index.html (Accessed March 18, 2018).
Pust, N. J., and Shaw, J. A. (2012). Wavelength dependence of the degree of polarization in cloud-free skies: simulations of real environments. Opt. Express 20, 15559–15568. doi: 10.1364/OE.20.015559
Rice, S. O. (1951). Reflection of electromagnetic waves from slightly rough surfaces. Commun. Pur. Appl. Math. 4, 351–378. doi: 10.1002/cpa.3160040206
Sabbah, S., and Shashar, N. (2007). Light polarization under water near sunrise. J. Opt. Soc. Am. A Opt. Image Sci. Vis. 24, 2049–2056. doi: 10.1364/JOSAA.24.002049
Schwind, R., and Horvath, G. (1993). Reflection-polarization pattern at water surfaces and correction of a common representation of the polarization pattern of the sky. Naturwissenschaften 80, 82–83. doi: 10.1007/BF01140422
Shashar, N., Sabbah, S., and Cronin, T. W. (2004). Transission of linearly polarized light in seawater: implications for polarization signaling. J. Exp. Biol. 207, 3619–3628. doi: 10.1242/jeb.01187
Takagi, S. (2003). Actin-based photo-orientation movement of chloroplasts in plant cells. J. Exp. Biol. 206, 1963–1969. doi: 10.1242/jeb.00215
Takaichi, S. (2013). Distributions, biosyntheses and functions of carotenoids in algae. Agro Food Ind. Hi. Tech. 24, 55–58. doi: 10.3390/md9061101
Utzinger, U. (2011). Spectra at UA. Available online at: http://www.spectra.arizona.edu/ (Accessed March 18, 2018).
Valenzuela, G. R. (1967). Depolarization of EM waves by slightly rough surfaces. IEEE Trans. Antenn. Propag. 15, 552–557. doi: 10.1109/TAP.196m7.1138962
Vinogradova, O. N., Kovalenko, O. V., Wasser, S. P., Nevo, E., and Weinstein-Evron, M. (1998). Species diversity gradient to darkness stress in blue-green algae/cyanobacteria: a microscale test in a prehistoric cave, Mount Carmel, Israel. Isr. J. Plant Sci. 46, 229–238. doi: 10.1080/07929978.1998.10676732
Wada, M., Grolig, F., and Haupt, W. (1993). Light-oriented chloroplast positioning. Contribution to progress in photobiology. J. Photochem. Photobiol. B. Biol. 17, 3–25. doi: 10.1016/1011-1344(93)85002-P
Waterman, T. H. (1954). Polarization patterns in submarine Illumination. Science 120, 927–932. doi: 10.1126/science.120.3127.927
Keywords: Rosh HaNikra, light, polarization, algae, microalgae, littoral cave
Citation: Tzabari M, Mayer Mayron D, Iluz D, Dubinsky Z and Haspel C (2018) Linear Polarization Characteristics Within the Rosh HaNikra Mid-Littoral Cave, Israel. Front. Mar. Sci. 5:192. doi: 10.3389/fmars.2018.00192
Received: 02 January 2018; Accepted: 14 May 2018;
Published: 01 June 2018.
Edited by:
Angel Borja, Centro Tecnológico Experto en Innovación Marina y Alimentaria (AZTI), SpainReviewed by:
Emyr Martyn Roberts, Bangor University, United KingdomMartin John How, University of Bristol, United Kingdom
Copyright © 2018 Tzabari, Mayer Mayron, Iluz, Dubinsky and Haspel. This is an open-access article distributed under the terms of the Creative Commons Attribution License (CC BY). The use, distribution or reproduction in other forums is permitted, provided the original author(s) and the copyright owner are credited and that the original publication in this journal is cited, in accordance with accepted academic practice. No use, distribution or reproduction is permitted which does not comply with these terms.
*Correspondence: Masada Tzabari, bWFzYWRhLnR6ZW1hY2hAbWFpbC5odWppLmFjLmls