 Jason R. Graff
 Michael J. Behrenfeld
- Department of Botany and Plant Pathology, Oregon State University, Corvallis, OR, United States
Strong physical disturbances in the surface ocean vertically redistribute plankton and lead to new relationships between organisms and their growth environment. Entrainment of phytoplankton to deeper depths decreases light exposure while stratification exposes cells in the surface mixing layer to higher light. Phytoplankton can rapidly respond to alterations in growth irradiance (Eg) using photoacclimation processes such as nonphotochemical quenching and alterations in pigments and other macromolecules. While it is common to observe photophysiological responses to shifts in growth irradiance in the laboratory it is rare that a study is able to document these processes in the field in a lagrangian framework. We were able to follow a natural phytoplankton community for 4 days and observe rapid photophysiological responses and net accumulation patterns of biomass down to 200 m following a deep mixing and restratification event in the subarctic Atlantic ocean. Applying flow cytometry and fast rate repetition fluorometry (FRRf) we report on the photoacclimation responses of multiple taxonomic groups in relation to the rapidly evolving physical environment. Significant stratification occurred following the deep entrainment event, isolating cells within an actively mixing and shoaling surface layer, the lower euphotic zone, and below the photic zone. Distinct differences in patterns of accumulation and photoacclimation are apparent between these depths of disparate light histories. Photoacclimation patterns are generally consistent between Synechococcus, picoeukaryote, and nanoeukaryote groups yet diel patterns and variability in the range of photoacclimation suggest divergent physiology. Results from continuous FRRf measurements collected on bulk seawater show a decrease in the number of photosystem II reaction centers and a concurrent increase in the functional cross section with implications for maintaining photosynthetic rates throughout the mixed layer. Understanding group specific differences as well as bulk community acclimation strategies will be important for informing models relying on photoacclimation parameters to determine growth and accumulation rates and net primary production. More so, the rates at which cells acclimate within the context of the frequency and spatial dynamics of storm events, such as the one recorded here, directly impact interpretations and applications of remote retrievals of phytoplankton chlorophyll, carbon, and their ratio in the context of unbalanced growth.
Introduction
Seasonal and diel light cycles, variations in cloud cover, wave focusing, and mixing through a vertical light gradient all cause natural phytoplankton communities to experience a highly variable light environment. Phytoplankton physiologically navigate dynamic light exposure through a range of mechanisms that function over diverse time scales. Rapid changes in light (seconds to minutes) are largely handled through changes in nonphotochemical quenching (NPQ). Responses to slightly longer time scale changes in light also involve the upregulation and downregulation of photosystem II (PSII) reaction centers (Prasil et al., 1992; Osmond, 1994; Behrenfeld et al., 1998; Lee et al., 2001). On time scales of days, phytoplankton exhibit major changes in cellular pigmentation (Laws and Bannister, 1980; Geider, 1987; Behrenfeld et al., 2002; MacIntyre et al., 2002; Halsey and Jones, 2015). Photoacclimation is the common term for these phenotypic responses to light and it encompasses changes in enzymatic processes, morphology, and biochemical composition (Falkowski and LaRoche, 1991; MacIntyre et al., 2002).
One of the most thoroughly studied photoacclimation responses in phytoplankton is the increase in chlorophyll:carbon (Chl:C) with decreasing growth irradiance (Eg) or decrease in Chl:C with increasing Eg. Laboratory studies show that this response begins within minutes of a light shift, proceeds at a rate dependent on the extent of the change in light, and may require many days to achieve a new steady-state value [with this time for homeostasis being shorter for a low-to-high light shift (i.e., an energy-rich acclimation) than a high-to-low light shift (i.e., an energy starved acclimation) (e.g., Cullen and Lewis, 1988; Anning et al., 2000; Havelková-Doušová et al., 2004). Compared to results from laboratory studies, natural populations appear to display a muted range in photoacclimation-driven Chl:C changes (Behrenfeld et al., 2005; Westberry et al., 2008; Graff et al., 2016) [noting here that Chl:C also varies with nutrient limited growth rate (Laws and Bannister, 1980; Geider et al., 1997; Halsey and Jones, 2015)]. Admittedly, part of this discrepancy may simply be due to the lack of consensus as to what light level phytoplankton in the surface ocean mixing layer are acclimated (e.g., daily mean or median light or something else).
Field studies often take advantage of spatial gradients in upper ocean growth conditions to evaluate phytoplankton photophysiological [e.g., photochemical efficiencies through fast-rate repetition fluorometry (FRRf) measurements] (Greene et al., 1994; Behrenfeld and Kolber, 1999; Moore et al., 2006) or photoacclimation (e.g., Chl:C) properties (Graff et al., 2016). Far less common are field studies that provide temporally resolved observations of photoacclimation in a community-tracking lagrangian framework. During the second field campaign of the National Aeronautics and Space Administration's (NASA) North Atlantic Aerosol Marine Ecosystem Study (NAAMES), an opportunity was presented to document plankton community responses during water column re-stratification immediately following a major physical disturbance and deep entrainment event. Here, we describe the photophysiological and biomass changes of the phytoplankton in response to this event. Our results are discussed in the broader context of photoacclimation strategies of natural phytoplankton populations and implications this has for applying remote sensing retrievals of C and Chl during unbalanced growth driven by deep mixing and restratification events in open ocean ecosystems such as the subarctic North Atlantic.
Materials and Methods
The NASA NAAMES is a field-intensive investigation of the subarctic Atlantic Ocean with primary objectives to improve understanding of the mechanisms governing the annual phytoplankton biomass cycle and the impact of plankton on the overlying atmospheric aerosols and clouds (https://naames.larc.nasa.gov). NAAMES ship-based measurements are conducted on the RV Atlantis and, during the second (11 May to 5 June 2016) of four total NAAMES field campaigns, the ship arrived on a station (47°39.360 N, 39°11.398 W) immediately following a deep water entrainment event. From 24 to 27 May, this water mass was tracked (i.e., a lagrangian station) and upper water column biological, chemical, and physical properties were characterized during the re-stratification process.
Water Mass Tracking and Physical Profiling
A profiling Seabird Navis BGCi float and drifter (University of California – Santa Barbara) were used to track the water mass over time and were deployed just prior to the first CTD-rosette cast. The RV Atlantis was continuously repositioned based on location reports from the drifter (every 1 h) and float (every 7 h). Water column sampling was conducted using a SeaBird CTD profiling package and 20 L Niskin rosette. Casts were made up to 4 times per day to a minimum depth of 500 m. Seawater density and Brunt–Väisälä (or buoyancy) frequency (N2) for each CTD profile were calculated using the SEAWATER Matlab library (http://www.marine.csiro.au/~morgan/seawater). Brunt–Väisälä frequency profiles were smoothed using a 10 m vertical running average and plotted in Matlab with the “surface” command over an hourly meshgrid with 1 m vertical resolution. Multiple criteria were used to estimate the surface mixing layer depth (MLD) following those applied in Holte and Talley (2009) many of which were informed by de Boyer Montégut et al. (2004) and Dong et al. (2008). Specifically (1-3) the density, temperature, and salinity algorithms from Holte and Talley (2009), (4) a temperature threshold (T = T0 ± 0.2°C), (5) a density threshold (sigma-theta (sθ) = sθ0 + 0.03 kg m−3), (6) a temperature gradient approach (ΔT/Δpressure > 0.005°C dbar −1 or max ΔT/Δpressure), and (7) a density gradient approach (Δsθ/Δpressure > 0.0005 kg m −3 dbar −1 or max Δsθ/Δpressure).
Flow Cytometry
Group specific phytoplankton responses to the disturbance and re-stratification event were characterized using flow cytometry. Whole unpreserved seawater samples were analyzed from depths of 5, 10, 25, 50, 75, 100, and 200 m. From each depth, 4 ml of seawater were collected from Niskin bottles into sterile 5 ml polypropylene tubes (3x rinsed) and immediately stored at ~4°C until analysis on a BD Influx Cell Sorter (ICS). All samples from a given profile were analyzed within 30 min or less of collection. Sample tubes were kept shaded, but not completely dark, during analysis using opaque tape to eliminate the potential that laboratory lighting would impact cell fluorescence properties while simultaneously allowing for relaxation of NPQ (Berman, 1972; Milligan et al., 2012). The ICS was equipped with a blue (488 nm) laser and four detectors. The detectors included forward scatter (FSC) with enhanced small particle detection, side scatter (SSC), fluorescence at 692 ± 40 nm (FL692) and fluorescence at 530 ± 40 nm (FL530). A minimum of 7,000 total cells were interrogated per sample. Sample flow rates are required for normalizing cell counts collected over time to volume and were calculated from volumetric changes in a 1 ml water sample over a known time (60 s or greater) using a pipettor to determine the volume of water lost. This was performed immediately following the analysis of samples collected at each time point and the average was used to calculate cell concentrations. Sample flow rates at this station averaged 57.4 μl min−1 with a standard deviation of 3.5 μl min−1 that would result in approximately ± 6% over- or underestimation of cell concentrations. The ICS was calibrated daily with fluorescent beads and following standard protocols (Spherotech, SPHERO™ 3.0 μm Ultra Rainbow Calibration Particles). Photomultiplier tube (PMT) gains were identical for all samples, thus minimizing artifacts due to instrument settings.
Flow cytometry data were organized into three major phytoplankton groups: Synechococcus, picoeukaryotes, and nanoeukaryotes. Prochlorococcus was not present at this station. Thus, an analysis of this important group could not be included here. The mean and total scattering and fluorescence properties were determined for each group post-cruise using FlowJo v. 10.0.6. Results presented here focus on FSC and FL692. The former of these properties correlates with cell size and carbon content through conversions to biovolume and carbon to volume conversion factors while the latter property correlates with cellular chlorophyll concentration (Veldhuis and Kraay, 1990, 2000). We have chosen not to convert either property directly to Chl or Cphyto given the range of values that could be applied to each phytoplankton group (e.g., Zubkov et al., 1998; Heldal et al., 2003; Heywood et al., 2006; Tarran et al., 2006; Grob et al., 2013), instead relying on the flow cytometric properties to inform our analyses. Cellular fluorescence quantum yields could impact flow cytometry measurements of FL692 and can vary with growth and taxonomy and more significantly by NPQ which is relaxed during sample analysis and, thus, does not impact flow cytometry measurements made here. More so, persistent variability in fluorescence quantum yields were not significant due to the low variability in Fv:Fm measurements (see methods and data below). Finally, comparisons of FL692 with in-situ measurements of HPLC Chl a show strong correlation suggesting relatively minor changes in quantum yields. Accordingly, the FL692:FSC ratio provides a proxy for the phytoplankton Chl:C ratio, with the cytometrically determined ratio hereafter denoted as FL:FSC.
Fluorescence, Chlorophyll, and Growth Irradiance
The RV Atlantis seawater flow through system is modified for all NAAMES field campaigns. Specifically, a Teflon lined diaphragm pump is installed prior to a given cruise just aft of the seawater intake at the bow in order to bypass the ship's impeller pump which would otherwise impact the sampled plankton populations (Cetinić et al., 2016). Whole seawater from the diaphragm pump is plumbed through clean tubing to multiple instruments in the laboratory, including a custom Fast Rate Repetition fluorometer (FRRf, excitation wavelength is 490 nm) for measuring initial fluorescence (Fo), maximal fluorescence (Fm), and PSII functional cross sections (σPSII) (Behrenfeld et al., 1998). Values of Fo, Fm, and σPSII reported here represent averages for 16 individual single turnover flash sequences only for nighttime measurements to eliminate variability associated with daytime NPQ. Daytime FRRf measurements (data not shown) indicated inverse changes in initial and maximal fluorescence with changes in incident sunlight that are consistent with expected protective and reversible NPQ processes in the photosynthetic pigment bed and will not be discussed further here.
Chlorophyll a (Chl a) was determined from high performance liquid chromatography (HPLC) on water collected from surface (5 m) Niskin bottle samples. For HPLC samples, 1–3 L of whole seawater were filtered onto a pre-combusted (450°C, 4 h) GF/F filter. Each filter was immediately placed into a cryovial after collection and stored in liquid nitrogen. Samples were analyzed at the NASA Goddard Space Flight Center Ocean Ecology Laboratory following established protocols (Van Heukelem and Thomas, 2001).
Downwelling surface photosynthetically active radiation (PAR; μmol photons m−2 d−1) was measured continuously with a Licor Model LI-189 cosine collector positioned on the top rail of a research van located on the upper forward weather deck to avoid shading from ship structures. PAR measurements were not collected on the Niskin rosette. Photic depths (1% surface PAR) and attenuation were determined using PAR profiles from near noon optical profiles of the water column with a Biospherical C-OPS radiometer. The Biospherical C-OPS also provides spectral information, which could be important in phytoplankton photoacclimation strategies. Here we have chosen to focus on total PAR as it is the most common metric in photoacclimation studies. Integrated PAR values of incident light and percent attenuation from depth profiles at sample depths were used to calculate growth irradiance (Eg) values for each sample depth. For samples within the actively mixing surface layer, Eg was assessed as the median daily integrated PAR within this layer and the depth of active mixing was determined using the density gradient approach which mirrored those estimated by a buoyancy frequency reference point of log10 N2 = −5.8 at noon. For samples below the mixing layer, Eg was calculated as the median daily integrated PAR at the sampled depth.
Correlation analyses and plots for FRRf data were performed in Excel. All other calculations (means, medians, difference, ratios, etc.) were performed using Matlab or FlowJo for flow cytometry datasets as described above.
Results and Discussion
The focus of this report is the photophysiological responses and net accumulation of phytoplankton within a stratifying water column following a deep mixing event. The results presented below are novel in their approach of applying flow cytometry data, alongside more traditional physiological and pigment measurements, to evaluate near real time responses of phytoplankton to a physical disturbance. These finding have significant implications on understanding the phytoplankton physiology and the impact on loss processes in response to changes in the physical environment. Forthcoming publications from the NAAMES efforts will detail additional findings on rates of production and loss at this station as well as the larger region surveyed by this project.
Buoyancy Frequency
From May 22–24th a low-pressure system with wave heights estimated to be ~9 m moved through the targeted study region and was subsequently replaced by a high-pressure system from the northwest (Figures 1A,B) (NOAA Ocean Prediction Center — http://www.opc.ncep.noaa.gov/Atl_tab.shtml). Deep-water entrainment during the passing storm was evidenced by the nearly homogenous profile of Brunt–Väisälä or buoyancy frequency to 200 m observed during the initial CTD cast made in this water mass (Figure 2A). It is unlikely that the storm provided the energy to mix the water column down to 200 m or greater. A more probable scenario, albeit without data to confirm this, is that a shallow stratified layer was mixed into an existing deeper and actively mixing layer, thereby homogenizing properties to greater than 200 m (Dr. Peter Gaube personal communication). From May 24th through May 27th, buoyancy frequency profiles indicated rapid re-stratification of the water column, with active mixing rarely penetrating below 25 m (Figure 2A). Of the seven algorithms used to estimate the active mixing depth, only the density gradient approach provided a result consistent with Brunt–Väisälä frequency distributions (Figures 2B,C).
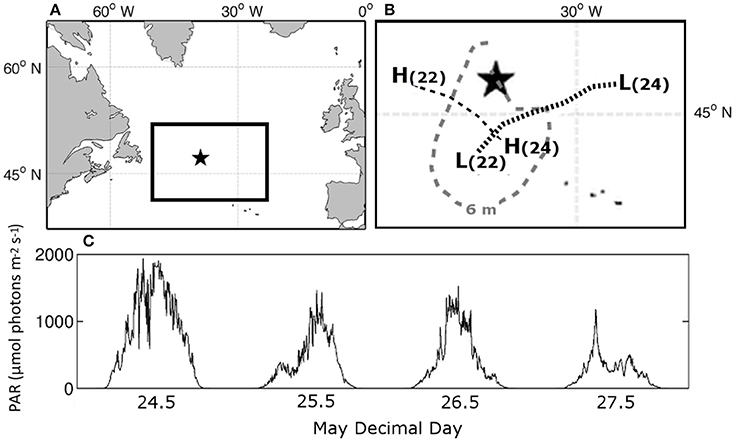
Figure 1. (A) Location of station in the North Atlantic ocean, (B) track of low (L) and high (H) pressure systems on day 22 and 24 and the 6 m wave height contour on May 22nd prior to our arrival on station on May 24. (C) Surface PAR during occupation of Station 4.
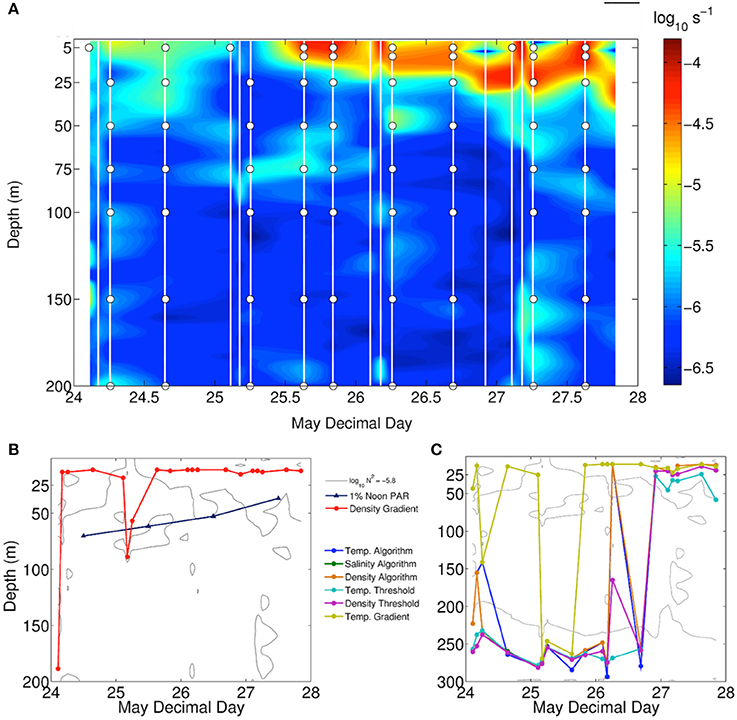
Figure 2. (A) Contour plot of the buoyancy frequency during station occupation, times of CTD casts (white lines) and sample depths (circles). (B,C) Mixed layer depth determinations from multiple approaches plotted against a single contour of buoyancy frequency evident in Figure 1. (A) 1% noon PAR depth.
Phytoplankton Distribution
Phytoplankton concentrations were homogenous throughout the upper 200 m of the surface ocean upon arrival on station (Figures 3A,B, dark blue circles). Changes in total FL692 and FSC indicated that phytoplankton chlorophyll and biomass, respectively, increased within the photic layer (Figure 2B, blue line) during the 4-day station occupation. These increases were greater in the upper 25 m active mixing layer than deeper in the photic layer (Figures 3A,B). Below the photic zone, heterotrophic consumption, viral lysis, and/or sinking caused chlorophyll and carbon concentrations to decrease over time (Figures 3A,B). These temporally-evolving vertical patterns in phytoplankton properties demonstrate the rapid shoaling of the active mixing layer implied by Brunt–Väisälä frequency distributions (Figure 2). Increasing phytoplankton concentrations in the surface caused the photic layer depth to decrease during the time series from ~75 m to <50 m (Figure 2B, blue line).
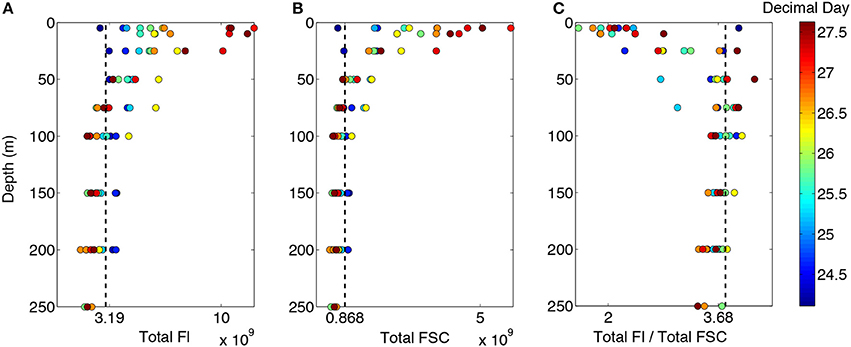
Figure 3. Depth profiles of (A) total fluorescence, (B) total forward scatter, and (C) fluorescence to forward scatter ratio. Color bar represents time of sampling and dashed lines are mean values for the depths sampled within the first few hours of arrival on station.
A deep entrainment event will not only redistribute phytoplankton over a larger volume of water (i.e., dilution), but will have a similar impact on (micro-) grazer and viral populations. The very low loss rate of phytoplankton observed below the photic zone suggests that, at least initially, phytoplankton growth within the photic layer was essentially “unchecked.” In other words, phytoplankton biomass accumulation rates (r = growth rate (μ) – losses (g)) are expected under such conditions to approximate division rates. What we observed in the upper 25 m mixing layer was a rate of change in total FSC suggestive of a very high average specific accumulation rate of 0.47 d−1 (Figure 4A), with the highest single daily value observed during the first day of occupation at 0.77 d−1. Phytoplankton growth rates in the surface ocean can exceed a division per day (specific growth rate of = 0.69 d−1) with growth rates of Synechococcus as high as 0.82 d−1 (Campbell and Carpenter, 1986) and total communities of 0.65 d−1 in temperate North Atlantic waters (Marañón et al., 2000). Below 25 m, accumulation rates decreased with increasing depth and decreasing light, with average rates for the three deepest depths well out of the photic zone ranging from −0.15 to −0.18 d−1 (Figure 4A). Given the recent entrainment and dilution event, these rates may represent loss rates throughout the water column, at least initially. Assuming the loss rates at the three deepest depths are representative of all depths, the average phytoplankton growth rate (calculated as μ = r + g) in the upper 25 m over the 4-day occupation was 0.64 d−1. This rate is approaching a doubling of biomass per day and suggests that losses were only removing 20–25% of daily net production, calculated as the ratio of g to μ. However, these average statistics do not reveal the temporal dynamics between phytoplankton division and loss rates. Indeed, the time-course for phytoplankton biomass in the near surface samples indicates essentially a linear increase over the station occupation (Figure 4B, black symbols). In addition to reflecting the decrease in PAR over time (Figure 1C), this result implies that an increasing fraction of daily phytoplankton production was being consumed with each subsequent day (i.e., if production and loss rates are constant in time, biomass will increase exponentially rather than linearly). In other words, loss rates were already catching up to division rates within this short 4-day window (i.e., increased predator-prey coupling), which is clearly illustrated by plotting total FSC in the surface ocean on a log scale with a linear fit (Figure 4C). Net primary production determined from 24-h 14C-labeled incubation experiments increased at a higher rate than accumulation, suggesting that recoupling between grazing and phytoplankton dynamics was indeed occurring over time at this station.
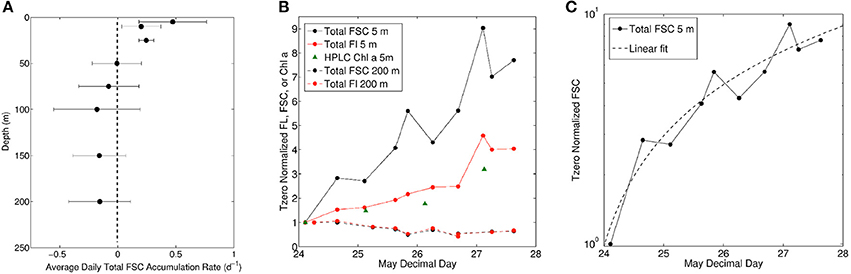
Figure 4. (A) Average daily accumulation rate of total forward scatter (FSC) during station occupation. Bars represent one standard deviation. (B) Accumulation of total community forward scatter, fluorescence, and HPLC Chl a for 5 m (solid lines) and forward scatter and fluorescence for 200 m samples (dashed lines). Values are normalized to first samples collected within hours of arriving on station. (C) Total community FSC at 5 m normalized to first sample collected (same data as in B but on log scale).
Photoacclimation
For the 4 days following the deep entrainment event, both phytoplankton biomass and chlorophyll concentrations increased in the photic layer (Figures 3A,B, 4B), but not at the same rate. This difference is indicative of unbalanced growth (i.e., the unequal net accumulation of different cellular constituents Shuter, 1979) and it resulted in FL:FSC changes that increased from the bottom of the photic layer to the surface (Figure 3C). This response is precisely as expected from laboratory photoacclimation experiments (Cloern et al., 1995; Geider et al., 1997; Halsey and Jones, 2015). Specifically, in this rapidly re-stratified water column, phytoplankton at each depth adjusted their cellular pigment level to reflect the new light environment into which they had been confined: high-light, low FL:FSC near the surface and low-light, high FL:FSC at depth (Figure 3C).
One of the striking aspects of the observed photoacclimation response was the rate of change. In the upper 5 m, essentially a new steady-state value was reached within the first 24 h, after which biomass and chlorophyll increased in parallel with a relatively fixed ratio (Figure 4B, solid lines; note this figure also shows the strong correlation between FL692 and HPLC based cellular chlorophyll values—green triangles). As suggested above, this rapid “re-equilibration” can occur because it is an energy-rich acclimation (i.e., low-to-high light shift) (Cullen and Lewis, 1988). At the other extreme, phytoplankton trapped below the photic zone after restratification exhibited no change in FL:FSC throughout the 4 day station occupation (Figure 4B, dashed lines). This result is the consequence of signals for photoacclimation being turned off in the dark (Behrenfeld et al., 2016) and a lack of photosynthetic products required for new syntheses.
A more detailed view of the photoacclimation response observed in the water column is provided in Figure 5. Here, the left hand panel shows changes in FL:FSC over time at each sampling depth. An equivalent decrease in FL:FSC is observed at all sampling depths ≤25 m during the first day (red, green, blue symbols in Figure 5A). Then, the 25 m sample begins progressively increasing FL:FSC until the end of the time course (blue symbols in Figure 5A) whereas the 5 and 10 m samples remain relatively constant (red and green symbols in Figure 5A). This result suggests that the active mixing depth shoaled to <25 m by the second day and phytoplankton trapped below this layer had to reacclimate to a daily light exposure that was lower than the mixing layer and becoming progressively dimmer as the accumulating biomass increased light attenuation and daily surface PAR decreased (Figures 1C, 2B). A similar but muted time course of FL:FSC is also observed for samples collected at 50 and 75 m (black and brown symbols in Figure 5A). Here, however, the FL:FSC changes suggest that these phytoplankton populations were never in the actively mixing layer and only experienced a brief period of enhanced light before increasing FL:FSC again in response to increasing light attenuation in the water column and decreasing incident PAR. Again, at depths > 75 m, bulk FL:FSC exhibited little variability over the 4 day study.
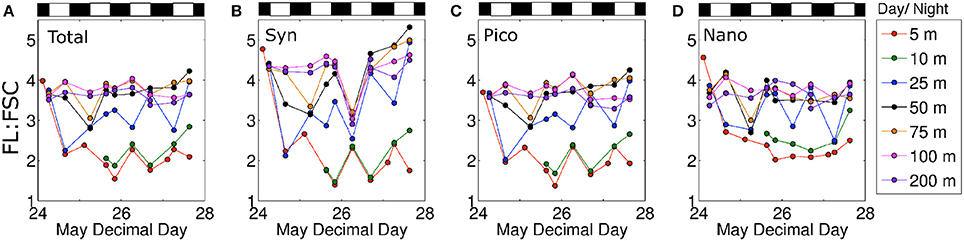
Figure 5. Fluorescence per forward scatter ratios for (A) total community, (B) Synechococcus, (C) picophytoplankton, and (D) nanophytoplankton for 7 depths plotted against time. Black and white bars above plots represent night and day, respectively.
Evaluating phytoplankton photophysiology using flow cytometry measurements has the added advantage of allowing measured responses to be separated into different algal groups. During the current study, we found that the general depth- and time-resolved patterns in FL:FSC described above for the bulk phytoplankton population was also found in the Synechococcus, picoeukaryotes, and nanoeukaryotes fractions (Figures 5B–D, respectively). However, the dynamic range in FL:FSC changes was notably largest for Synechococcus and smallest for the nanoeukaryotes. The similarity in temporal developments of FL:FSC between taxa is more clearly shown in Figure 6 where each panel shows results for each group for a specific depth horizon.
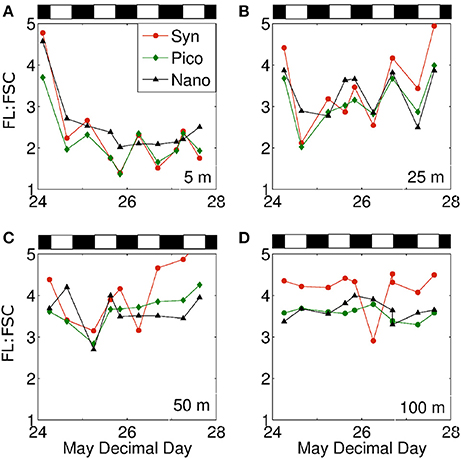
Figure 6. Mean cell fluorescence to forward scatter ratio at (A) 5 m, (B) 25 m, (C) 50 m, and (D) 100 m for Synechococcus (red), picophytoplankton (green), and nanophytoplankton (black) plotted against time. Black and white bars above plots represent night and day, respectively.
In addition to the overall temporal trends in FL:FSC discussed above, bulk and group-specific variation also exhibited clear daily oscillations. The driver of these oscillations can be further investigated by viewing time courses of FL and FSC independently (Figure 7). Here we see that for Synechococcos there was an overall downward trend in cell-specific FL and FSC over the time series, but that FSC showed a much stronger diel pattern than FL (Figure 7A). These diel cycles indicate strong cell cycle synchronization in the Synechococcos population, with cell size increasing during the day and decreasing at night, while cellular chlorophyll levels were more constant over time. Indeed, similar cell-cycle patterns have previously been used to quantify division rates for prokaryotic phytoplankton (Marie et al., 1997; Jacquet et al., 2001) and have been linked to diel cycles in optical parameters (Durand and Olson, 1996). A somewhat different pattern was observed during the current study for the picoeukaryote fraction (Figure 7B). In this case, both cell size and chlorophyll content exhibited clear diel cycles, suggesting a stronger diurnal accumulation in cellular chlorophyll. A very different pattern was observed for the nanoeukaryote group (Figure 7C). In this case, an overall temporal trend in cell-specific FL and FSC is not obvious and neither property exhibited clear diel cycles, suggesting perhaps a randomization of cell division in this subpopulation. The photoacclimation response of the nanoeukaryotes can be further interrogated by evaluating cellular fluorescence measured at 530 nm. This additional fluorescence measurement at similar wavelengths can provide information on phycoerythrin and other accessory pigments (Olson et al., 1988; Veldhuis and Kraay, 2000). What we find is that the time course of FL530 (Figure 7D) exhibits no diel structure for any group but does show a strong change for the nanoeukaryotes shortly after the onset of stratification (Figure 7D, dash dot line). This early shift in FL530 (but not FL692; Figure 7C) suggests that an adjustment in accessory pigments was an important component of the photoacclimation response for this group (or that a rapid shift in species composition took place). Unfortunately, sample analyses for detailed identification of the phytoplankton community members and their pigment composition is not yet available to address this intriguing finding.
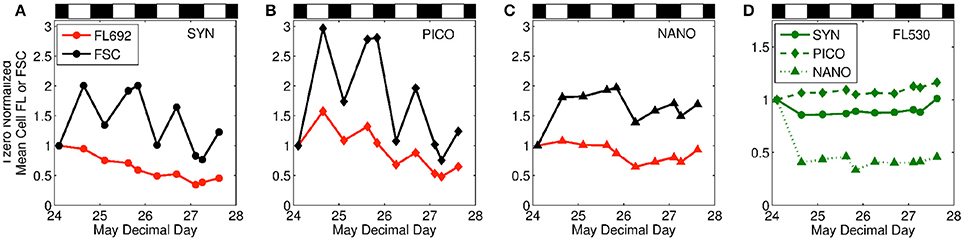
Figure 7. Mean cell fluorescence at 692 nm and forward scatter for surface samples of (A) Synechococcus, (B) picophytoplankton, (C) nanophytoplankton, and (D) mean cell fluorescence at 530 nm for all groups at the surface.
Fast Rate Repetition fluorometry (FRRf) measurements can provide additional insights on the bulk (i.e., not size fractioned) photophysiological response observed during our study. Specifically, FRRf measurements collected from the custom flow through system provide additional evidence of community photoacclimation in the surface ocean. Nighttime Fo and Fm vary to first order with Chl (Figure 8A) and are similar to increases observed in FL692 and FSC from the flow cytometer. The functional cross sectional area of photosystem II (σPSII), a parameter shown to track physiological status in relation to environmental conditions (Suggett et al., 2009 and refs therein), increased during our time on station (Figure 8B, filled triangles). One well-documented aspect of σPSII variability is that increases in σPSII are paralleled by decreases in Fv:Fm under conditions of nutrient starvation (Suggett et al., 2009). Similar changes are not observed, however, under steady-state nutrient stress (Parkhill et al., 2001; Kruskopf and Flynn, 2006; Suggett et al., 2009; Halsey et al., 2010). Here, the excitation wavelength of 490 nm does not fully capture changes in σPSII due to complimentary pigments that absorb more efficiently at other wavelengths. During our field observations, we found Fv:Fm remained nearly constant (Figure 8B, open squares) suggesting that the observed increases in σPSII were not associated with nutrient starvation. Instead, the changes in σPSII during our study likely reflect one component of photoacclimation during stratification (Suggett et al., 2009). Phytoplankton experiencing an increase in growth irradiance respond by reducing their light harvesting capacity. This can be accomplished by decreasing σPSII, decreasing the number of PSII complexes, or a combination of both responses (Falkowski and Owens, 1980). The observation of decreasing intercellular chlorophyll over time, evaluated here from changes in FL:FSC, paralleled by increasing σPSII indicates that the cells are reducing reaction center numbers to avoid photodamage while increasing the functional cross sectional area of antennae in order tomaintain carbon fixation rates. Following that the ratio F0:σPSII is an index of functional PSII numbers (Oxborough et al., 2012; Silsbe et al., 2015), we can normalize F0:σPSII to our proxy of phytoplankton biomass (FSC) and evaluate the relative change over our study period (Figure 8C, open diamonds). We find that the decrease in PSII:FSC is inversely related to the increase in σPSII (r2 = 0.91) (Figure 8C), lending some support for the above hypothesis regarding balances in σPSII and PSII number in response to increases in growth irradiance. Larger cross sectional areas in the surface ocean are thought to increase the likelihood of photodamage in a high light surface mixed layer (Barber and Andersson, 1992). Behrenfeld et al. (1998) presents evidence for maintenance of photosynthetic rates in high-light conditions and suggests that the “insensitivity of light-saturated photosynthesis (Pmax) to significant decreases in the number of functional PSII reaction centers” provides a buffer for maintaining light harvesting rates in the face of high-light damaging conditions. In contrast, he suggests that increasing cross sectional areas of these reactions centers provides a cost-effective means to maximize light harvesting in subsaturating light conditions. In other words, cells may employ photophysiological strategies that maintain constant photosynthetic rates throughout the range of growth irradiances they are likely to encounter in an actively mixing and dynamic light environment. Interestingly, our observed response is inconsistent with that of Barber and Andersson (1992) and Behrenfeld et al. (1998), in that we found an increase in σPSII with increasing light. One potential explanation for this discrepancy is that, perhaps, the changes in σPSII were also influenced by taxonomic shifts during the station occupation (Suggett et al., 2009). Modest shifts in community composition were observed during station occupation (Synechococcus (−3.2%), picoeukaryotes (+4.4%), nanoeukaryotes (−1.3%), expressed here as percentage of total community), but does point to the potential influence of this parameter on FRR interpretations and is generally consistent with the findings of Suggett et al. (2009). Clearly, additional work is needed to more fully understand the detailed underpinnings of high light acclimation.
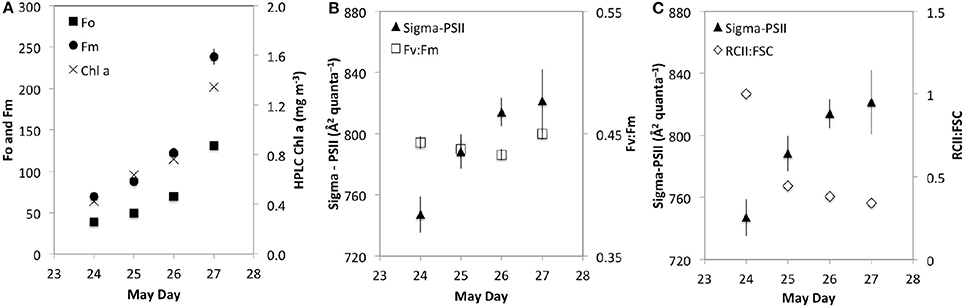
Figure 8. Fast Rate Repetition fluorometry (FRRf) nighttime averages of (A) Fo and Fm (left y-axis) and HPLC Chl a (right y-axis), (B) Sigma-PSII (left y-axis) and Fv:Fm (right y-axis) and (C) Sigma-PSII (left y-axis) and T0 normalized RCII:FSC. Error bars represent 1 standard deviation.
Using the flow cytometric measurements of FL692 and FSC as proxies for phytoplankton Chl and carbon, we were able to observe detailed photoacclimation responses in a natural community following a dramatic shift in daily light exposure. Previously, similar measurements have been used to characterize Chl:C changes during on-deck grazing and growth rate experiments (Gutiérrez-Rodríguez et al., 2010; Gutierrez-Rodriguez et al., 2011). During the current study, we observed the anticipated rapid acclimation of FL:FSC for a low-to-high light shift (e.g., 5 and 10 m samples during first day of restratification) and also the slower acclimation time-scale associated with an energy poor high-to-low light acclimation (e.g., 25 m sample after day 1). Indeed, the continued increase in FL:FSC for these cells until the end of our observational period suggests that a new steady-state FL:FSC value was never reached. These findings have significant implications for interpreting not only field observations but global satellite data as well.
Satellite retrievals of phytoplankton biomass and Chl:C (e.g., Behrenfeld et al., 2005; Westberry et al., 2008) provide an unprecedented opportunity for quantifying ocean productivity and carbon cycling. By calculating temporal anomalies in these properties and comparing them to changes in the physical environment (e.g., mixing depths, sea surface temperature), sustained satellite observations also can provide insights into how global ocean ecosystems might change in a warming climate (e.g., Behrenfeld et al., 2006; Siegel et al., 2013). However, accurately interpreting these signals relies on an accurate accounting of light-driven Chl:C variability (e.g., Behrenfeld et al., 2016). In all attempts to date, the description of photoacclimation applied to satellite Chl:C data assumes that the observed phytoplankton communities are under steady state growth conditions (i.e., a single photoacclimation relationship is applied) (e.g., Behrenfeld et al., 2005, 2016; Westberry et al., 2008; Silsbe et al., 2016). During the current study, we observed sustained changes in FL:FSC over the entire observational period, at least at some depths. Comparing these data to associated Eg values suggests applying a single relationship to describe the photoacclimation response may not be sufficient, both for our bulk data and group-specific data where different phytoplankton display greater or lesser variability in Chl:C (Figure 9). To be more specific, unbalanced growth in phytoplankton communities can compromise the interpretation of satellite Chl:C data. The unanswered question here is how common this condition is within the spatially and temporally averaged bins used for remote sensing data. For the current study, a period of unbalanced growth was induced by a storm, suggesting that one important consideration will be the time-scale of photoacclimation relative to storm frequency, recognizing that the former time-scale is dependent on the direction of the associated light shift (i.e., high-to-low or low-to-high). Clearly, additional work is needed to address these issues and, if unbalanced growth is a common feature, to develop approaches for parameterizing the consequences in global satellite Chl:C fields.
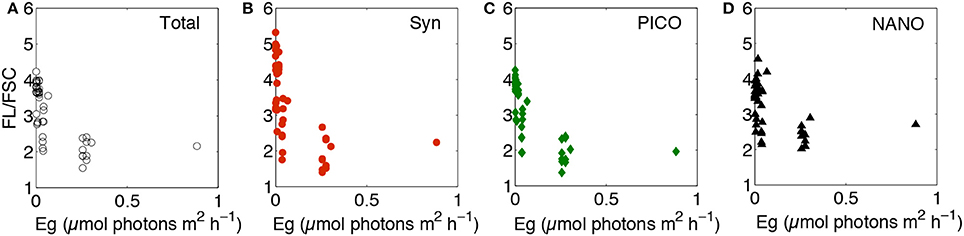
Figure 9. Mean fluorescence per forward scatter ratios plotted against growth irradiance (Eg) for (A) total community, (B) Synechococcus, (C) picophytoplankton, and (D) nanophytoplankton. Eg calculated using MLDs from density gradient approach. Data only includes samples from within the euphotic zone, i.e., where Eg > 1% surface irradiance.
Author Contributions
JG and MB contributed equally to the writing of this manuscript. Core data collection and analyses were undertaken by JG with significant contributions of ideas and concepts from MB.
Conflict of Interest Statement
The authors declare that the research was conducted in the absence of any commercial or financial relationships that could be construed as a potential conflict of interest.
Acknowledgments
We would like to thank the captain and crew of the R/V Atlantis for their exemplary support of the NASA NAAMES field program to date. We also thank our colleagues who collected supporting data and provided discussions on the light fields and physical dynamics of this study site; James G. Allen and David Siegel at UCSB, Nils Haëntjens and Emmanuel Boss and the University of Maine, and Peter Gaube at the Applied Physics Lab — University of Washington. NASA NAAMES is supported by Grant#NNX15AAF30G to MB.
References
Anning, T., MacIntyre, H. L., Pratt, S. M., Sammes, P. J., Gibb, S., and Geider, R. J. (2000). Photoacclimation in the marine diatom Skeletonema costatum. Limnol. Oceanogr. 45, 1807–1817. doi: 10.4319/lo.2000.45.8.1807
Barber, J., and Andersson, B. (1992). Too much of a good thing: light can be bad for photosynthesis. Trends Biochem. Sci. 17, 61–66. doi: 10.1016/0968-0004(92)90503-2
Behrenfeld, M. J., Boss, E., Siegel, D. A., and Shea, D. M. (2005). Carbon-based ocean productivity and phytoplankton physiology from space. Global Biogeochem. 19:GB1006. doi: 10.1029/2004GB002299
Behrenfeld, M. J., and Kolber, Z. S. (1999). Widespread iron limitation of phytoplankton in the South Pacific Ocean. Science 283, 840–843. doi: 10.1126/science.283.5403.840
Behrenfeld, M. J., Marañón, E., Siegel, D. A., and Hooker, S. B. (2002). A photoacclimation and nutrient based model of light-saturated photosynthesis for quantifying oceanic primary production. Mar. Ecol. Prog. Ser. 228, 103–117. doi: 10.3354/meps228103
Behrenfeld, M. J., O'Malley, R. T., Boss, E. S., Westberry, T. K., Graff, J. R., Halsey, K. H., et al. (2016). Revaluating ocean warming impacts on global phytoplankton. Nat. Clim. Change 6, 323–330. doi: 10.1038/nclimate2838
Behrenfeld, M. J., O'Malley, R. T., Siegel, D. A., McClain, C. R., Sarmiento, J. L., Feldman, G. C., et al. (2006). Climate-driven trends in contemporary ocean productivity. Nature 444, 752–755. doi: 10.1038/nature05317
Behrenfeld, M. J., Prasil, O., Kolber, Z. S., Babin, M., and Falkowski, P. G. (1998). Compensatory changes in photosystem II electron turnover rates protect photosynthesis from photoinhibition. Photosyn. Res. 58, 259–268. doi: 10.1023/A:1006138630573
Berman, T. (1972). Profiles of chlorophyll concentration by in vivo fluorescence: some limnological applications. Limnol. Oceanogr. 17, 616–618. doi: 10.4319/lo.1972.17.4.0616
Campbell, L., and Carpenter, E. J. (1986). Diel patterns of cell division in marine Synechococcus spp.(Cyanobacteria): use of the frequency of dividing cells technique to measure growth rate. Mar. Ecol. Prog. Ser. 139–148. doi: 10.3354/meps032139
Cetinić, I., Poulton, N., and Slade, W. H. (2016). Characterizing the phytoplankton soup: pump and plumbing effects on the particle assemblage in underway optical seawater systems. Opt. Express 24, 20703–20715. doi: 10.1364/OE.24.020703
Cloern, J. E., Grenz, C., and Vidergar-Lucas, L. (1995). An empirical model of the phytoplankton chlorophyll: carbon ratio - the conversion factor between productivity and growth rate. Limnol. Oceanogr. 40, 1313–1321. doi: 10.4319/lo.1995.40.7.1313
Cullen, J. J., and Lewis, M. R. (1988). The kinetics of algal photoadaptation in the context of vertical mixing. J. Plankton Res. 10, 1039–1063. doi: 10.1093/plankt/10.5.1039
de Boyer Montégut, C., Madec, G., Fischer, A. S., Lazar, A., and Iudicone, D. (2004). Mixed layer depth over the global ocean: an examination of profile data and a profile-based climatology. J. Geophys. Res. 109:C12003. doi: 10.1029/2004JC002378
Dong, S., Sprintall, J., Gille, S. T., and Talley, L. (2008). Southern Ocean mixed-layer depth from Argo float profiles. J. Geophys. Res. 113:C06013. doi: 10.1029/2006JC004051
Durand, M. D., and Olson, R. J. (1996). Contributions of phytoplankton light scattering and cell concentration changes to diel variations in beam attenuation in the equatorial Pacific from flow cytometric measurements of pico-, ultra-and nanoplankton. Deep Sea Res. Part II 43, 891–906. doi: 10.1016/0967-0645(96)00020-3
Falkowski, P. G., and LaRoche, J. (1991). Acclimation to spectral irradiance in algae. J. Phycol. 27, 8–14. doi: 10.1111/j.0022-3646.1991.00008.x
Falkowski, P. G., and Owens, T. G. (1980). Light-shad adaptation: two strategies in marine phytoplankton. Plant Physiol. 66, 592–595. doi: 10.1104/pp.66.4.592
Geider, R. J. (1987). Light and temperature dependence of the carbon to chlorophyll ratio in microalgae and cyanobacteria: implications for physiology and growth of phytoplankton. New Phytol. 106, 1–34. doi: 10.1111/j.1469-8137.1987.tb04788.x
Geider, R. J., MacIntyre, H. L., and Kana, T. M. (1997). Dynamic model of phytoplankton growth and acclimation: responses of the balanced growth rate and the chlorophyll a: carbon ratio to light, nutrient-limitation and temperature. Mar. Ecol. Prog. Ser. 148, 187–200. doi: 10.3354/meps148187
Graff, J. R., Westberry, T. K., Milligan, A. J., Brown, M. B., Olmo, G. D., Reifel, K. M., et al. (2016). Photoacclimation of natural phytoplankton communities. Mar. Ecol. Prog. Ser. 542, 51–62. doi: 10.3354/meps11539
Greene, R. M., Kolber, Z. S., Swift, D. G., Tindale, N. W., and Falkowski, P. G. (1994). Physiological limitation of phytoplankton photosynthesis in the eastern equatorial Pacific determined from variability in the quantum yield of fluorescence. Limnol. Oceanogr. 39, 1061–1074. doi: 10.4319/lo.1994.39.5.1061
Grob, C., Ostrowski, M., Holland, R. J., Heldal, M., Norland, S., Erichsen, E. S., et al. (2013). Elemental composition of natural populations of key microbial groups in Atlantic waters. Environ. Microbiol. 15, 3054–3064. doi: 10.1111/1462-2920.12145
Gutierrez-Rodriguez, A., Latasa, M., Agustí, S., and Duarte, C. M. (2011). Distribution and contribution of major phytoplankton groups to carbon cycling across contrasting conditions of the subtropical northeast Atlantic Ocean. Deep Sea Res. Part I 58, 1115–1129. doi: 10.1016/j.dsr.2011.08.003
Gutiérrez-Rodríguez, A., Latasa, M., Estrada, M., Vidal, M., and Marrasé, C. (2010). Carbon fluxes through major phytoplankton groups during the spring bloom and post-bloom in the Northwestern Mediterranean Sea. Deep Sea Res. Pt. I 57, 486–500. doi: 10.1016/j.dsr.2009.12.013
Halsey, K. H., and Jones, B. M. (2015). Phytoplankton strategies for photosynthetic energy allocation. Ann. Rev. Mar. Sci. 7, 265–297. doi: 10.1146/annurev-marine-010814-015813
Halsey, K. H., Milligan, A. J., and Behrenfeld, M. J. (2010). Physiological optimization underlies growth rate-independent chlorophyll-specific gross and net primary production. Photosyn. Res. 103, 125–137. doi: 10.1007/s11120-009-9526-z
Havelková-Doušová, H., Prášil, O., and Behrenfeld, M. J. (2004). Photoacclimation of Dunaliella tertiolecta (Chlorophyceae) under fluctuating irradiance. Photosynthetica 42, 273–281. doi: 10.1023/B:PHOT.0000040600.04502.32
Heldal, M., Scanlan, D. J., Norland, S., Thingstad, F., and Mann, N. H. (2003). Elemental composition of single cells of various strains of marine Prochlorococcus and Synechococcus using X-ray microanalysis. Limnol. Oceanogr. 48, 1732–1743. doi: 10.4319/lo.2003.48.5.1732
Heywood, J. L., Zubkov, M. V., Tarran, G. A., Fuchs, B. M., and Holligan, P. M. (2006). Prokaryoplankton standing stocks in oligotrophic gyre and equatorial provinces of the Atlantic Ocean: evaluation of inter-annual variability. Deep Sea Res. Pt. II 53, 1530–1547. doi: 10.1016/j.dsr2.2006.05.005
Holte, J., and Talley, L. (2009). A new algorithm for finding mixed layer depths with applications to Argo data and Subantarctic Mode Water formation. J. Atmos. Ocean Tech. 26, 1920–1939. doi: 10.1175/2009JTECHO543.1
Jacquet, S., Partensky, F., Lennon, J. F., and Vaulot, D. (2001). Diel patterns of growth and division in marine picoplankton in culture. J. Phycol. 37, 357–369. doi: 10.1046/j.1529-8817.2001.037003357.x
Kruskopf, M., and Flynn, K. J. (2006). Chlorophyll content and fluorescence responses cannot be used to gauge reliably phytoplankton biomass, nutrient status or growth rate. New Phytol. 169, 525–536. doi: 10.1111/j.1469-8137.2005.01601.x
Laws, E. A., and Bannister, T. T. (1980). Nutrient- and light-limited growth of Thalassiosira fluviatilis in continuous culture, with implications for phytoplankton growth in the ocean. Limnol. Oceanogr. 25, 457–473. doi: 10.4319/lo.1980.25.3.0457
Lee, H. Y., Hong, Y. N., and Chow, W. S. (2001). Photoinactivation of photosystem II complexes and photoprotection by nonfunctional neighbours in Capsicum annuum L. leaves. Planta 212, 332–342. doi: 10.1007/s004250000398
MacIntyre, H. L., Kana, T. M., Anning, T., and Geider, R. J. (2002). Photoacclimation of photosynthesis irradiance response curves and photosynthetic pigments in microalgae and cyanobacteria. J. Phycol. 38, 17–38. doi: 10.1046/j.1529-8817.2002.00094.x
Marañón, E., Holligan, P. M., Varela, M., Mouriño, B., and Bale, A. J. (2000). Basin-scale variability of phytoplankton biomass, production and growth in the Atlantic Ocean. Deep Sea Res. Pt. I 47, 825–857. doi: 10.1016/S0967-0637(99)00087-4
Marie, D., Partensky, F., Jacquet, S., and Vaulot, D. (1997). Enumeration and cell cycle analysis of natural populations of marine picoplankton by flow cytometry using the nucleic acid stain SYBR Green I. Appl. Environ. Microb. 63, 186–193.
Milligan, A. J., Aparicio, U. A., and Behrenfeld, M. J. (2012). Fluorescence and nonphotochemical quenching responses to simulated vertical mixing in the marine diatom Thalassiosira weissflogii. Mar. Ecol. Prog. Ser. 448, 67–78. doi: 10.3354/meps09544
Moore, C. M., Suggett, D. J., Hickman, A. E., Kim, Y. N., Tweddle, J. F., Sharples, J., et al. (2006). Phytoplankton photoacclimation and photoadaptation in response to environmental gradients in a shelf sea. Limnol. Oceanogr. 51, 936–949. doi: 10.4319/lo.2006.51.2.0936
Olson, R. J., Chisholm, S. W., Zettler, E. R., and Armbrust, E. V. (1988). Analysis of Synechococcus pigment types in the sea using single and dual beam flow cytometry. Deep Sea Res. 35, 425–440. doi: 10.1016/0198-0149(88)90019-2
Osmond, C. B. (1994). “What is photoinhibition? Some insights from com- parisons of shade and sun plants,” in Photoinhibition of Photosynthesis: From Molecular Mechanisms to the Field, eds N. R. Baker and J. R. Bowyer (Oxford, UK: BIOS Scientific Publisher), 1–24.
Oxborough, K., Moore, C. M., Suggett, D. J., Lawson, T., Chan, H. G., and Geider, R. J. (2012). Direct estimation of functional PSII reaction center concentration and PSII electron flux on a volume basis: a new approach to the analysis of Fast Repetition Rate fluorometry (FRRf) data. Limnol. Oceanogr. Meth. 10, 142–154. doi: 10.4319/lom.2012.10.142
Parkhill, J. P., Maillet, G., and Cullen, J. J. (2001). Fluorescence-based maximal quantum yield for PSII as a diagnostic of nutrient stress. J. Phycol. 37, 517–529. doi: 10.1046/j.1529-8817.2001.037004517.x
Prasil, O., Adir, N., and Ohad, I. (1992). “Dynamics of photosystem II: mechanism of photoinhibition and recovery processes,” in The Photosystems: Structure, Function and Molecular Biology, ed J. Barber (Amsterdam: Elsevier), 295–348.
Shuter, B. (1979). A model of physiological adaptation in unicellular algae. J. Theor. Biol. 78, 519–552. doi: 10.1016/0022-5193(79)90189-9
Siegel, D. A., Behrenfeld, M. J., Maritorena, S., McClain, C. R., Antoine, D., Bailey, S. W., et al. (2013). Regional to global assessments of phytoplankton dynamics from the SeaWiFS mission. Remote Sens. Environ. 135, 77–91. doi: 10.1016/j.rse.2013.03.025
Silsbe, G. M., Behrenfeld, M. J., Halsey, K. H., Milligan, A. J., and Westberry, T. K. (2016). The CAFE model: a net production model for global ocean phytoplankton. Global Biogeochem. 30, 1756–1777. doi: 10.1002/2016GB005521
Silsbe, G. M., Oxborough, K., Suggett, D. J., Forster, R. M., Ihnken, S., Komárek, O. Simis, S. G., et al. (2015). Toward autonomous measurements of photosynthetic electron transport rates: an evaluation of active fluorescence-based measurements of photochemistry. Limnol. Oceanogr. Meth. 13, 138–155. doi: 10.1002/lom3.10014
Suggett, D. J., Moore, C. M., Hickman, A. E., and Geider, R. J. (2009). Interpretation of fast repetition rate (FRR) fluorescence: signatures of phytoplankton community structure versus physiological state. Mar. Ecol. Prog. Ser. 376, 1–19. doi: 10.3354/meps07830
Tarran, G. A., Heywood, J. L., and Zubkov, M. V. (2006). Latitudinal changes in the standing stocks of nano- and picoeukaryotic phytoplankton in the Atlantic Ocean. Deep Sea Res. Pt. II 53, 1516–1529. doi: 10.1016/j.dsr2.2006.05.004
Van Heukelem, L., and Thomas, C. S. (2001). Computer-assisted high-performance liquid chromatography method development with applications to the isolation and analysis of phytoplankton pigments. J. Chromatogr. A 910, 31–49. doi: 10.1016/S0378-4347(00)00603-4
Veldhuis, M. J., and Kraay, G. W. (1990). Vertical distribution and pigment composition of a picoplanktonic prochlorophyte in the subtropical North Atlantic: a combined study of HPLC-analysis of pigments and flow cytometry. Mar. Ecol. Prog. Ser. 68, 121–127. doi: 10.3354/meps068121
Veldhuis, M. J., and Kraay, G. W. (2000). Application of flow cytometry in marine phytoplankton research: current applications and future perspectives. Sci. Mar. 64, 121–134. doi: 10.3989/scimar.2000.64n2121
Westberry, T., Behrenfeld, M. J., Siegel, D. A., and Boss, E. (2008). Carbon-based primary productivity modeling with vertically resolved photoacclimation. Global Biogeochem. 22:GB2024. doi: 10.1029/2007GB003078
Keywords: phytoplankton, photoacclimation, growth irradiance, FRRf, flow cytometry, deep mixing, buoyancy frequency, remote sensing
Citation: Graff JR and Behrenfeld MJ (2018) Photoacclimation Responses in Subarctic Atlantic Phytoplankton Following a Natural Mixing-Restratification Event. Front. Mar. Sci. 5:209. doi: 10.3389/fmars.2018.00209
Received: 30 January 2018; Accepted: 28 May 2018;
Published: 14 June 2018.
Edited by:
Sophie Rabouille, UMR7093 Laboratoire d'Océanographie de Villefranche (LOV), FranceReviewed by:
Mark Moore, University of Southampton, United KingdomPedro Echeveste, University of Antofagasta, Chile
Copyright © 2018 Graff and Behrenfeld. This is an open-access article distributed under the terms of the Creative Commons Attribution License (CC BY). The use, distribution or reproduction in other forums is permitted, provided the original author(s) and the copyright owner are credited and that the original publication in this journal is cited, in accordance with accepted academic practice. No use, distribution or reproduction is permitted which does not comply with these terms.
*Correspondence: Jason R. Graff, anJncmFmZkBzY2llbmNlLm9yZWdvbnN0YXRlLmVkdQ==