 Nauzet Hernández-Hernández1
 Lennart T. Bach2
 María F. Montero1
 Jan Taucher2
 Isabel Baños1Wanchun Guan2,3Mario Espósito2
 Andrea Ludwig2
 Eric P. Achterberg2
 Ulf Riebesell2
 Javier Arístegui1*
- 1Instituto de Oceanografía y Cambio Global, Universidad de Las Palmas de Gran Canaria, Las Palmas, Spain
- 2GEOMAR Helmholtz Center for Ocean Research, Kiel, Germany
- 3Department of Marine Biotechnology, School of Laboratory Medicine and Life Science, Wenzhou Medical University, Wenzhou, China
The subtropical oceans are home to one of the largest ecosystems on Earth, contributing to nearly one third of global oceanic primary production. Ocean warming leads to enhanced stratification in the oligotrophic ocean but also intensification in cross-shore wind gradients and thus in eddy kinetic energy across eastern boundary regions of the subtropical gyres. Phytoplankton thriving in a future warmer oligotrophic subtropical ocean with enhanced CO2 levels could therefore be patchily fertilized by increased mesoscale and submesoscale variability inducing nutrient pumping into the surface ocean. Under this premise, we have tested the response of three size classes (0.2–2, 2–20, and >20 μm) of subtropical phytoplankton communities in terms of primary production, chlorophyll and cell biomass, to increasing CO2 concentrations and nutrient fertilization during an in situ mesocosm experiment in oligotrophic waters off of the island of Gran Canaria. We found no significant CO2-related effect on primary production and biomass under oligotrophic conditions (phase I). In contrast, primary production, chlorophyll and biomass displayed a significant and pronounced increase under elevated CO2 conditions in all groups after nutrient fertilization, both during the bloom (phase II) and post-bloom (phase III) conditions. Although the relative increase of primary production in picophytoplankton (250%) was 2.5 higher than in microphytoplankton (100%) after nutrient fertilization, comparing the high and low CO2 treatments, microphytoplankton dominated in terms of biomass, contributing >57% to the total. These results contrast with similar studies conducted in temperate and cold waters, where consistently small phytoplankton benefitted after nutrient additions at high CO2, pointing to different CO2-sensitivities across plankton communities and ecosystem types in the ocean.
Introduction
With a surface area of more than 200 million square kilometers, subtropical oligotrophic waters form the largest ecosystem of the worlds' surface oceans, covering more than 60% of total ocean surface (Longhurst et al., 1995). These extensive areas are typically characterized by a deep and nutrient-poor mixed layer, which is prevented from mixing with deeper nutrient-rich waters by a strong, almost permanent thermocline. Consequently, both phytoplankton biomass and primary production are low during most of the year. Despite its low productivity per surface area (Longhurst et al., 1995), more than 30 million tons of carbon dioxide (CO2) are photosynthetically fixed into organic compounds every day, contributing nearly one third of total oceanic primary production (Field et al., 1998; Behrenfeld et al., 2001, 2006), and thus playing a key role in the global carbon cycle (Falkowski, 1994; Falkowski et al., 2000).
Climate change is inducing physical and chemical changes in the marine environment, with profound consequences for ocean productivity (Bopp et al., 2001; Gruber, 2011; Doney et al., 2012; IPCC, 2014). The anthropogenic release of CO2 through human activity since the beginning of the industrial revolution is leading to an increase of the partial pressure of this greenhouse gas in the ocean, and consequently both pH and calcium carbonate saturation states (Ω) are declining rapidly, a process termed “ocean acidification” (Caldeira and Wickett, 2003; Sarmiento et al., 2004). Furthermore, as a consequence of increasing atmospheric greenhouse gas concentrations, the surface ocean is warming at a higher rate than the deep ocean, which may lead to a strengthening of the water column stratification (IPCC, 2014 and references therein).
Whereas increasing oceanic CO2 levels are hypothesized to boost ocean productivity by relieving CO2 limitation of the Ribulose-1,5-biphosphate carboxylase/oxygenase (RubisCO) enzyme (Beardal and Raven, 2004; Reinfelder, 2011; Mackey et al., 2015), a more stratified ocean would lead to a decrease in nutrient supply to the euphotic layer and therefore a potential reduction of autotrophic productivity (Bopp et al., 2001; Steinacher et al., 2010). Nevertheless, it has been predicted that the heterogeneous warming of oceans and continents, may enhance upwelling-favorable winds in Eastern Boundary Current Systems (Bakun, 1990; Sydeman et al., 2014; García-Reyes et al., 2015). Stronger cross-shore wind gradients would lead to an intensification of the eddy kinetic energy fields across eastern boundary regions of the subtropical Gyres, favoring the upward pumping of nutrients driven by upwelling processes. Phytoplankton thriving in a future warmer and acidified oligotrophic subtropical ocean could therefore be patchily fertilized by increased mesoscale and submesoscale processes inducing nutrient pumping into the ocean surface.
Investigations of CO2-related effects on marine productivity have experienced a remarkable surge over the last years (Riebesell and Gattuso, 2015). Theoretical studies based on chlorophyll-dependent models predict a decrease in phytoplankton chlorophyll concentration, and consequently in primary production, in a warmer, acidified and more stratified ocean (Behrenfeld et al., 2006; Marinov et al., 2010; Steinacher et al., 2010). On the other hand, experimental studies have reported contrasting results about the potential effects of increasing CO2 on marine productivity in natural assemblages (Table 1). Whereas, some authors reported increased photosynthetic rates with increasing CO2 (Hein and Sand-Jensen, 1997; Riebesell et al., 2007; Bellerby et al., 2008; Tortell et al., 2008; Egge et al., 2009; Engel et al., 2013; Eberlein et al., 2017), others have not observed significant relationships between marine productivity and ocean acidification (Tortell et al., 2002; Delille et al., 2005; Hare et al., 2007; Feng et al., 2009; Tanaka et al., 2013; Maugendre et al., 2017). Most of the experiments, however, have been carried out in nutrient-rich systems, with only a few performed in low-nutrient regions (Yoshimura et al., 2009; Maugendre et al., 2017). Thus, there is a severe lack of information on how ocean acidification could affect primary production in subtropical oligotrophic regions.
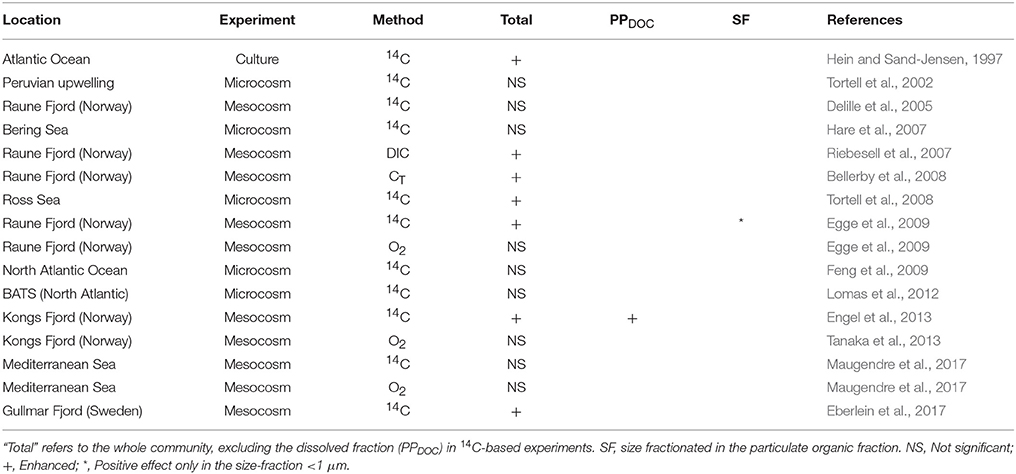
Table 1. Published studies on the effect of ocean acidification on primary production in plankton communities.
This study investigates how an acidified and patchily fertilized subtropical ocean impacts marine autotrophic productivity. For this, we carried out a mesocosm experiment off the coast of Gran Canaria (Canary Islands) during the autumn of 2014. We studied the response of size-fractionated primary production, chlorophyll a and biomass of the phytoplankton community to enhanced CO2 levels and nutrient fertilization to investigate which size-fraction, if any, responds more readily to these short-term perturbations.
Methods
Set-up and Sampling
The experiment was carried out in Gando Bay (27°55′ 41′′ N, 15° 21′ 55′′ W), Gran Canaria (Canary Island), as part of the BIOACID (Biological Impacts of Ocean ACIDification) project. Nine KOSMOS (Kiel Off-Shore Mesocosms for future Ocean Simulations; Riebesell et al., 2013) were deployed and enclosed ~35 m3 of low-nutrient low-chlorophyll water off the east coast of Gran Canaria. In order to achieve a pCO2 gradient from ~400 μatm to partial pressures corresponding to the year 2150 (~1,000 μatm) according to the RCP8.5 scenario (IPCC, 2014), seven mesocosms were gradually enriched at the start of the experiment over a period of 7 days (from t0 to t6), via the addition of different amounts of filtered CO2-saturated seawater. Unfortunately, one of the high-CO2 mesocosms (M6) was damaged on t26, and hence was not considered in the data analyses. Two more CO2 addition were carried out on t24 and t38 to counteract the loss of CO2 due to outgassing and biological uptake. The average pCO2 concentrations along the whole experiment for each of the remaining six mesocosms were: M5 (448 μatm), M3 (563 μatm), M7 (668 μatm), M4 (716 μatm), M2 (887 μatm), and M8 (1025 μatm). Two other mesocosms -M1 (369 μatm) and M9 (352 μatm)- remained untreated, serving as controls (ambient pCO2) (Figure 1). The volumes of CO2-saturated seawater added to achieve the pCO2 gradient varied from 77 L in M5 to 382 L in M8. After 24 days, between 7.5 and 9.0 m3 of nutrient-rich deep water was added to each mesocosm with the purpose of simulating a natural fertilization event (Figure 2). During the 56 day experimental period, integrated water samples (0–13 m) were collected by means of depth-integrated water samplers (IWS, HYDRO-BIOS, Kiel), on days −1, 1, 5, 9, 13, 17, 21, 25, 27, 29, 31, 33, 35, 37, 41, 45, 50, and 55, from each of the nine mesocosms, plus an extra sample from ambient waters outside the mesocosms (referred to as Atlantic; A). Once on land, subsamples were taken for primary production, chlorophyll a, phytoplankton abundances, as well as for dissolved inorganic carbon and inorganic nutrients. More detailed information concerning the experimental set-up (CO2 manipulation, deep water addition, sampling, etc.) is provided by Taucher et al. (2017).
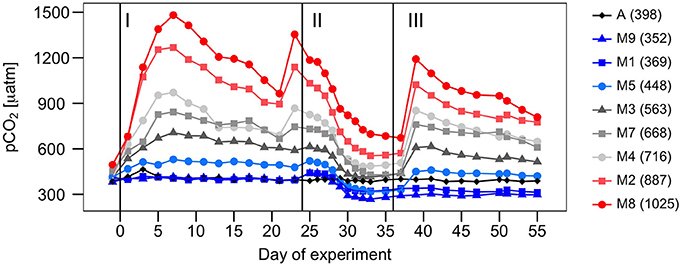
Figure 1. Temporal development of pCO2 (μatm) over the course of the experiment in the mesocosms (MX) and the surrounding Atlantic waters (A). Vertical lines separate the three phases of the experiment. Values in parentheses indicate average pCO2 concentrations for each mesocosm along the whole experiment.
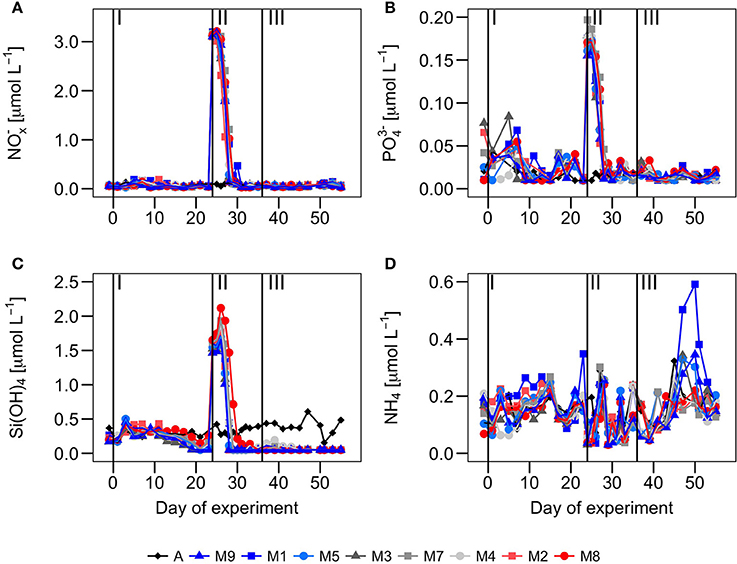
Figure 2. Temporal development of (A) nitrate + nitrite (NOx−) (μmol·L−1), (B) phosphate (μmol·L−1), (C) silicate (μmol·L−1) and (D) ammonium (μmol·L−1) over the course of the experiment. Vertical lines separate the three phases of the experiment.
pCO2 and Inorganic Nutrients
Partial pressure of CO2 (pCO2) was derived from total alkalinity (TA) and dissolved inorganic carbon (DIC) data, following Pierrot et al. (2006) and Lueker et al. (2000). TA was measured by means of a Metrohm 862 Compact Titrosampler and a 907 Titrando unit. DIC was determined by infrared absorption using a LI-COR LI-700 on an ARICA system (MIRANDA, Kiel). Inorganic nutrients (, , , and Si(OH)4) were determined by colorimetric methods following Murphy and Riley (1962) and Hansen and Grasshoff (1983). Ammonium () was fluorometrically analyzed following Holmes et al. (1999). A SEAL Analytical QuAAtro AutoAnalyzer connected to a JASCO Model FP-2020 Intelligent Fluorescence Detector and a SEAL Analytical XY2 autosampler was used to measure , , , Si(OH)4, and For details on the methodology of these measurements see Taucher et al. (2017).
Chlorophyll a
For chlorophyll a analysis, 500 ml of sea water were sampled and filtered sequentially through 20, 2, and 0.2 μm pore-size Whatman polycarbonate filters under low vacuum pressure. Filters were kept frozen at −20°C until analysis. Before chlorophyll determination, pigments were extracted using 10 ml of 90% acetone at 4°C in the dark for 24 h. Extracts were measured fluorometrically, before and after acidification, by means of a Turner Designs bench fluorometer 10-AU, previously calibrated with pure chlorophyll a (Sigma Chemical), following Holm-Hansen et al. (1965). The collected material on the 20, 2, and 0.2 μm filters was used to measure the corresponding microplankton (ChlMicro), nanoplankton (ChlNano) and picoplankton (ChlPico) chlorophyll concentrations, respectively. Total chlorophyll (ChlTot) was derived from the sum of the three size fractions.
Phytoplankton Abundance and Biomass
Prochlorococcus and Synechococcus type cyanobacteria and small photosynthetic eukaryotic cells (picoeukaryotes) were enumerated with a FACScalibur (Becton and Dickinson) flow cytometer. Picoeukaryotes, Prochlorococcus and Synechococcus samples (about 1 mL) were analyzed in fresh material 30–60 min after subsampling from the carboys. Prochlorococcus were recurrently observed in Atlantic waters, but vanished inside all the mesocosms after 2 days. Thus, we did not use their abundances to compute biomass. Phytoplankton groups were identified by their signatures in a plot of side scatter (SSC) vs. red (FL3) and orange (FL2) fluorescence. Samples were run at 60 μL min−1. A suspension of yellow–green 1 μm latex beads (~105 beads mL−1) was added as an internal standard (Polysciences, Inc.). Pigmented nanoeukaryotes (2–20 μm) were counted on fresh samples with a Cytobuoy cytometer (Dubelaar and Gerritzen, 2000), provided with flow-image. Samples (about 3 ml) were analyzed in vivo for 7 min at a flow rate of 300 μL min−1. Microphytoplankton (mostly diatoms and dinoflagellates) were fixed with alkaline Lugol's iodine (1% final concentration), sedimented in Utermöhl chambers and counted by means of an inverted microscope (Utermöhl, 1931).
Biomass of Synechococcus and picoeukaryotes were estimated by multiplying their abundances by the average cell carbon content obtained for each group, using the conversion factors obtained by MF Montero (unpublished) from samples collected in coastal waters of Gran Canaria: 120 fgC/cell (Synechococcus), 420 fgC/cell (picoeukaryotes). Nanoeukaryotes' abundances were converted into biomass using an estimated average biovolume of 20 μm−3 for organisms between 2 and 6 μm and a biovolume of 125 μm−3 for organisms between 6 and 11 μm, applying the conversion factor of 220 fgC μm−3 proposed by Borsheim and Bratbak (1987). Biovolumes and conversion factors used for diatoms and dinoflagellates were calculated following Menden-Deuer and Lessard (2000). Picoplankton biomass (BPico) was calculated as the sum of the biomasses of Synechococcus and picoeukaryotes, nanoplankton biomass (BNano) as the sum of all nanoeukaryotes' biomass, and microplankton biomass (BMicro) as the sum of the diatoms and dinoflagellates biomass. Total biomass (BTot) refers to the sum of all size fractions.
14C-Based Primary Production
Primary production was measured using the 14C method. Four culture flasks per mesocosm, and per ambient Atlantic seawater sample, were filled with 70 ml of water, and inoculated with 15 μCi of 14C-labeled sodium bicarbonate solution (NaH14CO3; Perkin Elmer). Three of them were in vitro incubated for 12 h in a temperature-controlled chamber reproducing in situ daily average light and temperature, while the remaining flask was incubated at the same temperature under complete darkness to measure the dark carbon uptake. Sixty milliliter of the samples were filtered with a vacuum pump sequentially through 20, 2, and 0.2 μm pore-size Whatman polycarbonate filters, to allow calculation of the particulate organic carbon fixed by microplankton (PPMicro), nanoplankton (PPNano) and picoplankton (PPPico), respectively. The total particulate organic carbon production (PPPOC) was derived from the sum of the three size fractions. Filters were then placed in 4 ml scintillation vials and exposed to concentrated HCl fumes overnight to remove 14C-labeled inorganic carbon. To estimate the amount of carbon fixation into the dissolved organic carbon fraction (PPDOC), 5 ml of water sample was gently filtered onto 0.2 μm Whatman polycarbonate filter under low vacuum pressure. The filtrate was transferred to a 20 ml scintillation vial. Liquid samples were acidified with 100 μl of 50% HCl and placed in an orbital oscillator for 24 h. Finally, scintillation cocktail (Ultima Gold XR) was added to every sample, thoroughly mixed, and stored in darkness for another 24 h, prior to measuring radioactivity in a scintillation counter Beckman LS-6500. Primary production (μg C·L−1·h−1) was calculated according to:
where VS is the volume of the sample (ml); VF the filtered volume (ml); DIC the dissolved inorganic carbon of the sample (μg C·L−1); DPMS the disintegration per minute of the samples; DPMD the disintegration per minute of the dark-incubated samples; DPMA total initial addition of 14C and ti the incubation time (h).
The percentage of extracellular carbon release (PER) was calculated as:
being PPTOT the sum of PPDOC and PPPOC
Statistical Analysis
To investigate the potential effects of ocean acidification on autotrophic productivity throughout the three phases of the experiment, model II (Reduced Major Axis) linear regressions (Sokal and Rohlf, 2013) between primary production, chlorophyll and biomass and pCO2 concentrations were performed for each phase using Matlab (The MathWorks, Inc, Natick, Massachusetts, United States). For that purpose, all datasets were averaged per mesocosm and phase. The confidence level for all analysis was set at 95% (p < 0.05).
Results
Temporal Development of Size-Fractionated Chlorophyll a and Autotrophic Biomass
Nutrient concentrations (Figure 2), together with the development of chlorophyll and biomass (Figures 3, 4), allowed the differentiation of three well-defined phases over the experimental period: The pre-bloom phase (I), from t1 to t23; the bloom phase (II), from t25 to t35; and the post-bloom phase (III), from t37 until the end of the experiment (t55).
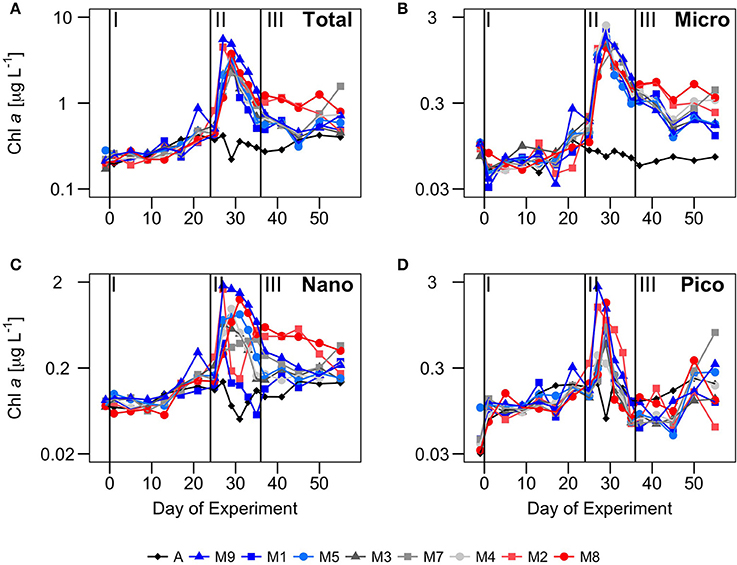
Figure 3. Temporal development of chlorophyll a (μg · L−1) in different size fractions: (A) total (ChlTot), (B) microplankton (ChlMicro), (C) nanoplankton (ChlNano) and (D) picoplankton (ChlPico) over the course of the experiment. Vertical lines defined the three phases of the experiment.
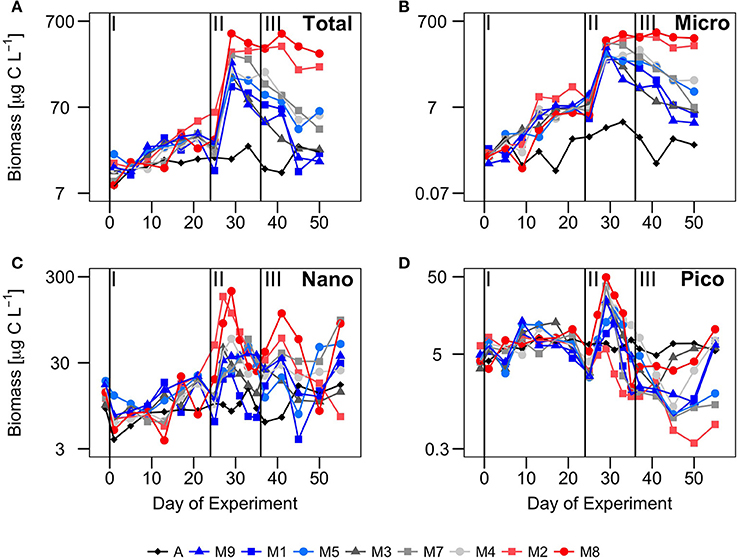
Figure 4. Temporal development of biomass (μg C·L−1) in different size fractions: (A) total (BTot), (B) microplankton (BMicro), (C) nanoplankton (BNano) and (D) picoplankton (BPico) over the course of the experiment. Vertical lines defined the three phases of the experiment.
During phase I, the waters inside the mesocosms were characterized by relatively low nutrient concentrations (similar to ambient Atlantic waters), low ChlTot, and low BTot (Figures 2– 4). Two to three days after enclosing the water inside the mesocosm bags (t1-t2), the concentration of all inorganic nutrients slightly increased both inside the mesocosms and in Atlantic waters. This suggests the influence of external inputs; perhaps caused by dust deposition on the surface waters (since during those days there was aerosols deposition with dust originating from NW Africa). Nitrate, phosphate and silicate displayed relative maxima around t5, dropping after t10 and reaching minimum values at t23. Ammonia peaked around t10−15 and dropped to minimum values around t20. The largest decrease in the meosocosm nutrient concentrations compared to the Atlantic waters was in the silicates, as a result of its consumption by diatoms (Taucher et al., 2017).
Total chlorophyll and biomass increased from t0 to t23, following a general inverse trend with nutrient concentrations (Figure 3). However, there were contrasting patterns between chlorophyll and biomass in the different size-fractions. There were no significant differences in chlorophyll concentrations between the mesocosms and Atlantic waters in any of the size fractions (Figure 3). In contrast, there were significant differences in biomass in the largest size fractions between mesocosms and Atlantic waters, suggesting a dominance of large mixotrophic organisms inside the mesocosms (Figure 4). Figure 5 illustrates the relative contributions of the different size fractions (averaged from all the mesocosms) to chlorophyll, biomass and primary production over the course of the experiment. During phase I, picophytoplankton (Pico) contributed >40% to ChlTot, but < 40% to BTot, with no significant differences with ambient waters. Nanophytoplankton (Nano) contributed 30–35% to ChlTot, but dominated in biomass (about 50%), although differences between mesocosms and Atlantic waters were not significant. Diatoms and dinoflagellates (Micro) contributed about 25% to ChlTot but only 10–20% to BTot, with clear differences with respect to Atlantic waters, particularly after t10.
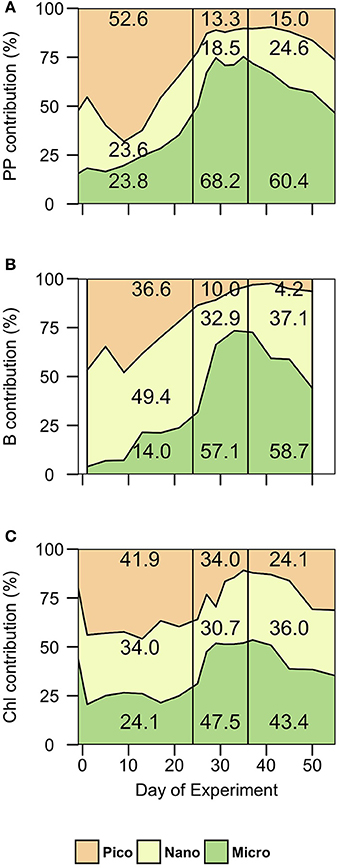
Figure 5. Contribution (%) of each size fraction to (A) total particulate primary production (PP), (B) total biomass, and (C) total chlorophyll (Chl) in phase I (t1-t24), phase II (t25-t35) and phase III (t36-t55). Micro, microplankton; Nano, nanoplankton; Pico, picoplankton.
Following the nutrient fertilization at t24, ChlTot and BTot increased exponentially reaching maximum average values (3.4 ± 0.5 and 244 ± 122 μg C·L−1, respectively) at t29 (Figures 3, 4). Consequently, nutrient concentrations were rapidly utilized inside the mesocosms, dropping to levels similar to the Atlantic waters when the phytoplankton bloom was at its peak (Figure 2). There was an exception with silicates, whose values dropped even below the Atlantic values after the bloom, as result of the large consumption by diatoms during phases II and III (Taucher et al., 2017). M8 and M2, the two mesocosms with highest CO2 concentrations, were markedly elevated in biomass, both in the Micro and Nano fractions, compared to the other mesocosms (Figure 3). With the depletion of inorganic nutrients, the levels of chlorophyll as well as biomass decreased in the Pico and Nano fractions, with a change in the slopes at t36, when nutrients were almost exhausted. Biomass of Micro decreased more smoothly, maintaining high values in the high CO2 treatments during the start of phase III. chlorophyll and biomass in phase II were dominated by Micro, contributing 40–60%, with a slightly higher dominance in biomass than in chlorophyll. In contrast, Pico contributed on average only 10–35% to chlorophyll and biomass inside the mesocosms, with values significantly lower than in the Atlantic waters.
During phase III, nutrient concentrations remained low (Figure 2), with nitrate and phosphate occurring at similar levels compared to Atlantic waters, but silicate was almost depleted (due to the consumption by diatoms) to levels < 0.08 μM, significantly below those of Atlantic waters. Only ammonium showed higher concentrations in some of the mesocosms, compared to Atlantic waters and phases I and II, probably due to higher excretion rates of grazers during this phase. Although ChlTot and BTot decreased with respect to phase II, they were still markedly higher than in Atlantic waters. The contribution of the larger size fractions to chlorophyll and biomass were always higher in the mesocosms than in Atlantic waters, but with apparent differences between chlorophyll and biomass (Figure 5). Pico contributed in general to near 45% of ChlTot and 35% to BTot in Atlantic waters compared to < 25% of ChlTot and < 10% of BTot in the mesocosms. Nano and Micro contributed almost evenly to ChlTot in the mesocosms, but not to biomass.
Dynamics of Size-Fractionated 14C-Based Primary Production
Total primary production in the particulate fraction (PPPOC) displayed average rates in the mesocosms (0.93 ± 0.48 μg C·L−1·h−1) that were almost double than in Atlantic waters (0.56 ± 0.24 μg C·L−1·h−1) at the start of the experiment. Like chlorophyll and biomass, the rates increased 4 to 5-fold peaking at t10−12 in all size fractions (although more for the Pico), to decrease again to initial rates, just before nutrient fertilization (Figure 6). The greatest differences between Atlantic waters and mesocosms were observed in Pico. This fraction contributed >50% to PPPOC in phase I, compared to ~30% in Atlantic waters.
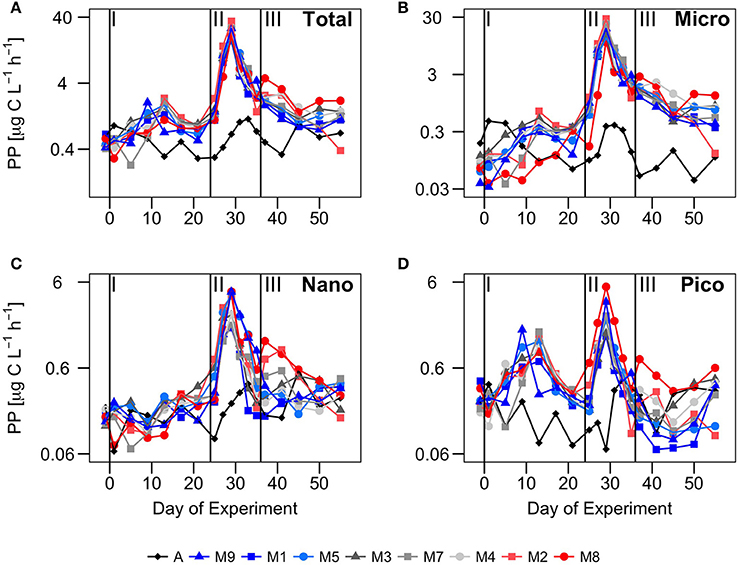
Figure 6. Temporal development of primary production (μg C·L−1·h−1) in (A) the total particulate faction (Total), and in the (B) microplankton (Micro), (C) nanoplankton (Nano) and (D) picoplankton (Pico) size fractions, over the course of the experiment. Vertical lines defined the three phases of the experiment. PP is represented in log scale to better illustrate the differences among mesocosms.
After nutrient fertilization (phase II), PPPOC increased more than 15 fold in all mesocosms, peaking at t29 with the highest rates in M2, reaching 35 μg C·L−1·h−1, compared to values < 2 μg C·L−1·h−1 in Atlantic waters (Figure 6). Due to nutrient depletion, total PPPOC rates declined to < 4 μg C·L−1·h−1 at t35 (end of phase II). Micro contributed almost a 75% to total PPPOC, even more than to chlorophyll and biomass (Figure 5), while the contribution of Pico was about 10%.
During phase III, PPPOC rates declined more smoothly than in phase II, following nutrient depletion, with higher rates in the mesocosms with higher CO2 treatments (see following section). Like in phase II, the major contribution to total PPPOC was due to Micro (60–70%), while Pico and Nano contributed about 15–20% each.
The average rate of primary production contributing to the dissolved organic carbon fraction (PPDOC; Figure 7A) inside the mesocosms varied strongly during the course of the experiment, between 34.7 μg C·L−1·h−1 in mesocosm M2 during the bloom phase and 0.23 μg C·L−1·h−1 in mesocosm M7 during phase I. Its temporal development matched PPPOC dynamics, increasing with nutrient addition in t24. However, the percentage of extracellular organic carbon release (PER; Figure 7B) decreased from the first week of the experiment (average 26.7 ± 8.6 %), to t29, when primary production reached their maximum values and PER its average minimum value (7.1 ± 3.7 %). In Atlantic waters, PPDOC was similar (phase I) or lower (phases II and III) than in the experiments, but with higher and less stable PER, ranging from < 10 to 35% (Figure 7B).
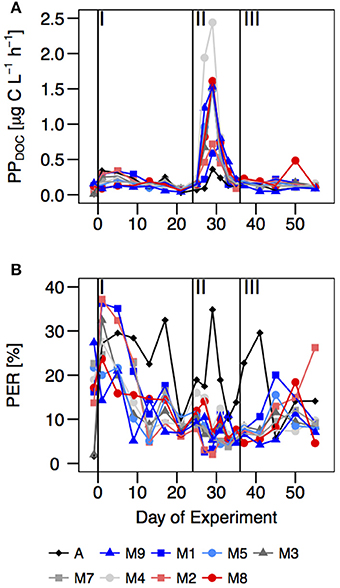
Figure 7. Temporal development of (A) rates of dissolved primary production (PPDOC) (μg C·L−1·h−1) and (B) the percentage of extracellular release (PER) (%) [(PPDOC/PPTOC) · 100] over the course of the experiment. Vertical lines separate the three phases of the experiment.
CO2 Effects on Size-Fractionated Chlorophyll, Biomass and Primary Production
A total of 39 linear regressions were conducted to test potential CO2 effects on total community and size-fractionated primary production, biomass and chlorophyll, and almost two thirds (28) showed statistically significant (p < 0.05) relationships (Tables 2 – 4, respectively). Total particulate primary production (PPPOC) remained unaffected during phase I, in contrast to BTot, BNano, ChlNano and ChlTot, which exhibited negative responses to increasing pCO2. Negative responses (6) were only observed in the oligotrophic phase (phase I). Dissolved carbon production rate (PPDOC) also presented a strong relationship with pCO2, but a positive one. No statistically significant correlations with pCO2 concentrations were found with the remaining parameters in phase I.
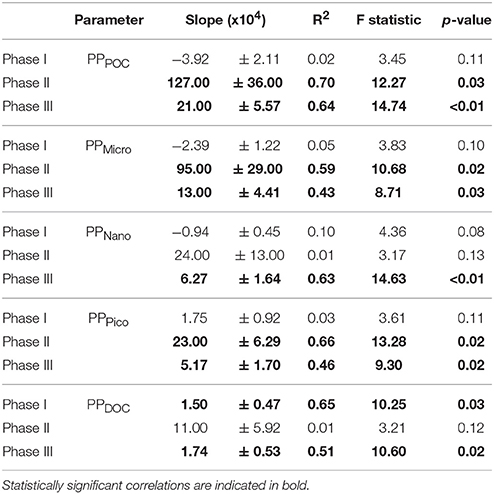
Table 2. Linear regressions statistics of the relationship between average primary production in the total particulate (PPPOC) and different size fractions (PPMicro, PPNano, PPPico), as well as in the total dissolved fraction (PPDOC), vs. pCO2 levels for the three experimental phases.
After nutrient fertilization in t24, the majority of the CO2 correlations (23 out of 26) were statistically significant and mostly positive (Tables 2 – 4). Fractionated primary production, biomass and chlorophyll, as well as PPPOC, BTot and ChlTot were positively related to increasing pCO2 (except PPNano) in phase II. PPDOC was statistically correlated with pCO2 in phase III but not in phase II. We also observed strong significant and positive correlations between pCO2 and both total and size-fractionated primary production, biomass and chlorophyll during phase III (except in the Pico fraction).
Discussion
CO2 and Nutrient Impacts on Phytoplankton Biomass and Productivity
The eight mesocosms during phase I displayed similar behaviors to the Atlantic ambient waters, showing a phytoplankton community dominated in terms of biomass by small picophytoplankton and nanophytoplankton (Figure 5), characteristic of the oligotrophic subtropical northeast Atlantic (Zubkov et al., 2000a,b; Arístegui and Montero, 2005; Figueiras et al., 2016), although with somewhat higher primary production and biomass.
Due to the low nutrient concentrations, PPPOC was low and relatively stable during phase I, showing no significant relationship with pCO2. Although, theoretically, carbon fixation should be enhanced by high pCO2 levels (Giordano et al., 2005; Reinfelder, 2011), the absence of a response of primary production to increasing CO2 in oligotrophic waters dominated by small phytoplankton has been reported by other authors (Yoshimura et al., 2009; Maugendre et al., 2017). Surprisingly, both chlorophyll and biomass decreased with increasing pCO2 during phase I (Tables 3, 4), even though primary production remained rather stable. Engel et al. (2013) observed the same behavior in a similar mesocosms study in Arctic waters. They hypothesized that either the enhancement of particle aggregation and settling as a consequence of increasing Transparent Exopolymer Particles (TEP), the increase in remineralization of phytoplankton cells, the nutrient competition between auto- and heterotrophic organisms, or a combination of the preceding processes, could explain the mismatch between PPPOC and its accumulation as biomass. Due to the lack of response of TEPs to increasing pCO2 in our experiment (data not shown), the first hypothesis would not apply in our case. A more likely explanation would be that a fraction of primary production is channeled through the dissolved fraction increasing the DOC pool inside the mesocosms. This hypothesis agrees with both the observed higher values of PPDOC in the high-CO2 mesocosms, and the increase in DOC from t3 to t23 reported by Zark et al. (2017) in this same study.
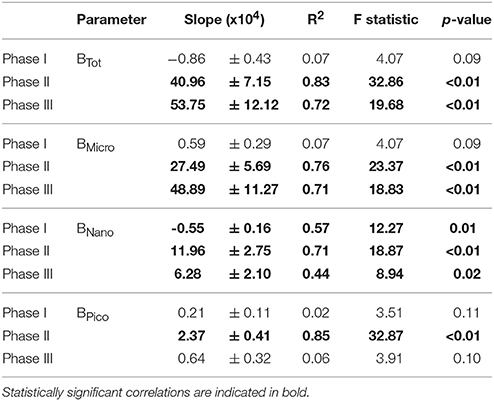
Table 3. Linear regressions statistics of the relationship between average total community biomass (BTot) and the biomass of the different size fractions (BMicro, BNano, BPico) vs. pCO2 levels for the three experimental phases.
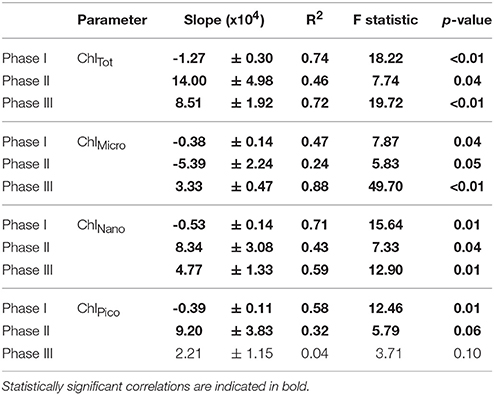
Table 4. Linear regressions statistics of the relationship between average total community chlorophyll a (ChlTot) and the chlorophyll of the different size fractions (ChlMicro, ChlNano, ChlPico) vs. pCO2 levels for the three experimental phases.
Nutrient fertilization triggered autotrophic phytoplankton community growth, with higher maximum biomass build-up in the high-CO2 mesocosms. The bloom that occurred during phase II, coincided with an increase in primary production and biomass inside all mesocosms. As a consequence, major nutrients were depleted to values similar (such as + NO2 and ) or lower (Si(OH)4) to phase I. Linear regressions between PPPOC, BTot and ChlTot vs pCO2 revealed significantly positive relationships in phase II, although the strongest relationships of PPPOC, BTot and ChlTot vs pCO2 occurred in phase III. A positive effect of increasing pCO2 in seawater on primary production has been reported by other authors, from single species' experiments (Beardal and Raven, 2004; Fu et al., 2007; Sobrino et al., 2008) to whole community level experiments (Egge et al., 2009; Engel et al., 2013). The positive effect of enhanced pCO2 on primary production has been attributed to the relieve of CO2 limitation of RubisCO (Giordano et al., 2005; Riebesell et al., 2007; Reinfelder, 2011; Mackey et al., 2015). The increase in the availability of CO2 should thus produce an increase in photosynthetic rates, by relieving carbon limitation, or indirectly by lowering the energy required to concentrate CO2 against a smaller concentration gradient.
In summary, our results show that all the positive significant correlations between plankton productivity and biomass and pCO2 occur after nutrients addition, suggesting a synergistic effect of nutrients and CO2. Indeed, as far as we know, the only ocean acidification mesocosm study carried out to test primary production responses in oligotrophic regions, report non-statistically significant effects of increasing pCO2 on primary production under nutrient deplete conditions (Maugendre et al., 2017).
Community Structure Response to Elevated CO2 and Nutrient Fertilization
During phase I, Pico contributed > 40% to Chl and > 50% to primary production, although Nano was the dominant size fraction in terms of biomass. A marked change in the phytoplankton community occurred after the fertilization through deep-water addition at the beginning of phase II and during phase III, where the community shifted to larger microphytoplankton (mostly diatoms; Taucher et al., 2017) with > 57% dominance in biomass and > 60% in primary production (Figure 5). Changes from small to large size fractions of phytoplankton have been described in the Canary Islands region, associated with transitional changes from oligotrophic to eutrophic conditions across upwelling filaments, eddies and fronts (Basterretxea and Arístegui, 2000; Arístegui et al., 2004).
Our results show that phytoplankton size-groups generally remained unresponsive during phase I to the increases in pCO2, whereas all of them benefitted from the nutrient addition. This disagrees with a study by Egge et al. (2009), who reported non-significant changes in primary production among size fractions in a mesocosm experiment in Bergen (Norway), although differences in chlorophyll and biomass at group level have been observed during other mesocosm experiments (Brussaard et al., 2013; Schulz et al., 2017). For this present study, Taucher et al. (2017), using a non-metric multidimensional scaling (NMDS) analysis, described a significant effect of CO2 on the whole planktonic community (including protozoa and mesozooplankton). The effect is apparent even in phase I, but became more pronounced after nutrient fertilization. They reported that the response of the community structure to CO2 treatments emerges not from one or two dominant species but from overall shifts across the entire plankton community. At the phytoplankton level, we find in most cases a significant effect of CO2 on primary production, biomass and chlorophyll a in all the size fractions during phases II and III, pointing to a size independent stimulation of nutrients and CO2 over all the phytoplankton groups, which particularly benefited the increase of diatoms in absolute terms (Taucher et al., 2017). However, a closer look to the linear correlations reveals significant differences among regression slopes, indicating differences in size fractions responses. Indeed, the relative increase of primary production after nutrient additions display a clear size-related pattern, where small PPPico was enhanced about 250%, PPNano up to 150% and PPMicro about 100% in the two high-CO2 mesocosms compared to the two low-CO2 mesocosms, Surprisingly, the highest relative change in biomass was observed in BMicro followed by BNano and BPico. This could be partly explained by a more intense grazing pressure on the smallest size fractions compared to the largest ones.
A number of experimental and modeling studies have suggested the existence of potential winners and losers in a future acidified ocean (Dutkiewicz et al., 2013; Kroeker et al., 2013; Bach et al., 2017). In our mesocosm experiment, the shift from a cyanobacteria-dominated community to a large diatom-dominated community in the high CO2 scenarios after nutrient fertilization, as well as the distinct size-related relative change observed among size-fractions, seems to support this hypothesis. Nevertheless, the fact that all phytoplankton size classes increased after nutrient addition in high CO2 treatments, suggests that the entire phytoplankton community in subtropical regions would benefit in an acidified and patchily fertilized ocean, although larger cells could outcompete the smaller ones under high nutrient inputs.
Biogeochemical Implications
Oligotrophic regions are expanding at an annual rate of 0.8–4.3%, with the North Atlantic subtropical Gyre showing the fastest annual expansion (Sarmiento et al., 2004; Polovina et al., 2008). Approximately 0.8 million km2 of productive waters are being replaced annually by warmer stratified oligotrophic waters. Most models predict a decline in primary production as well as in the downward carbon fluxes in these regions by the end of the century (Riebesell et al., 2009; Gruber, 2011; Bopp et al., 2013), due to a reduction of vertical nutrient supply related with the shoaling of the mixed layer depth (Bopp et al., 2001; Marinov et al., 2010; Steinacher et al., 2010). Nevertheless, these models do not take into account the effect of mesoscale and submesoscale processes, such as eddies or fronts, which are known to play a key role in enhancing primary production (e.g. Mcgillicuddy et al., 2007; Sangrà et al., 2009) and export fluxes (Omand et al., 2015) in the ocean. Under an scenario of an acidified and warmer ocean, leading to an intensification of cross-shore wind gradients and eddy kinetic energy across eastern boundary regions (Bakun, 1990; Sydeman et al., 2014; García-Reyes et al., 2015), mesoscale variability would increase mixing and upwelling of deeper nutrient-rich water into the euphotic zone (Renault et al., 2016; Xiu et al., 2018). Our data suggest that a patchy nutrient pumping in a more acidified ocean would increase primary productivity in subtropical warm regions. Furthermore, community structure would shift from small to large cells, like diatoms, potentially leading to a more efficient carbon export to the deep ocean. The concomitant increase in dissolved organic carbon production (PPDOC) may also contribute to the biological carbon pump, through particle aggregation and the subsequent increase of sinking rates (Engel et al., 2004, 2014; Schartau et al., 2007).
It has been estimated that mesoscale and submesoscale features account for 20–30% of the new primary production in the world's ocean (Mcgillicuddy et al., 2007). If global warming reinforces wind regimes in eastern boundary regions as predicted (Bakun, 1990; Sydeman et al., 2014), increasing the eddy kinetic energy field, new production could increase as well, counteracting the effect of enhanced stratification in subtropical regions. Nevertheless, further research is needed to constrain the synergistic or antagonistic effects of climate drivers on primary production and plankton community structure in subtropical oligotrophic waters, the most extensive ecosystems of the world's ocean.
Conclusions
This is the first mesocosm study addressing the response, in terms of primary production and community structure, of size-fractionated (0.2–2, 2–20, and >20 μm) natural plankton communities in subtropical oligotrophic regions to increasing CO2 concentrations and nutrient fertilization. Our results reveal a non-significant CO2-related effect on PP and B under nutrient depleted conditions, with a phytoplankton dominance of small cyanobacteria. After nutrient fertilization, however, the community shifts toward larger phytoplankton, with a diatom-dominated community, showing a significant marked increase in PP, B and chlorophyll under higher CO2 conditions in all groups. Our data suggest that in a future acidified subtropical ocean, mesoscale and submesoscale features—which are predicted to enhance under global warming in eastern boundary regions—would drive nutrient pumping to the surface ocean favoring the development of diatoms and increasing new production in the global ocean.
Author Contributions
UR and JA: conceived and designed the experiment. All authors performed the experiment and analyzed the data. Wrote the paper: NH-H and JA with inputs from all co-authors.
Funding
The KOSMOS project was funded by the German Federal Ministry of Education and Research (BMBF) in the framework of the coordinated project BIOACID—Biological Impacts of Ocean Acidification, phase 2 (FKZ 03F06550). UR received additional funding from the Leibniz Award 2012 by the German Research Foundation (DFG). The Natural Environment Research Council provided funding for EA and ME as part of the UK Ocean Acidification Programme (NE/H017348/1). JA was supported by a Helmholtz International Fellow Award, 2015 (Helmholtz Association, Germany). NH-H was partially supported by KOSMOS funding during the experimental work, and by a grant of the Agencia Canaria de Investigación, Innovación y Sociedad de la Información (ACIISI) during the writing stage (TESIS2015010036). IB was supported by a FPI fellowship (BES-2016-078407) from the Spanish Ministry of Economy, Industry and Competitiveness (MINECO). NH-H, MM, IB, and JA benefited also from the FLUXES project (CTM2015-69392-C3-1-R) funded by the Spanish government (Plan Nacional I+D).
Conflict of Interest Statement
The authors declare that the research was conducted in the absence of any commercial or financial relationships that could be construed as a potential conflict of interest.
Acknowledgments
We would like to thank the KOSMOS and the Plataforma Oceánica de Canarias (PLOCAN) teams assisting with all aspects of the organization and logistical support before, during and after this mesocosms campaign, as well as to Minerva Espino and Acorayda González (IOCAG, ULPGC) for their technical support in the sampling and analyses of phytoplankton and productivity data.
References
Arístegui, J., Barton, E. D., Tett, P., Montero, M. F., García-Muñoz, M., Basterretxea, G., et al. (2004). Variability in plankton community structure, metabolism, and vertical carbon fluxes along an upwelling filament (Cape Juby, NW Africa). Prog. Oceanogr. 62, 95–113. doi: 10.1016/j.pocean.2004.07.004
Arístegui, J., and Montero, M. F. (2005). Temporal and spatial changes in plankton respiration and biomass in the Canary Islands region: the effect of mesoscale variability. J. Mar. Syst. 54, 65–82. doi: 10.1016/j.jmarsys.2004.07.004
Bach, L. T., Alvarez-Fernandez, S., Hornick, T., Stuhr, A., and Riebesell, U. (2017). Simulated ocean acidification reveals winners and losers in coastal phytoplankton. PLoS ONE 12:e0188198. doi: 10.1371/journal.pone.0188198
Bakun, A. (1990). Global climate change and intensification of coastal ocean upwelling. Science 247, 198–201. doi: 10.1126/science.247.4939.198
Basterretxea, G., and Arístegui, J. (2000). Mesoscale variability in phytoplankton biomass distribution and photosynthetic parameters in the Canary-NW African coastal transition zone. Mar. Ecol. Prog. Ser. 197, 27–40. doi: 10.3354/meps197027
Beardal, J., and Raven, J. A. (2004). The potential effects of global climate change on microalgal photosynthesis, growth and ecology. Phycologia 43, 26–40. doi: 10.2216/i0031-8884-43-1-26.1
Behrenfeld, M. J., O'Malley, R. T., Siegel, D. A., McClain, C. R., Sarmiento, J. L., Feldman, G. C., et al. (2006). Climate-driven trends in contemporary ocean productivity. Nature 444, 752–755. doi: 10.1038/nature05317
Behrenfeld, M. J., Randerson, J. T., McClain, C. R., Feldman, G. C., Los, S. O., Tucker, C. J., et al. (2001). Biospheric primary production during an ENSO transition. Science 291, 2594–2597. doi: 10.1126/science.1055071
Bellerby, R. G. J., Schulz, K. G., Riebesell, U., Neill, C., Nondal, G., Heegaard, E., et al. (2008). Marine ecosystem community carbon and nutrient uptake stoichiometry under varying ocean acidification during the PeECE III experiment. Biogeosciences 5, 1517–1527. doi: 10.5194/bg-5-1517-2008
Bopp, L., Monfray, P., Aumont, O., Dufresne, J.-L., Le Treut, H., Madec, G., et al. (2001). Potential impact of climate change on marine export production. Global Biogeochem. Cycles 15, 81–99. doi: 10.1029/1999GB001256
Bopp, L., Resplandy, L., Orr, J. C., Doney, S. C., Dunne, J. P., Gehlen, M., et al. (2013). Multiple stressors of ocean ecosystems in the 21st century: projections with CMIP5 models. Biogeosciences 10, 6225–6245. doi: 10.5194/bg-10-6225-2013
Borsheim, K. Y., and Bratbak, G. (1987). bacterivorous Monas sp. enriched from seawater. Mar. Ecol. Prog. Ser. 36, 171–175. doi: 10.3354/meps036171
Brussaard, C. P. D., Noordeloos, A. A. M., Witte, H., Collenteur, M. C. J., Schulz, K., Ludwig, A., et al. (2013). Arctic microbial community dynamics influenced by elevated CO2 levels. Biogeosciences 10, 719–731. doi: 10.5194/bg-10-719-2013
Caldeira, K., and Wickett, M. E. (2003). Oceanography: anthropogenic carbon and ocean pH. Nature 425, 365–365. doi: 10.1038/425365a
Delille, B., Harlay, J., Zondervan, I., Jacquet, S., Chou, L., Wollast, R., et al. (2005). Response of primary production and calcification to changes of pCO2 during experimental blooms of the coccolithophorid Emiliania huxleyi. Global Biogeochem. Cycles 19, 1–14. doi: 10.1029/2004GB002318
Doney, S. C., Ruckelshaus, M., Emmett Duffy, J., Barry, J. P., Chan, F., English, C. A., et al. (2012). Climate change impacts on marine ecosystems. Ann. Rev. Mar. Sci. 4, 11–37. doi: 10.1146/annurev-marine-041911-111611
Dubelaar, G. B. J., and Gerritzen, P. L. (2000). Cytobuoy: a step forward towards using flow cytometry in operational oceanography. Sci. Mar. 64, 255–265. doi: 10.3989/scimar.2000.64n2255
Dutkiewicz, S., Scott, J. R., and Follows, M. J. (2013). Winners and losers: ecological and biogeochemical changes in a warming ocean. Global Biogeochem. Cycles 27, 463–477. doi: 10.1002/gbc.20042
Eberlein, T., Wohlrab, S., Rost, B., John, U., Bach, L. T., Riebesell, U., et al. (2017). Effects of ocean acidification on primary production in a coastal North Sea phytoplankton community. PLoS ONE 12:e0172594. doi: 10.1371/journal.pone.0172594
Egge, J. K., Thingstad, T. F., Engel, A., Bellerby, R. G. J., Riebesell, U., Larsen, A., et al. (2009). Primary production during nutrient-induced blooms at elevated CO2 concentrations. Biogeosciences 6, 877–885. doi: 10.5194/bg-6-877-2009
Engel, A., Borchard, C., Piontek, J., Schulz, K. G., Riebesell, U., and Bellerby, R. (2013). CO2 increases 14C primary production in an Arctic plankton community. Biogeosciences 10, 1291–1308. doi: 10.5194/bg-10-1291-2013
Engel, A., Delille, B., Jacquet, S., Riebesell, U., Rochelle-newall, E., Terbrüggen, A., et al. (2004). Transparent exopolymer particles and dissolved organic carbon production by Emiliania huxleyi exposed to different CO2 concentrations : a mesocosm experiment. Aquat. Microb. Ecol. 34, 93–104. doi: 10.3354/ame034093
Engel, A., Piontek, J., Grossart, H. P., Riebesell, U., Schulz, K. G., and Sperling, M. (2014). Impact of CO2 enrichment on organic matter dynamics during nutrient induced coastal phytoplankton blooms. J. Plankton Res. 36, 641–657. doi: 10.1093/plankt/fbt125
Falkowski, P. G. (1994). The role of phytoplankton photosyntesis in global biogeochemical cycles. Photosyn. Res. 39, 235–258. doi: 10.1007/BF00014586
Falkowski, P., Scholes, R. J., Boyle, E., Canadell, J., Canfield, D., Elser, J., et al. (2000). The global carbon cycle: a test of our knowledge of earth as a system. Science 290, 291–296. doi: 10.1126/science.290.5490.291
Feng, Y., Hare, C. E., Leblanc, K., Rose, J. M., Zhang, Y., DiTullio, G. R., et al. (2009). Effects of increased pCO2 and temperature on the north atlantic spring bloom. I. the phytoplankton community and biogeochemical response. Mar. Ecol. Prog. Ser. 388, 13–25. doi: 10.3354/meps08133
Field, C. B., Behrenfeld, M. J., Randerson, J. T., and Falkowski, P. (1998). Primary production of the biosphere: integrating terrestrial and oceanic components. Science 281, 237–240. doi: 10.1126/science.281.5374.237
Figueiras, F. G., Arbones, B., Montero, M. F., Barton, E. D., and Arístegui, J. (2016). Photophysiological variability and its influence on primary production in the NW Africa-Canary Islands coastal transition zone. J. Mar. Syst. 157, 92–100. doi: 10.1016/j.jmarsys.2016.01.003
Fu, F. X., Warner, M. E., Zhang, Y., Feng, Y., and Hutchins, D. A. (2007). Effects of increased temperature and CO2 on photosynthesis, growth, and elemental ratios in marine Synechococcus and Prochlorococcus (Cyanobacteria). J. Phycol. 43, 485–496. doi: 10.1111/j.1529-8817.2007.00355.x
García-Reyes, M., Sydeman, W. J., Schoeman, D. S., Rykaczewski, R. R., Black, B. A., Smit, A. J., et al. (2015). Under pressure: climate change, upwelling, and eastern boundary upwelling ecosystems. Front. Mar. Sci. 2:109. doi: 10.3389/fmars.2015.00109
Giordano, M., Beardall, J., and Raven, J. A. (2005). CO2 concentrating mechanisms, environmental modulation, and evolution. Annu. Rev. Plant Biol. 56, 99–131. doi: 10.1146/annurev.arplant.56.032604.144052
Gruber, N. (2011). Warming up, turning sour, losing breath: ocean biogeochemistry under global change. Philos. Trans. R. Soc. A Math. Phys. Eng. Sci. 369, 1980–1996. doi: 10.1098/rsta.2011.0003
Hansen, H. P., and Grasshoff, K. (1983). “Automated chemical analysis,” in Methods of Seawater Analysis, eds K. Grasshoff, M. Ehrhardt, and K. Kremling (Weinheim: Verlag Chemie), 347–379.
Hare, C. E., Leblanc, K., DiTullio, G. R., Kudela, R. M., Zhang, Y., Lee, P. A., et al. (2007). Consequences of increased temperature and CO2 for phytoplankton community structure in the Bering Sea. Mar. Ecol. Prog. Ser. 352, 9–16. doi: 10.3354/meps07182
Hein, M., and Sand-Jensen, K. (1997). CO2 increases oceanic primary production. Nature 388, 526–527. doi: 10.1038/41457
Holmes, R. M., Aminot, A., Kérouel, R., Hooker, B. A., and Peterson, B. J. (1999). A simple and precise method for measuring ammonium in marine and freshwater ecosystems. Can. J. Fish. Aquat. Sci. 56, 1801–1808. doi: 10.1139/f99-128
Holm-Hansen, O., Lorenzen, C. J., Holmes, R. W., and Strickland, D. H. (1965). Fluorometric determination of chlorophyll. ICES J. Mar. Sci. 30, 3–15. doi: 10.1093/icesjms/30.1.3
IPCC (2014). Climate Change: 2014: Impacts, Adaption, and Vulnerability. Part A: Global and Sectoral Aspects. Contribution of Working Group II to the Fifth Assement Report of the Intergovernmental Panel on Climate Change. Cambridge, UK; New York, NY: Cambridge University Press.
Kroeker, K. J., Kordas, R. L., Crim, R., Hendriks, I. E., Ramajo, L., Singh, G. S., et al. (2013). Impacts of ocean acidification on marine organisms: quantifying sensitivities and interaction with warming. Glob. Chang. Biol. 19, 1884–1896. doi: 10.1111/gcb.12179
Lomas, M. W., Hopkinson, B. M., Losh, J. L., Ryan, D. E., Shi, D. L., Xu, Y., et al. (2012). Effect of ocean acidification on cyanobacteria in the subtropical North Atlantic. Aquat. Microb. Ecol. 66, 211–222. doi: 10.3354/ame01576
Longhurst, A., Sathyendranath, S., Platt, T., and Caverhill, C. (1995). An estimate of global primary production in the ocean from satelite radiometer data. J. Plankton Res. 17, 1245–1271. doi: 10.1093/plankt/17.6.1245
Lueker, T. J., Dickson, A. G., and Keeling, C. D. (2000). Ocean pCO2 calculated from dissolved inorganic carbon, alkalinity, and equations for K1 and K2: validation based on laboratory measurements of CO2 in gas and seawater at equilibrium. Mar. Chem. 70, 105–119. doi: 10.1016/S0304-4203(00)00022-0
Mackey, K. R. M., Morris, J. J., Morel, F. M. M., and Kranz, S. A. (2015). Response of photosynthesis to ocean acidification. Oceanography 28, 74–91. doi: 10.5670/oceanog.2015.33
Marinov, I., Doney, S. C., and Lima, I. D. (2010). Response of ocean phytoplankton community structure to climate change over the 21st century: partitioning the effects of nutrients, temperature and light. Biogeosciences 7, 3941–3959. doi: 10.5194/bg-7-3941-2010
Maugendre, L., Gattuso, J. P., Poulton, A. J., Dellisanti, W., Gaubert, M., Guieu, C., et al. (2017). No detectable effect of ocean acidification on plankton metabolism in the NW oligotrophic Mediterranean Sea: results from two mesocosm studies. Estuar. Coast. Shelf Sci. 186, 89–99. doi: 10.1016/j.ecss.2015.03.009
Mcgillicuddy, D. J., Anderson, L. A., Bates, N. R., Buesseler, K. O., Carlson, C. A., Davis, C. S., et al. (2007). Eddy/Wind interactions stimulate extraordinary mid-ocean blooms. Science 316, 1021–1026. doi: 10.1126/science.1136256
Menden-Deuer, S., and Lessard, E. J. (2000). Carbon to volume relationships for dinoflagellates, diatoms, and other protist plankton. Limnol. Oceanogr. 45, 569–579. doi: 10.4319/lo.2000.45.3.0569
Murphy, J., and Riley, J. P. (1962). A modified single solution method for the determination of phosphate in natural waters. Anal. Chem. Acta 27, 31–36. doi: 10.1016/S0003-2670(00)88444-5
Omand, M. M., D'Asaro, E. A., Lee, C. M., Perry, M. J., Briggs, N., Cetini, I., et al. (2015). Eddy-driven subduction exports particulate organic carbon from the spring bloom. Science 348, 222–225. doi: 10.1126/science.1260062
Pierrot, D. E., Lewis, E., and Wallace, D. W. R. (2006). MS Excel Program Developed for CO2 System Calculations. Oak Ridge, TN: Carbon Dioxide Information Analysis Center (CDIAC).
Polovina, J. J., Howell, E. A., and Abecassis, M. (2008). Ocean's least productive waters are expanding. Geophys. Res. Lett. 35, 2–6. doi: 10.1029/2007GL031745
Reinfelder, J. R. (2011). Carbon concentrating mechanisms in eukaryotic marine phytoplankton. Ann. Rev. Mar. Sci. 3, 291–315. doi: 10.1146/annurev-marine-120709-142720
Renault, L., Deutsch, C., McWilliams, J. C., Frenzel, H., Liang, J.-H., and Colas, F. (2016). Partial decoupling of primary productivity from upwelling in the California current system. Nat. Geosci. 9, 505–508. doi: 10.1038/ngeo2722
Riebesell, U., Czerny, J., Von Bröckel, K., Boxhammer, T., Büdenbender, J., Deckelnick, M., et al. (2013). Technical Note: a mobile sea-going mesocosm system-New opportunities for ocean change research. Biogeosciences 10, 1835–1847. doi: 10.5194/bg-10-1835-2013
Riebesell, U., and Gattuso, J.-P. (2015). Lessons learned from ocean acidification research. Nat. Clim. Chang. 5, 12–14. doi: 10.1038/nclimate2456
Riebesell, U., Kortzinger, A., and Oschlies, A. (2009). Sensitivities of marine carbon fluxes to ocean change. Proc. Natl. Acad. Sci. U.S.A. 106, 20602–20609. doi: 10.1073/pnas.0813291106
Riebesell, U., Schulz, K. G., Bellerby, R. G. J., Botros, M., Fritsche, P., Meyerhöfer, M., et al. (2007). Enhanced biological carbon consumption in a high CO2 ocean. Nature 450, 545–548. doi: 10.1038/nature06267
Sangrà, P., Pascual, A., Rodríguez-Santana, Á., Machín, F., Mason, E., McWilliams, J. C., et al. (2009). The Canary Eddy Corridor: a major pathway for long-lived eddies in the subtropical North Atlantic. Deep. Res I Oceanogr. Res. Pap. 56, 2100–2114. doi: 10.1016/j.dsr.2009.08.008
Sarmiento, J. L., Slater, R., Barber, R., Bopp, L., Doney, S. C., Hirst, A. C., et al. (2004). Response of ocean ecosystems to climate warming. Global Biogeochem. Cycles 18:GB3003. doi: 10.1029/2003GB002134
Schartau, M., Engel, A., Schröter, J., Thoms, S., Völker, C., and Wolf-Gladrow, D. (2007). Modelling carbon overconsumption and the formation of extracellular particulate organic carbon. Biogeosciences 4, 433–454. doi: 10.5194/bg-4-433-2007
Schulz, K. G., Bach, L. T., Bellerby, R. G. J., Bermúdez, R., Büdenbender, J., Boxhammer, T., et al. (2017). Phytoplankton blooms at increasing levels of atmospheric carbon dioxide: experimental evidence for negative effects on prymnesiophytes and positive on small picoeukaryotes. Front. Mar. Sci. 4:64. doi: 10.3389/fmars.2017.00064
Sobrino, C., Ward, M. L., and Neale, P. J. (2008). Acclimation to elevated carbon dioxide and ultraviolet radiation in the diatom Thalassiosira pseudonana: effects on growth, photosynthesis, and spectral sensitivity of photoinhibition. Limnol. Oceanogr. 53, 494–505. doi: 10.4319/lo.2008.53.2.0494
Sokal, R. R., and Rohlf, F. J. (2013). Biometry : The Principles and Practice of Statistics in Biological Research. New York, NY: W. H. Freeman and Co.
Steinacher, M., Joos, F., Frölicher, T. L., Bopp, L., Cadule, P., Cocco, V., et al. (2010). Projected 21st century decrease in marine productivity: a multi-model analysis. Biogeosciences 7, 979–1005. doi: 10.5194/bg-7-979-2010
Sydeman, W. J., Garcia-Reyes, M., Schoeman, D. S., Rykaczewski, R. R., Thompson, S. A., Black, B. A., et al. (2014). Climate change and wind intensification in coastal upwelling ecosystems. Science 345, 77–80. doi: 10.1126/science.1251635
Tanaka, T., Alliouane, S., Bellerby, R. G. B., Czerny, J., De Kluijver, A., Riebesell, U., et al. (2013). Effect of increased pCO2 on the planktonic metabolic balance during a mesocosm experiment in an Arctic fjord. Biogeosciences 10, 315–325. doi: 10.5194/bg-10-315-2013
Taucher, J., Bach, L. T., Boxhammer, T., Nauendorf, A., Achterberg, E. P., Algueró-Muñiz, M., et al. (2017). Influence of ocean acidification and deep water upwelling on oligotrophic plankton communities in the subtropical north atlantic: insights from an in situ mesocosm study. Front. Mar. Sci. 4:85. doi: 10.3389/fmars.2017.00085
Tortell, P. D., DiTullio, G. R., Sigman, D. M., and Morel, F. M. M. (2002). CO2 effects on taxonomic composition and nutrient utilization in an Equatorial Pacific phytoplankton assemblage. Mar. Ecol. Prog. Ser. 236, 37–43. doi: 10.3354/meps236037
Tortell, P. D., Payne, C. D., Li, Y., Trimborn, S., Rost, B., Smith, W. O., et al. (2008). CO2 sensitivity of southern ocean phytoplankton. Geophys. Res. Lett. 35, 1–5. doi: 10.1029/2007GL032583
Utermöhl, H. (1931). Neue Wege in der quantitativen Erfassung des Plankton. (Mit besonderer Berücksichtigung des Ultraplanktons.). SIL Proc. 1922-2010 5, 567–596. doi: 10.1080/03680770.1931.11898492
Xiu, P., Chai, F., Curchitser, E. N., and Castruccio, F. S. (2018). Future changes in coastal upwelling ecosystems with global warming: the case of the California current system. Sci. Rep. 8, 1–9. doi: 10.1038/s41598-018-21247-7
Yoshimura, T., Nishioka, J., Suzuki, K., Hattori, H., Kiyosawa, H., and Watanabe, Y. W. (2009). Impacts of elevated CO2 on phytoplankton community composition and organic carbon dynamics in nutrient-depleted Okhotsk Sea surface waters. Biogeosci. Dis. 6, 4143–4163. doi: 10.5194/bgd-6-4143-2009
Zark, M., Broda, N. K., Hornick, T., Grossart, H.-P., Riebesell, U., and Dittmar, T. (2017). Ocean acidification experiments in large-scale mesocosms reveal similar dynamics of dissolved organic matter production and biotransformation. Front. Mar. Sci. 4:271. doi: 10.3389/fmars.2017.00271
Zubkov, M. V., Sleigh, M. A., and Burkill, P. H. (2000a). Assaying picoplankton distribution by flow cytometry of underway samples collected along a meridional transect across the Atlantic Ocean. Aquat. Microb. Ecol. 21, 13–20. doi: 10.3354/ame021013
Keywords: ocean acidification, nutrient fertilization, mesocosm, size-fractionated primary production, phytoplankton community structure, subtropical North Atlantic
Citation: Hernández-Hernández N, Bach LT, Montero MF, Taucher J, Baños I, Guan W, Espósito M, Ludwig A, Achterberg EP, Riebesell U and Arístegui J (2018) High CO2 Under Nutrient Fertilization Increases Primary Production and Biomass in Subtropical Phytoplankton Communities: A Mesocosm Approach. Front. Mar. Sci. 5:213. doi: 10.3389/fmars.2018.00213
Received: 30 March 2018; Accepted: 30 May 2018;
Published: 19 June 2018.
Edited by:
Christel Hassler, Université de Genève, SwitzerlandReviewed by:
Chiara Lombardi, National Agency for New Technologies, Energy and Sustainable Economic Development, ItalyJie Xu, South China Sea Institute of Oceanology (CAS), China
Copyright © 2018 Hernández-Hernández, Bach, Montero, Taucher, Baños, Guan, Espósito, Ludwig, Achterberg, Riebesell and Arístegui. This is an open-access article distributed under the terms of the Creative Commons Attribution License (CC BY). The use, distribution or reproduction in other forums is permitted, provided the original author(s) and the copyright owner are credited and that the original publication in this journal is cited, in accordance with accepted academic practice. No use, distribution or reproduction is permitted which does not comply with these terms.
*Correspondence: Javier Arístegui, amF2aWVyLmFyaXN0ZWd1aUB1bHBnYy5lcw==