 Alba Filella1
 Isabel Baños1
 María F. Montero1
 Nauzet Hernández-Hernández1
 Adriana Rodríguez-Santos1
 Andrea Ludwig2
 Ulf Riebesell2
 Javier Arístegui1*
- 1Instituto de Oceanografía y Cambio Global, Universidad de Las Palmas de Gran Canaria, Las Palmas, Spain
- 2Biological Oceanography, GEOMAR Helmholtz Centre for Ocean Research Kiel, Kiel, Germany
The enzymatic electron transport system (ETS) assay is frequently used as a proxy of respiratory activity in planktonic communities. It is thought to estimate the maximum overall activity of the enzymes associated with the respiratory ETS systems in both eukaryotic and prokaryotic organisms. Thus, in order to derive actual respiration rates (R) from ETS it is necessary to determine empirical R/ETS conversion algorithms. In this study we explore the temporal development of R and ETS activity in natural plankton communities (from bacteria to large phytoplankton) enclosed in mesocosms, treated with different CO2 concentrations. The experiment lasted 30 days, during which abrupt changes in community structure and biomass occurred through a sharp transition from oligotrophy (phase I) to highly eutrophic conditions (phase II) after nutrient-induced fertilization (day 18). R and ETS did not show any response to CO2 under oligotrophic conditions, but R increased significantly more in the two high CO2 mesocosms after fertilization, coinciding with a sharp rise in large phytoplankton (mostly diatoms). R and ETS were significantly correlated only during the eutrophic phase. The R/ETS ranged more than threefold in magnitude during the experiment, with phase-averaged values significantly higher under oligotrophic conditions (0.7–1.1) than after nutrient fertilization (0.5–0.7). We did not find any significant relationship between R/ETS and community structure or biomass, although R correlated significantly with total biomass after fertilization in the four mesocosms. Multiple stepwise regression models show that large phytoplankton explains most of the variance in R during phases I (86%) and II (53%) and of ETS (86%) during phase II, while picophytoplankton contributes up to 73% to explain the variance in the ETS model during phase I. Our results suggest that R/ETS may be too variable in the ocean as to apply constant values to different communities living under contrasting environmental conditions. Controlled experiments with natural communities, like the present one, would help to constrain the range of variability of the R/ETS ratio, and to understand the factors driving it.
Introduction
Respiration is a key factor in organic carbon utilization and energy flow in oceanic ecosystems. It is regarded to be an ubiquitous process, occurring at all depths and in all regions, so it can be used as an indicator of community metabolism for aquatic ecology studies (del Giorgio and Williams, 2005). The rates of community respiration are, however, generally low and consequently difficult to measure in the ocean, particularly in the deep cold waters, where long term (>24 h) in vitro incubations are necessary to measure significant changes in oxygen concentration. Several studies have reported changes in bacterial abundance, phylogenetic composition (e.g., Massana et al., 2001) and metabolic rates (Jürgens et al., 2000; Massana et al., 2001; Gattuso et al., 2002) during ≥24 h incubations, caused by a number of factors, like bacterivory pressure (Hopkinson et al., 1989) or changes in inorganic and organic nutrients inside the incubation bottles (Gasol and Morán, 1999). Other studies, however, have shown that in vitro incubations may not drastically affect the respiratory rates of bacterial populations, in spite of shifts in the bacterial assemblage composition during the incubation (e.g., Baltar et al., 2012).
In order to overcome the potential difficulties in measuring community respiration by oxygen consumption during long incubation periods, other alternative approaches have been used (see review in Robinson and Williams, 2005). Among these, Packard (1971) introduced the electron transport system (ETS) assay as an index of potential respiration for planktonic organisms. The determination of ETS activity in plankton is thought to estimate, under saturation of substrates, the maximum overall capacity of the enzymes associated with the respiratory ETS (i.e., the potential respiration) in both eukaryotic and prokaryotic organisms (Packard, 1985). Since the introduction of the ETS method, this approach has been widely used to estimate the respiratory activity of specific components of marine plankton (e.g., Kenner and Ahmed, 1975; King and Packard, 1975; Christensen et al., 1980; Bidigare et al., 1982; Finlay et al., 1983; Packard et al., 1983; Packard, 1985; Hernández-León, 1988; Schalk, 1988; Martinez, 1991). However, like other enzymatic methods, the ETS represents a proxy of activity, which needs to be transformed to actual respiration rates (R) by means of a R/ETS ratio or relationship. Paradoxically, few studies have investigated the variability of R/ETS, with the aim to elucidate whether ETS could be universally used to derive actual respiration in marine ecosystems (Packard and Williams, 1981; Vosjan et al., 1987, 1990; Mimura et al., 1988; Arístegui and Montero, 1995; Arístegui et al., 2005; Reinthaler et al., 2006). Published empirical R/ETS ratios for bacteria, phytoplankton and zooplankton show a wide range of values (0.2 to >1), with large standard deviations (Table 1), suggesting that it may vary with community structure and specific metabolism of the different members of the community. Unfortunately, the meager database on R/ETS is insufficient to conclude on the causes of its variability. In spite of this, R has been frequently inferred from ETS using constant R/ETS ratios, sometimes without any reasoning for the selection of the applied conversion factor (e.g., Bangqin et al., 2005; Ramírez et al., 2006).
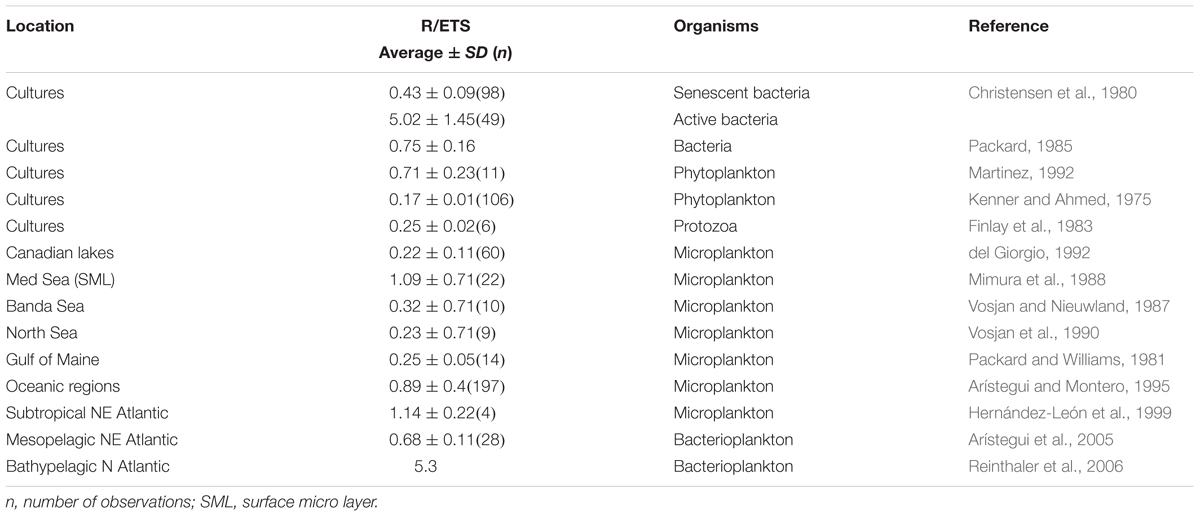
TABLE 1. Published empirical actual respiration to ETS ratios (R/ETS) [means and standard deviations (SD)] for various groups of marine organisms and for freshwater and marine plankton communities.
Here we aim to contribute to the understanding of the causes and magnitude of variability of R, ETS, and their ratio. This is the first study where R and ETS are simultaneously measured under controlled conditions, inside mesocosms, during a relatively long period of time (30 days), where the ecosystem undergoes sharp changes in nutrients and CO2 concentrations. The objective of our work was twofold. First, to investigate how the variability in the structure and biomass of the autotrophic and heterotrophic communities, under different trophic conditions (oligotrophic versus eutrophic environments), may affect community respiration, ETS activity and the R/ETS index. We wanted to test whether pulses in nutrient fertilization (e.g., due to local upwelling events) could modify the community structure, and how this is reflected in the respiratory metabolism of the whole community, estimated both as oxygen consumption and respiratory enzymatic activity. Second, to examine the effects of acidification on plankton community respiration, with the aim of predicting how different CO2 scenarios due to anthropogenic activities might affect plankton respiration in a future ocean. In case there is a response to high CO2 concentrations, we wanted to investigate whether it is due to a direct effect on the specific metabolism of the organisms, or rather to an indirect effect caused by the changes in community composition and total planktonic biomass.
Materials and Methods
Experimental Design and Sampling
The study (KOSMOS Gran Canaria 2016) was carried out at the pier of Taliarte, Gran Canaria (Canary Islands), from 2nd March to 5th April 2016. Eight 11 m3 mesocosm bags were installed and supplied with seawater pumped directly from the adjacent offshore waters outside the harbor. Different pCO2 levels were applied to each mesocosm in a random distribution: the gradient spanned from 400 μatm (the present-day level in the atmosphere and sea surface) up to 1450 μatm (simulating a future scenario of an acidified surface ocean). We chose the following four mesocosms for our study: M5, M6, M7, and M8 with target pCO2 levels of 400, 1450, 700, and 1150 μatm, respectively, although actual values varied during the different phases of the experiment (see Hopwood et al., 2018).
Depth-integrated water samples were collected using 2.5 m long custom-made samplers with an internal volume of 10 L, constructed from polypropylene tubing with valves at both ends. Samples were collected every 2 days, from the beginning of the experiment (t1) until the depletion of nutrients (t17) (phase I: t1–t17). On t18, a single macronutrient addition was applied to reach the following concentrations: 3.1 μmol L-1 nitrate, 1.5 μmol L-1 silicate, and 0.2 μmol L-1 phosphate. Then, the sampling was changed to daily in order to closely follow the development of the phytoplankton bloom (t19–t25). Over the last days (t25–t29), the sampling shifted again to every 2nd day (phase II: t18–t29). A wide variety of measurements were carried out in the mesocosms to study the effects of acidification on both ecological and biogeochemical processes (see Hopwood et al., 2018, for additional information on the water samplers and set up of the experiment).
Community Respiration
Community respiration (R) was determined by oxygen consumption in borosilicate bottles. Water samples (5 L) were carefully siphoned using a silicone tube into four replicate “time-zero” and “dark” 125 mL-BOD bottles. Dark bottles were kept in a temperature-controlled chamber (21°C) at in situ temperature for ∼24 h. R was estimated from the difference in oxygen concentration between the time-zero and dark bottles.
Dissolved oxygen was measured by the Winkler technique, following the recommendations of Carrit and Carpenter (1966), Bryan et al. (1976), and Grasshoff et al. (1983). The entire contents of the bottles were titrated during ∼3 min by means of an automated, precise titration system, with colorimetric end-point detection (Williams and Jenkinson, 1982). The precision achieved in replicates was %CV < 0.07.
Enzymatic ETS Activity
ETS activity was measured by means of the tetrazolium reduction technique according to Arístegui and Montero (1995). Briefly, a tetrazolium salt [2-(4-iodophenyl)-3-(4-nitrophenyl)-5-phenyl tetrazolium chloride salt (INT)] is incorporated through the respiratory ETS and subsequently reduced by dehydrogenase enzymes to a non-fluorescent formazan crystal, INT-formazan. The amount of INT-formazan produced can be estimated from its absorption at 490 nm and be converted to the equivalent oxygen utilization. Seawater (about 3 L of the same carboy where water was collected for R) were poured into acid-cleaned plastic carboys, before being filtered through 47 mm Whatman GF/F filters, at a low vacuum pressure (<1/3 atm). The filters were immediately flash-frozen in liquid nitrogen and stored at -80°C until being assayed in the laboratory within a few weeks. ETS determinations were carried out according to the Kenner and Ahmed (1975) modification of the tetrazolium reduction technique as described in Arístegui and Montero (1995). An incubation time of 15 min at 18°C was used. ETS activities measured at 18°C were converted to activities at in situ temperature by using the Arrhenius equation. A mean activation energy of 16 kcal mole-1 was used (Arístegui and Montero, 1995).
Chlorophyll a
Samples (250–500 mL) for chlorophyll a (Chla) were filtered and collected on GF/F Whatman glass-fiber filters (nominal pore size of 0.7 μm). Chla was estimated fluorometrically by means of a Turner Designs bench fluorometer, previously calibrated with pure chlorophyll a (Sigma Co.), as described in Strickland and Parsons (1960). Pigments were extracted in cold acetone (4°C) for 24 h. For the final determination of Chla, the acetone extracts were acidified allowing Chla and phaeopigments to be independently estimated.
Prokaryotic and Eukaryotic Abundances and Biomasses
We used a FACScalibur (Becton and Dickinson) flow cytometer to look for heterotrophic bacteria (HB), small photosynthetic eukaryotic cells (picoeukaryotes), and Prochlorococcus and Synechococcus type cyanobacteria. Sea water samples (about 1 mL) were analyzed 30–60 min after sampling. Prochlorococcus was not found in the samples throughout the experiment. In other similar experiments we observed that Prochlorococcus vanished during the 1st day of enclosure in the mesocosms. Heterotrophic bacteria (HB) were fixed with a 2% final concentration of formaldehyde, after keeping them 30 min at 4°C, and then stored frozen in liquid nitrogen until analysis. Subsamples (400 μL) were stained with the fluorochrome SYBR Green I, Molecular Probes (final concentration 1000× dilution of the commercial product) at room temperature before analyses. HB were identified by their signatures in a plot of side scatter (SSC) versus green fluorescence (FL1). Samples were run at low speed for HB (16 μL min-1) and medium speed for the other photosynthetic cells (60 μL min-1). A suspension of yellow–green 1 μm latex beads (∼105–106 beads mL-1) was added as an internal standard (Polysciences, Inc., Warrington, PA, United States). Pigmented nanoeukaryotes (2–20 μm; Nano) were counted on fresh samples with a Cytobuoy cytometer (Dubelaar and Gerritzen, 2000), provided with flow-image. Samples (about 3–5 mL) were analyzed in vivo for 7 min at a flow rate of 300 μL min-1. Microphytoplankton (mostly diatoms and dinoflagellates; Micro) were fixed with alkaline Lugol’s iodine (1% final concentration), sedimented in Utermöhl chambers and counted by means of an inverted microscope.
Biomass of picoplankton (Pico: Synechococcus and picoeukaryotes) and HB were estimated by multiplying their abundances by the average cell carbon content for each group, using the conversion factors obtained by MF Montero (unpublished) from samples collected in coastal waters of Gran Canaria: 18 fgC/cell (bacteria), 120 fgC/cell (Synechococcus), 420 fgC/cell (picoeukaryotes). Nanoeukaryotes’ abundances were converted into biomass using an estimated average biovolume of 20 μm-3 for organisms between 2 and 6 μm and a biovolume of 125 μm-3 for organisms between 6 and 11 μm, applying the conversion factor of 220 fgC μm3 proposed by Borsheim and Bratbak (1987). Measured average biovolumes for the different diatoms and dinoflagellates species were used to estimate their biomass using the biovolume-carbon conversion factors given by Menden-Deuer and Lessard (2000).
Total Organic Carbon (TOC) and Chromophoric Organic Carbon (CDOM)
TOC in seawater was measured using a Shimadzu TOC-V analyzer. Samples were collected in 10 mL high-density polyethylene bottles (Nalgene®) and stored at -20°C. Prior to that, bottles were acid-cleaned, flushed with MQ water and dried. Before analysis, samples were acidified with 50 μL of 50% phosphate, and sparged with CO2-free air for 2 min to remove inorganic carbon. To ensure the precision and accuracy of the measurement, reference Sargasso Sea deep-water samples (44–45 μM C) and blank reference water, distributed by the Rosenstiel School of Marine and Atmospheric Science (University of Miami), were analyzed daily. TOC concentrations were determined from standard curves (30–200 μM C) of potassium hydrogen phthalate produced every day (Thomas et al., 1995).
CDOM absorption spectra were measured with a 100 cm, 250 μL capillary (LPC100CM) connected via an optical fiber to a light source (DH2000BAC) and a USB2000+UV-VIS ES detector (Ocean Optics). The system was controlled using Spectra-suite software (Ocean Optics). Samples were injected into the capillary with a peristaltic pump at a flow rate of 1 mL min–1. Relative molecular weight was estimated from CDOM absorption by deriving the slope ratio (SR), calculated as the ratio of the slope of the shorter wavelength region (275–295 nm) to that of the longer wavelength region (350–400 nm) (Helms et al., 2008). The spectral slopes were calculated from the linear regression of the log-transformed absorption spectra.
Statistical Analysis
Model II (Reduced Major Axis) linear regressions were conducted to determine potential correlations between log-normalized data of R and ETS activity, for the whole study and for each of the phases. Statistical significance was accepted for p-values higher than 0.05 (95% of confidence level). In order to quantify the error of the correlation predictors and to compare between the different models, the Mean Absolute Percentage Error (MAPE) was calculated.
To investigate the variables (Micro, Nano, Pico and HB biomass, Chla and TOC) that influence R and ETS activity during the two phases, multivariate regression models were fitted via Stepwise Multiple Linear Regressions (SMLR). Models were built both by adding predictor variables to an initial model in which R and ETS would not be correlated with any predictor variable (Forward SMLR method), and by removing predictor variables from a full model in which R and ETS would be correlated with all predictor variables (Backward SMLR method). The selection of the best explanatory model was based on Akaike’s Information Criterion (AIC). The model with lower AIC was considered as the best explanatory option for our data. All data were tested for multicollinearity using Variance Inflation Factors (VIF). Models were graphically tested for homoscedasticity. The contribution of every statistically significant predictor variable to the explained variance (R2) was quantified calculating the Relative Importance (RI; %) using the LMG method (Lindeman et al., 1980) All statistical computations were performed using R software1.
Results
Community Respiration (R) and ETS Activity
The rates of R over the course of the experiment ranged from 106 to 433 mg O2 m-3 d-1, with the highest values at the end of the experiment in the mesocosms with highest CO2 concentrations (Figure 1A). These rates are about 2–7 times higher than average values reported for open ocean waters of the Canary Islands (Arístegui and Montero, 1995). Despite the different concentrations of CO2 in the mesocosms, a common general trend was observed during phase I (from t1 to t17). R increased from t1 to t5 to t10 and decreased thereafter until nutrient fertilization (t18). ETS activity showed a steadier increase from t1 to t17, also with no significant differences among mesocosms during phase I (Figure 1B). After nutrient fertilization (phase II), R in M5, M6, and M8 increased and peaked on days t21–t23, decreasing toward the end of the experiment. R in M6 and M8 – the two mesocosms with the highest CO2 – started to increase after t23 reaching the highest rates at t29. R in M7 showed a delayed pattern with respect to other mesocosms, decreasing at t20–22 and peaking at t27. ETS during phase II showed similar trends as R, except at the end of the experiment, where ETS decreased in M6 and M8, while R increased.
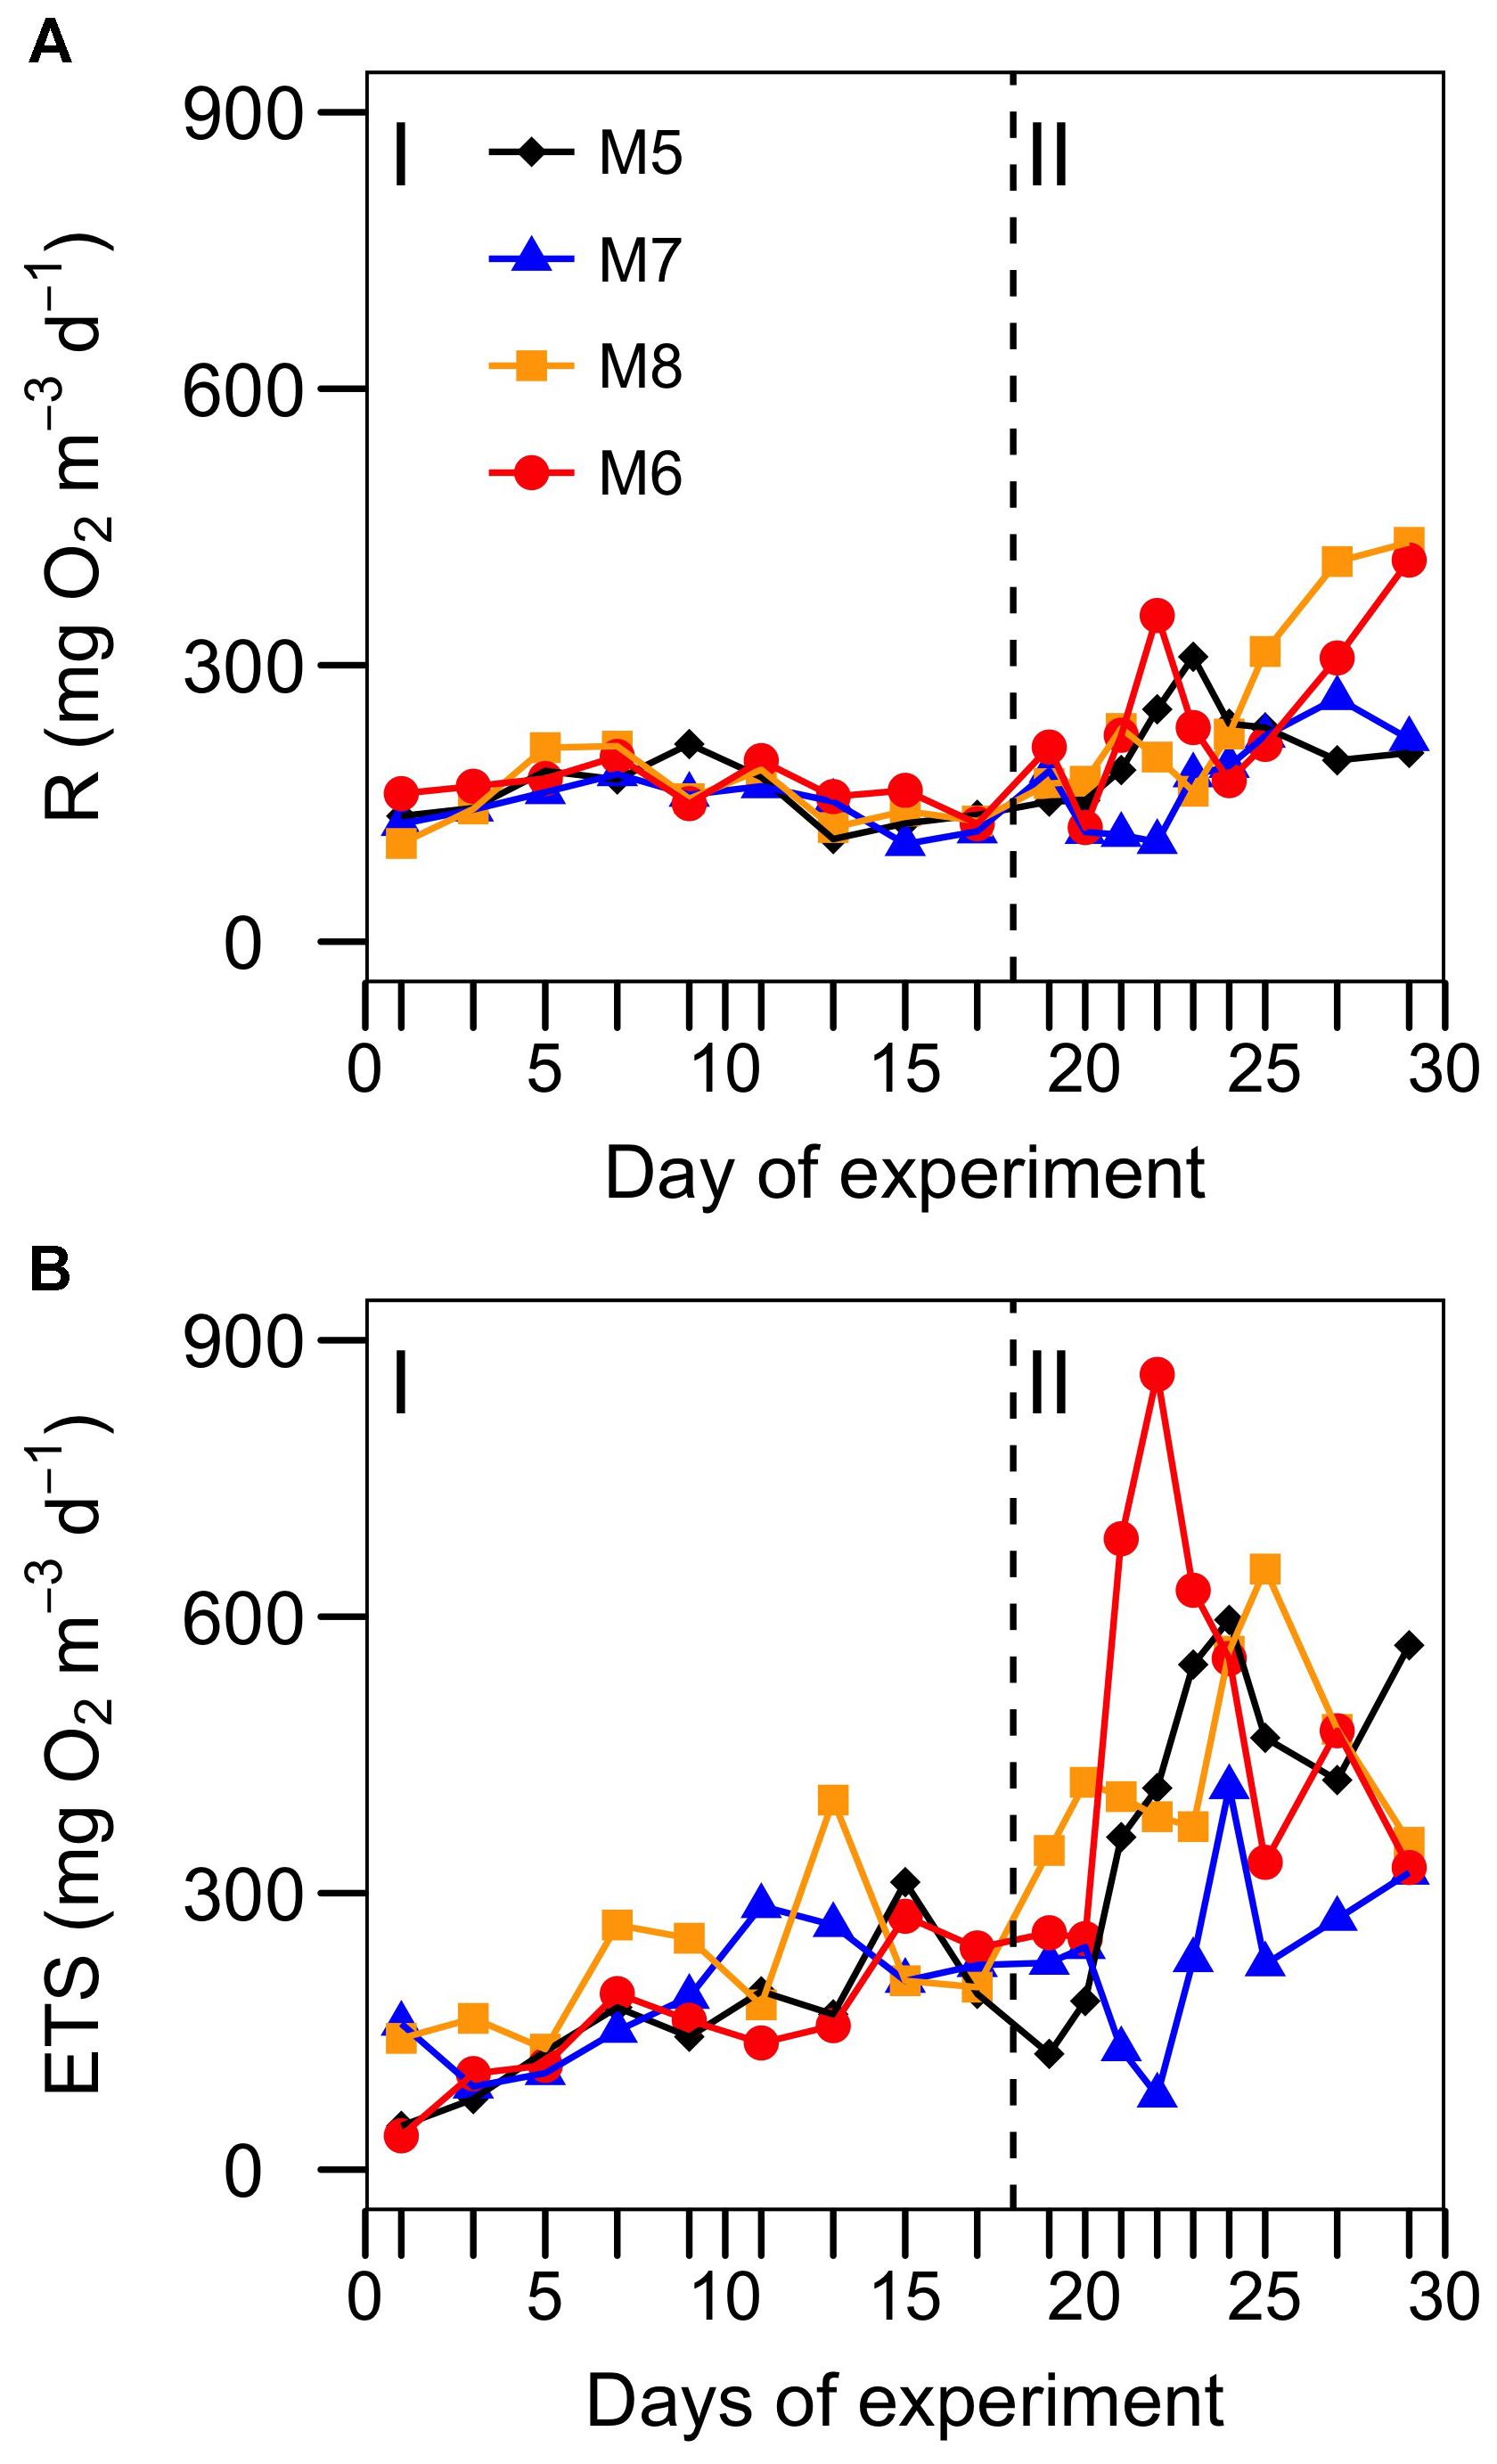
FIGURE 1. Temporal development of (A) oxygen consumption (R) and (B) ETS activity in each of the studied mesocosms. Target pCO2 values (in μatm) were: 400 (M5), 700 (M7), 1150 (M8), and 1450 (M6). I and II denote phases I and II. The vertical line indicates the day of nutrient fertilization.
Influence of Community Structure on R and ETS
The temporal development of the planktonic community, from HB to microplankton (Micro: diatoms and dinoflagellates), is represented in Figure 2. There were significant correlations between total biomass and R for all the mesocosms only during phase II, while ETS only correlated with total biomass in MK5 in phases I and II (Table 2). Some patterns of R and ETS can be attributed to changes in community structure. The relatively higher values of R from days t5 to t10 coincided with a transition period, with a decreasing pattern in the biomass of HB and Micro and increased biomass of nanoeukaryotes (Nano) (Figure 2). After nutrient fertilization (t18), the peaks of R and ETS observed on t21–24 in M5, M6, and M8 coincided both with peaks in Chla and in biomass of Nano. M7 behaved differently with respect to the other mesocosms in terms of the development of Chla and planktonic organisms. The exceptionally high zooplankton concentration observed in this mesocosm after nutrient fertilization (data not shown), probably prevented the fast development of the phytoplankton bloom (as occurred in the other mesocosms), showing a delay of several days in the Nano burst and thus in the increase in Chla, R, and ETS. The further increase in R with maximum rates at the end of the experiment in the two highest CO2 treatments matched the highest Chla and biomasses of HB and Micro (mostly large diatoms; data not shown) in M6 and M8, although HB decreased sharply the last day of the experiment in the two mesocosms. On the contrary, M5 and M7 presented lower Micro and HB biomasses with a relative dominance of Nano and picophytoplankton (Pico: Synechococcus + picoeukaryotes). Indeed, average planktonic biomasses at the different mesocosms show a transition in M5 and M7 from a diatom-dominated (phase I) to a Nano-dominated community, decreasing in total biomass, while in M6 and M8, the diatom-dominated community of phase I shifted to a co-dominance of HB and large diatoms (but see discussion below), with a clear increase in total biomass (Figure 3).
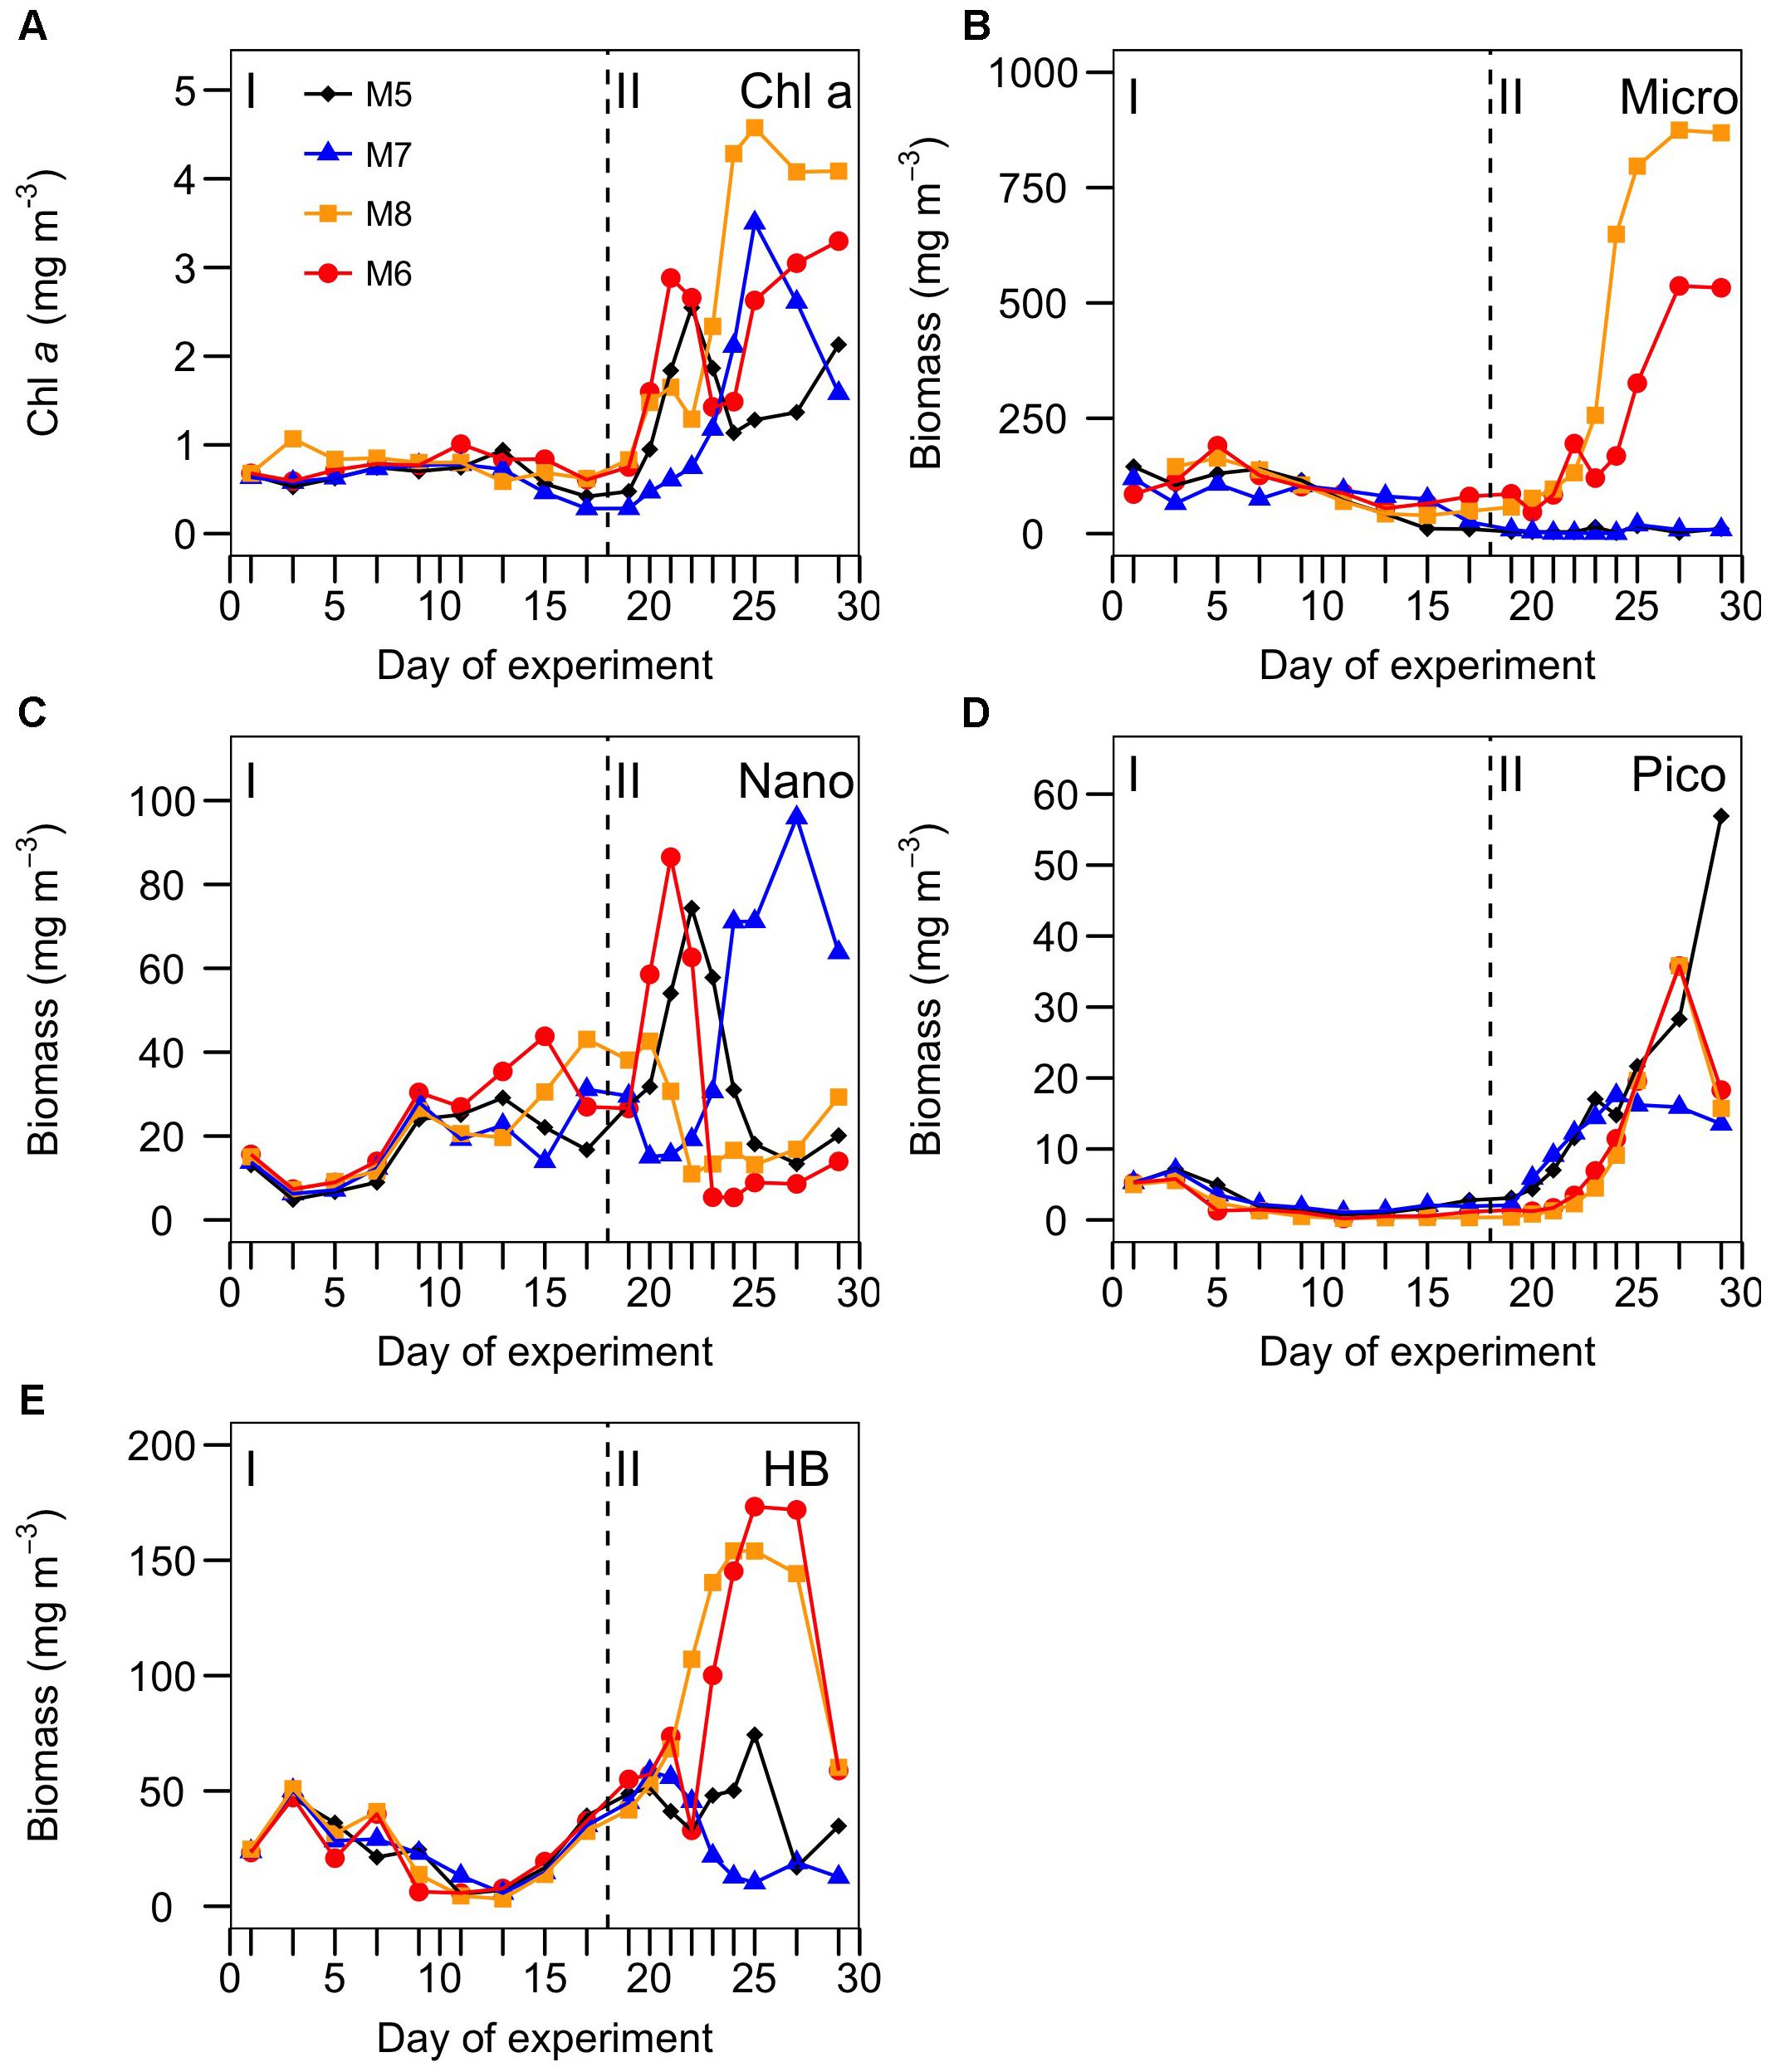
FIGURE 2. Temporal development of (A) chlorophyll a, and biomasses (in mg C m-3) of (B) microphytoplankton (diatoms + autotrophic and mixotrophic dinoflagellates), (C) nanophytoplankton (pigmented nanoeukaryotes), (D) picophytoplankton (picoeukaryotes + Synechococcus), and (E) heterotrophic bacteria (HB) in the studied mesocosms. Target pCO2 values (in μatm) were: 400 (M5), 700 (M7), 1150 (M8), and 1450 (M6). I and II denote phases I and II. The vertical line indicates the day of nutrient fertilization.
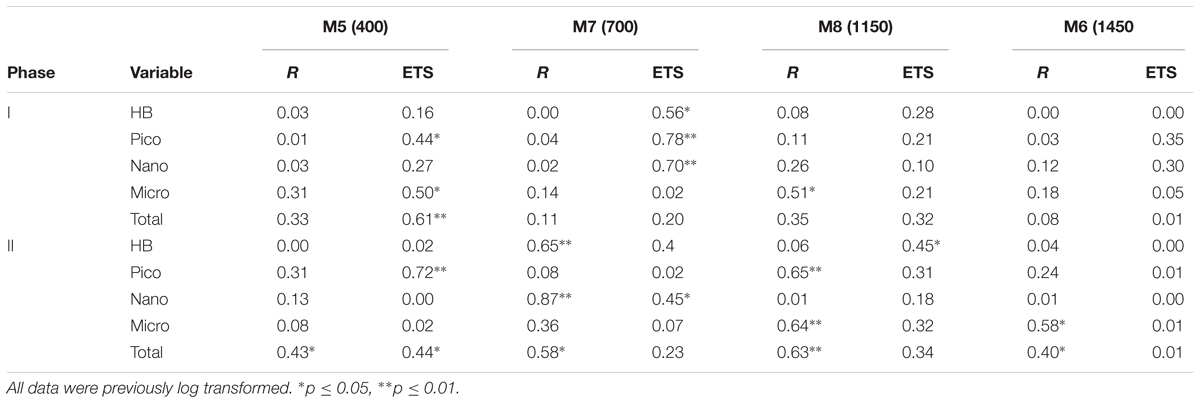
TABLE 2. Pearson pairwise correlation coefficients between community respiration (R) and ETS activity and the biomass of heterotrophic bacteria (HB), picophytoplankton (Pico), nanophytoplankton (Nano) and microphytoplankton (Micro), and the sum of all them (Total), during the two phases (I and II) of the experiment (target pCO2 concentrations in brackets).
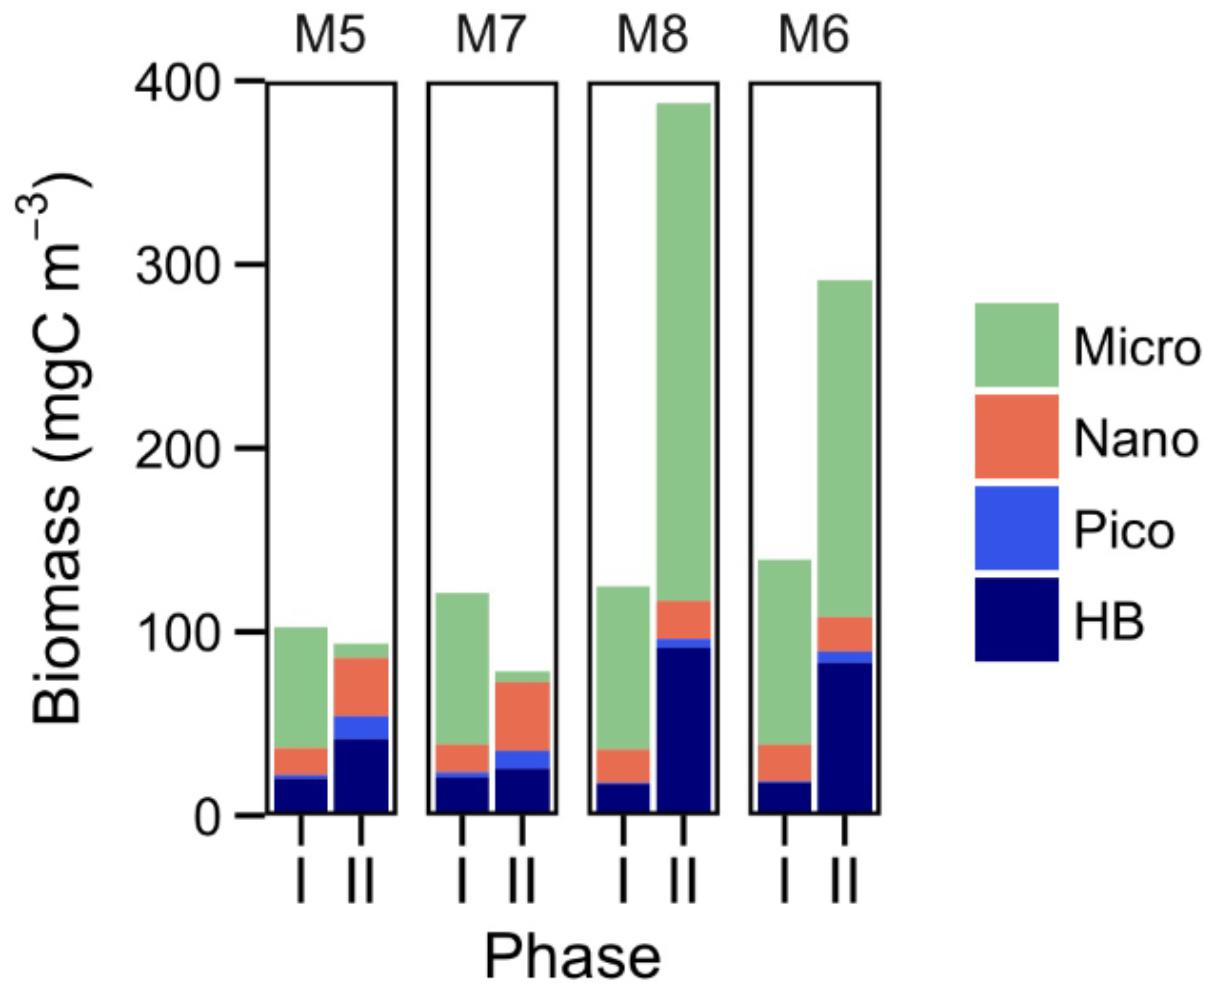
FIGURE 3. Average biomasses (mg C m-3) of heterotrophic bacteria (HB), picophytoplankton (picoeukaryotes + Synechococcus), nanophytoplankton (pigmented nanoeukaryotes), and microphytoplankton (diatoms and autotrophic + mixotrophic dinoflagellates), during the two phases of the experiment for each of the studied mesocosms.
Relationship Between R and ETS
R and ETS show a significant, although weak, positive correlation (r2 = 0.31, P < 0.001) for the whole experiment (Table 3). However, when splitting the data set into the two phases, the relationship of R and ETS before and after fertilization turns out to be very different (Figure 4 and Table 3): Phase I shows no significant correlation (r2= 0.02, P > 0.05), while the two variables are significantly correlated during phase II (r2= 0.38, P < 0.0001), when the phytoplankton bloomed after nutrient fertilization.
TABLE 3. Regression statistics for the relationship between actual respiration (R) and ETS activity in our study (phases I and II), compared with the study of Arístegui and Montero (1995) (A&M95) (see their Figures 2, 6).
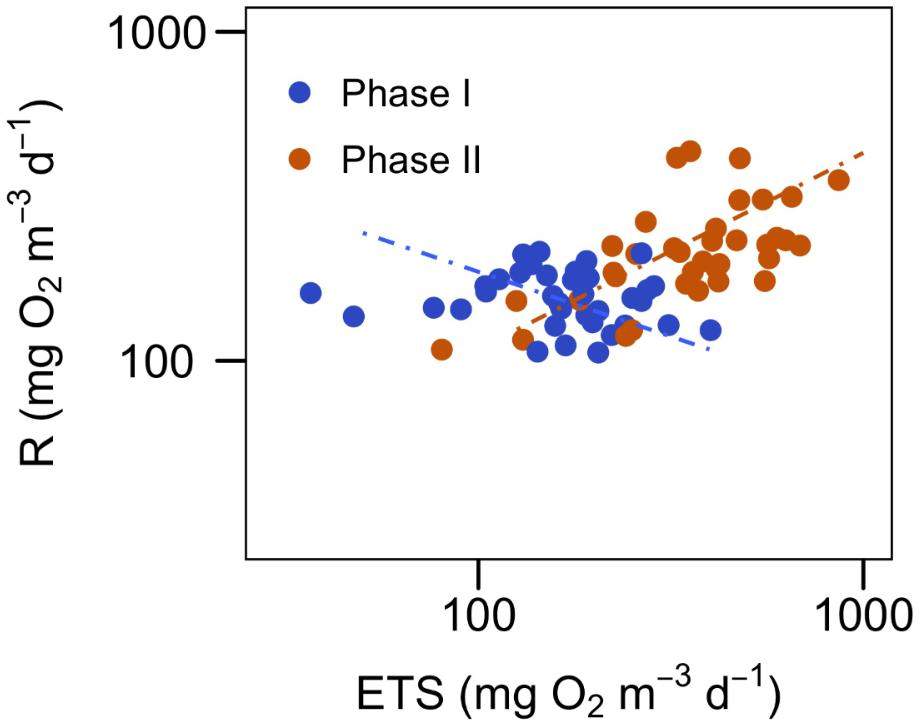
FIGURE 4. Relationship between community respiration (R) and ETS activity for the two phases of the experiment (see Table 3 for the statistics of the regressions). Data are log transformed for the regression analysis.
The average R/ETS ratios for all the mesocosms were markedly different during the two phases, being close to 1 in phase I and about 0.5 (except in M7) in phase II (Table 4).
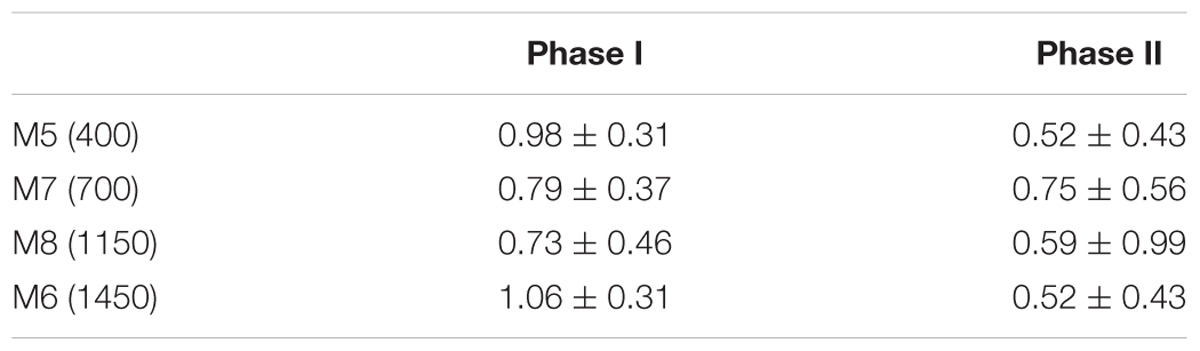
TABLE 4. Average ( ± SD) ratios of R/ETS from the two phases of the experiment: before (Phase I: t1–t17) and after (Phase II: t19–t29) fertilization, in the four mesoscosms studied (target pCO2 concentrations in brackets).
Discussion
One of the goals of this study was to explore the effect of CO2 concentration on the respiratory metabolism. Linear regression analysis detected no significant relationship (F-test, p > 0.05) between R and CO2 in any of the mesocosms, agreeing with previous observations by other authors (Egge et al., 2007; 14; Li and Gao, 2012; Motegi et al., 2013; Tanaka et al., 2013). However, when looking into the temporal development of R and ETS during the experiment (Figures 1A,B), we observed significant enhancements of R (but not ETS) at high CO2 during the last 5 days of the experiment. These results contrast with the conclusions of Spilling et al. (2016) from another recent ocean acidification mesocosm experiment performed in the Baltic Sea. They observed that lower R and bacterial remineralization occurred at elevated CO2 levels, resulting in high dissolved organic carbon accumulation. Although they discussed several mechanisms that might explain their results, they also acknowledge that the cause for reduced respiration at high CO2 remains unresolved. In our study, the high R associated with high CO2 treatments is probably not due to a direct effect on the specific metabolism of the organisms but to the increase in total planktonic biomass at the end of the experiment. HB increased in abundance in phase II right after the Nano decline (probably relieving the grazing pressure on HB) in parallel to the Micro rise, with both groups together reaching the highest biomasses (Figures 2, 3). Other studies carried out in mesocosms show a similar trend, with increased bacterial abundance and metabolism stimulated after the development of phytoplankton blooms (Grossart et al., 2006; Endres et al., 2014; Bergen et al., 2016).
M6 holds the highest plankton biomass in phase I, as well as in phase II (together with M8). This is reflected in higher concentrations of total organic carbon (TOC) excreted by the phytoplankton and accumulated during the experiment in M6 during phase I, and M6 and M8 during phase II (Figure 5A). The molecular weight of the colored dissolved organic matter (CDOM) – represented by the slope ratio (SR) – increased during the course of the experiment in all the mesocosms (Figure 5B; decreasing SR), suggesting that bacterial production of high molecular weight CDOM exceeded the rate of photochemical bleaching, responsible of breaking high molecular weight into low molecular weight organic compounds. Indeed, the only change in the decreasing trend of SR during phase I occurred around t10, when bacterial biomass was at its minimum (Figures 2E, 5B). Moreover, in the two mesocosms with highest CO2 there were significant correlations (Pearson pairwise coefficient) between TOC and HB biomass (r = 0.55, p < 0.05 for M6; r = 0.64, p < 0.01 for M8), suggesting a strong link between organic carbon dynamics and bacterial biomass.
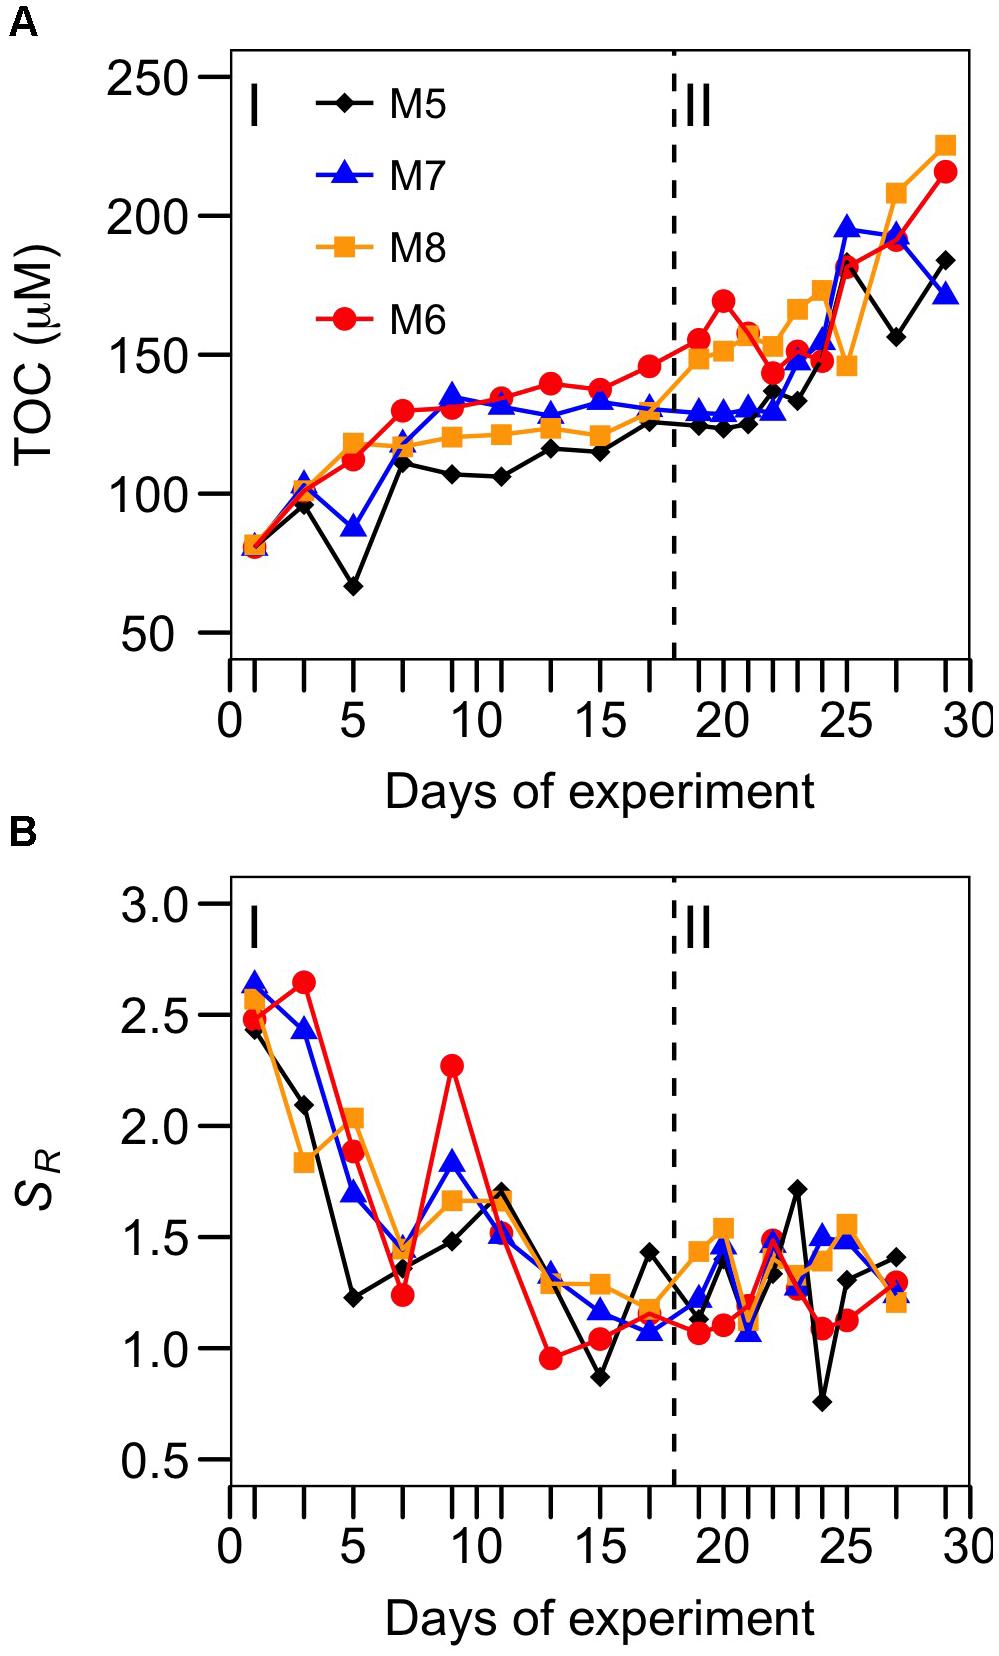
FIGURE 5. Temporal development of (A) total organic carbon (TOC) and (B) the slope ratio (SR) of chromophoric organic matter, as an index of molecular weight (see text for details) for each of the studied mesocosms. Target pCO2 values (in μatm) were: 400 (M5), 700 (M7), 1150 (M8), and 1450 (M6).
The specific contribution of HB to R and ETS, however, is uncertain. Multiple stepwise regressions (Table 5) show that R and ETS, average over the mesocosms, can be mostly explained by the phytoplankton community. Large phytoplankton explains most of the variance in R during phases I (86%) and II (53%) and of ETS (86%) during phase II, while picophytoplankton contributes up to 73% to explain the variance in the ETS model during phase I.
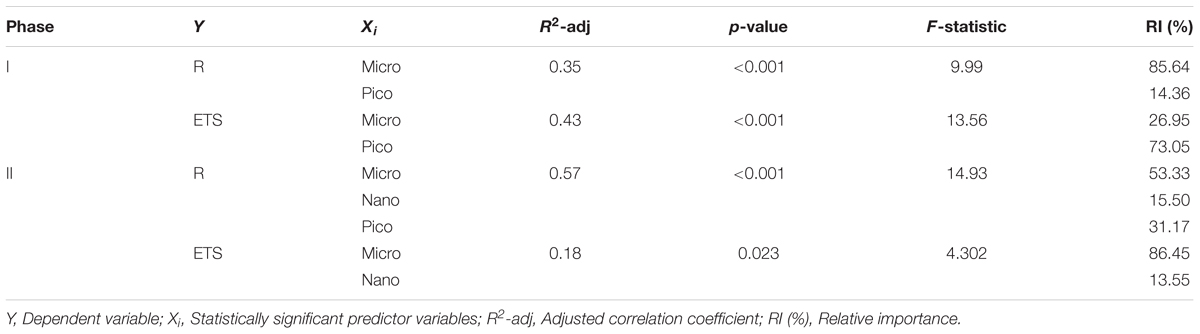
TABLE 5. Stepwise multiple linear regression statistics between actual respiration (R) and ETS activity and plankton biomasses (Micro, Nano, Pico, HB), Chlorophyll (Chla) and Total Organic Carbon (TOC) during the two phases (I and II) of the experiment.
Past studies on plankton respiration reported significant correlations between ETS and Chla, (e.g., Packard et al., 1983; Martinez, 1991; del Giorgio, 1992; Estrada et al., 1992; Packard and Christensen, 2004), suggesting that when seawater Chla is high, respiratory activity is mainly due to phytoplankton (Harrison, 1986; Martinez, 1991; Packard and Christensen, 2004). Our results, however, in spite of the large contribution of phytoplankton to biomass, show values ranging from 4 to 13 mg O2 mg Chla-1 d-1, which are similar to those reported by Martinez et al. (1990) for the western Mediterranean Sea (2–10 mg O2 mg Chla-1 d-1). In our study, in spite of the phytoplankton dominance during the two periods (Figure 3), ETS and R do not consistently correlate with Micro biomass, which largely contributes to total biomass in most of the mesocosms and phases. R, however, correlates with total biomass in the four mesocosms during phase II (Table 2), when diatoms’ biomass increased. This lack of a consistent correlation could result from the presence of a complex and variable in time planktonic community (Figures 2, 3), where HB do not seem to be a key player in the total community respiration. Indeed, recent studies from the North Atlantic indicate that the contribution of bacterial respiration to total community respiration may be highly variable, ranging from <5 to >75% (García-Martín et al., 2017, 2018).
Earlier studies showed that the R/ETS ratio may vary depending on the planktonic community structure and seasonality (e.g., Hobbie et al., 1972), with a general perception that autotrophic organisms have lower R/ETS ratios than heterotrophs (Kenner and Ahmed, 1975; Span, 1988; del Giorgio, 1992). Photosynthesis, like respiration, involves an ETS. Therefore, when autotrophs dominate the plankton community, the ETS assay would measure the potential activity of both processes, yielding higher ETS estimates, and hence lower R/ETS, than measured taking into account only the respiratory process (Packard, 1985). Supporting this hypothesis, Martinez, 1991) reported the highest values of ETS at the chlorophyll maximum layer for all the sampled stations during a cruise in the Barents Sea. Conversely, R/ETS would be higher with increased bacteria contribution to overall respiration (Fuhrman and Azam, 1980; Williams, 1984; Harrison, 1986). In our experiment, the R/ETS ratios were lower during the second period, after nutrient fertilization, coinciding with the phytoplankton bloom and the rise of diatoms. Our phase-average R/ETS data show significant variability between mesocosms during the course of the experiment (ranging from 0.5 to >1). This is however not surprising when looking at the published R/ETS ratios that span several fold (0.2 to >1) in phytoplankton cultures and natural samples (Table 1).
The application of a regression equation has been found to be a more reliable approach than the use of a mean R/ETS ratio to transform ETS activity to actual respiratory rates (e.g., Packard and Williams, 1981), but unfortunately there are very few published studies from natural communities to compare with. The only study where community R/ETS from different marine biogeographical regions (spanning from polar to tropical waters) are compared was published by Arístegui and Montero (1995). Their study shows that in all except one of the regions, measured R and ETS were significantly positively correlated, although the slopes and y-intercept of the regression equations differ up to 50% among regions. The regression equation obtained, considering all their data together, yields a mean error of ± 34% in the prediction of R from ETS, similar to the errors obtained applying the equation at each area, but much lower than applying an average R/ETS ratio (Arístegui and Montero, 1995). The regression between R and ETS in our study (even if we use only the data from phase II) yields a lower slope, a higher y-intercept and a lower r2 than the general equation for the global ocean (Table 3). The error in the prediction of R from ETS using only the data of phase II yields a mean error of ±20%, even lower than when including the data in the global equation. However, if we include the dataset of this study in the global equation of Arístegui and Montero (Figure 6 and Table 3), the slope, y-intercept and r2 do not change significantly, although the correlation is higher if we only include the data from phase II. All our data are placed in the highest range of the regression, closely together with the data from the eutrophic ecosystems of the Gulf of California and Baltic Sea (Figure 6; Arístegui and Montero, 1995). Nevertheless, the variability in the slopes and intercepts of our data with respect to the global equation raises the question of whether we can universally use a single R/ETS relationship to derive R from ETS activity in different communities and environmental conditions.
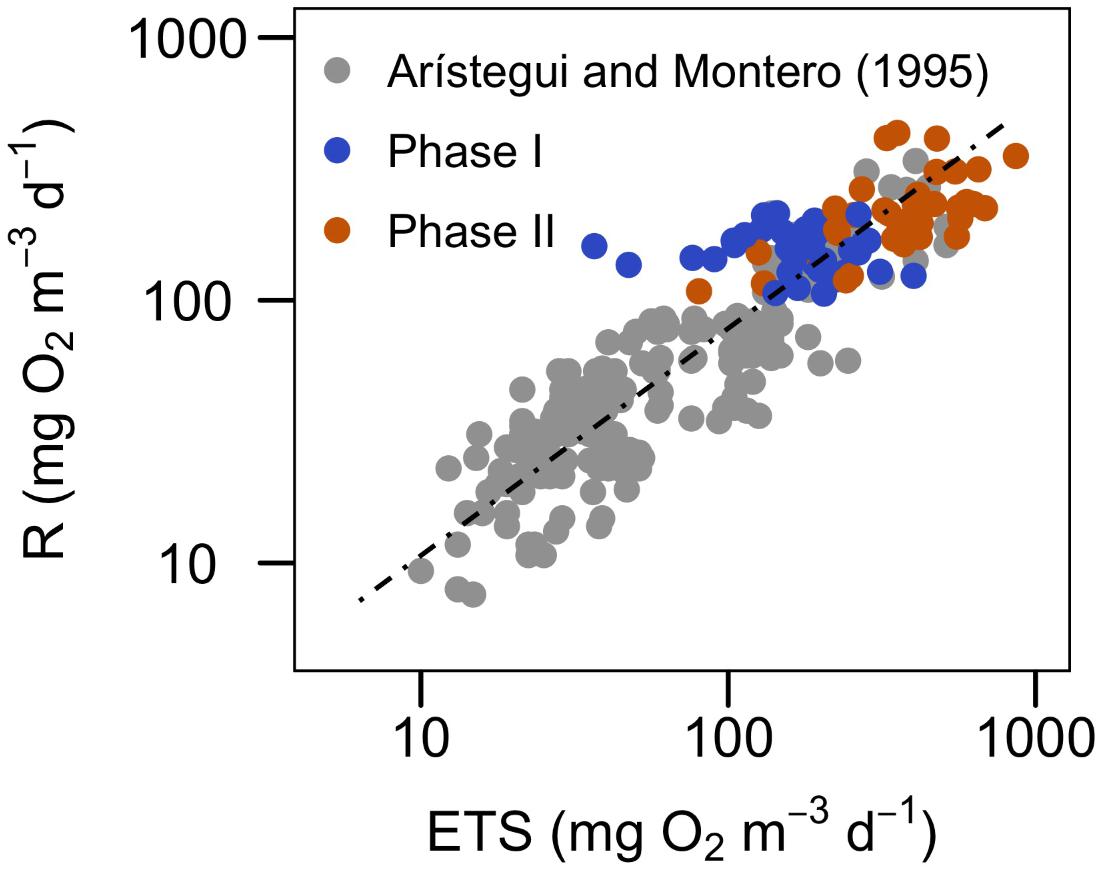
FIGURE 6. Relationship between community respiration (R) and ETS activity for the two phases of the experiment, plotted together with the database published by Arístegui and Montero (1995) (see Table 3 for the statistics of the regressions). Data are log transformed for the regression analysis.
Conclusion
This work represents one of the few studies where actual respiration rates (R) and ETS activity are measured simultaneously in natural marine communities. Moreover, it is the only study where R and ETS are measured under controlled conditions – inside mesocosms – and during a relatively long period of time (30 days), where the community undergoes drastic changes in nutrient and CO2 concentrations, as well as community structure.
R and ETS do not show any significant correlation with CO2 or community structure for the whole experiment, although R increased in the high CO2 treatments at the end of the experiment, matching the rise in diatoms after nutrient fertilization (phase II). Only during this phase R correlates significantly with total biomass in all the mesocosms.
The temporal development of R and ETS can be mostly explained by changes in the phytoplankton community. Large phytoplankton explains most of the variance in R during phases I and II and of ETS during phase II, while picophytoplankton contributes to explain the variance in ETS during phase I.
The R/ETS ratio ranged more than threefold in magnitude during the experiment. The average R/ETS is higher under nutrient depleted conditions (0.7–1.1), compared to the bloom period after nutrient fertilization, where the ratios reached lower and more similar values among the mesocosms (0.5–0.7).
Our results (together with other published studies) indicate that R/ETS may be too variable as to apply constant ratios in different marine regions and trophic conditions. The application of a regression equation is a more reliable approach than the use of a mean R/ETS ratio to transform ETS activity to actual respiratory rates. Nevertheless, further research, like the one carried out in this study, is necessary to constraint the variability of the R/ETS and to elucidate the universality of this equation.
Author Contributions
UR and JA conceived and designed the experiment. All authors performed the experiment and analyzed the data. JA and AF with input from all co-authors wrote the paper.
Funding
The KOSMOS project was funded by the German Federal Ministry of Education and Research (BMBF) in the framework of the coordinated project BIOACID – Biological Impacts of Ocean Acidification, phase II (FKZ 03F06550). UR received additional funding from the Leibniz Award 2012 by the German Research Foundation (DFG). JA was supported by a Helmholtz International Fellow Award, 2015 (Helmholtz Association, Germany). IB was supported by a FPI fellowship (BES-2016-078407) from the Spanish Ministry of Economy, Industry and Competitiveness (MINECO). NH-H was partially supported by KOSMOS funding during the experimental work, and by a grant of the Agencia Canaria de Investigación, Innovación y Sociedad de la Información (ACIISI) during the writing stage (TESIS2015010036). JA, MM, IB, and NH-H benefited also from the FLUXES project (CTM2015-69392-C3-1-R) funded by the Spanish government (Plan Nacional I+D).
Conflict of Interest Statement
The authors declare that the research was conducted in the absence of any commercial or financial relationships that could be construed as a potential conflict of interest.
Acknowledgments
We would like to thank the KOSMOS team and the Plataforma Oceánica de Canarias (PLOCAN) assisting with all aspects of the organization and logistical support before, during and after this mesocosms campaign, as well as to Minerva Espino and Acorayda González (IOCAG, ULPGC) for their technical support in the sampling and analyses of data.
Footnotes
References
Arístegui, J., Duarte, C. M., Gasol, J. M., and Alonso-Sáez, L. (2005). Active mesopelagic prokaryotes support high respiration in the subtropical northeast Atlantic Ocean. Geophys. Res. Lett. 32:L03608. doi: 10.1029/2004GL021863
Arístegui, J., and Montero, M. F. (1995). The relationship between community respiration and ETS activity in the ocean. J. Plankton Res. 17, 1563–1571. doi: 10.1093/plankt/17.7.1563
Baltar, F., Lindh, M. V., Parparov, A., Berman, T., and Pinhassi, J. (2012). Prokaryotic community structure and respiration during long-term incubations. MicrobiologyOpen 1, 214–224. doi: 10.1002/mbo3.25
Bangqin, H., Huasheng, H., Xiangzhong, X., and Yuan, L. (2005). Study on respiratory electron transport system (ETS) of phytoplankton in Taiwan Strait and Xiamen Harbour. Chin. J. Oceanol. Limnol. 23, 176–182. doi: 10.1007/BF02894235
Bergen, B., Endres, S., Engel, A., Zark, M., Dittmar, T., Sommer, U., et al. (2016). Acidification and warming effect prominent bacteria in two seasonal phytoplankton bloom mesocosms. Environ. Microbiol. 18, 4579–4595. doi: 10.1111/1462-2920.13549
Bidigare, R. R., King, F. D., and Biggs, D. C. (1982). Glutamate dehydrogenase (GDH) and respiratory electron-transport-system (ETS) activities in Gulf of Mexico zooplankton. J. Plankton Res. 4, 895–911. doi: 10.1093/plankt/4.4.895
Borsheim, K. Y., and Bratbak, G. (1987). Cell volume to cell carbon conversion factors ofr a bacterivorous Monas sp. enriched from seawater. Mar. Ecol. Prog. Ser. 36, 171–175. doi: 10.3354/meps036171
Bryan, J. R., Rlley, J. P., and Williams, P. L. (1976). A Winkler procedure for making precise measurements of oxygen concentration for productivity and related studies. J. Exp. Mar. Biol. Ecol. 21, 191–197. doi: 10.1016/0022-0981(76)90114-3
Carrit, D. E., and Carpenter, J. H. (1966). Recommendation procedure for Winkler analyses of sea water for dissolved oxygen. J. Mar. Res. 24, 313–318.
Christensen, J. P., Owens, T. G., Devol, A. H., and Packard, T. T. (1980). Respiration and physiological state in marine bacteria. Mar. Biol. 55, 267–276. doi: 10.1007/bf00393779
del Giorgio, P. A. (1992). The relationship between ETS (electron transport system) activity and oxygen consumption in lake plankton: a cross-system calibration. J. Plankton Res. 14, 1723–1741. doi: 10.1093/plankt/14.12.1723
del Giorgio, P. A., and Williams, P. L. B. (2005). “The global significance of respiration in aquatic ecosystems: from single cells to the biosphere,” in Respiration in Aquatic Ecosystems, eds P. A. del Giorgio and P. J. B. Williams (Oxford: Oxford University Press), 267–303. doi: 10.1093/acprof:oso/9780198527084.003.0014
Dubelaar, G. B. J., and Gerritzen, P. L. (2000). CytoBuoy: a step forward towards using flow cytometry in operational oceanography. Sci. Mar. 64, 255–265. doi: 10.3989/scimar.2000.64n2255
Egge, J. K., Thingstad, T. F., Engel, A., Bellerby, R. G. J., and Riebesell, U. (2007). Primary production during nutrient-induced blooms at elevated CO 2 concentrations. Biogeosciences 6, 877–885. doi: 10.5194/bg-6-877-2009
Endres, S., Galgani, L., Riebesell, U., Schulz, K. G., and Engel, A. (2014). Stimulated bacterial growth under elevated pCO2: results from an off-shore mesocosm study. PLoS One 9:e99228. doi: 10.1371/journal.pone.0099228
Estrada, M., Martinez, R., and Mathot, S. (1992). Respiratory electron transport activity in plankton of the Weddell and Scotia Seas during late spring—early summer: relationships with other biological parameters. Polar Biol. 12, 35–42. doi: 10.1007/BF00239963
Finlay, B., Span, A., and Ochsenbein-Gattlen, C. (1983). Influence of physiological state on indices of respiration rate in protozoa. Comp. Biochem. Physiol. 74, 211–219. doi: 10.1016/0300-9629(83)90590-X
Fuhrman, J. A., and Azam, F. (1980). Bacterioplankton secondary production estimates for coastal waters of British Columbia, Antarctica, and California. Appl. Environ. Microbiol. 39, 1085–1095.
García-Martín, E. E., Aranguren-Gassis, M., Hartmann, M., Zubkov, M. V., and Serret, P. (2017). Contribution of bacterial respiration to plankton respiration from 50 N to 44 S in the Atlantic Ocean. Prog. Oceanogr. 158, 99–108. doi: 10.1016/j.pocean.2016.11.006
García-Martín, E. E., Daniels, C. J., Davidson, K., Davis, C. E., Mahaffey, C., Mayers, K. M. J., et al. (2018). Seasonal changes in plankton respiration and bacterial metabolism in a temperate shelf sea. Prog. Oceanogr. (in press). doi: 10.1016/j.pocean.2017.12.002
Gasol, J. M., and Morán, X. A. (1999). Effects of filtration on bacterial activity and picoplankton community structure as assessed by flow cytometry. Aquat. Microbial Ecol. 16, 251–264. doi: 10.3354/ame016251
Gattuso, J. P., Peduzzi, S., Pizay, M. D., and Tonolla, M. (2002). Changes in freshwater bacterial community composition during measurements of microbial and community respiration. J. Plankton Res. 24, 1197–1206. doi: 10.1093/plankt/24.11.1197
Grasshoff, K., Ehrhardt, M., and Kremling, K. (eds) (1983). Determination of oxygen. Methods of Seawater Analysis. Weinheim: Verlag Chemie, 61–72.
Grossart, H. P., Allgaier, M., Passow, U., and Riebesell, U. (2006). Testing the effect of CO2 concentration on the dynamics of marine heterotrophic bacterioplankton. Limnol. Oceanogr. 51, 1–11. doi: 10.4319/lo.2006.51.1.0001
Harrison, W. G. (1986). Respiration and its size-dependence in microplankton populations from surface waters of the Canadian Arctic. Polar Biol. 6, 145–152. doi: 10.1007/BF00274877
Helms, J. R., Stubbins, A., Ritchie, J. D., Minor, E. C., Kieber, D. J., and Mopper, K. (2008). Absorption spectral slopes and slope ratios as indicators of molecular weight, source, and photobleaching of chromophoric dissolved organic matter. Limnol. Oceanogr. 53, 955–969. doi: 10.4319/lo.2008.53.3.0955
Hernández-León, S. (1988). Gradients of mesozooplankton biomass and ETS activity in the wind-shear area as evidence of an island mass effect in the Canary Island waters. J. Plankton Res. 10, 1141–1154. doi: 10.1093/plankt/10.6.1141
Hernández-León, S., Postel, L., Arístegui, J., Gómez, M., Montero, M. F., Torres, S., et al. (1999). Large-scale and mesoscale distribution of plankton biomass and metabolic activity in the Northeastern Central Atlantic. J. Oceanogr. 55, 471–482. doi: 10.1023/A:100782292
Hobbie, J. E., Holm-Hansen, O., Packard, T. T., Pomeroy, L. R., Sheldon, R. W., Thomas, J. P., et al. (1972). A study of the distribution and activity of microorganisms in ocean water. Limnol. Oceanogr. 17, 544–555. doi: 10.4319/lo.1972.17.4.0544
Hopkinson, C. S. J., Sherr, B., and Wiebe, W. J. (1989). Size-fractionated metabolism of coastal microbial plankton. Mar. Ecol. Prog. Ser. 51, 155–166. doi: 10.3354/meps051155
Hopwood, M. J., Riebesell, U., Arístegui, J., Ludwig, A., Achterberg, E. P., and Hernández, N. (2018). Photochemical versus bacterial control of H2O2 concentration across a pCO2 gradient mesocosm experiment in the subtropical North Atlantic. Front. Mar. Sci. 5:105. doi: 10.3389/fmars.2018.00105
Jürgens, K., Gasol, J. M., and Vaque, D. (2000). Bacteria–flagellate coupling in microcosm experiments in the Central Atlantic Ocean. J. Exp. Mar. Biol. Ecol. 245, 127–147. doi: 10.1016/S0022-0981(99)00156-2
Kenner, R. A., and Ahmed, S. I. (1975). Measurements of electron transport activities in marine phytoplankton. Mar. Biol. 33, 119–127. doi: 10.1007/BF00390716
King, F. D., and Packard, T. T. (1975). Respiration and the activity of the respiratory electron transport system in marine zooplankton. Limnol. Oceanogr. 20, 849–854. doi: 10.4319/lo.1975.20.5.0849
Li, W., and Gao, K. (2012). A marine secondary producer respires and feeds more in a high CO2 ocean. Mar. Pollut. Bull. 64, 699–703. doi: 10.1016/j.marpolbul.2012.01.033
Lindeman, R. H., Merenda, P. F., and Gold, R. Z. (1980). Introduction to Bivariate and Multivariate Analysis. Glenview, IL: Scott Foresman.
Martinez, R. (1991). Biomass and respiratory ETS activity of microplankton in the Barents Sea. Polar Res. 10, 193–200. doi: 10.3402/polar.v10i1.6738
Martinez, R. (1992). Respiration and respiratory electron transport activity in marine phytoplankton: growth rate dependence and light enhancement. J. Plankton Res. 14, 789–797. doi: 10.1093/plankt/14.6.789
Martinez, R., Arnone, R. A., and Velasquez, Z. (1990). Chlorophyll a and respiratory electron transport system activity in microplankton from the surface waters of the western Mediterranean. J. Geophys. Res. 95, 1615–1622. doi: 10.1029/JC095iC02p01615
Massana, R., PedrósAlió, C., Casamayor, E. O., and Gasol, J. M. (2001). Changes in marine bacterioplankton phylogenetic composition during incubations designed to measure biogeochemically significant parameters. Limnol. Oceanogr. 46, 1181–1188. doi: 10.4319/lo.2001.46.5.1181
Menden-Deuer, S., and Lessard, E. J. (2000). Carbon to volume relationships for dinoflagellates, diatoms, and other protist plankton. Limnol. Oceanogr. 45, 569–579. doi: 10.4319/lo.2000.45.3.0569
Mimura, T., Romano, J. C., and de Souza-Lima, Y. (1988). Microbiomass structure and respiratory activity of microneuston and microplankton in the northwestern Mediterranean Sea influenced by Rhone River water. Mar. Ecol. Prog. Ser. 49, 151–162. doi: 10.3354/meps049151
Motegi, C., Tanaka, T., Piontek, J., Brussaard, C. P. D., Gattuso, J. P., and Weinbauer, M. G. (2013). Effect of CO2 enrichment on bacterial metabolism in an Arctic fjord. Biogeosciences 10, 3285–3296. doi: 10.5194/bg-10-3285-2013
Packard, T. T. (1971). The measurement of respiratory electron transport activity in marine phytoplankton. J. Mar. Res. 29, 235–244.
Packard, T. T. (1985). Measurement of electron transport activity of microplankton. Adv. Aqua. Microbiol. 3, 207–261.
Packard, T. T., and Christensen, J. P. (2004). Respiration and vertical carbon flux in the Gulf of Maine water column. J. Mar. Res. 62, 93–115. doi: 10.1357/00222400460744636
Packard, T. T., Garfield, P. C., and Martinez, R. (1983). Respiration and respiratory enzyme activity in aerobic and anaerobic cultures of the marine denitrifying bacterium, Pseudomonasperfectomarinus. Deep Sea Res. A 30, 227–243. doi: 10.1016/0198-0149(83)90008-0
Packard, T. T., and Williams, P. J. L. (1981). Rates of respiratory oxygen-consumption and electron-transport in surface seawater from the northwest Atlantic. Oceanol. Acta 4, 351–358.
Ramírez, T., Liger, E., Mercado, J. M., Cortés, D., Vargas-Yañez, M., Sebastián, M., et al. (2006). Respiratory ETS activity of plankton in the northwestern Alboran Sea: seasonal variability and relationship with hydrological and biological features. J. Plankton Res. 28, 629–641. doi: 10.1093/plankt/fbi146
Reinthaler, T., Van Aken, H., Veth, C., Arístegui, J., Robinson, C., Williams, P. J. L. B., et al. (2006). Prokaryotic respiration and production in the meso- and bathypelagic realm of the eastern and western North Atlantic basin. Limnol. Oceanogr. 51, 1262–1273. doi: 10.4319/lo.2006.51.3.1262
Robinson, C., and Williams, P. J. B. (2005). “Respiration and its measurement in the surface waters,” in Respiration in Aquatic Ecosystems, eds P. A. del Giorgio,and P. J. B. Williams (New York, NY: Oxford University Press), 147–180. doi: 10.1093/acprof:oso/9780198527084.003.0009
Schalk, P. H. (1988). Respiratory electron transport system (ETS) activities in zooplankton and micronekton of the Indo-Pacific region. Mar. Ecol. Prog. Ser. 44, 25–35. doi: 10.3354/meps044025
Span, A. S. (1988). Metabolic activity as reflected by ETS and BOD in a shallow eutrophic lake. Arch. Hydrobiol 31, 141–147.
Spilling, K., Schulz, K. G., Paul, A. J., Boxhammer, T., Achterberg, E. P., Hornick, T., et al. (2016). Effects of ocean acidification on pelagic carbon fluxes in a mesocosm experiment. Biogeosciences 13:6081. doi: 10.5194/bg-13-6081-2016
Strickland, J. D. H., and Parsons, T. R. (1960). A Manual of Sea Water Analysis. Ottawa, ON: Bulletin Fisheries Research Board of Canada.
Tanaka, T., Alliouane, S., Bellerby, R. G. B., Czerny, J., De Kluijver, A., Riebesell, U., et al. (2013). Effect of increased pCO2 on the planktonic metabolic balance during a mesocosm experiment in an Arctic fjord. Biogeosciences 10:315. doi: 10.5194/bg-10-315-2013
Thomas, C., Cauwet, G., and Minster, J. F. (1995). Dissolved organic carbon in the equatorial Atlantic Ocean. Mar. Chem. 49, 155–169. doi: 10.1016/0304-4203(94)00061-H
Vosjan, J. H., and Nieuwland, G. (1987). Microbial biomass and respiratory activity in the surface waters of the east Banda Sea and northwest Arafura Sea (Indonesia) at the time of the southeast monsoon. Limnol. Oceanogr. 32, 767–775. doi: 10.4319/lo.1987.32.3.0767
Vosjan, J. H., Nieuwland, G., Ernst, W., and Bluszcz, T. (1987). Shipboard comparison of two methods of extraction and measurements of ATP applied to Antarctic water samples. Netherlands J. Sea Res. 21, 107–112. doi: 10.1016/0077-7579(87)90026-3
Vosjan, J. H., Tijssen, S. B., Nieuwland, G., and Wetsteyn, F. J. (1990). Oxygen regime, respiratory activity and biomass of microorganisms, and the carbon budget in the Fladen Ground area (Northern North Sea) during spring. Netherlands J. Sea Res. 25, 89–99. doi: 10.1016/0077-7579(90)90011-5
Williams, P. L. (1984). A review of measurements of respiration rates of marine plankton populations. Heterotr. Activity Sea 15, 357–389. doi: 10.1007/978-1-4684-9010-7_16
Keywords: plankton respiration, ETS activity, R/ETS, ocean acidification, nutrient fertilization, mesocosm, subtropical North Atlantic
Citation: Filella A, Baños I, Montero MF, Hernández-Hernández N, Rodríguez-Santos A, Ludwig A, Riebesell U and Arístegui J (2018) Plankton Community Respiration and ETS Activity Under Variable CO2 and Nutrient Fertilization During a Mesocosm Study in the Subtropical North Atlantic. Front. Mar. Sci. 5:310. doi: 10.3389/fmars.2018.00310
Received: 29 March 2018; Accepted: 13 August 2018;
Published: 28 August 2018.
Edited by:
Hongbin Liu, Hong Kong University of Science and Technology, Hong KongReviewed by:
J. Michael Beman, University of California, Merced, United StatesCarol Robinson, University of East Anglia, United Kingdom
Copyright © 2018 Filella, Baños, Montero, Hernández-Hernández, Rodríguez-Santos, Ludwig, Riebesell and Arístegui. This is an open-access article distributed under the terms of the Creative Commons Attribution License (CC BY). The use, distribution or reproduction in other forums is permitted, provided the original author(s) and the copyright owner(s) are credited and that the original publication in this journal is cited, in accordance with accepted academic practice. No use, distribution or reproduction is permitted which does not comply with these terms.
*Correspondence: Javier Arístegui, amF2aWVyLmFyaXN0ZWd1aUB1bHBnYy5lcw==