 Noora Haavisto
 Laura Tuomi
 Petra Roiha
 Simo-Matti Siiriä1
 Pekka Alenius
- 1Department of Marine Research, Finnish Meteorological Institute, Helsinki, Finland
- 2Department of Observation Services, Finnish Meteorological Institute, Helsinki, Finland
We made an assessment of the hydrography in the Bothnian Sea based on data collected by the Argo floats during the first 6 years of operation in the Bothnian Sea (2012–2017). We evaluated the added value of Argo data related to the pre-existing monitoring data. The optimal usage and profiling frequency of Argo floats was also evaluated and the horizontal and vertical coverage of the profiles were assessed. For now we lose 4 m of data from the surface due to sensor design and some meters from the bottom because of the low resolution of available bathymetry data that is used to avoid bottom collisions. Mean monthly temperature and salinity close to surface and below halocline from the float data were within the boundaries given in literature, although some variation was lost due to scarcity of winter profiles. The temporal coverage of the Argo data is much better than that of ship monitoring, but some spatial variability is lost since the floats are confined in the over 100 m deep area of the Bothnian Sea. The possibility to adjust the float profiling frequency according to weather forecasts was successfully demonstrated and found a feasible way to get measurements from storms and other short term phenomena unreachable with research vessels. First 6 years of operation have shown that Argo floats can be successfully operated in the challenging conditions of the Bothnian Sea and they are shown to be an excellent addition to the monitoring network there. With multiple floats spread in the basin we can increase our general knowledge of the hydrographic conditions and occasionally get interesting data related to intrusions and mixing during high wind events and other synoptic scale events.
1. Introduction
The physical properties of the water masses and the changes in them have been monitored in the Bothnian Sea since the late 19th century (Pettersson and Ekman, 1897). Ocean observation techniques have evolved during the past century from manual shipborne water sampling to ever more precise and autonomous measurements with modern electronic devices. In the last 40 years CTD (Conductivity-Temperature-Depth) profiling from research vessels has been the most common practice of standard monitoring. Moored instruments at surface, at certain depths and profiling moorings are also used along with remote sensing. Various remotely operable platforms for measuring hydrography, for example Argo floats, gliders and wave gliders, have become widely used. The most commonly used is the Argo float. There are close to 4,000 floats spread in the oceans worldwide as a part of the International Argo Program, but they have seen little use in shallow coastal seas. For example Grayek et al. (2015) and Kassis et al. (2015) have deployed floats in relatively small basins in the Cretan Sea and the Black Sea, but these areas are much deeper than the Bothnian Sea.
Monitoring of the sea is essential for gaining knowledge of the past and present state and changes of the water column, and the effect of climate change on our sea areas. At present the Finnish monitoring of the Bothnian Sea hydrography in the open sea areas is the responsibility of the Finnish Meteorological Institute and the monitoring is done in co-operation with the Finnish Environment Institute three times a year as a part of the Helsinki Comission (HELCOM) monitoring programme COMBINE (HELCOM, 2014).
Although monitoring aims at providing long time series from fixed locations to evaluate the long-term changes in the state of the Bothnian Sea, for many applications measurements with higher temporal resolution that reflect the course of seasonal cycles of temperature and salinity are needed. Even higher temporal resolution, with observation interval being a day or in some cases even less allows us to record phenomena happening in short time scales, and helps to put the sparse ship monitoring data into context in relation to the seasonal cycles. Improving modeled forecasts by data assimilation and validation also require frequent in-situ data. Argo floats provide a relatively cost efficient method for measuring with high temporal resolution in the open sea.
The Finnish Meteorological Institute (FMI) first tested an Argo float in the Baltic Sea in 2011 and has operated them in the Bothnian Sea and the Gotland deep since 2012 as a part of Euro-Argo ERIC. We now have an operational float in the Bothnian Bay as well. The characteristics of the Baltic Sea present challenges to float operations, but the floats have been found to function adequately there. Their data has already been used for model validation (Westerlund and Tuomi, 2016) and the deep water circulation in the Bothnian Sea was assessed from their drift speed by Roiha et al. (2018).
In this study we assess the hydrography of the Bothnian Sea based on the first 6 years of Argo data. The added value of Argo floats to the existing monitoring network, that in the open sea consists only of ship observations from regular monitoring cruises, is evaluated and different options for Argo float use in the Bothnian Sea are compared. Finally we make suggestions for further development of the monitoring network in the Bothnian Sea.
1.1. The Bothnian Sea
The Bothnian Sea is a shallow semi-enclosed sub-basin of the Baltic Sea. It is connected to the Baltic Sea Proper only through narrow straits through the Åland Sea (the Southern Quark) and the shallow Archipelago Sea connecting it to the northern Baltic Sea Proper (Figure 1). The water in the basin, as in the entire Baltic Sea, is brackish due to large river runoff and limited inflow of saline water from the Baltic Proper. The surface area of the Bothnian Sea is 64,886 km2 and the mean depth is 66 m (Fonselius, 1996), with an over 100 m deep area reaching from the sill to Åland Sea along the Finnish coast to North-Northeast (referred to as the Bothnian Sea deep in this work), and shallower banks with numerous shoals on the Swedish side called Finngrunden banks. The deepest point in the Bothnian Sea is the Ulvö deep next to the northern Swedish coast.
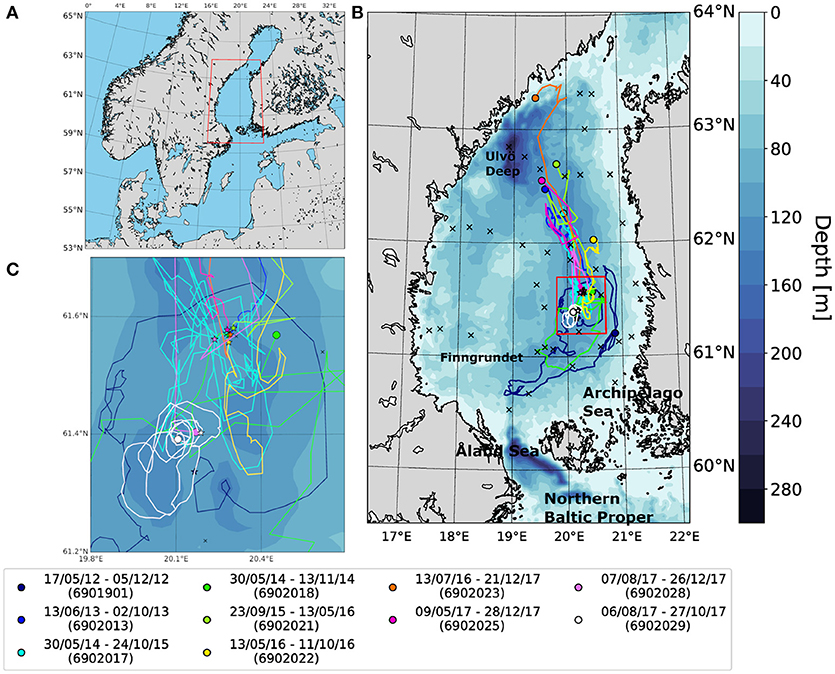
Figure 1. (A) Bothnian Sea location in the Baltic Sea (B), Argo float drift routes in the Bothnian Sea, and (C) a zoomed in map of the deployment area. The colors indicate separate deployments, and the stars and circles represent the deployment point ant the point of float retrieval or of latest profile, respectively. The black x:s show locations of CTD-profiles measured in the Bothnian Sea deep during 2012–2017. The bathymetry data is from Seifert et al. (2001).
A weak halocline on average at 50–60 m separates the deep water from the mixed layer in the Bothnian Sea. The mixed layer overturns in the spring and autumn, and in the summer a thermocline of 15 m depth on average forms. The Bothnian Sea is at least partially covered by sea ice every winter. Fresh water runoff from land dominates the mixed layer, while the deep water is replenished by inflow of saline water from above the halocline in the northern Baltic Sea Proper (Håkansson et al., 1996; Hietala et al., 2007). There is a N-S gradient in salinity in the Bothnian Sea, with more saline water in the South and along the Finnish coast, than in the North and down the Swedish coast. The surface salinity ranges from 4.8 to 6.0 g kg−1 and the bottom salinity is between 6.4 and 7.2 g kg−1 (Bock, 1971). The average temperature at the surface reaches 16 °C in the summer, and the bottom temperature varies between 1.5 and 4.5 °C (Haapala and Alenius, 1994).
1.2. Argo Floats in the Bothnian Sea
Argo floats are designed for open ocean, where proximity to shoreline or bottom depth do not have to be considered. The specific features of the Bothnian Sea, such as seasonal ice cover, relatively small size of the basin and low salinity, present challenges for the operation of floats. There are risks of the float touching the bottom and getting stuck, drifting to even shallower waters and on shore, and hitting seasonal ice cover.
Seasonal differences in the Bothnian Sea stratification present a challenge for the float diving. A large change in the float density may be needed to penetrate the seasonal thermocline and the halocline, but in spring and autumn only a small float density change may result in sinking straight to the bottom in the overturned water column. To address this problem Purokoski et al. (2013) modified APEX float's diving algorithm to respond faster to pressure change. This method worked, but it increased the energy consumption of the float and therefore was not applied in further missions to increase the mission duration.
To prevent collision with seasonal ice cover, the float can be commanded to cut the ascent at a certain threshold of temperature. So far 0–1 °C has been used depending on the conditions, but more ice winters are needed to find an optimal value. If the float does not reach the surface it saves the data and sends it when the GPS connection has been established next time. The ice avoidance limits data coverage of the upper water column during ice season.
When operating in small basins, it is beneficial to have some control on the drifting of the floats, so that they do not drift to shallow coastal waters. It was found that driving the floats to the vicinity of the bottom between the measurement cycles worked well, and also in some cases lead to nearly stationary floats. An advantage with operating so close to shore is that the floats can be retrieved for maintenance after each mission and redeployed. On the other hand the floats in the Bothnian Sea require in general much more operator time than the usual open ocean floats.
2. Observations and Methods
2.1. Argo Data
The Argo profiles used in the analysis of this paper were collected in the Bothnian Sea in 2012 –2017. The data is from 10 different deployments, six of which were done with reused floats. In Argo system the floats are identified with unique WMO numbers that are related to the deployments rather than the physical float themselves. The floats used were 2,000 m APEX floats by Teledyne Webb Research. The details of the used floats and their measured parameters are listed in Table 1. For detailed information of the sensors and Argo float structure and operation see Teledyne Webb Research, Inc. (2013). The data is freely available at Argo (2000)1.
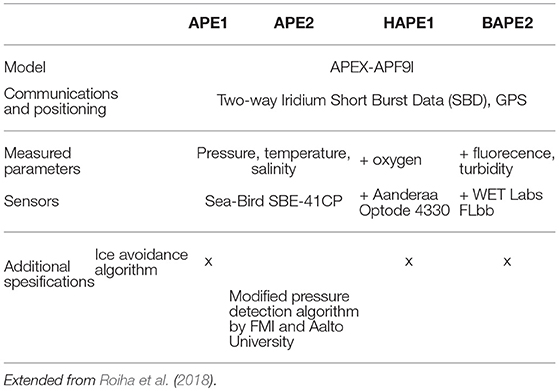
Table 1. Details of the Argo floats used in the Bothnian Sea 2012–2017.
Altogether 1,280 float cycles were recorded over the 6 years period, of which 1,083 resulted in a profile of the water column. Here unsuccessful cycles were defined as profiles with only up to four measurement points in the entire water column. The percentage of failed profiles varies between deployments (Table 2). Most of these failed profiles were due to float being temporarily stuck in the bottom or the float not diving properly from the surface in the first place. The sampling resolution was 2 dbar except for profiles less than 50 m deep, for which the sampling resolution is 5 dbar due to a software bug in the floats. In this paper “delayed mode” data was used whenever available, and only data with a quality flag 1 or 2 were used (see Argo Data Management Team, 2017 for details). Missing latitude and longitude information for cycles that didn't reach the surface were interpolated for the purpose of density and salinity calculations.
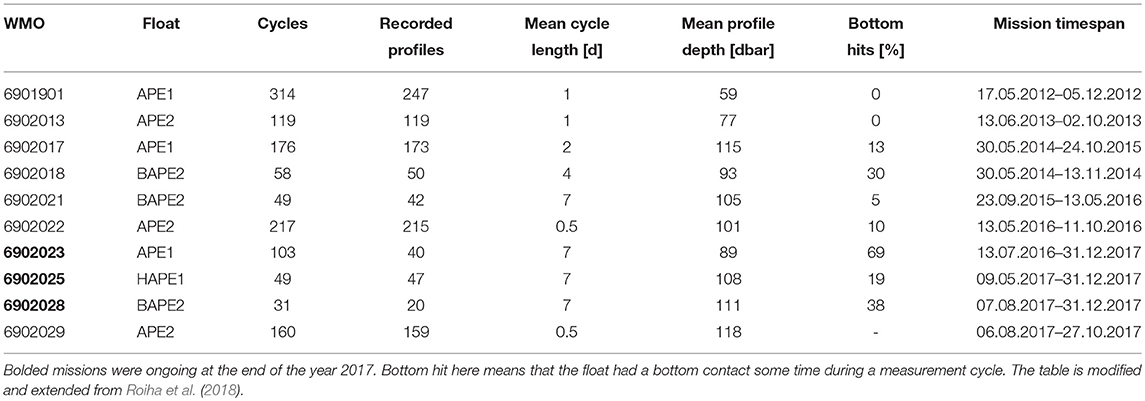
Table 2. Argo float deployments in the Bothnian Sea in 2012–2017.
Most of the Argo profiles were measured during the ice free season, and since 2014 continuous measurements have been made with at least one float over wintertime, although there are some short gaps in 2016–2017 where the mission 6902023 didn't provide profiles due to it being temporarily stuck in the bottom (Figure 2A). The mean deepest measurement point per profile for all missions was at 94 dbar, and the mean deepest measurement point per profile of each mission varied from 59 (6901901) to 118 dbar (6902029) (Table 2) depending on the drifting area and target pressure relative to bathymetry. The deepest pressure measured at was 130 dbar (26.10.2017, 6902029).
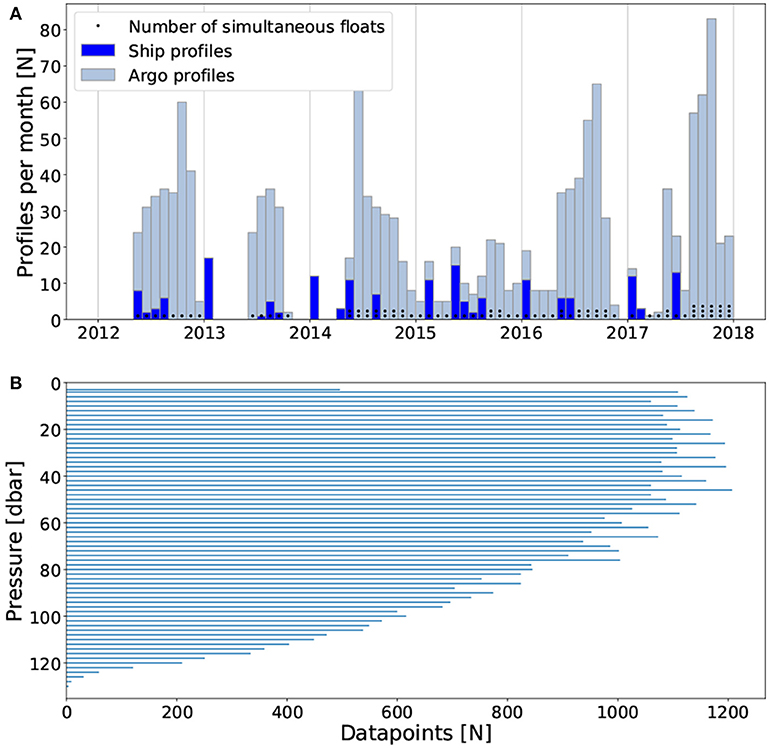
Figure 2. (A) Number of measured Argo profiles (gray) and CTD profiles (blue) per month in the Bothnian Sea for 2012–2017. The black dots represent the amount of simultaneous floats each month. (B) Number of measurements per depth with a 2 dbar resolution with the Argo floats during 2012–2017.
All the floats were deployed inside an area of 615 km2 with maximum 28 km between the deployment points (Figure 1). The floats mostly stayed confined in the Bothnian Sea deep basin. Two floats had a cyclonic drift path along isobaths in the southern Bothnian Sea (missions 6901901 and 6902018), one was almost stationary with maximum distance between profiles being 24 km (6902029), and the rest followed the deep toward North-Northeast. There were three simultaneous deployments in the autumn of 2017 (6902025, 6902028, and 6902029) with 6902028 and 6902029 close to each other and 6902025 more to the North (locations of the floats shown in Figure 1). A fourth float, mission 6902023, was also active during the same period, but it was stuck in the bottom from May to December 2017.
During the first two missions (6901901 and 6902013) the park pressure of the floats was kept at around 80 dbar to avoid bottom contacts. Due to this, approximately a 30 m deep layer above the bottom was not observed. For the rest of the missions the floats were kept closer to bottom, on average 10 m away, for better steering. This also resulted in more frequent bottom contacts (Table 2). Due to the high profiling frequency for mission 6902029 it was difficult to estimate the amount of bottom contacts since it spent such a short time at the park pressure between profiles. On average 4 m from surface was not measured due to CTD sensor design. In this work “near surface” refers to the shallowest available data point in the Argo profiles. Gridded bathymetry data from Seifert et al. (2001)2 was used to estimate the depth at profile locations.
The ice avoidance algorithm preventing the floats from colliding with sea ice got it's first operational test during winter 2016–2017, when float 6902023 drifted under sea ice from February to April. The partial profiles it measured during that time show that the algorithm did detect the cold water mass and cut the float ascent as planned.
2.2. CTD Data
CTD data used here for comparison was measured on the Finnish research vessel RV Aranda in the Bothnian Sea 1998–2017. A Seabird CTD probe was installed on Aranda in 1997 so this 20 year period gives us a consistent data set to compare with. Since Finland is responsible for monitoring of the Bothnian Sea together with Sweden, and the deep area of the basin is mostly located in Finnish waters, most of the deep CTD profiles from the Bothnian Sea are included in the data set and give a comprehensive picture of the availability of CTD profiles in the area. The average number of CTD profiles per month was 3 for 1998–2017 and 2 for 2012–2017, although it greatly varies depending on monitoring and research campaign timing with usually around 4 months in a year having any measurements (Figure 2A). The locations of the profiles in 2012–2017 are shown in Figure 1.
2.3. Variables and Units
Density and absolute salinity for the Argo and CTD profiles were calculated using the Python implementation3 of the Thermodynamic Equation Of Seawater– 2010 (TEOS-10) (IOC et al., 2010). All salinity data presented in this work are in absolute salinity, but the values from literature are presented as they were in the original work, which was usually practical salinity. The difference of absolute salinity and practical salinity is approximately 0.1 with absolute salinity being higher, and this is taken into account in the comparisons. Temperature shown is the in situ temperature, except for T-S diagrams, for which potential temperature calculated according to TEOS-10 was applied.
Since the amount of Argo and CTD profiles greatly varies between seasons and the same month of different years, the monthly mean values shown were calculated by first averaging over each month with data (or using the profile as is for months with only one profile) and then taking the mean over the years for each month. The monthly means were considered valid up to 100 dbar depth, below which there were only scattered datapoints (Figure 2B). Winter means were calculated for 2014–2017 due to lack of winter profiles before 2014, while other seasons also include years 2012 and 2013. Halocline and thermocline depths were calculated as the depth of maximum gradient of salinity and temperature. Seasonal halocline was excluded from the analysis by using measurements only under thermocline when it existed.
3. Results
3.1. Hydrography Based on Argo Data
Six summers and 3 year-round (2014–2017) cycles of temperature and salinity in the water column were measured during 2012–2017. Near surface temperature varied from 0.1 °C (10.3.2017, float 6902023) to 22.7 °C (28.7.2014, float 6902017), and the seasonal variation reached to almost 100 dbar depth during winter 2014–2015 (Figure 3). In 2014, the near surface temperature was overall much higher than in the other years, up to 3 °C higher than in the second warmest summer 2016, and up to 6 °C warmer than the average of the warmest month, August (Figure 4A). Monthly mean temperature (2012–2017 average for ice-free season and 2014–2017 average for winter months) close to surface varied between 1.7 and 16.8 °C with highest temperatures in August and lowest in March before the spring overturning, and the mean temperature at 100 dbar was between 3.6 and 4.5 °C. The depth of 100 dbar was chosen to represent deep water, since it was the deepest HELCOM standard depth with measurements for every month of the year, and it was always below the calculated halocline depth. Thermocline development varied between years, starting in May with strongest stratification (−2.0 °C/m) in August, after which the thermocline started to decay. The mean depth of the thermocline in August varied between 13 dbar (2014) and 22 dbar (2013 and 2016). The mean thermocline depth in August over the whole Argo dataset was 18 dbar (Figure 5).
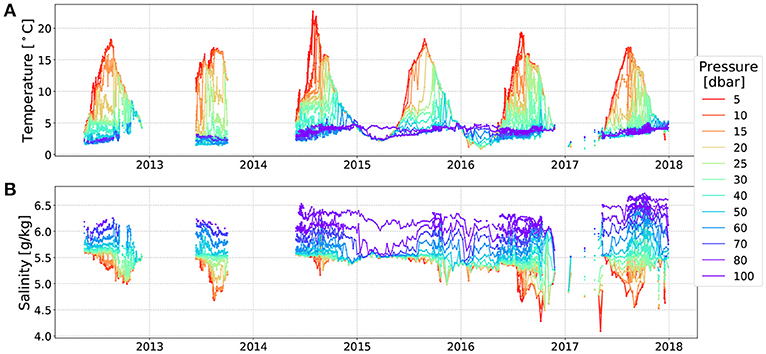
Figure 3. Time series of (A) temperature and (B) salinity at HELCOM standard depths from the Argo floats.
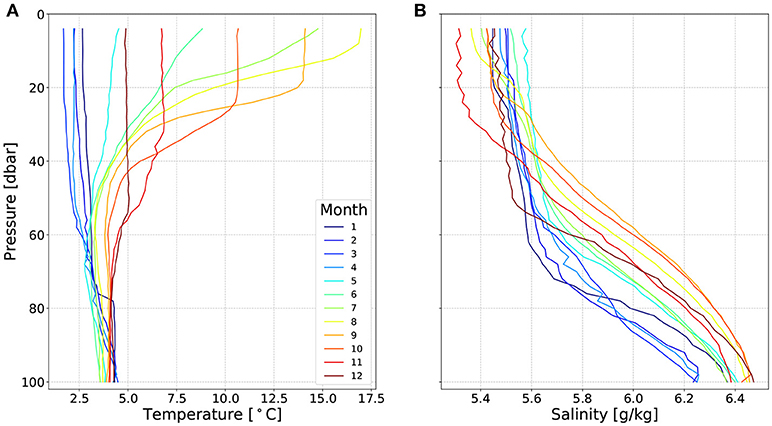
Figure 4. Monthly mean profiles of (A) temperature and (B) salinity from Argo data. Profiles for months 1–4 include only 2015–2017 data due to lack of profiles and the other months include the entire dataset period of 2012–2017. Data above 4 dbar and below 100 dbar were cut off due to sparse measurements.
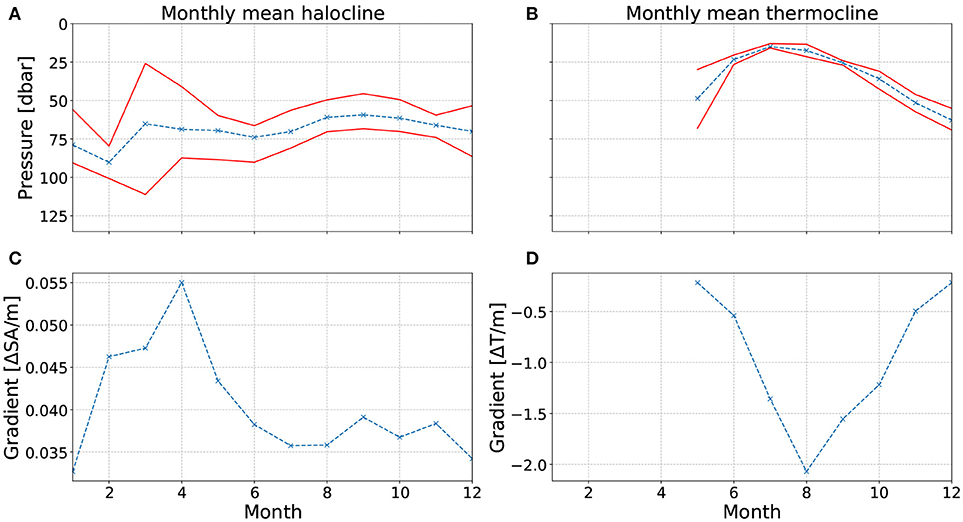
Figure 5. Monthly means of (A) halocline and (B) thermocline depth and the strength of (C) salinity and (D) temperature gradients at the pycnocline depths calculated from Argo data. Means for months 1–4 include only 2015–2017 data due to lack of profiles and the other months include the entire dataset period of 2012–2017. The red lines in (A,B) show the maximum and minimum depths of halocline and thermocline for each month.
Measured salinity range close to surface was from 4.18 g kg−1 (5.5.2017, float 6902023) to 5.74 g kg−1 (2.6.2012, float 6901901) (Figure 3B). For 100 dbar depth the minimum and maximum values were 5.99 g kg−1 (18.11.2016, float 6902023) and 6.83 g kg−1 (7.10.2017, float 6902028), respectively. The variation of the monthly mean of salinity close to surface was 5.31–5.60 g kg−1 with highest values in May before the thermocline has developed and lowest in August when the thermocline restricts the mixing of freshwater runoff with the underlaying watermass. At 100 dbar the range of monthly mean salinity was 6.24–6.47 g kg−1 with highest values in the autumn and lowest in the spring around the time of spring overturning Figure 4B. The halocline was on average deepest, at 90 dbar, in February, and shallowest, at about 58 dbar, in August, when the thermocline was the strongest (Figure 5). The average halocline depth for the entire period 2012–2017 was at 67 dbar. Salinity below the halocline along the Bothnian Sea deep area was 0.33 g kg−1 higher in 2017 than in in 2012–2016, whereas the halocline depth has shallowed since 2015, when the mean below halocline salinity was lowest (Figure 3B).
The mean temperatures measured with the floats fit to those commonly presented in literature for the Bothnian Sea (Lentz, 1971), although the summer mean temperature is a couple of degrees warmer and bottom temperature variation is smaller. The record warm year 2014 showed as high near surface and mixed layer temperature, and this is reflected in the results. The smaller bottom variation compared to previously presented is most likely explained by sparse winter profiles and the lack of profiles from the shallow edge of the Archipelago Sea, where seasonal mixing can reach the bottom easier. Salinity both close to surface and below halocline was also on average in the limits of what is presented in Bock (1971) but the values were mostly at the lower end of the range and variation smaller. This is probably also caused by scarcity of profiles close to the sill to the Åland Sea. The monthly halocline depth here was similar to those presented by Haapala and Alenius (1994), although here the maximum depth of the halocline occurred earlier in the Spring (Figure 5). This is most likely also due to the small amount of winter profiles, which amplifies the impact of the available years.
The mean salinity below the halocline in 2017 was 0.3 g kg−1 higher than between 1998 and 2016, both compared to the CTD data and the Argo profile data. Compared to the long time series of salinity from the Bothnian Sea from 1900's onwards the salinity in 2017 is well inside the observed variability, but still highest in the Bothnian Sea during the 21'st century. The drivers for this salinity change could be many and certainly require further research. One reason might be the major Baltic inflows (MBI) in 2014–2016, which pushed saline water from the Northern Baltic Proper to the Gulf of Finland, where record high bottom salinities were measured in the end of 2016. The MBI's could have had an impact on the Bothnian Sea bottom salinity as well, although the water has to pass multiple sills to reach the basin. However, a change in the halocline depth or it's salinity could influence the Bothnian Sea, since the deep water of the Bothnian Sea originates from the water above the Southern Quark sill depth of 60–70 m in the Northern Baltic Proper (Hietala et al., 2007). Also, change in wind conditions or runoff from land may also have affected the change in stratification in the Bothnian Sea. In a modeling study by Väli et al. (2013) a strong negative correlation between accumulated river runoff and below halocline salinity, as well as westerly winds and below halocline salinity were found. Compared to the climatological period 1981–2010 during 2017 there were 2–3% more westerly winds and less easterly winds, but the accumulated precipitation along the Finnish coast of the Gulf of Bothnia was smaller than the rest of 2010's and the 1981–2010 average. Especially in Oulu and Vaasa, the yearly precipitation was on average 118% of the normal period average, while in 2017 it was 95%4.
3.2. Spatial and Temporal Scale Variability From Argo Profiles
We analyzed areal similarity and the significance of the profiling frequency in the Bothnian Sea by comparing three simultaneous missions from autumn 2017 between 06.08.–27.10.2017 (6902025, 6902028 and 6902029). In the Baltic Sea the size of an area where the water mass can be regarded as homogeneous in a climatological sense was defined as 30'x1° (latitude x longitude) or 55x55 km by Haapala and Alenius (1994). The same definition seems to apply for the short term Argo data as well. Floats 6902028 and 6902029 were within 50 km radius from each other for 75% of the duration of mission 6902029, with the maximum distance between them being 61 km. The hydrographic features their data showed were very similar (Figure 6). Float 6902025 drifted more to the north, with a 50–100 km distance to the other floats, to an area with less saline water above halocline. The north-south gradient in salinity is known to be dominant in the Bothnian Sea (for example Janssen et al., 1999). The shape of the T-S-diagram for float 6902025 is similar to those of 6902028 and 6902029, which indicates that the temperature dynamics in the open sea along the Bothnian Sea deep are not strongly dependent of latitude.
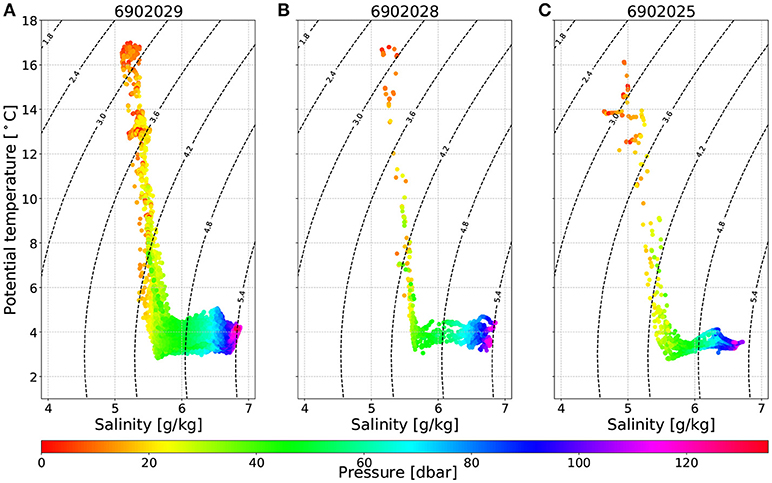
Figure 6. T-S diagrams of for deployments (A) 6902029, (B) 6902028, and (C) 6902025. Colors show pressure of measurement points.
The high profiling frequency, one cycle every day (Table 2), of float 6902029 revealed more fluctuation in water temperature and variation in salinity above the halocline, than what float 6902028 captured with a weekly profiling schedule (Figure 7). The cooling of the mixed layer and the decay of the thermocline were recorded in more detail than previously has been possible in this area.
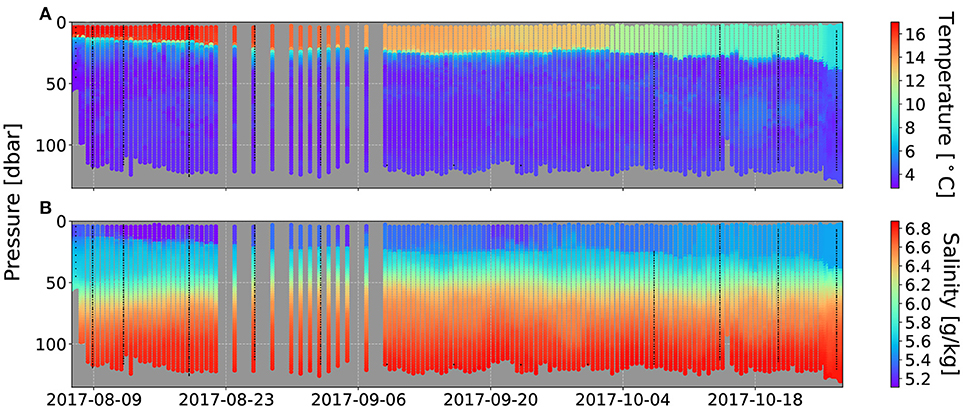
Figure 7. (A) Temperature and (B) absolute salinity profiles from float 6902029. Black dotted lines show timing of profiles of float 6902028 during the same period. The gray shade is the background color and indicates that no data is available.
In the end of October float 6902029 was set to do continuous profiling to capture a predicted storm. The resulting dataset has profiles every 2 h and it is the first of it's kind in the Bothnian Sea. It reveals a 10 dbar deepening of the thermocline from 30 to 40 dbar, and a cooling of the mixed layer by 0.9 °C in 24 h between 25.-26.10.2017. This successful short term event monitoring with continuous profiling is a good example of the different observation routines possible with Argo floats with two-way communication. The storm was noticed in the forecast in time and the new settings for the float were delivered before the storm reached the Bothnian Sea. A profiling resolution of 2–3 h, which is likely the fastest possible with the depth range of 100–150 m, was achieved.
There was a lot of variation in the surface mixed layer salinity, with values ranging from 5.11 to 5.54 g kg−1 during the 2.5 months. In August there was a 5 day period with 1.5 g kg−1 less saline water in the surface mixed layer than the surrounding days, which could be an advected lens of less saline water. An oscillation of the halocline depth between 40 and 60 dbar was also observed during the mission.
After October 15, 2017 two lenses of relatively warm water were measured below the halocline between 60 and 100 dbar (Figure 8). The temperature of these lenses was up to 5.1 °C, while the mean temperature of the layer was 3.8 °C. The event lasted around 10 days, after which the ambient temperature returned close to the mean. The float drifted approximately 9 km during the event. Prevailing wind direction at Märket automatic weather station between 5.–10.10. was between NW–NE and on the 13.10. there were 15 m s−1 winds from the North. These northerly winds may have caused downwelling on the Swedish side of the Bothnian Sea and at the edge of Finngrunden shoals. The float drifted close to the eastern edge of Finngrunden for the entire mission (white line in Figure 1).
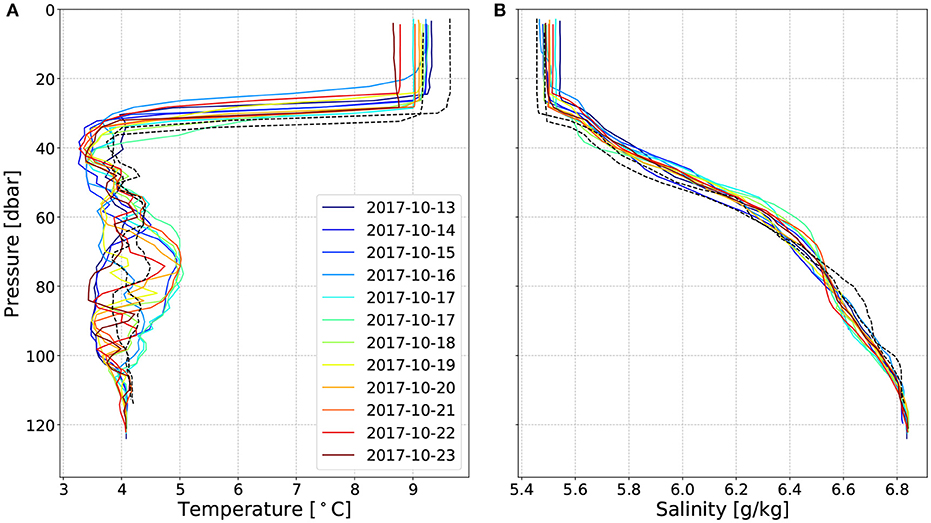
Figure 8. (A) Temperature and (B) salinity profiles measured by float 6902029 between 13.-24.10.2017. The dashed black lines show the profiles from float 6902028 from the same time period.
Most of these phenomena were either completely missed with float 6902028 because of them falling in between profiles (see the black dots in Figure 7), or their duration and magnitude was not fully captured. For example the storm was left in between profiles, as well as the warm water lenses.
4. Discussion
4.1. Argo Floats vs Traditional Ship Monitoring
After the start of regular Argo observations in the Bothnian Sea in 2012, 166 ship borne CTD profiles have been measured. Only three monitoring stations coincide with the Argo float deployment area (red rectangle in Figure 1), and six out of the 166 CTD profiles were measured at these stations. The most commonly visited standard monitoring stations SR5, F26, and US5B fall outside the main Argo drifting areas. Since temporal coverage of Argo floats in the Bothnian Sea is much larger than that of shipborne CTD profiling (Figure 2), Argo floats can capture extreme values, as well as synoptic to storm scale dynamics which are not possible to obtain with seasonal ship monitoring.
Because Argo floats measure more frequently, they capture the warming of the mixed layer and the development of the thermocline in early summer, the temperature maximum and variation during summer, and the cooling and decay of the thermocline in the autumn, whereas the ship monitoring brings out at best only the interannual variability of the water column at certain monitoring stations. Usually the summer COMBINE monitoring cruises take place in June and August, so the highest surface temperature, that occurs at the edge of July-August, and thermocline strength are often missed. During 2012–2017 the Argo floats recorded up to 5°C warmer temperatures in the surface layer than ship monitoring (Figure 9A). On the other hand minimum temperatures captured by ship profiling were lower than those by Argo floats in the entire water column. This can be mainly explained by the temporal coverage of the Argo data, since until now, there is very little data from winter time. The wider range in temperature in the CTD profiles below 80 dbar could be explained with spatial variation, the CTD data covers the Southern Quark better than the Argo data. Due to the larger areal coverage of the ship monitoring data, it includes data from shallower areas, where the use of Argo float is not optimal and also from deeper areas, such as the Ulvö deep, which have not yet been monitored with Argo floats. When only the area in which the Argo floats are deployed and from where there is most data available (the zoomed in area in Figure 1) is considered, then the variability captured with Argo floats is 10°C more than with CTD (Figure 9).
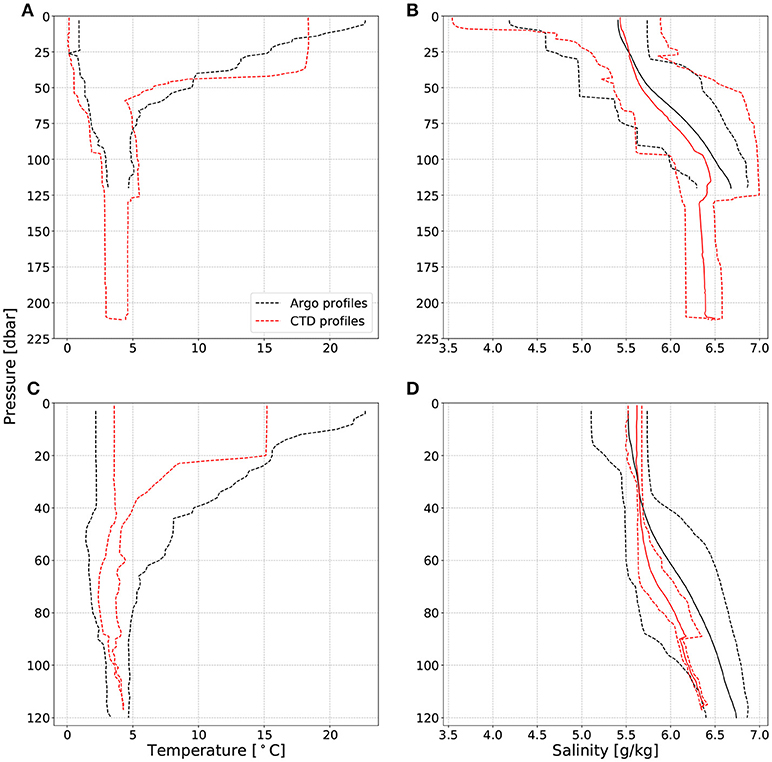
Figure 9. Ranges (dashed lines) and means (solid lines in B,D) of (A,C) temperature and (B,D) salinity data from Argo data (black) and ship CTD (red) from (A,B) the entire Bothnian Sea and from (C,D) the Argo float deployment area shown as a red rectangle in Figure 1 between 2012 and 2017. The locations of the CTD profiles are also shown in Figure 1.
The range of salinity in the entire Bothnian Sea was larger in the CTD data than in the Argo data, especially close to surface, where CTD profiles show up to 1 g kg−1 lower values. Since a horizontal gradient in salinity exists in the Bothnian Sea, it is to be expected that with a ship, not confined in the deep area, the extreme values are better reached. Argo floats recorded less saline cases between 10 – 75 dbar, but their profile mean was higher than that of the shipborne CTD profiles. However, in the float deployment area it can be seen that the temporal variability in salinity is much better captured by the Argo floats.
4.2. Monitoring Bothnian Sea Hydrography as a Whole
We have presented in this paper a new addition to the monitoring of the Bothnian Sea hydrography, the Argo floats. However, there are also other new automated measurement systems, such as gliders, that deserve to be mentioned and discussed. And also existing in-situ moorings, satellite data and FerryBox systems that already are, in addition to the traditional research vessel monitoring, an essential part of the monitoring of the state of the Bothnian Sea.
Due to the seasonal ice cover in the Bothnian Sea, maintenance of in-situ moorings is challenging and therefore they are currently limited only to few operational surface temperature buoys, located close to the shoreline and two wave buoys, which also include a temperature sensor. These surface buoys operate only during the ice-free season and need to be recovered well before the ice season starts. Therefore, they do not cover the full seasonal cycle, but provide a good overview of the late spring, summer, and autumn SST dynamics at their locations.
FerryBox systems offer continuous data from the near-surface level from designated ship routes. Presently there is one FerryBox operating in the Gulf of Bothnia (route Gothenburg-Kemi-Oulu-Lübeck-Gothenburg). The quality of the temperature and salinity measurements has been found good by Karlson et al. (2016) when compared to other field measurements and together with other measurements to complement the traditional monitoring data in the Baltic Sea.
In addition to these in-situ measurements, satellites provide a good coverage of the sea surface. Sea surface temperature has been observed with satellites for a long time and daily SST maps are provided in services such as the Copernicus Marine and Environment Monitoring System (CMEMS)5. Also SSS can be obtained from satellites, but presently the resolution and quality of the products are not good enough in the Baltic Sea, but maybe new progress will improve that (Olmedo et al., 2016).
To obtain more T-S-profile measurements, FMI has recently started to operate a glider to measure the hydrography in the southeastern part of the Bothnian Sea. Presently there have been two measurement campaigns during Autumns 2016 and 2017 (Alenius et al., 2018). Compared to Argo floats that drift freely with currents, the gliders can be navigated along predetermined routes. The vertical coverage of measurements is slightly better than with Argos, since the FMI glider has an altimeter, which allows the glider to dive close, c. 3–5 m, to the bottom. The ice season sets limits to the operation of gliders in the northern Baltic Sea. Liblik et al. (2016) state in their analysis of the potential of underwater gliders in global observing system that under ice operations have still been limited for gliders, but shown to be feasible by e.g., Beszczynska Möller et al. (2011). The gliders have not yet been used for regular monitoring in the Baltic Sea, but have shown their potential to be a good addition to the monitoring. They are, however, significantly more expensive than Argo floats and require more piloting and maintenance.
The present state-of-the-art 3D ocean models, such as the NEMO-Nordic Hordoir et al. (2018), are able to depict the Baltic Sea hydrography fairly well. For example Westerlund and Tuomi (2016) have shown that the vertical temperature and salinity structure and the seasonal development of thermocline in the Bothnian Sea were modeled with relatively good accuracy. However, they also showed, with the help of Argo float data, that there is a need for improvement in the model physics and parameterization in order to better describe the complex stratification conditions of the Baltic Sea. The accuracy of the 3D models can be improved by introducing assimilation of both surface and profile data as has been shown e.g., by Axell and Liu (2016) in the Baltic Sea.
5. Conclusion
Hydrography of the Bothnian Sea during 2012–2017 was estimated based on Argo data as a separate dataset, and then Argo data were compared to CTD profiles from the same time period and to historical CTD measurements.
For the first time we were able to observe the seasonal cycle of the water column in the open sea areas of the Bothnian Sea on a weekly scale. The timing of spring and autumn overturning and the development and decay of the thermocline can now be followed in much more detail than is possible with ship monitoring. With continuous in-situ profiling the phase of the yearly thermal cycle of the water column can be followed and compared to previous years to monitor changes in the cycle, much like Leppäranta et al. (1988) did with the ice season. This knowledge can be used to predict, for example, the upcoming ice winter or timing and magnitude of summer algae blooms.
The Argo floats seem to work well as an independent monitoring system for temperature dynamics in the Bothnian Sea. Since salinity is a more conservative and location dependent variable, the gradual changes in it may be better observed with long term station monitoring, but small and short scale phenomena are captured well. It was shown that the float profiling schedule is flexible and can be adjusted to fit the needs of both standard monitoring and short term event observation. The possibility to adjust the float behavior according to weather forecasts provides a great method to (a) achieve long term deployments with weekly profiles and longer battery life with still the option to get occasional fast profiling sequences and (b) get data from storms where normal research vessel operations would be difficult or not possible. There are very little measured T-S-profiles from storm situations in the Bothnian Sea. Achieving data from upper mixed layer dynamics during a storm will give valuable data e.g., for process studies and model development.
The Argo floats and ship monitoring supplement each other. The long time series from fixed monitoring stations with high vertical resolution from ships gives reference to the magnitude of short term variability measured with Argo floats, and the spatially variable high temporal resolution profiling with Argo floats gives insight of the possible phenomena behind anomalies seen in the temporally sparse monitoring data. The floats also contribute to the long term standard monitoring time series whenever they drift past a monitoring station. The Argo floats are confined in the deep area of the Bothnian Sea, so their data mostly represents the South-North variability in the water column.
For now, we have missed the top 4 m of the water column because of the limitation set by the CTD sensor design. Switching to an alternative sensor would enable even better monitoring of the mixed layer, which would then make prediction of for example algal blooms easier. Gaining weekly to daily sea surface observations would also support validation of sea surface remote sensing.
Despite the challenging environment in the Bothnian Sea, the Argo floats were found to function well and they have become an important part of the monitoring network. Even though the floats often touch the bottom and occasionally get stuck in the bottom, they have so far always managed to free themselves. The ice avoidance algorithm was also determined to be functioning as expected and we have managed to retrieve all our floats so far.
For future work it would be interesting to assess the Bothnian Sea observing system in it's current state as done by Grayek et al. (2015) in the Black Sea to see what improvements could be made regarding the now existing Argo operations. Grayek et al. (2015) concluded that for the Black Sea a good amount of floats is 10 and that adding more floats instead of increasing profiling frequency gives best results at least for data assimilation. Most important questions are how many floats are enough to capture the instantaneous state of the Bothnian Sea sufficiently, and what is the best profiling frequency for long term monitoring and for the needs of forecasting.
Author Contributions
NH wrote the first draft with significant help from LT and was the main responsible for the analysis of the observation data and producing the illustrations. PR, S-MS, LT, and PA contributed to the illustrations. Background research was mainly done by NH, PR, and PA. TP was responsible for the technical support and acquisition of data. All authors contributed to the evaluation of the data, wrote sections for this manuscript and revised and approved the sent version.
Conflict of Interest Statement
The authors declare that the research was conducted in the absence of any commercial or financial relationships that could be construed as a potential conflict of interest.
Acknowledgments
The Argo data used in this work were collected and made freely available by the International Argo Program and the national programs that contribute to it. (http://www.argo.ucsd.edu, http://argo.jcommops.org). The Argo Program is part of the Global Ocean Observing System. This work has been partly supported by the Strategic Research Council at the Academy of Finland, project SmartSea (grant number 292 985).
Footnotes
1. ^http://www.coriolis.eu.org/Data-Products/Data-Delivery/Argo-floats-by-WMO-number
2. ^https://www.io-warnemuende.de/topography-of-the-baltic-sea.html
3. ^https://anaconda.org/pypi/gsw
4. ^http://en.ilmatieteenlaitos.fi/statistics-from-1961-onwards
References
Alenius, P., Tikka, K., Lips, U., Tuomi, L., Purokoski, T., Roiha, P., et al. (2018). “Euro-Argo in work and new potential of gliders in the Baltic Sea BOOS,” in Operational Oceanography serving Sustainable Marine Development. Proceedings of the Eight EuroGOOS International Conference, eds E. Buch, V. Fernández, D. Eparkhina, P. Gorringe, and G Nolan (Bergen), 143–148.
Argo Data Management Team (2017). Argo User's Manual V3.2. http://doi.org/10.13155/29825
Axell, L., and Liu, Y. (2016). Application of 3-d ensemble variational data assimilation to a baltic sea reanalysis 1989–2013. Tellus A Dynam. Meteorol. Oceanogr. 68:24220. doi: 10.3402/tellusa.v68.24220
Beszczynska Möller, A., Woodgate, R., Lee, C., Melling, H., and Karcher, M. (2011). A synthesis of exchanges through the main oceanic gateways to the Arctic Ocean. Oceanography 24, 82–99. doi: 10.5670/oceanog.2011.59
Bock, K. H. (1971). Monatskarten des salzgehalten der ostsee, dargestellt für verschiedene tiefenhorisonte [monthly salinity maps of the Baltic Sea for different depths]. Deutsch. Hydrogr. Z. Ergänzungshäft Reihe B 12, 1–147.
Grayek, S., Stanev, E. V., and Schulz-Stellenfleth, J. (2015). Assessment of the Black Sea observing system. A focus on 2005-2012 Argo campaigns. Ocean Dynam. 65, 1665–1684. doi: 10.1007/s10236-015-0889-8
Håkansson, B., Alenius, P., and Brydsten, L. (1996). Physical Environment in the Gulf of Bothnia. Ambio, 8, 5–12.
Haapala, J., and Alenius, P. (1994). Temperature and salinity statistics for the northern Baltic Sea 1961-1990. Finnish Mar. Res. 262, 51–121.
Hietala, R., Lundberg, P., and Nilsson, J. A. (2007). A note on the deep-water inflow to the Bothnian Sea. J. Mar. Syst. 68, 255–264. doi: 10.1016/j.jmarsys.2006.12.004
Hordoir, R., Axell, L., Höglund, A., Dieterich, C., Fransner, F., Gröger, M., et al. (2018). Nemo-Nordic 1.0: a NEMO based ocean model for Baltic & North Seas, research and operational applications. Geosci. Model Dev Discuss. 2018, 1–29. doi: 10.5194/gmd-2018-2
IOC SCOR, and IAPSO. (2010). The International Thermodynamic Equation of Seawater – 2010: Calculation and Use of Thermodynamic Properties. Number 56 in Intergovernmental Oceanographic Commission, Manuals and Guides. UNESCO.
Janssen, F., Schrum, C., and Backhaus, J. O. (1999). A climatological data set of temperature and salinity for the Baltic Sea and the North Sea. Deutsch. Hydrogr. Z. 51:5.
Karlson, B., Andersson, L., Kaitala, S., Kronsell, J., Mohlin, M., Seppälä, J., et al. (2016). A comparison of FerryBox data vs. monitoring data from research vessels for near surface waters of the Baltic Sea and the Kattegat. J. Mar. Syst. 162, 98–111. doi: 10.1016/j.jmarsys.2016.05.002
Kassis, D., Korres, G., Petihakis, G., and Perivoliotis, L. (2015). Hydrodynamic variability of the Cretan Sea derived from Argo float profiles and multi-parametric buoy measurements during 2010–2012. Ocean Dynam. 65, 1585–1601. doi: 10.1007/s10236-015-0892-0
Lentz, W. (1971). Monatskarte der Temperatur der Ostsee dargestellt für verschiedene Tiefenhorisonte [Monthly maps of the temperature of the Baltic Sea for different depths]. Deutsch. Hydrogr. Z. Ergänzungshäft Reihe B 11, 1–148.
Leppäranta, M., Palosuo, E., Grönvall, H., Kalliosaari, S., and Seinä, A. (1988). Itämeren jäätalven vaiheet (leveyspiiristä 57°N pohjoiseen) [Ice phases in the Baltic Sea, north of latitude 57°N]. Finnish Mar. Res. 254, 1–83.
Liblik, T., Karstensen, J., Testore, P., Alenius, P., Hayes, D., Ruiz, S., et al. (2016). Potential for an underwater glider component as part of the Global Ocean Observing System. Methods Oceanogr. 17, 50–82. doi: 10.1016/j.mio.2016.05.001
Olmedo, E., Martínez, J., Umbert, M., Hoareau, N., Portabella, M., Ballabrera-Poy, J., et al. (2016). Improving time and space resolution of SMOS salinity maps using multifractal fusion. Remote Sens. Environ. 180, 246–263. doi: 10.1016/j.rse.2016.02.038
Pettersson, O., and Ekman, G. (1897). De Hydrografiska Förändringarne Inom Nordsjöns Och Östersjöns Områade Under Tiden 1893-1897, volume 29 of Kongliga Svenska Vetenskaps-Akademiens Handlingar. Kungl. boktryckeriet. P.A. Norstedt & Söner.
Purokoski, T., Aro, E., and Nummelin, A. (2013). First long-term deployment of Argo Float in Baltic Sea. Sea Technol. 54, 41–44.
Roiha, P., Siiriä, S., Alenius, P., Haavisto, N., Westerlund, A., and Purokoski, T. (2018). Estimating currents from Argo Trajectories in the Bothnian Sea, Baltic Sea. Front. Mar. Sci. 5:308. doi: 10.3389/fmars.2018.00308
Seifert, T., Tauber, F., and Kayser, B. (2001). “A high resolution spherical grid topography of the Baltic Sea - 2nd Edn.,” in Baltic Sea Science Congress (Stockholm), Poster #147. Available online at: www.io-warnemuende.de/iowtopo
Teledyne Webb Research, Inc. (2013). APF-11 APEX Profiling Float User Manual, Rev.2 Edn. North Falmouth.
Väli, G., Meier, H. E. M., and Elken, J. (2013). Simulated halocline variability in the Baltic Sea and its impact on hypoxia during 1961–2007. J. Geophys. Res. Oceans 118, 6982–7000. doi: 10.1002/2013JC009192
Keywords: Bothnian Sea, hydrography, Argo floats, Baltic Sea, monitoring, instrument
Citation: Haavisto N, Tuomi L, Roiha P, Siiriä S-M, Alenius P and Purokoski T (2018) Argo Floats as a Novel Part of the Monitoring the Hydrography of the Bothnian Sea. Front. Mar. Sci. 5:324. doi: 10.3389/fmars.2018.00324
Received: 29 March 2018; Accepted: 23 August 2018;
Published: 18 September 2018.
Edited by:
Pengfei Xue, Michigan Technological University, United StatesReviewed by:
Begoña Pérez-Gómez, Puertos del Estado, Madrid, SpainCopyright © 2018 Haavisto, Tuomi, Roiha, Siiriä, Alenius and Purokoski. This is an open-access article distributed under the terms of the Creative Commons Attribution License (CC BY). The use, distribution or reproduction in other forums is permitted, provided the original author(s) and the copyright owner(s) are credited and that the original publication in this journal is cited, in accordance with accepted academic practice. No use, distribution or reproduction is permitted which does not comply with these terms.
*Correspondence: Laura Tuomi, bGF1cmEudHVvbWlAZm1pLmZp
†Present Address: Noora Haavisto, Tvärminne Zoological Station, Faculty of Biological and Environmental Sciences, University of Helsinki, Helsinki, Finland