 Yong Zhang
 Xuelu Gao
 Weidong Guo
 Jianmin Zhao
 Yanfang Li
- 1Department of Marine Chemistry, Institute of Marine Science and Technology, Shandong University, Qingdao, China
- 2Key Laboratory of Coastal Environmental Processes and Environmental Remediation, Yantai Institute of Coastal Zone Research, Chinese Academy of Sciences, Yantai, China
- 3Department of Marine Chemistry, University of Chinese Academy of Sciences, Beijing, China
- 4State Key Laboratory of Marine Environment Science, Xiamen University, Xiamen, China
Based on six cruises from March to September in 2016, we investigated monthly distributions of dissolved organic matter (DOM) and ancillary water chemistry parameters in a mariculture area in the Northern Yellow Sea, where summertime hypoxia and seawater acidification were observed. The most severe oxygen depletion (hypoxia covered approximately one-third of the aquaculture area) and the largest pH decrease (8.07 ± 0.05 in surface layer vs. 7.66 ± 0.07 in bottom layer) were revealed in August. Concentration of dissolved organic carbon (DOC) and the absorption properties of chromophoric DOM (CDOM) were used to characterize DOM. Results showed that DOM mainly originated from marine in situ processes. In March, a DOM pool with the lowest DOC concentration of 211 ± 23 μmol L−1 and nearly uniform optical characteristics were presented in the well-mixed water column. In August, however, DOC increased to 361 ± 29 μmol L−1 in the surface layer and 342 ± 25 μmol L−1 in the bottom layer. Two non-linear relationships between the absorption coefficient at 355 nm [aCDOM(355)] and the absorption spectral slope over 275–295 nm (S275−295) were revealed. According to modeling results, the non-linear relationships were mostly caused by the conservative mixing of a refractory CDOM pool with a freshly produced CDOM pool. Apparent oxygen utilization in August was positively related to DOC, but not to aCDOM(355) and S275−295, presumably due to multiple sources of CDOM in bottom waters. Both aCDOM(355) and S275−295 respond largely to decreasing pH; however, they would be less affected by ocean acidification since this process leads to a limited pH decline.
Introduction
Hypoxia, i.e., dissolved oxygen (DO) concentrations <2 mg L−1 or 30% saturation (e.g., Rabalais et al., 2010), driven by eutrophication has long been a critical issue challenging the sustainable development of coastal oceans due to its harmful effect on ecosystems (e.g., Cai et al., 2011; Sunda and Cai, 2012; Wallace et al., 2014). During the last several decades, the number of coastal sites where hypoxia occurred increased exponentially with an annual growth rate of 5.5 ± 0.23% (R2 = 0.86; Vaquer-Sunyer and Duarte, 2008; Rabalais et al., 2014). Accompanying the oxidation process of organic matter (Wang et al., 2016; Su et al., 2017), CO2 was released simultaneously in the form of carbonic acid. When downward diffusion of oxygen and upward release of CO2 are hampered by the pycnocline, a coupled trend of bottom oxygen depletion and acidification will occur (Zhai et al., 2012), making much worse the negative effects on coastal ecosystems (Mostofa et al., 2016). These changes are likely to be the greatest in the aquaculture area because of increasing nutrient loadings (Li et al., 2016, 2017) and decreasing water exchange rate (Gao et al., 2011; Han et al., 2013).
The mechanism behind the formation of coastal hypoxia has been extensively reported (e.g., Cai et al., 2011; Wang et al., 2016; Su et al., 2017). Although degradation of particulate organic matter has been reported to be the dominant factors contributing to the formation of hypoxia and concurrent acidification (Wang et al., 2016; Su et al., 2017), the consumption of oxygen by labile dissolved organic matter (DOM) is also not negligible. A fraction of DOM is biolabile depending on its sources and transport or transformation history (Yang et al., 2017). Thus, to clarify the origin of DOM (river runoff, discharge of sewage, or in situ production) is an important prerequisite to quantify the contribution of DOM to the consumption of oxygen. This is very helpful when we hope to remediate coastal hypoxia and acidification as different scenarios need quite different management strategies (Kemp et al., 2009).
Optical properties of chromophoric DOM (CDOM), the light-absorbing component of DOM, can be employed as a useful indicator for the origin and biogeochemical processes of DOM (e.g., Nelson et al., 2010; Matsuoka et al., 2012; Xie et al., 2012). In addition to terrestrial input, CDOM also originates as a subproduct from marine in situ processes that consume DO. For example, elevated CDOM levels were found in the hypoxic bottom waters of the northern Gulf of Mexico and related to aerobic remineralization of organic matter (D'Sa and DiMarco, 2009). Optical characteristics of CDOM show positively linear relationship with apparent oxygen utilization (AOU) in global dark ocean (below 200 m), so that CDOM is assumed to be in situ produced when organic matter is biologically oxidized therein (e.g., Yamashita and Tanoue, 2008; Jørgensen et al., 2011; Kowalczuk et al., 2013; Nelson and Siegel, 2013; Lønborg and Álvarez-Salgado, 2014; Catalá et al., 2016). Moreover, solar radiation can decrease absorption of CDOM (photobleaching) and break large molecules into small ones (photodegradation; Lou and Xie, 2006; Zhang et al., 2006). Microbial processes can also breakdown large molecules (biodegradation) and transform newly produced DOM into refractory DOM (Jiao et al., 2010, 2011), which has a turnover time of centuries in the dark ocean (Catalá et al., 2015).
Effect of acidification on absorption properties of CDOM is still unclear up to now. Mesocosm experiments show that ocean acidification induced by elevated CO2 levels would not change DOM structure significantly (Zark et al., 2015, 2017; Aparicio et al., 2016; Poulton et al., 2016). However, absorption coefficient of CDOM in pH manipulation experiment shows large and variable responses to decreasing pH (Zepp and Schlotzhauer, 1981; Spencer et al., 2007; Pace et al., 2012). The decreasing absorption with decreasing pH was related to structural conformation (Pace et al., 2012) or different solubilities of different CDOM fractions (Wozniak and Dera, 2007).
In the northern Yellow Sea, coastal mariculture has been developed rapidly during the past few decades, and it contributes to local eutrophication by blocking water flow (Wang et al., 2012) and by excreting nitrogen (mainly NH4-N) and phosphorous (Zhou et al., 2002). One of the most intensively cultured area is the coastal waters off Yantai city (Shandong province, China), whereby harmful algal blooms induced by eutrophication have been frequently reported in summer (e.g., Hao et al., 2011; Wang et al., 2013). Within this area, scallops are cultivated in suspended lantern nets for 1–2 years and then harvested at the end of October each year (Li et al., 2013). They filter phytoplankton and other suspended particulate matter and pack them into feces and pseudofeces. This process can enhance sedimentation rates by 2.46 times (Zhou et al., 2006). Additionally, sea cucumbers are farmed in bottom rocks (2–3 m high), but not vertically overlapped with the lantern nets area. In this area, a concurrent event of hypoxia and acidification was firstly observed in the summer of 2016, which provided an opportunity to study the DOM dynamics and its relationship with hypoxia and acidification. Based on six cruises from March to September 2016, we (1) interpreted the origin of DOM by comparing hydrological and biogeochemical characteristics of bulk water mass with surrounding conditions, (2) investigated the spatio-temporal variation of dissolved organic carbon (DOC) and optical properties of CDOM, and (3) discussed the relationship between DOM dynamics and AOU and interpreted the effect of acidification on CDOM optical properties.
Materials and Methods
Study Area
The mariculture area is located in a semiclosed bay in the northern Yellow Sea and covers an area of ~15 km2 (Figure 1). Water depth in this area is generally around 15 m, with a maximum of 21 m. The bay is dominated by a regular semidiurnal tide; current flows from east to west at flood tide and reverses at ebb tide with speeds ranging from 6 to 15 cm/s (Jia et al., 2007). Annual rainfall is about 750 mm and concentrates in rainy season (July and August). Three small ephemeral rivers (Xin'an River, Yuniao River, and Qinshui River) discharge into coastal waters; however, freshwater dried up years ago. Since then, river channels have been thoroughly remediated to remove any potential pollution sources and the lower ends are filled with seawater to act as man-made landscapes. The sewage outlet of the Xin'an Sewage Treatment Plant is located 2,750 m away from the shore and ~7 m below water surface (Figure 1); however, no obvious salinity gradient exists in the adjacent seawater (Ma et al., 2012). Eastward locates a small Shuangdao Bay, which has very weak water exchange with the outside bulk water mass (Zhang et al., 2013).
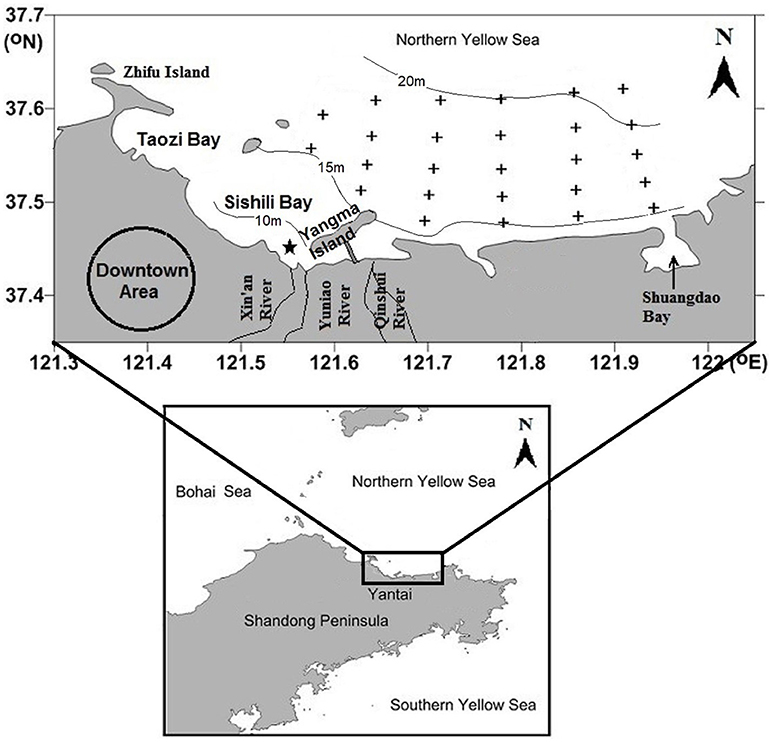
Figure 1. Sampling sites (indicated by black crosses) in the mariculture area off Yantai city, China. The 10, 15, and 20 m depth contours are indicated by solid lines. The sewage outlet of Xin'an Sewage Treatment Plant is indicated by a black star.
Sampling and Analysis
Six cruises were carried out from March to September in 2016, i.e., March 14–19, May 23–27, June 22–27, July 20–25, August 15–20, and September 26–30. Discrete water samples were collected using a 5-L Niskin bottle at surface layer (2 m below water surface) and bottom layer (2 m above seafloor). The CDOM and DOC samples were taken from March to August of 2016 and filtered onboard through precombusted (450°C, 5 h) Whatman GF/F filters. Then, samples for CDOM analyses were transferred into 50 mL HDPE plastic bottles without any addition and stored in the dark at 4°C. Samples for DOC concentrations were transferred into 40 mL amber glass vials (CNW®) with polytetrafluoroethylene-coated septa with 1%0 (v/v) saturated HgCl2 solution and stored frozen at −20°C. Both were analyzed within 1 month of sampling to minimize the potential effects of storage and degradation. Samples for pH were taken from March to September of 2016 and measured immediately after sampling. An Orion pH/DO multiparameters meter (model 520M-01A, Thermo Scientific) was used to determine discrete pH and DO samples; an 8107UWMMD Ross combination electrode was standardized with three NIST buffers at pH 4.01, 7.00, and 10.01 and DO sensor was calibrated against air with 100% relative humidity.
Depth profiles of temperature, salinity, and DO were determined using a calibrated RBR profiler (Canada). Measurements at some stations were discarded because they were either too noisy or contained obvious artifacts. The AOU was calculated based on the oxygen solubility equation (Chen, 1981).
Absorbance spectra (250–600 nm, 1 nm intervals) of filtered water samples were recorded at room temperature using a UV–visible spectrophotometer (TU-1910, Purkinje General Instrument Co. LTD) fitted with 10 cm quartz cuvettes and referenced to Milli-Q water. Absorbance was baseline-corrected by subtracting the absorbance value averaged over an interval of 5 nm around 685 nm (Babin et al., 2003), and then converted to Napierian absorption coefficients [aCDOM(λ) in m−1] according to Equation (1)
where ACDOM(λ) is the absorbance measured across optical path length L (0.1 m) at a wavelength of λ.
The S275−295 (spectral slopes for the intervals of 275–295 nm, Helms et al., 2008) were calculated using linear regression of the log-transformed aCDOM(λ) spectra, which is expressed as follows:
where aCDOM(λ) and aCDOM(λ0) are the absorption coefficients at an observed wavelength λ and at a reference wavelength λ0, respectively (λ0 was set to 275 nm in this study). S275−295 can provide information on DOM molecular weight, with higher values indicating lower molecular weight (Helms et al., 2008).
Specific UV absorbance (SUVA254, L mgC−1 m−1) was calculated as absorbance at 254 nm normalized to the corresponding [DOC] (Weishaar et al., 2003). Higher values of SUVA254 indicate greater percent of aromaticity (aromatic carbon content of CDOM). Aromaticity usually describes a conjugated system made of alternating single and double bonds in a ring, with which structures of organic molecules are very stable i.e., low reactivity.
The DOC samples were acidified to pH ~2 with 2N HCl to remove the dissolved inorganic carbon and analyzed in triplicate using a Shimadzu TOC-VCPH analyzer calibrated with potassium biphthalate. The system was checked at intervals of seven consecutive sample analyses against a certified reference material according to GSB07-1967–2005 made by the Institute for Environmental Reference Materials of Ministry of Environmental Protection, China; the coefficient of variation on five replicate injections was <2%.
All reagents were analytical or guaranteed grade. All the labware (bottles, tubes, etc.) were precleaned by soaking in 10% HCl (v/v) for at least 2 days, followed by thorough rinsing with Milli-Q water.
Results
Hydrological and Biogeochemical Settings
Profiles of temperature and salinity (average of all sampling sites except for the sewage outlet) from March to September show the evolution of summer thermohalocline in the bulk water mass (Figure 2). In March, water mass was almost well-mixed and displayed uniform temperature (3.42 ± 0.71°C) and salinity (32.07 ± 0.13). From March to August, water temperature increased while salinity decreased; both had higher rates in the surface layer than in the bottom layer. In August, thermohalocline was well-developed and separated the water column vertically into two layers with distinct temperature (27.40 ± 0.52 vs. 23.02 ± 1.39°C) and salinity (31.33 ± 0.13 vs. 31.53 ± 0.10). In September, the thermohalocline disappeared and the water column became vertically well-mixed again.
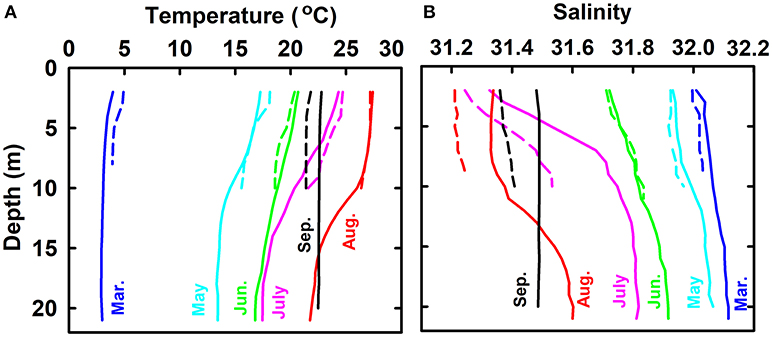
Figure 2. Profiles of temperature (A) and salinity (B) from March to September in 2016. Solid lines stand for the bulk water mass whose temperature and salinity are the average of all sampling sites except for the sewage outlet. Dashed lines stand for the water at sewage outlet.
Surface and bottom distributions of temperature and salinity in each month are shown in Figures 3, 4. Temperature was higher in nearshore area than in offshore area from March to August and then reversed in September. Salinity was lower in nearshore area than in offshore area in March, May and June and then reversed in August and September. The lower temperature and higher salinity in the nearshore area in September were mainly caused by vertical mixing of water column when thermohalocline disappeared, atmosphere cooled down, and with enhanced evaporation in autumn. Seasonally, water temperature increased from March (3.54–4.82°C) to August (26.58–28.36°C for surface layer and 21.56–23.89°C for bottom layer) and then decreased in September (22.18–23.23°C). Salinity decreased from March (31.85–32.29) to August (31.15–31.45 for surface layer and 31.45–31.67 for bottom layer) and then increased in September (31.42–31.54).
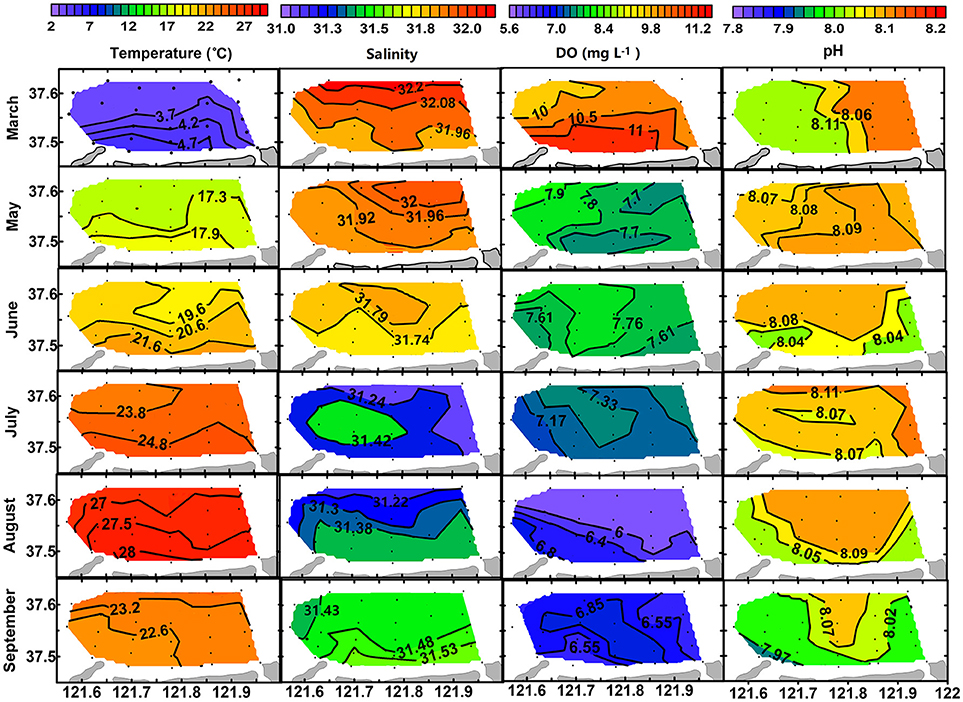
Figure 3. Surface distribution of temperature (°C), salinity, DO (mg L−1), and pH from March to September of 2016.
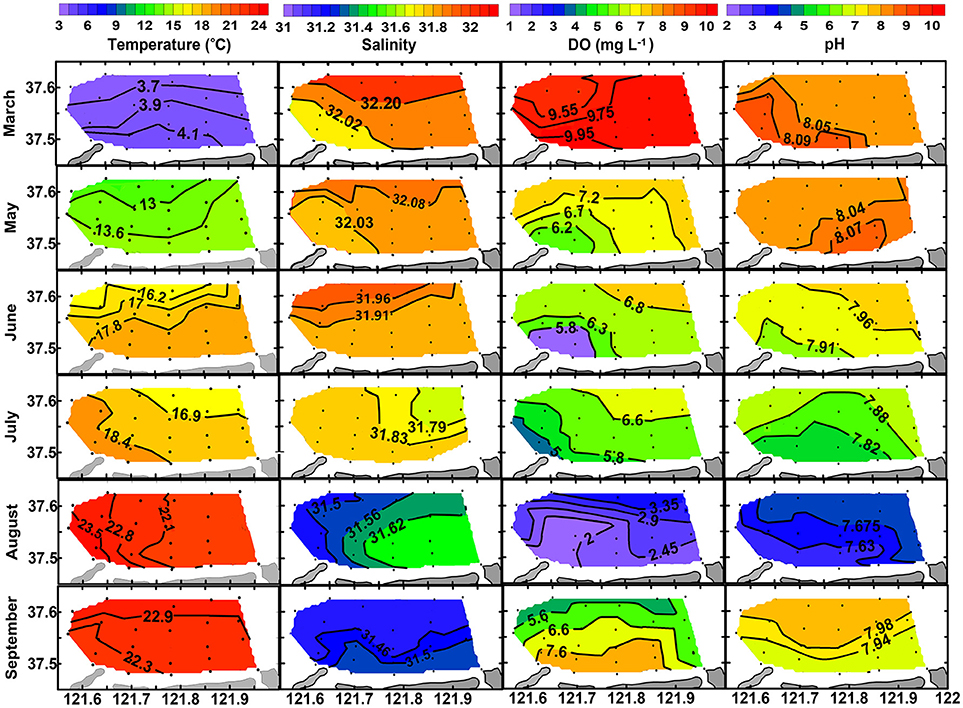
Figure 4. Bottom distribution of temperature (°C), salinity, DO (mg L−1), and pH from March to September of 2016.
Along with the stratification was a coupled trend of bottom hypoxia and acidification. As shown in Figure 4, bottom DO decreases slightly from March (9.46–10.00 mg L−1) to July (4.17–7.30 mg L−1), then dropped abruptly to a minimum level (1.56–3.74 mg L−1) once thermohalocline formed in August. Meanwhile, variations of bottom pH mimic that of DO. In August, a hypoxia zone (<2.0 mg L−1) was formed occupying almost one-third of the aquaculture area, while bottom pH decreased to 7.66 ± 0.07, a 0.41 unit lower than in the surface layer (8.07 ± 0.05) corresponding to a 157% increase of total H+ concentration. In September, bottom DO and pH were raised to levels comparable with those of surface values, indicating mitigation of hypoxia and acidification. However, DO and pH in the surface layer showed less seasonal variation compared with the bottom layer (Figure 3).
Variations of DOC and CDOM
Content of DOC
Concentration of DOC ([DOC]) increased very slightly from March to June (211 ± 23 vs. 217 ± 28 μmol L−1, t-test, p > 0.05), and then it increased much quickly until the end of August with significant difference between surface layer and bottom layer (361 ± 29 μmol L−1 vs. 342 ± 25 μmol L−1, t-test, p < 0.05; Figure 5A). Horizontal distributions of DOC in the bottom layer are displayed in Figure 6. Bottom DOC distributed very similarly in March and May. Strong [DOC] gradients appeared at the offshore area in June and July with high values at the outermost marginal area. These gradients were probably caused by the intrusion of water from the outside bay as indicated by the gradients of temperature and salinity (Figure 4). In August, peak [DOC] appeared in the central area and surpassed that in the outermost marginal area.
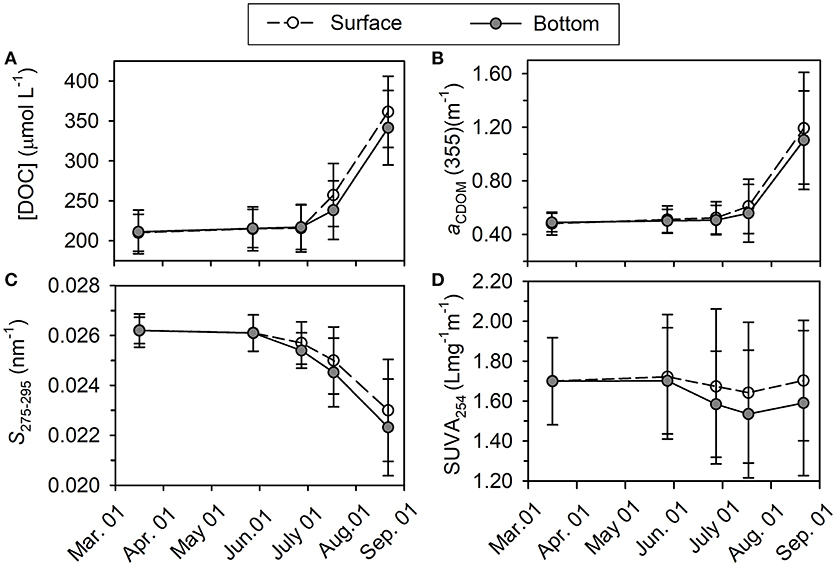
Figure 5. Variations of averaged [DOC] in μmol L−1 (A), aCDOM(355) in m−1 (B), S275−295 in nm−1 (C), and SUVA254 in L mg−1 m−1 (D) from March to August in the year 2016.
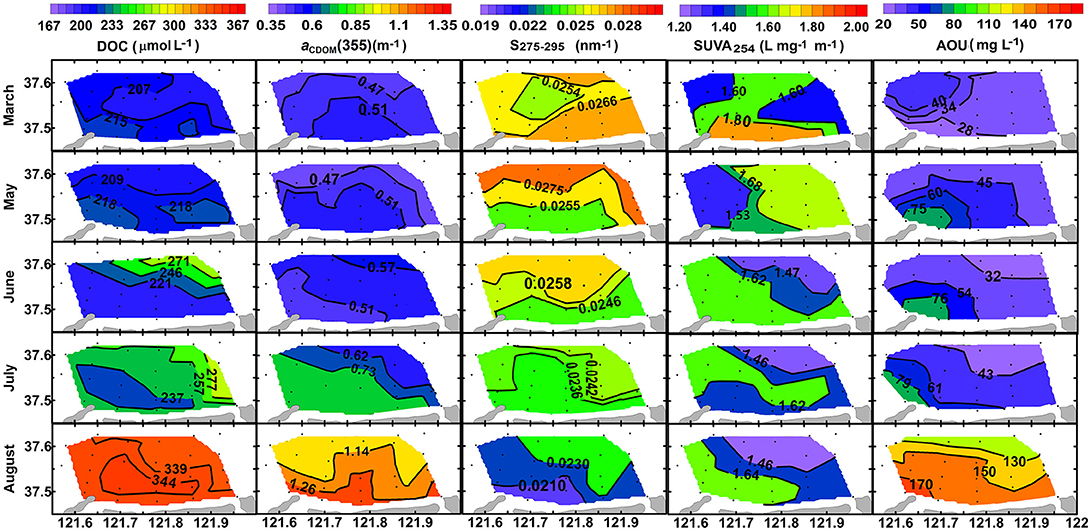
Figure 6. Horizontal distributions of [DOC] in μmol L−1, aCDOM(355) in m−1, S275−295 in nm−1, SUVA254 in L mg−1 m−1, and AOU in mgL−1 in the bottom layer from March to August of 2016.
Absorption of CDOM
Absorption coefficient increased with decreasing wavelength in an approximately exponential way, similar to that previously observed for other seawaters (Zafiriou et al., 2003; Xie et al., 2014; Zhang and Xie, 2015). The absorption coefficient at 355 nm [aCDOM(355)] was chosen as an index of CDOM abundance for the convenience of comparison with previous studies. The value of aCDOM(355) was 0.48 ± 0.04 m−1 in March, increased slightly from May to June, and then increased abruptly to 1.29 ± 0.06 m−1 in the surface layer and 1.19 ± 0.11 m−1 in the bottom layer in August (Figure 5B). Horizontal distribution of aCDOM(355) showed little variation from March to May, i.e., aCDOM(355) kept consistent at 0.51 m−1 in central area and at 0.47 m−1 in the outmost marginal area. The values increased slightly in June and July. Finally, in August, a maximum area appeared in central area (Figure 6).
The S275−295
S275−295 was 0.026 ± 0.002 nm−1 in March in the whole water column; it slowly decreased from March to June and then quickly dropped to 0.023 ± 0.002 nm−1 in the surface layer and to 0.022 ± 0.002 nm−1 in the bottom layer in August (Figure 5C). The S275−295 in August decreased from offshore stations to nearshore stations and the area for minimum S275−295 values coincided with those areas for maximum DOC, aCDOM(355) and AOU (Figure 6).
Yamashita and Tanoue (2009) and Xie et al. (2012) reported noticeable shoulders in the short ultraviolet region of CDOM absorption spectra and these shoulders would cause abnormal S275−295. It should be noted that no shoulders were found in CDOM absorption spectra in this study so that S275−295 still functions properly to indicate the molecular weight of CDOM.
SUVA254
The average of SUVA254 varied in a narrow range from 1.54 ± 0.32 to 1.70 ± 0.26 L mgC−1 m−1 and this variation is negligible compared to the spatial variation (indicated by error bars) in each month (Figure 5D). No obvious horizontal distribution mode was ever found for bottom SUVA254 during our sampling period (Figure 6).
Discussion
Sources of DOM
Discharge of Sewage
Salinity and water temperature near the sewage outlet of Xin'an Sewage Treatment Plant showed little difference with the bulk water mass during our sampling period (Figure 2). Our result is in line with the finding of Ma et al. (2012), who also did not observe obvious salinity gradient in this area. We examined the monthly discharges from the Xin'an Sewage Treatment Plant and found them fair even in the year 2016 (range: 1.09–1.29 m3/s). Little difference was found between the discharges in March and August, i.e., 334 × 104 vs. 345 × 104 m3/month. Since the flow rates were small, the weak dilution effect could explain the ~0.10-unit less of salinity at the sewage outlet than in the corresponding bulk water mass in each month (Figure 2B).
River Runoffs
We do not find any obvious terrestrial signal since both temperature and salinity varied in fair narrow ranges (Figures 3, 4), even when some sampling stations are located reasonably nearshore. Note that in August and September, salinity in nearshore water was even higher than in offshore water (Figures 3, 4), which is a strong evidence to exclude the effect of terrestrial inputs.
Lubei Coastal Current
The Lubei Coastal Current is located along the north shore of Shandong Peninsula, characterized by high temperature (18–19°C) in summer and low temperature (5–6°C) in winter and a relative stable salinity (31.4–31.6; Bao et al., 2009, 2010). Temperature of this current, no matter in winter or in summer, shows quite a large difference with that of the bulk water mass in the mariculture area, indicating that the current has very limited effect on the latter.
In situ Production
Characteristics of DOC and CDOM imply a stronger linkage to marine origin. The [DOC] in March is comparable with that in the Yellow Sea in spring (215 ± 106 μmol L−1), and the results in August are higher than that in the Yellow Sea in autumn (267 ± 117 μmol L−1, Liu et al., 2015). The aCDOM(355) values fall within the range in the Yellow Sea and East China (0.023–2.170 m−1, Guo et al., 2007; Zhou et al., 2018) with the values in August at the higher end of this range. The temporal and spatial variations of aCDOM(355) values, i.e., a faster increase in the surface layer than in the bottom layer from March to August, were in line with those of DOC. However, no significant quantitative relationship between aCDOM(355) and [DOC] was found during our sampling period, contrasting with estuary regions where terrestrial inputs lead to strong correlation between CDOM absorption and [DOC] (e.g., Zhang et al., 2008). This decoupling behavior may indicate a shift in DOM from terrestrial to autochthonous source (Nelson et al., 1998; Nelson and Siegel, 2013; Specchiulli et al., 2018). Furthermore, the relative increase of aCDOM(355) values (150–180%) was much larger than that of DOC (60–70%), indicating that autochthonous sources contribute more to the CDOM pool than to transparent DOM pool (see section Bottom Hypoxia and AOU for detailed information). The values of S275−295 are comparable with those observed in the Chinese coastal seas (Yang et al., 2016; Zhou et al., 2018). The average of SUVA254 closely matches the average value derived from oceanic water (1.70 L mgC−1 m−1) and falls below those derived from fluvial environments (Massicotte et al., 2017).
Since discharges of sewage, river runoffs, and Lubei Coastal Current have a minor effect on the bulk water mass in the maricultural area, semidiurnal tide is supposed to be the major way to exchange water between the inside and outside of this semiclosed bay. However, the back and forth tidal flow with a speed of 6 to 15 cm/s (Jia et al., 2007) could cause limited water exchange as indicated by the weak gradient of temperature, salinity, and DOC (Figures 3, 4, 6). So, it is reasonable to draw a conclusion that DOM in the mariculture area is mainly produced within the semiclosed bay.
The high concentration of DOC and CDOM in August could be attributed to the increased metabolism (e.g., release and excretion) of cultured organisms (Gao et al., 2011). In addition, primary production would also contribute to augment DOC and CDOM (Steinberg et al., 2004), since the augment was in line with summer (August) peak of phytoplankton cell abundance (Wang et al., 2013). Meanwhile, the suspended cultured animals can accelerate the downward flux of organic matter by 2.46 times via filtering phytoplankton and other suspended particulate matter and packing them into feces and pseudofeces (Zhou et al., 2006).
Dynamics of DOM
Plot of S275−295 vs. aCDOM(355) shows clearly that the bulk water mass in March has a quite uniform CDOM pool (Figure 7A). The high S275−295 and low aCDOM(355) imply that this CDOM pool has low molecular weight with low absorption. From May to July, aCDOM(355) increased from 0.511 ± 0.102 to 0.610 ± 0.203 (t-test, p > 0.05) in the surface layer and from 0.501 ± 0.086 to 0.558 ± 0.215 (t-test, p > 0.05) in the bottom layer, while S275−295 decreased from 0.026 ± 0.001 to 0.025 ± 0.001 (t-test, p < 0.05) in surface layer and from 0.0261 ± 0.001 to 0.0245 ± 0.001 (t-test, p < 0.05) in bottom layer (Figures 7B–D), indicating that CDOM was becoming abundant and its molecular weight was increasing.
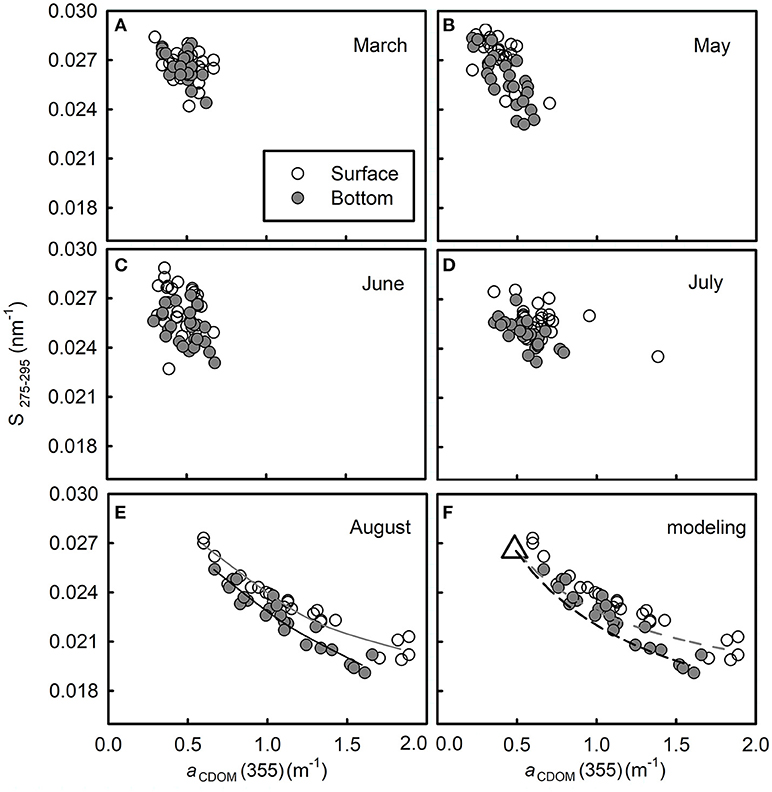
Figure 7. Plots of S275−295 vs. aCDOM(355) from March to August in 2016 (A–E, respectively). In panel (E), the solid line in dark gray is the best fit of the surface data [y = −0.0127log(x) + 0.0239, R2 = 0.943]; solid line in black is the best fit of the bottom data [y = −0.0159log(x) + 0.0228, R2 = 0.910]. Panel (F) is the modeling result of two-end member conservative mixing in August. The dashed line in gray shows the modeled curve in the surface layer and the black one shows that in the bottom layer. The remaining refractory CDOM pool is defined as one end-member (assuming that it equals to the average of data in March, shown as an open triangle); the fresh CDOM pool in the surface (or bottom) layer in August is defined as another end-member [derived from the four water samples with the highest aCDOM(355) in each layer].
According to Bao et al. (2009), the north shore of Shandong Peninsula in winter locates the Lubei Coastal Current, which becomes weak in spring and stands still in summer and autumn; thus, that summer water along the north shore is the remnant of the winter Lubei Coastal water. Since the bulk water mass within the semiclosed bay exchanges water with the coastal current by a tidal flow of 6–15 cm/s (Jia et al., 2007), the water mass within the bay is supposed to have an even longer resident time than that of coastal current. This could explain why the plot of S275−295 vs. aCDOM(355) varied very slightly from March to July during which period the in situ production of CDOM was not strong enough (as in August) to outbalance photobleaching and degradation (biodegradation and/or photodegradation). Considering the summertime peak production of CDOM and the long resident time of the water mass, the CDOM pool from March to July was probably mainly produced in the previous August and subjected to long-lasting photobleaching and degradation. These processes could have resulted in a refractory CDOM pool with low aCDOM(355) and high S275−295. Although the turnover time of this refractory CDOM pool was not quantified, it should be no less than that of bulk water mass according to Catalá et al. (2015).
The high values of aCDOM(355) in August indicate that CDOM at that time was the most abundant during our survey (Figure 7E), while the corresponding low values of S275−295 indicate that the freshly produced CDOM was overall of high molecular weight. Aromatic carbon might contribute to the high molecular weight as indicated by the negative relationship between S275−295 and SUVA254 (Table 1).
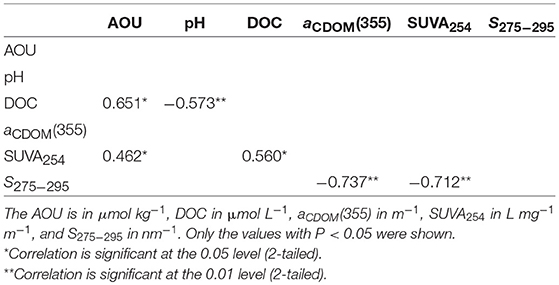
Table 1. Pearson correlations between various parameters in the bottom layer in August of 2016.
The S275−295 and aCDOM(355) display an inverse relationship both in the surface layer and in the bottom layer (Figure 7E, Table 1). This distribution was probably caused by intensive in situ production of CDOM whose strength surpassed those of microbial consumption and photodegradation. A similar inverse relationship between the CDOM absorption coefficient at a certain wavelength and the CDOM spectral slope has been reported in several coastal areas, e.g., Greenland Sea (Stedmon and Markager, 2001), the western Arctic shelf water (Matsuoka et al., 2011), and the Norwegian coastal water (Nima et al., 2016). The inverse relationships in these previous studies indicate a mixing of terrestrial CDOM with marine CDOM. However, the distribution in this study, according to the monthly evolution indicated in Figures 7A–E, is supposed to be the mixing of the remaining refractory CDOM pool with the newly produced one in each layer.
To verify this hypothesis, we calculated the conservative mixing curve following the method provided by Stedmon and Markager (2003). Briefly, the absorption coefficients of the surface (or bottom) layer aCDOM(λ) in August is calculated by summing the two endmember pools, i.e., the refractory CDOM pool and the freshly produced CDOM pool in the surface layer (or in the bottom layer).
or
where
F designates the relative proportions of the two pools in the surface layer (or bottom layer) in August. It is difficult to assign exact values to each end-number because mixing is everywhere in the water column. To simplify the modeling, we assume that (1) the S275−295 and aCDOM(275) of the refractory CDOM pool (designated by and , respectively, equal to the average of S275−295 and aCDOM(275) values measured at all stations in March (indicated by an open triangle in Figure 7F) and (2) the corresponding values of the fresh CDOM pool (designated by and , respectively) can be derived from the four water samples with the highest aCDOM(355) in each layer. Then the modeled aCDOM(355) in each layer is calculated using Equations (3, 5) and the modeled S275−295 in each layer is estimated using Equations (2, 4). The modeled conservative mixing curves are shown in Figure 7F, i.e., S275−295 and vary non-linearly with aCDOM(355) during two end-members' conservative mixing, instead of producing a straight line.
The different distributions between the surface layer and bottom layer may have resulted from difference in molecular structures that are related closely to different pathways of CDOM production—the CDOM in the surface layer mainly comes from release/excretion of cultured animals and primary production, while CDOM in the bottom layer was mainly derived from microbial-mediated degradation of organic matter (Steinberg et al., 2004; Gao et al., 2011; Nelson and Siegel, 2013).
Although the measured points fit the modeled curves quite well, some points distribute above the modeled curves. The bias probably results from the inaccurate assignment of endmembers or other unaccounted, but minor CDOM sources in each layer. Although photodegradation could contribute to bias in the surface layer, this process seems to play a minor role because the mixing curve in the surface layer matches closely to the one in the bottom layer, where UV radiation cannot reach.
Bottom Hypoxia and AOU
Hypoxia is usually caused by the imbalance of DO replenishment and consumption. In this study, the bottom DO replenishment was hampered vertically by summertime thermohalocline and horizontally by weak water movement. Mariculture activities amplified hypoxia by enhancing downward flux of organic matter, whose microbial decomposition consumes DO in water column (e.g., Wang et al., 2016; Su et al., 2017; Yang et al., 2017). The DO depletion is usually expressed as AOU.
Bottom-water AOU was low in March (22.1–46.1 μmol kg−1), varied slightly between (30.3–90.2 μmol kg−1) from May to July, and then increased abruptly to 110–185 μmol kg−1 in August (Figure 6). The temporal variation of AOU is in line with the evolution of thermohalocline, with high AOU appearing in August when water column was well-stratified (Figure 2). From May to August, the area with maximum AOU always appeared at nearshore area, probably due to insufficient water exchange, neither horizontal nor vertical.
The AOUs are usually significantly correlated to DOM parameters because oxygen is consumed during the process of microbial CDOM production (e.g., Yamashita and Tanoue, 2008; Jørgensen et al., 2011; Yang et al., 2016). As shown in Table 1, AOU is positively related to DOC in the bottom layer in the August of 2016, indicating that a reasonable part of DO was utilized by oxidization of DOC. However, this oxidization process might consume less aromatic carbon because AOU was only loosely related to SUVA254 (r = 0.462). The aCDOM(355) and S275−295 did not show significant relationship with AOU (Table 1). The reason may be due to the multiple pathways of CDOM production in the bottom water. In addition to oxygen-consuming process (e.g., Yamashita and Tanoue, 2004; D'Sa and DiMarco, 2009; Kinsey et al., 2018), some other sources without direct AOU have been discovered. For example, picocyanobacterial can release CDOM that share similar optical properties with that in oceanic environments (Zhao et al., 2017). Hypoxic and anoxic sediments can release CDOM into overlying water (e.g., Skoog et al., 1996, 2011; Kowalczuk et al., 2015). Anaerobic CDOM production in the bottom sediment such as sulfate reduction (Luek et al., 2017) can contribute to the CDOM pool in the bottom water by up to 8–15% (Kim and Kim, 2016).
Effect of Acidification on CDOM Optical Properties
Manipulated pH experiments were carried out in the laboratory to clarify the effect of marine acidification on CDOM optical parameters. Water sample (original pH 7.82) was taken from this mariculture area and its pH was adjusted to 7.65, 7.47, 7.17, and 6.70 using 0.1N HCl. Results showed that aCDOM(355) varied little between 7.82 and 7.65 and then decreased quickly with decreasing pH from 7.65 to 6.70 (Figure 8). Moreover, S275−295 kept almost constant between 7.82 and 7.65, increased quickly when pH decreased from 7.65 to 7.17, and then decreased slightly with further decreasing pH (Figure 8). Our result is in line with the finding of Pace et al. (2012), who used lake water to perform pH manipulation experiments and reported initial aCDOM(440) varied little from 8.2 to 7.9 and decreased quickly with decreasing pH from 7.9 to 5.4.
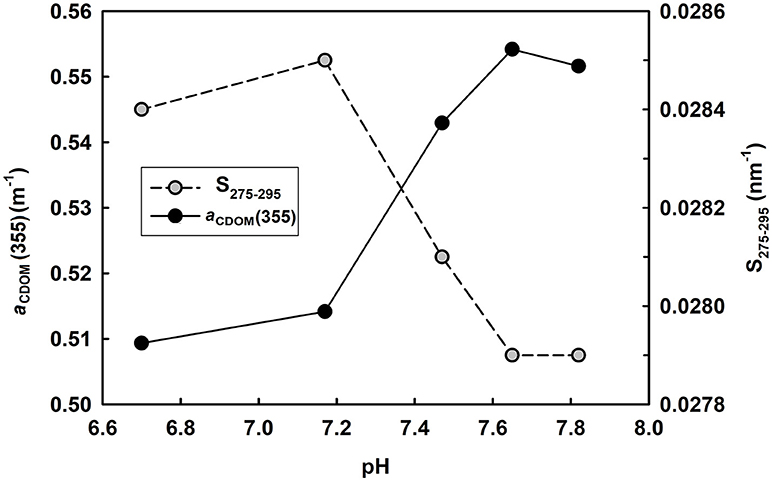
Figure 8. Variation of aCDOM(355) and S275−295 with changing pH. Water sample was taken from the mariculture area with an initial pH 7.82.
The pH-dependence of CDOM optical parameters can be explained by molecular structural change due to acidification. Myneni et al. (1999) reported that humic substances tend to have a linear structure at high pH and coil up when pH decreases. Pace et al. (2012) proposed that organic matter tend to tightly pack and absorb relatively little light under acidic conditions. Chen et al. (2015) observed decreased hydrodynamic diameters of DOM in acidified waters. Under an extreme situation, by acidifying water sample to pH 2, Tfaily et al. (2011) identified formation of oxygen-rich compounds and related it to acid catalyzed reaction such as the addition of a water molecule to a carbon-carbon double bond.
Since surface ocean pH would be reduced by 0.4 units under a business-as-usual climate scenario by the end of the century compared with the preindustrial level (IPCC, 2014), the mesocosm experiments conducted previously (Zark et al., 2015, 2017; Aparicio et al., 2016; Poulton et al., 2016) mimicked a pH decrease of 0.2–0.4 units by manipulating CO2 level. Under such a small initial pH decrease, the optical properties would show limited response to pH so that it is hard to observe precisely. Compared with acidification caused by elevated CO2 level, mariculture activities accelerated the process of acidification. However, even if no acidification occurred in the bottom water in August 2016, i.e., pH kept constant at 8.07 instead of 7.66, little difference in CDOM optical properties would be expected with the current scenario, according to our own experiment and the results of Pace et al. (2012). So, it seems that naturally occurring ocean acidification has little effect on optical properties of CDOM unless pH decreases below a certain threshold (Figure 8). This conclusion also explains why there is no significant relationship between pH and optical properties of CDOM [aCDOM(355) and S275−295] in the bottom water in August 2016 (Table 1).
Suggestions for Coastal Mariculture Management
To our best knowledge, this is the first time coupling behavior of hypoxia and acidification in the Northern Yellow Sea has been of reported. A previously coupling behavior of DO-depletion (but not hypoxia) and acidification driven by local eutrophication was reported in an aquaculture area of Northern Yellow Sea near Liaoning Province, where Zhai et al. (2014) observed a pH decline by 0.2–0.3 units and a DO saturation decrease to 51–68% in the bottom water. Compared with the result of Zhai et al. (2014), the larger decline of DO saturation (down to <30% in one-third of the investigated area) and pH drop (by up to 0.41 unit) in our present study indicate a much worse situation for cultured scallops and sea cucumbers because they are both acidification-sensitive (Yuan et al., 2015, 2016; Andersen et al., 2017) and rely on a life-sustaining DO saturation of more than 30% (Rabalais et al., 2010). Thus, the integrated effect of hypoxia and acidification could be responsible for the massive death of bottom-cultured sea cucumbers in the recent several summer seasons. This finding may ring the alarm bell for the aquaculture industry in the Northern Yellow Sea. Precautions should be taken to prevent similar breeding failures as those that took place in the coastal Bohai Sea, whereby summertime DO-depletion (~45% saturation) and acidification (a pH decline of 0.29 units) occurred (Zhai et al., 2012).
Conclusions
The present study provides insight into the origin and dynamics of DOM in a semiclosed bay of Northern Yellow Sea, where mariculture activities amplified summertime hypoxia and accelerated acidification. The DOM within this area was mainly in situ produced and the production was most intensive in August. It showed seasonal variation as indicated by variation of DOC and absorption properties of CDOM. Plot of S275−295 vs. aCDOM(355) is a helpful tool for identifying the mixing of two CDOM pools when salinity varies little. Absorption properties of CDOM respond largely to decreasing pH; however, they tend to be less affected by marine acidification because this process causes limited pH decline even under the influence of mariculture activities.
Author Contributions
YZ, XG, WG, and JZ contributed to the design of the study. YL provided the temperature, salinity, and oxygen data. YZ performed the experiment and prepared the manuscript. All authors contributed to the revision.
Conflict of Interest Statement
The authors declare that the research was conducted in the absence of any commercial or financial relationships that could be construed as a potential conflict of interest.
Acknowledgments
This work was supported by the Strategic Priority Research Program of the Chinese Academy of Sciences (Grant No. XDA11020702), the National Natural Science Foundation of China (Grant No. 91751207) and the Fundamental Research Funds of Shandong University. We thank Kai Liu and Bo Yang for their assistance during sample collections. Comments by the reviewers greatly improved the final version of this paper.
References
Andersen, S., Grefsrud, E. S., and Harboe, T. (2017). Sensitivity towards elevated pCO2 in great scallop (Pecten maximus Lamarck) embryos and fed larvae. Biogeosciences 14, 529–539. doi: 10.5194/bg-14-529-2017
Aparicio, F. L., Nieto-Cid, M., Borrull, E., Calvo, E., Pelejero, C., Sala, M. M., et al. (2016). Eutrophication and acidification: Do they induce changes in the dissolved organic matter dynamics in the coastal Mediterranean Sea? Sci. Tot. Environ. 563–564, 179–189. doi: 10.1016/j.scitotenv.2016.04.108
Babin, M., Stramski, D., Ferrari, G. M., Claustre, H., Bricaud, A., Obolensky, G., et al. (2003). Variations in the light absorption coefficients of phytoplankton, nonalgal particles, and dissolved organic matter in coastal waters around Europe. J. Geophys. Res. 108:3211. doi: 10.1029/2001JC000882
Bao, X. W., Li, N., and Wu, D. X. (2010). Observed characteristics of the North Yellow Sea water masses in summer. Chin. J. Oceanol. Limnol. 28, 160–170. doi: 10.1007/s00343-010-9034-1
Bao, X. W., Li, N., Yao, Z. G., and Wu, D. X. (2009). Seasonal variation characteristics of temperature and salinity of the North Yellow Sea. Periodical Ocean Univ. China 39, 553–562 (in Chinese).
Cai, W. J., Hu, X. P., Huang, W. J., Murrell, M. C., Lehrter, J. C., Lohrenz, S. E., et al. (2011). Acidification of subsurface coastal waters enhanced by eutrophication. Nat. Geosci. 4, 766–770. doi: 10.1038/ngeo1297
Catalá, T. S., Álvarez-Salgado, X. A., Otero, J., Luculano, F., Companys, B., Horstkotte, B., et al. (2016). Drivers of fluorescent dissolved organic matter in the global epipelagic ocean. Limnol. Oceanogr. 61, 1101–1119. doi: 10.1002/lno.10281
Catalá, T. S., Reche, I., Fuentes-Lema, A., Romera-Castillo, C., Nieto-Cid, M., Ortega-Retuerta, E., et al. (2015). Turnover time of fluorescent dissolved organic matter in the dark global ocean. Nat. Commun. 6:5986. doi: 10.1038/ncomms6986
Chen, C. S., Anaya, J. M., Chen, E. Y., Farr, E., and Chin, W. C. (2015). Ocean warming–acidification synergism undermines dissolved organic matter assembly. PLoS ONE 10:e0118300. doi: 10.1371/journal.pone.0118300
Chen, C. T. (1981). “Oxygen Solubility in Seawater,” in Oxygen and Ozone, Solubility Data Series, Vol. 7, ed R. Battino (New York, NY: Pergamon Press), 41–55.
D'Sa, E. J., and DiMarco, S. F. (2009). Seasonal variability and controls on chromophoric dissolved organic matter in a large river-dominated coastal margin. Limnol. Oceanogr. 54, 2233–2242. doi: 10.4319/lo.2009.54.6.2233
Gao, H. D., Deng, Z. W., Sun, W. L., and Song, D. D. (2011). Study on the relationship between ecological environmental pollution and red tide occurring in Sishili Bay, Yantai. Environ. Monitor. China 27, 50–101 (in Chinese).
Guo, W. D., Stedmon, C. A., Han, Y. C., Wu, F., Yu, X. X., and Hu, M. H. (2007). The conservative and non-conservative behavior of chromophoric dissolved organic matter in Chinese estuarine waters. Mar. Chem. 107, 357–366. doi: 10.1016/j.marchem.2007.03.006
Han, Q. X., Wang, Y. Q., Zhang, Y., Keesing, J., and Liu, D. Y. (2013). Effects of intensive scallop mariculture on microbenthic assemblages in Sishili Bay, the northern Yellow Sea of China. Hydrobiologia 718, 1–15. doi: 10.1007/s10750-013-1590-x
Hao, Y., Tang, D., Yu, L., and Xing, Q. (2011). Nutrients and chlorophyll-a anomalies in redtide periods of 2003–2008 in the Sishili Bay, China, Chin. J. Oceanol. Limnol. 29, 664–673. doi: 10.1007/s00343-011-0179-3
Helms, J. R., Stubbins, A., Ritchie, J. D., Minor, E. C., Kieber, D. J., and Mopper, K. (2008). Absorption spectral slopes and slope ratios as indicators of molecular weight, source, and photobleaching of chromophoric dissolved organic matter. Limnol. Oceanogr. 53, 955–969. doi: 10.4319/lo.2008.53.3.0955
IPCC (2014). “Climate Change 2014: impacts, adaptation, and vulnerability. Part A: global and sectoral aspects,” in Contribution of Working Group II to the Fifth Assessment Report of the Intergovernmental Panel on Climate Change (Cambridge; New York, NY: Cambridge University Press).
Jia, Y. R., Liu, X. J., Sun, Y. L., and Sun, C. Q. (2007). Argumentation of sewage discharge mixing zone's area of Xin'an River Sewage Plant of Yantai. Mar. Sci. Bull. 26, 33–37 (in Chinese).
Jiao, N. Z., Herndl, G. J., Hansell, D. A., and Azam, F. (2011). The microbial carbon pump and the oceanic recalcitrant dissolved organic matter pool. Nat. Rev. Microbiol. 9:555. doi: 10.1038/nrmicro2386-c5
Jiao, N. Z., Herndl, G. J., Hansell, D. A., Benner, R., Kattner, G., Wilhelm, S. W., et al. (2010). Microbial production of recalcitrant dissolved organic matter: long-term carbon storage in the global ocean. Nat. Rev. Microbiol. 8, 593–599. doi: 10.1038/nrmicro2386
Jørgensen, L., Stedmon, C. A., Kragh, T., Markager, S., Middelboe, M., and Søndergaard, M. (2011). Global trends in the fluorescence characteristics and distribution of marine dissolved organic matter. Mar. Chem. 126, 139–148. doi: 10.1016/j.marchem.2011.05.002
Kemp, W. M., Testa, J. M., Conley, D. J., Gilbert, D., and Hagy, J. D. (2009). Temporal responses of coastal hypoxia to nutrient loading and physical controls. Biogeosciences 6, 2985–3008. doi: 10.5194/bg-6-2985-2009
Kim, J., and Kim, G. (2016). Significant anaerobic production of fluorescent dissolved organic matter in the deep East Sea (Sea of Japan). Geophys. Res. Lett. 43, 7609–7616. doi: 10.1002/2016GL069335
Kinsey, J. D., Corradino, G., Ziervogel, K., Schnetzer, A., and Osburn, C. L. (2018). Formation of chromophoric dissolved organic matter by bacterial degradation of phytoplankton-derived aggregates. Front. Mar. Sci. 4:430. doi: 10.3389/fmars.2017.00430
Kowalczuk, P., Sagan, S., Zabłocka, M., and Borzycka, K. (2015). Mixing anomaly in deoxygenated Baltic Sea deeps indicates benthic flux and microbial transformation of chromophoric and fluorescent dissolved organic matter. Estuar. Coast. Shelf Sci. 163, 206–217. doi: 10.1016/j.ecss.2015.06.027
Kowalczuk, P., Tilstone, G. H., Zablocka, M., Röttgers, R., and Thomas, R. (2013). Composition of dissolved organic matter along an Atlantic meridional transect from fluorescence spectroscopy and parallel factor analysis. Mar. Chem. 157, 170–184. doi: 10.1016/j.marchem.2013.10.004
Li, B., Wang, Q., and Li, B. (2013). Assessing the benthic ecological status in the stressed coastal waters of Yantai, Yellow Sea, using AMBI and M-AMBI. Mar. Pollut. Bull. 75, 53–61. doi: 10.1016/j.marpolbul.2013.08.007
Li, H., Li, X., Li, Q., Liu, Y., Song, J., and Zhang, Y. (2017). Environmental response to long-term mariculture activities in the Weihai coastal area, China. Sci. Tot. Environ. 601–602, 22–31. doi: 10.1016/j.scitotenv.2017.05.167
Li, R. H., Liu, S. M., Zhang, J., Jiang, Z. J., and Fang, J. G. (2016). Sources and export of nutrients associated with integrated multi-trophic aquaculture in Sanggou Bay, China. Aquacult. Environ. Interact. 8, 285–309. doi: 10.3354/aei00177
Liu, J., Yu, Z. G., Zang, J. Y., Sun, T., Zhao, C. Y., and Ran, X. B. (2015). Distribution and budget of organic carbon in the Bohai and Yellow Seas. Adv. Earth Sci. 30, 564–578 (in Chinese).
Lønborg, C., and Álvarez-Salgado, X. A. (2014). Tracing dissolved organic matter cycling in the eastern boundary of the temperate North Atlantic suing absorption and fluorescence spectroscopy. Deep Sea Res. I 85, 35–46. doi: 10.1016/j.dsr.2013.11.002
Lou, T., and Xie, H. (2006). Photochemical alteration of the molecular weight of dissolved organic matter. Chemosphere 65, 2333–2342. doi: 10.1016/j.chemosphere.2006.05.001
Luek, J. L., Thompson, K. E., Larsen, R. K., Heyes, A., and Gonsior, M. (2017). Sulfate reduction in sediments produces high levels of chromophoric dissolved organic matter. Sci. Rep. 7:8829. doi: 10.1038/s41598-017-09223-z
Ma, Z. H., Wang, L., Wang, D. L., and Yu, L. (2012). Evaluation and analysis on the quality of the sea water adjacent to the Yantai Xin'an River estuary. Ludong Univ. J. 28, 364–369 (in Chinese).
Massicotte, P., Asmala, E., Stedmon, C., and Markager, S. (2017). Global distribution of dissolved organic matter along the aquatic continuum: across rivers, lakes and oceans. Sci. Tot. Environ. 609, 180–191. doi: 10.1016/j.scitotenv.2017.07.076
Matsuoka, A., Bricaud, A., Benner, R., Para, J., Sempéré, R., Prieur, L., et al. (2012). Tracing the transport of colored dissolved organic matter in water masses of the Southern Beaufort Sea: relationship with hydrographic characteristics. Biogeosciences 9, 925–940. doi: 10.5194/bg-9-925-2012
Matsuoka, A., Hill, V., Huot, Y., Babin, M., and Bricaud, A. (2011). Seasonal variability in the light absorption properties of western Arctic waters: parameterization of the individual components of absorption for ocean color applications. J. Geophys. Res. 116:C02007. doi: 10.1029/2009JC005594
Mostofa, K. M. G., Liu, C. Q., Zhai, W. D., Minella, M., Vione, D., Gao, K., et al. (2016). Reviews and syntheses: ocean acidification and its potential impacts on marine ecosystems. Biogeosciences 13, 1767–1786. doi: 10.5194/bg-13-1767-2016
Myneni, S. C., Brown, J. T., Martinez, G. A., and Meyer-Ilse, W. (1999). Imaging of humic substance macromolecular structures in water and soils. Science 286, 1335–1337. doi: 10.1126/science.286.5443.1335
Nelson, N. B., and Siegel, D. A. (2013). The global distribution and dynamics of chromophoric dissolved organic matter. Annu. Rev. Mar. Sci. 5, 447–476. doi: 10.1146/annurev-marine-120710-100751
Nelson, N. B., Siegel, D. A., Carlson, C. A., and Swan, C. M. (2010). Tracing global biogeochemical cycles and meridional overturning circulation using chromophoric dissolved organic matter, Geophys. Res. Lett. 37:L03610. doi: 10.1029/2009GL042325
Nelson, N. B., Siegel, D. A., and Michaels, A. F. (1998). Seasonal dynamics of colored dissolved material in the Sargasso Sea. Deep Sea Res. I 45, 931–957. doi: 10.1016/S0967-0637(97)00106-4
Nima, C., Frette, Ø., Hamre, B., Erga, S. R., Chen, Y. C., Zhao, L., et al. (2016). Absorption properties of high-latitude Norwegian coastal water: the impact of CDOM and particulate matter. Estuar. Coast. Shelf Sci. 178, 158–167. doi: 10.1016/j.ecss.2016.05.012
Pace, M. L., Reche, I., Cole, J. J., Fernández-Barbero, A., Mazuecos, I. P., and Prairie, Y. T. (2012). pH change induces shifts in the size and light absorption of dissolved organic matter. Biogeochemistry 8, 109–118. doi: 10.1007/s10533-011-9576-0
Poulton, A. J., Daniels, C. J., Esposito, M., Humphreys, M. P., Mitchell, M., Ribas-Ribas, M., et al. (2016). Production of dissolved organic carbon by Arctic plankton communities: responses to elevated carbon dioxide and the availability of light and nutrients. Deep Sea Res. II 127, 60–74. doi: 10.1016/j.dsr2.2016.01.00
Rabalais, N. N., Cai, W. J., Carstensen, J., Conley, D. J., Fry, B., Hu, X., et al. (2014). Eutrophication-driven deoxygenation in the coastal ocean. Oceanography 27, 172–183. doi: 10.5670/oceanog.2014.21
Rabalais, N. N., Díaz, R. J., Levin, L. A., Turner, R. E., Gilbert, D., and Zhang, J. (2010). Dynamics and distribution of natural and human-caused coastal hypoxia. Biogeosciences 7, 585–619. doi: 10.5194/bg-7-585-2010
Skoog, A., Hall, P. O. J., Hulth, S., Paxéus, N., Van Der Loeff, M. R., and Westerlund, S. (1996). Early diagenetic production of fluorescent organic matter in the coastal environment. Geochim. Cosmochim. Acta 60, 3619–3629. doi: 10.1016/0016-7037(96)83275-3
Skoog, A., Wedborg, M., and Fogelqvist, E. (2011). Decoupling of total organic carbon concentrations and humic substance fluorescence in an extended temperate estuary. Mar. Chem. 124, 68–77. doi: 10.1016/j.marchem.2010.12.003
Specchiulli, A., Cilenti, L., D′Adamo, R., Fabbrocini, A., Guo, W., Huang, L., et al. (2018). Dissolved organic matter dynamics in Mediterranean lagoons: the relationship between DOC and CDOM. Mar. Chem. 202, 37–48. doi: 10.1016/j.marchem.2018.02.003
Spencer, R. G., Bolton, L., and Baker, A. (2007). Freeze/thaw and pH effects on freshwater dissolved organic matter fluorescence and absorbance properties from a number of UK locations. Water Res. 41, 2941–2950. doi: 10.1016/j.watres.2007.04.012
Stedmon, C. A., and Markager, S. (2001). The optics of chromophoric dissolved organic matter (CDOM) in the Greenland Sea: an algorithm for differentiation between marine and terrestrially derived organic matter. Limnol. Oceanogr. 46, 2087–2093. doi: 10.4319/lo.2001.46.8.2087
Stedmon, C. A., and Markager, S. (2003). Behaviour of the optical properties of coloured dissolved organic matter under conservative mixing. Estuar. Coast. Shelf Sci. 57, 973–979. doi: 10.1016/S0272-7714(03)00003-9
Steinberg, D. K., Nelson, N. B., Carlson, C. A., and Prusak, A. C. (2004). Production of chromophoric dissolved organic matter(CDOM) in the open ocean by zooplankton and the colonial cyanobacterium Trichodesmium spp. Mar. Ecol. Prog. Ser. 267, 45–56. doi: 10.3354/meps267045
Su, J. Z., Dai, M. H., He, B. Y., Wang, L. F., Gan, J. P., Guo, X. H., et al. (2017). Tracing the origin of the oxygen-consuming organic matter in the hypoxic zone in a large eutrophic estuary: the lower reach of the Pearl River Estuary, China. Biogeosciences 14, 4085–4099. doi: 10.5194/bg-14-4085-2017
Sunda, W. G., and Cai, W. J. (2012). Eutrophication induced CO2-acidification of subsurface coastal waters: interactive effects of temperature, salinity, and atmospheric PCO2. Environ. Sci. Technol. 46, 10651–10659. doi: 10.1021/es300626f
Tfaily, M. M., Podgorski, D. C., Corbett, J. E., Chanton, J. P., and Cooper, W. T. (2011). Influence of acidification on the optical properties and molecular composition of dissolved organic matter. Anal. Chim. Acta 706, 261–267. doi: 10.1016/j.aca.2011.08.037
Vaquer-Sunyer, R., and Duarte, C. M. (2008). Thresholds of hypoxia for marine biodiversity. Proc. Natl. Acad. Sci. U.S.A. 105, 15452–15457. doi: 10.1073/pnas.0803833105
Wallace, R. B., Baumann, H., Grear, J. S., Aller, R. C., and Gobler, C. J. (2014). Coastal ocean acidification: the other eutrophication problem. Estuar. Coast. Shelf Sci. 148, 1–13. doi: 10.1016/j.ecss.2014.05.027
Wang, H., Dai, M., Liu, J., Kao, S.-J., Zhang, C., Cai, W.-J., et al. (2016). Eutrophication-driven hypoxia in the east China Sea off the Changjiang estuary. Environ. Sci. Technol. 50, 2255–2263. doi: 10.1021/acs.est.5b06211
Wang, Y., Dong, Z. J., Liu, D. Y., and Di, B.P. (2013). Variation of spatial and temporal distributions of phytoplankton community in coastal waters of Yantai. Mar. Sci. Bull. 32, 408–420 (in Chinese).
Wang, Y. J., Liu, D. Y., Dong, Z. J., Di, B. P., and Shen, X. H. (2012). Temporal and spatial distributions of nutrients under the influence of human activities in Sishili Bay, northern Yellow Sea of China, Mar. Pollut. Bull. 64, 2708–2719. doi: 10.1016/j.marpolbul.2012.09.024
Weishaar, J. L., Aiken, G. R., Bergamaschi, B. A., Fram, M. S., Fujii, R., and Mopper, K. (2003). Evaluation of specific ultraviolet absorbance as an indicator of the chemical composition and reactivity of dissolved organic carbon. Environ. Sci. Technol. 37, 4702–4708. doi: 10.1021/es030360x
Xie, H., Aubry, C., Bélanger, S., and Song, G. (2012). The dynamics of absorption coefficients of CDOM and particles in the St. Lawrence estuarine system: biogeochemical and physical implications. Mar. Chem. 128–129, 44–56. doi: 10.1016/j.marchem.2011.10.001
Xie, H., Aubry, C., Zhang, Y., and Song, G. S. (2014). Chromophoric dissolved organic matter (CDOM) in first-year ice in the western Candian Arctic. Mar. Chem. 165, 25–35. doi: 10.1016/j.marchem.2014.07.007
Yamashita, Y., and Tanoue, E. (2004). In situ production of chromophoric dissolved organic matter in coastal environments Geophys. Res. Lett. 31, L14302. doi: 10.1029/2004GL019734
Yamashita, Y., and Tanoue, E. (2008). Production of bio-refractory fluorescent dissolved organic matter in the ocean interior. Nat. Geosci. 1, 578–582. doi: 10.1038/ngeo279
Yamashita, Y., and Tanoue, E. (2009). Basin scale distribution of chromophoric dissolved organic matter in the Pacific Ocean. Limnol. Oceanogr. 54, 598–609. doi: 10.4319/lo.2009.54.2.0598
Yang, L., Zhuang, W. E., Chen, C. A., Wang, B. J., and Kuo, F. W. (2017). Unveiling the transformation and bioavailability of dissolved organic matter in contrasting hydrothermal vents using fluorescence EEM-PARAFAC. Water Res. 111, 195–203. doi: 10.1016/j.watres.2017.01.001
Yang, L. Y., Chen, C. T. A., Lui, H. K., Zhuang, W. E., and Wang, B. J. (2016). Effects of microbial transformation on dissolved organic matter in the east Taiwan Strait and implications for carbon and nutrient cycling. Estuar. Coast. Shelf, Sci. 180, 59–68. doi: 10.1016/j.ecss.2016.06.021
Yuan, X., Shao, S. , Yang, X., Yang, D., Xu, Q., Zong, H., et al. (2016). Bioenergetic trade-offs in the sea cucumber Apostichopus japonicus (Echinodermata: Holothuroidea) in response to CO2-driven ocean acidification. Environ. Sci. Pollut. Res. 23, 8453–8461. doi: 10.1007/s11356-016-6071-0
Yuan, X., Shao, S., Dupont, S., Meng, L., Liu, Y., and Wang, L. (2015). Impact of CO2-driven acidification on the development of the sea cucumber Apostichopus japonicus (Selenka) (Echinodermata: Holothuroidea). Mar. Pollut. Bull. 95, 195–199. doi: 10.1016/j.marpolbul.2015.04.021
Zafiriou, O. C., Andrews, S. S., and Wang, W. (2003). Concordant estimates of oceanic carbon monoxide source and sink processes in the Pacific yield a balanced global “blue water” CO budget. Global Biogeochem. Cycles 17:1015. doi: 10.1029/2001GB001638
Zark, M., Broda, N. K., Hornick, T., Grossart, H.-P., Riebesell, U., and Dittmar, T. (2017). Ocean acidification experiments in large-scale mesocosms reveal similar dynamics of dissolved organic matter production and biotransformation. Front. Mar. Sci. 4:271. doi: 10.3389/fmars.2017.00271
Zark, M., Riebesell, U., and Dittmar, T. (2015). Effects of ocean acidification on marine dissolved organic matter are not detectable over the succession of phytoplankton blooms. Sci. Adv. 1:e1500531. doi: 10.1126/sciadv.1500531
Zepp, R. G., and Schlotzhauer, P. F. (1981). Comparison of photochemical behavior of various humic substances in water: III. Spectroscopic properties of humic substances. Chemosphere 10, 479–486. doi: 10.1016/0045-6535(81)90148-X
Zhai, W. D., Zhao, H. D., Zheng, N., and Xu, Y. (2012). Coastal acidification in summer bottom oxygen-depleted waters in northwestern-northern Bohai Sea from June to August in 2011. Chin. Sci. Bull. 57, 1062–1068. doi: 10.1007/s11434-011-4949-2
Zhai, W. D., Zheng, N., Huo, C., Xu, Y., Zhao, H. D., Li, Y. W., et al. (2014). Subsurface pH and carbonate saturation state of aragonite on the Chinese side of the North Yellow Sea: seasonal variations and controls, Biogeosciences 11, 1103–1123. doi: 10.5194/bg-11-1103-2014
Zhang, X. C., Liu, Y., Hu, H. Z., Song, X. H., and Song, J. D. (2013). Evaluation of seawater eutrophication in coastal Weihai, Shuangdao Bay based on grey clustering method. Fish. Sci. 32, 605–608 (in Chinese).
Zhang, Y., and Xie, H. (2015). Photomineralization and photomethanification of dissolved organic matter in Saguenay River surface water, Biogeosciences 12, 6823–6836. doi: 10.5194/bg-12-6823-2015
Zhang, Y., Xie, H., and Chen, G. (2006). Factors affecting the efficiency of carbon monoxide photoproduction in the St. Lawrence estuarine system (Canada). Environ. Sci. Technol. 40, 7771–7777. doi: 10.1021/es0615268
Zhang, Y., Xie, H. X., Fichot, C. G., and Chen, G. H. (2008). Dark production of carbon monoxide (CO) from dissolved organic matter in the St. Lawrence estuarine system: implication for the global coastal and blue water CO budgets. J. Geophys. Res. Oceans 113:C12020. doi: 10.1029/2008JC004811
Zhao, Z., Gonsior, M., Luek, J., Timko, S., Ianiri, H., Hertkorn, N., et al. (2017). Picocyanobacteria and deep-ocean fluorescent dissolved organic matter share similar optical properties. Nat. Commun. 8:15284. doi: 10.1038/ncomms15284
Zhou, F. X., Gao, X. L., Song, J. M., Chen, C. T. A., Yuan, H. M., and Xing, Q. G. (2018). Absorption properties of chromophoric dissolved organic matter (CDOM) in the East China Sea and the waters off eastern Taiwan. Cont. Shelf Res. 159, 12–23. doi: 10.1016/j.csr.2018.03.005
Zhou, Y., Yang, H. S., He, Y. C., and Zhang, F. S. (2002). Nitrogen and phosphorus excretion and its ecological effect by several bivalves and fouling animals. Oceanol. Limnos. Sin. 33, 424–431 (in Chinese).
Keywords: mariculture, hypoxia, acidification, dissolved organic carbon, chromophoric dissolved organic matter, Northern Yellow Sea
Citation: Zhang Y, Gao X, Guo W, Zhao J and Li Y (2018) Origin and Dynamics of Dissolved Organic Matter in a Mariculture Area Suffering From Summertime Hypoxia and Acidification. Front. Mar. Sci. 5:325. doi: 10.3389/fmars.2018.00325
Received: 06 April 2018; Accepted: 23 August 2018;
Published: 27 September 2018.
Edited by:
Christian Lønborg, Australian Institute of Marine Science (AIMS), AustraliaReviewed by:
Mar Nieto-Cid, Instituto Español de Oceanografía, Centro Oceanográfico de A Coruña, SpainPiotr Kowalczuk, Institute of Oceanology (PAN), Poland
Copyright © 2018 Zhang, Gao, Guo, Zhao and Li. This is an open-access article distributed under the terms of the Creative Commons Attribution License (CC BY). The use, distribution or reproduction in other forums is permitted, provided the original author(s) and the copyright owner(s) are credited and that the original publication in this journal is cited, in accordance with accepted academic practice. No use, distribution or reproduction is permitted which does not comply with these terms.
*Correspondence: Xuelu Gao, eGxnYW9AeWljLmFjLmNu