 Matthew M. Mills1*
 Zachary W. Brown2Samuel R. Laney3
 Eva Ortega-Retuerta4
 Kate E. Lowry3
 Gert L. van Dijken1
 Kevin R. Arrigo1
- 1Department of Earth System Science, Stanford University, Stanford, CA, United States
- 2Inian Islands Institute, Gustavus, AK, United States
- 3Biology Department, Woods Hole Oceanographic Institution, Woods Hole, MA, United States
- 4Laboratoire d’Océanographie Microbienne, Observatoire Océanologique, CNRS, Sorbonne Université, UMR 7621, Banyuls-sur-Mer, France
Major changes to Arctic marine ecosystems have resulted in longer growing seasons with increased phytoplankton production over larger areas. In the Chukchi Sea, the high productivity fuels intense benthic denitrification creating a nitrogen (N) deficit that is transported through the Arctic to the Atlantic Ocean, where it likely fuels N fixation. Given the rapid pace of environmental change and the potentially globally significant N deficit, we conducted experiments aimed at understanding phytoplankton and microbial N utilization in the Chukchi Sea. Ship-board experiments tested the effect of nitrate (NO3-) additions on both phytoplankton and heterotrophic prokaryote abundance, community composition, photophysiology, carbon fixation and NO3- uptake rates. Results support the critical role of NO3- in limiting summer phytoplankton communities to small cells with low production rates. NO3- additions increased particulate concentrations, abundance of large diatoms, and rates of carbon fixation and NO3- uptake by cells >1 μm. Increases in the quantum yield and electron turnover rate of photosystem II in +NO3- treatments suggested that phytoplankton in the ambient dissolved N environment were N starved and unable to build new, or repair damaged, reaction centers. While some increases in heterotrophic prokaryote abundance and production were noted with NO3- amendments, phytoplankton competition or grazers likely dampened these responses. Trends toward a warmer more stratified Chukchi Sea will likely enhance summer oligotrophic conditions and further N starve Chukchi Sea phytoplankton communities.
Introduction
The Arctic Ocean is currently undergoing massive alterations due to global climate change. Of paramount importance is the loss of sea ice. Annual mean open water area has increased ∼2.8% yr-1 between 1998 and 2012 (Arrigo and van Dijken, 2015), and evidence suggests the trend will continue, with the monthly average ice extent for September decreasing 13.3% per decade relative to the 1981–2010 average (Perovich et al., 2016). The primary contributors to the increasing loss of ice are higher global temperatures due to greenhouse gas emissions (Zhang and Walsh, 2006; Stroeve et al., 2007), increased warm water input to the Arctic from both the Pacific and Atlantic Oceans (Spielhagen et al., 2011; Woodgate et al., 2012), and an increase of ice flowing out of the Arctic to the Atlantic (Smedsrud et al., 2017). The loss of sea ice in the Arctic decreases albedo and results in further warming of the ocean, which perpetuates additional loss of ice. Evidence suggests that the loss of sea ice in the Arctic is consistent with this ice albedo feedback cycle (Perovich et al., 2007, 2011), with the number of open water days increasing over time (Arrigo and van Dijken, 2015).
Coincident with increased open water area across the Arctic Ocean has been a 30% increase in net primary production (NPP) between 1998 and 2012 as greater areas of the ocean are exposed to light, thereby facilitating more rapid phytoplankton growth (Arrigo and van Dijken, 2015). However, in addition to light, phytoplankton growth requires nutrients, and thus the increase in Arctic NPP may also be coincident with an increase in nutrient availability. Flow through the Bering Strait has increased between 2001 and 2011 (Woodgate et al., 2012) and is a possible source of new nutrients to the Arctic Ocean. Likewise, increased input from rivers may supply useable nutrients for phytoplankton (Ardyna et al., 2014). Finally, shelf break upwelling can entrain nutrients into surface waters (Spall et al., 2014), and an increase in this process would likely increase NPP as well. Which, if any, of these processes are contributing to the higher NPP in the Arctic Ocean is unclear.
The flow of water within the Chukchi Sea is to first order dictated by the bathymetry of the shelf (Weingartner et al., 2005; Spall, 2007; Pickart et al., 2016). Three main pathways emanate northward from the Bering Strait (Figure 1): a western branch that goes through Herald Canyon, a middle branch that progresses through the Central Channel (the gap between Herald Shoal and Hanna Shoal), and an eastern branch that flows adjacent to the coast of Alaska. In summertime, the eastern branch is known as the Alaskan Coastal Current (ACC), which transports relatively warm and fresh Alaskan Coastal Water (ACW) originating from coastal runoff in the Gulf of Alaska and Bering Sea. The middle branch is believed to transport a combination of Bering Shelf Water (BSW) and Anadyr Water (AW), which ultimately mix to form Bering and Chukchi Summer Water (BCSW). The western branch is thought to advect primarily AW. The ACC is typically warm (>2°C, Figure 1), depleted in nutrients, and has a significant contribution from river input (Weingartner et al., 2013; Gong and Pickart, 2016). In contrast, the summertime BCSW is generally colder (-1 to 2°C) than the ACW and has higher nutrient concentrations. Some fraction of the AW in the western flow branch is diverted eastward toward the BCSW (e.g., Pickart et al., 2010) and the combined flow is then steered around Hanna Shoal toward Barrow Canyon. Recently, the Central Channel flow path was shown to bifurcate and pass around both sides of Hanna Shoal prior to flowing into Barrow Canyon (Pickart et al., 2016). As such, all three Pacific water masses primarily exit the Chukchi Sea through Barrow Canyon (Gong and Pickart, 2015).
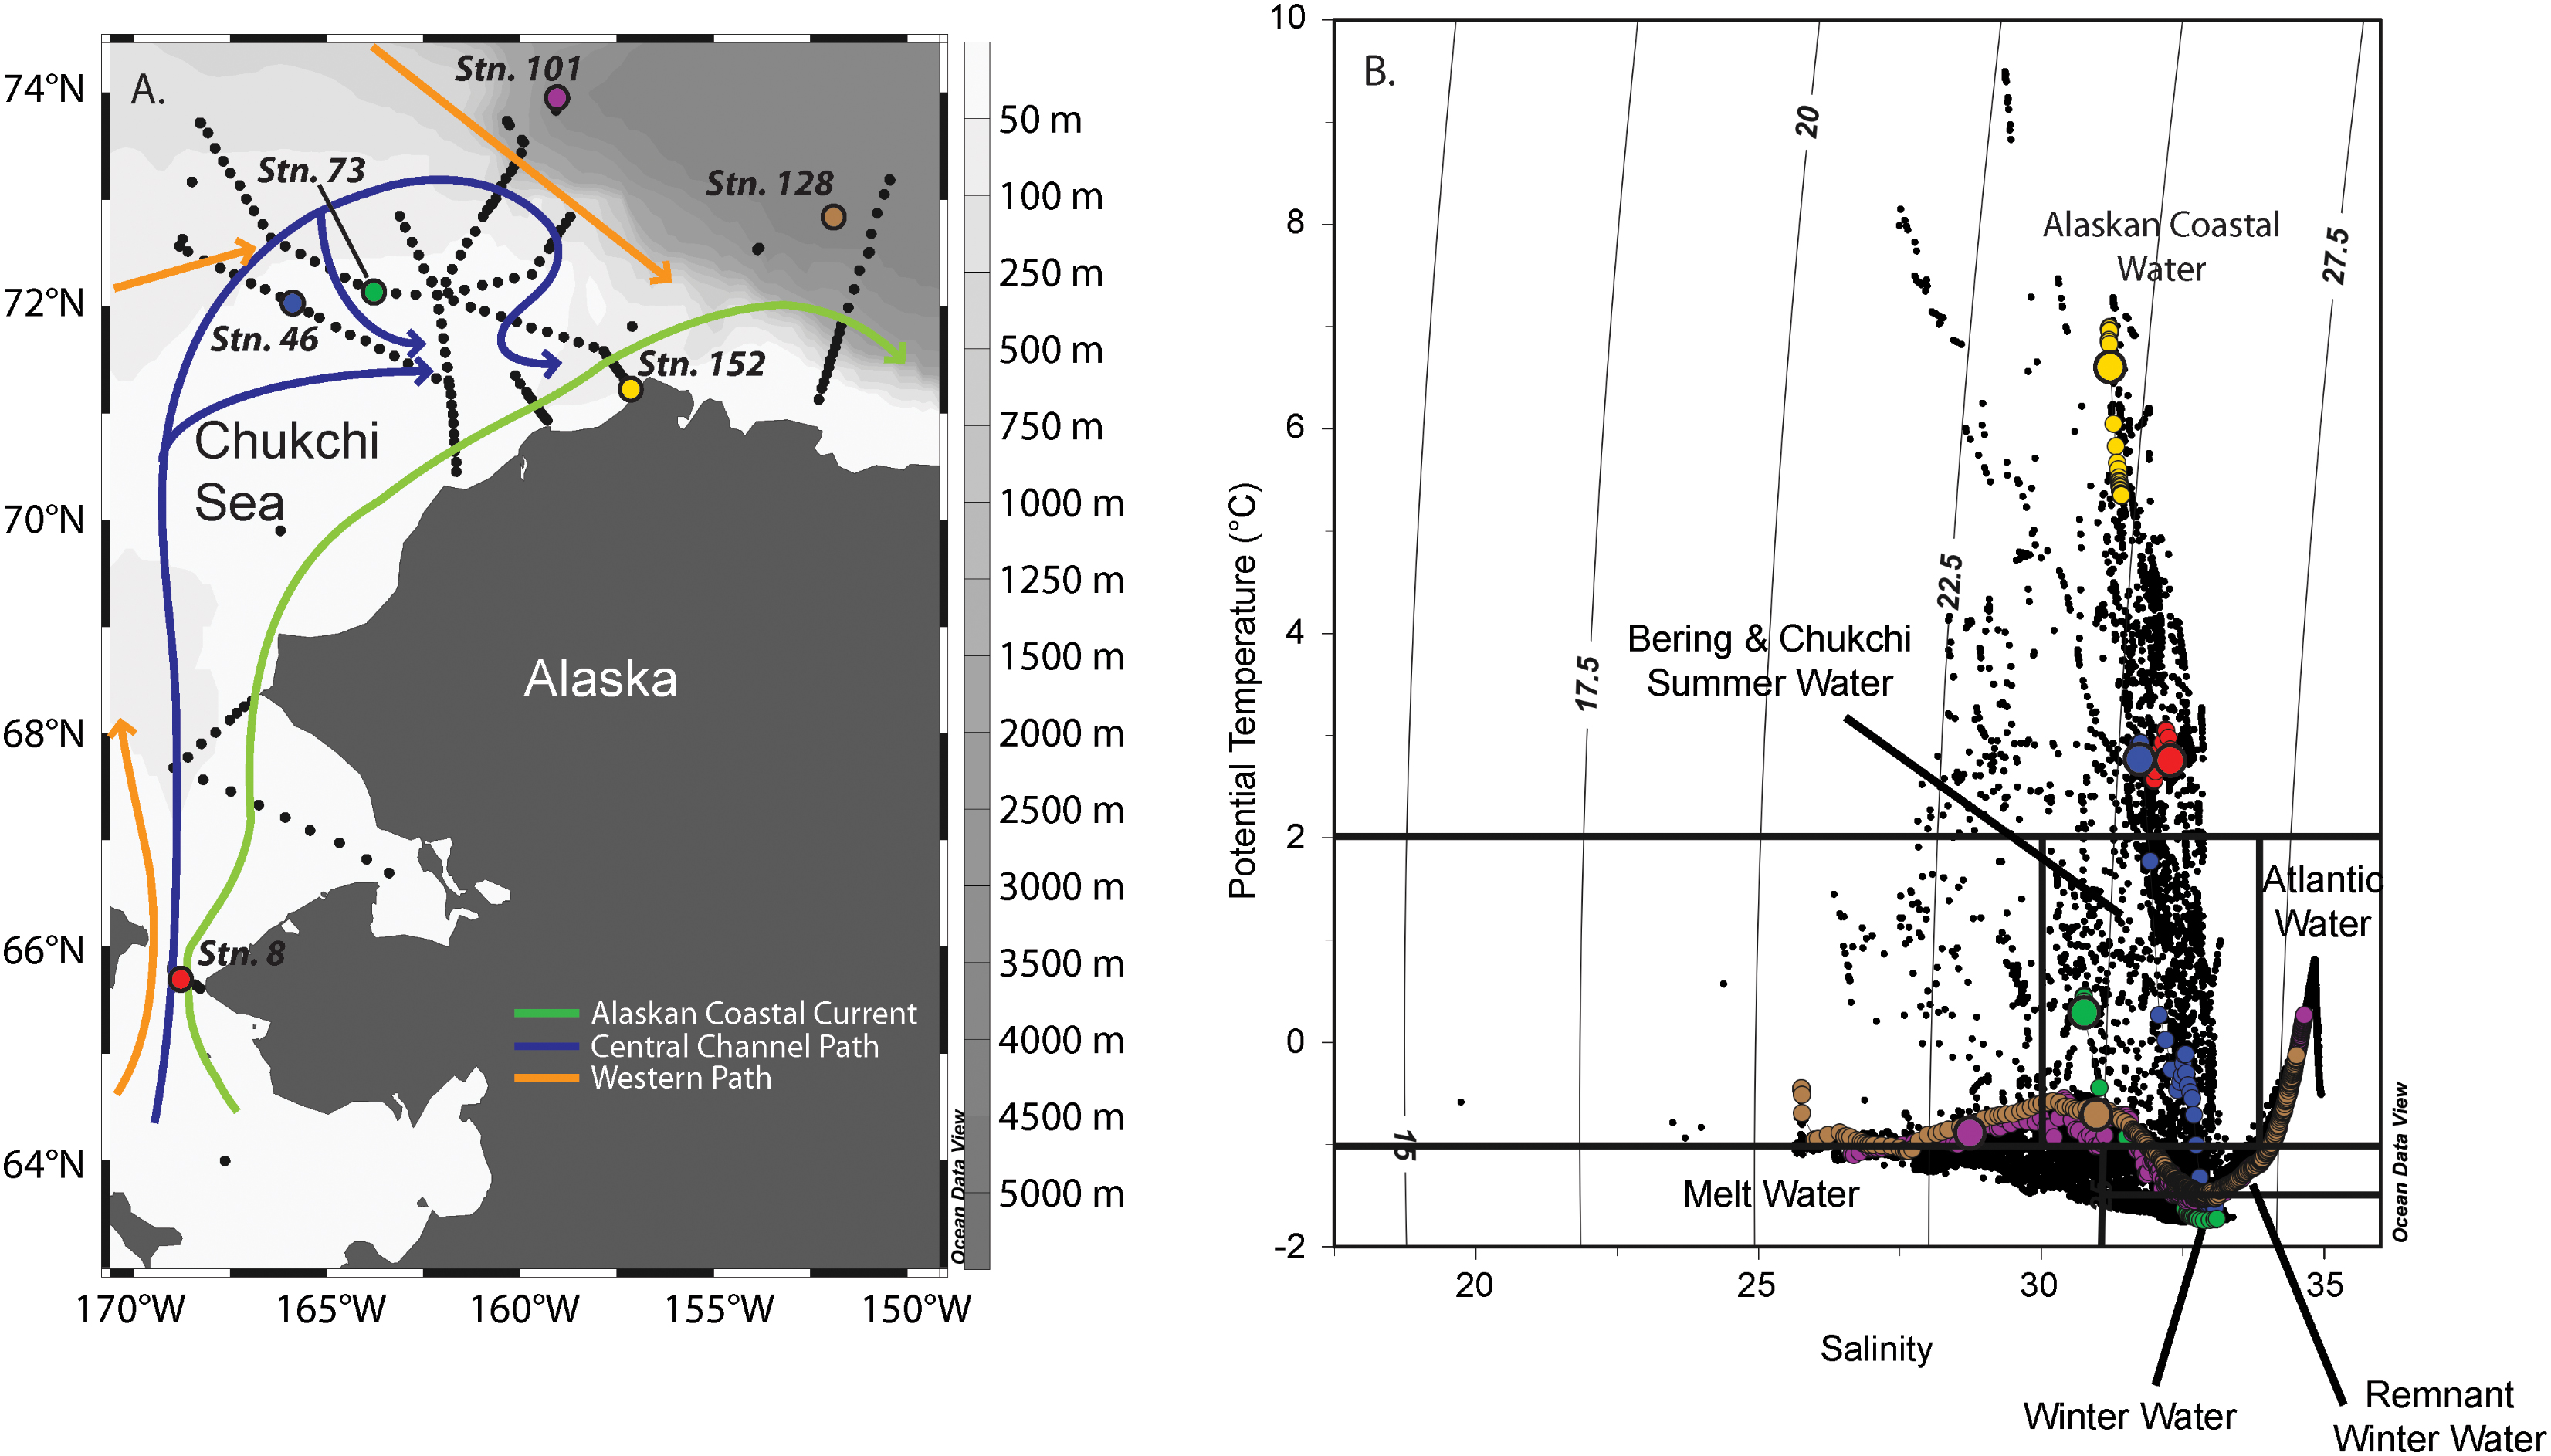
FIGURE 1. Map of the Chukchi Sea showing the stations sampled during the ICESCAPE 2011 field campaign (A). Stations where nutrient addition bioassays were carried out are shown as colored dots. Temperature (T) and salinity (S) relationship of waters sampled during ICESCAPE 2011. Vertical lines indicate water mass density (B). The colored dots represent profiles at stations where nutrient addition bioassay were conducted, where colors match the stations in (A). The largest dot in each profile is T-S of the sampled depth.
In early winter, ice formation and brine rejection over the Chukchi shelf drive convective overturning that mixes the water column. As winter progresses, the whole of the Chukchi Sea becomes ice covered, daylight disappears, and inorganic nutrient concentrations increase due in part to microbial net remineralization of organic matter. The combination of the brine-induced mixing and nutrient regeneration results in a fully mixed, nutrient-rich water column, known as winter water (WW), that persists until ice melt begins in the spring (Arrigo et al., 2017), when light levels are high enough for phytoplankton to draw down nutrients and begin fixing carbon (Lowry et al., 2018). In recent years, thinner ice with high melt pond fractions have increased light penetration into the water below, allowing phytoplankton to bloom and consume nutrients even when sea ice is still present (Arrigo et al., 2012, 2014).
With respect to nutrient limitation, nitrogen (N) is considered the nutrient that limits autotrophic productivity in the Arctic once the spring bloom is complete (Kattner and Budeus, 1997; Tremblay et al., 2002, 2008; Simpson et al., 2008; Tremblay and Gagnon, 2009). Likewise, Ortega-Retuerta et al. (2012) demonstrated that heterotrophic prokaryotes were N-limited in the Western Arctic Ocean. The low concentrations of inorganic N relative to dissolved inorganic phosphorus (DIP) and dissolved silica (DSi) are primarily the result of high rates of denitrification in the sediments of the Bering Sea and Chukchi shelf that reduce nitrate (NO3-) and nitrite (NO2-) to the gaseous products nitric oxide (NO), nitrous oxide (N2O), and dinitrogen gas (N2) (Devol et al., 1997; Chang and Devol, 2009; Brown et al., 2015). A recent study (Mills et al., 2015) showed that excess N (N∗∗) decreased from the south to the north over the Chukchi Shelf, an indication that denitrification had removed N from the water during transit. Estimates of denitrification in the Arctic suggest it is a globally important N sink (Chang and Devol, 2009; Mills et al., 2015).
Phytoplankton can acclimate to N limitation in multiple ways. One primary response is to reduce the cell quota for N by lowering the amount of N-containing chlorophyll a (Chl a) per cell. Likewise, cells can reduce the cellular concentration of protein-rich light harvesting complexes, as well as other components of the photosynthetic electron transport chain that are composed of N-rich proteins. However, decreasing the size of the antennae that captures photons has the disadvantage that it either reduces the functional absorption cross section (σPSII) or decreases the number of photosystem components, thereby reducing the rate at which electrons can flow through the photosynthetic electron transport chain (1/τPSII) (Moore et al., 2006; Lewis et al., 2018). Another phytoplankton response to N limitation may be an increase in NO3- transporters (Hildebrand and Dahlin, 2000) which likely leads to increased N uptake rates when NO3- becomes available. However, other data suggest transporter numbers per cell are constant whether N is limiting or not (Zehr et al., 1988). In addition to changes in transporter proteins, N-limited phytoplankton cells have increased protease activities and decreased protein concentrations, particularly the carbon fixation enzyme ribulose 1,5-bisphosphate carboxylase/oxygenase (Berges and Falkowski, 1998).
The composition of the phytoplankton community can also change upon depletion of nutrients. Typically, the community shifts toward smaller cells more adapted to low nutrient concentrations (Moore et al., 2013). Smaller cells have a higher surface area to volume ratio and lower nitrogen requirements, and thus a competitive advantage under low nutrient conditions. Evidence in the Arctic shows that as the freshwater content has increased, nutrient availability has decreased and phytoplankton communities are shifting toward smaller cells (Li et al., 2009; Lee et al., 2013). If trends of decreasing ice concentrations and increasing sea surface temperatures continue for the Arctic Ocean, a potential future could include a more stratified water column with less available nutrients for phytoplankton and heterotrophic prokaryotes. As such, the shift toward smaller phytoplankton cells described in Li et al. (2009) would be expected to continue and become more widespread.
Given the current Arctic Ocean environmental changes, we designed the present study with the objective of gaining a better understanding of how phytoplankton and heterotrophic prokaryotes currently utilize NO3- in the Chukchi Sea. As such, we tested the response of the phytoplankton and heterotrophic prokaryote communities to additions of NO3-, and followed changes in nutrient concentrations, bulk Chl a, and active fluorescence. Additionally, we measured changes in the abundance of the ∼<10 μm sized phytoplankton cells, taxon-specific C content of phytoplankton ∼>8 μm, size fractionated (<1 μm and >1 μm) particulate organic N and carbon (C), and NO3- and CO2 uptake rates. Finally, we measured changes in the abundance and production of the heterotrophic prokaryote populations. The results are discussed with respect to how predicted changes in the Western Arctic Ocean will affect phytoplankton and heterotrophic prokaryote communities and their impact on the biogeochemistry of the region.
Materials and Methods
Study Site and Sampling Locations
Between June 25 and July 29, 2011, six nutrient addition bioassays were conducted in the Chukchi Sea as a part of the Impacts of Climate on EcoSystems and Chemistry of the Arctic Pacific Environment (ICESCAPE) field campaign (Figure 1A). Experiments were conducted at four on-shelf and two off-shelf stations. The experiments were conducted in three different surface water masses (Figure 1B), including ACW (Stations 8, 46, and 152), BCSW (Station 73), and off-shelf meltwater-influenced waters (Stations 101 and 128).
NO3- Addition Experiments
Seawater was collected from the upper mixed layer at all stations using a CTD rosette outfitted with twelve 30 L Niskin bottles. Water was sampled from within the mixed layer at all sites except the two farthest offshore (Stns. 101 and 128) (Table 1). Mixed layer depth (MLD) was determined as in Palmer et al. (2013). Once onboard, water was randomly dispensed into 2 L acid-washed polycarbonate bottles through 100 μm Nitex mesh to remove grazers. The experiments were not intended to quantify grazers or grazing rate and thus they were removed from both treatments to isolate the effect of NO3- on the phytoplankton and heterotrophic prokaryote community. Triplicate bottles were filled for two treatments (control and +NO3-) and 5–7 sampling time points. The +NO3- bottles were amended with NO3- such that final concentrations were ∼5 mmol NO3- m-3, except at station 8 where the NO3- amendment resulted in a final concentration of ∼10 mmol m-3. The bottles were sealed and placed in on-deck flow-through incubators cooled with surface seawater and shaded to 50% of incident irradiance using neutral density screening. Triplicate bottles of each treatment were analyzed at multiple sampling time (T) points (T = 0, 24, 48, 72, and 96 h). At the two off the shelf stations (Stations 101 and 128), samples were also collected at T = 120 and 144 h. Incubation times were relatively long because sea surface temperatures were low (-1.0 – 2.9°C) at all sites except one (St. 152) (Table 1) and phytoplankton growth rates were expected to be low.
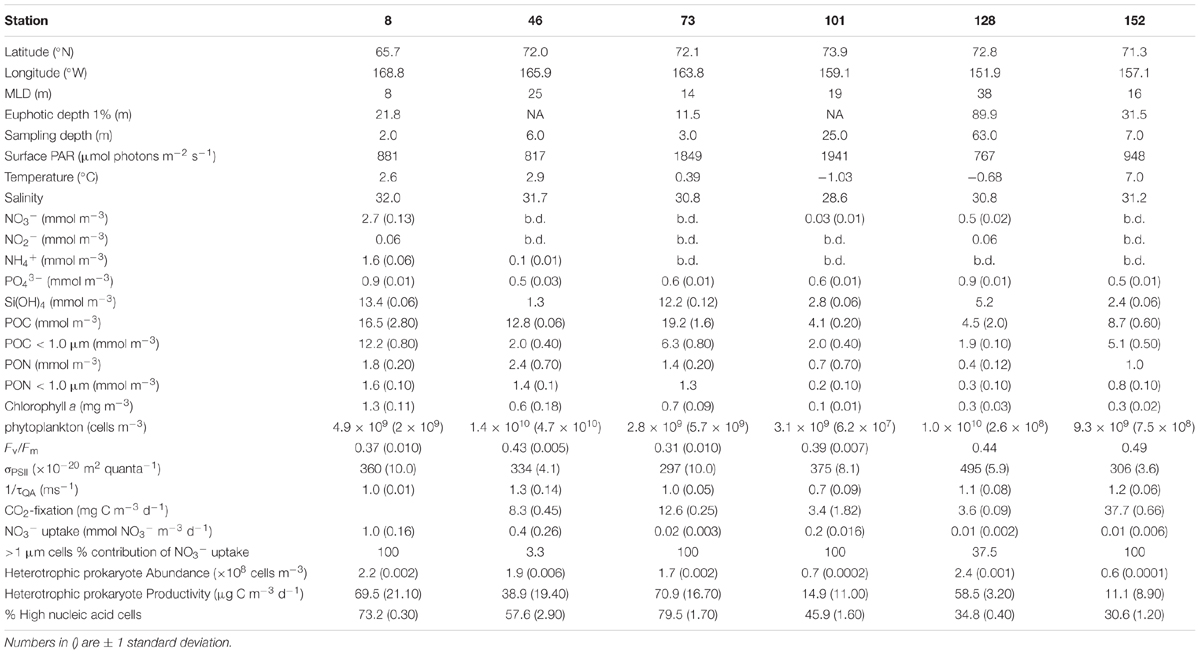
TABLE 1. Initial conditions for bioassay experiments.
Samples were collected at each time point for the measurement of nutrient concentrations [NO3-, NO2-, NH4+, PO43-, Si(OH)4], Chl a concentration, maximum photochemical efficiency of PSII (Fv:Fm), effective optical cross section of PSII (σPSII), turnover time of the primary electron acceptor at PSII (τQa), phytoplankton cell abundance (∼<10 μm) and heterotrophic prokaryote abundance and production. At the initial and final time points, size fractionated samples (<1.0 μm and total community fractions) were also collected for quantification of particulate organic carbon and nitrogen (POC and PON) concentrations and CO2 fixation and NO3- uptake rates. Finally, the C content of the most abundant phytoplankton taxa (∼>8 μm) was measured as described in Laney and Sosik (2014).
Nutrient Analysis
Nutrient samples were analyzed on a segmented continuous flow autoanalyzer (AA3, Seal Analytical) within an hour of collection. NO3- + NO2- and Si(OH)4 concentrations were determined using a modification of the Armstrong et al. (1967) methods. NH4+ concentrations were determined fluorometrically (Kerouel and Aminot, 1997). PO43- concentrations were measured using the ammonium molybdate method described in Bernhardt and Wilhelms (1967). It should be noted that all nutrients were measured on unfiltered seawater which can impact measured concentrations when particulate loads are high due to nutrient release from particles. For the most part, surface nutrients were depleted, indicating that our sampling was after the major growth season and consequently, particulate loads were low.
Particulate Analysis
Samples for fluorometric analysis of Chl a were filtered onto 25 mm Whatman GF/F filters (nominal pore size 0.7 μm), placed in 5 mL of 90% acetone, and extracted in the dark at 3°C for 24 h. Chl a was measured fluorometrically (Holm-Hansen et al., 1965) using a Turner Fluorometer 10-AU (Turner Designs, Inc.). POC and PON samples were size-fractionated by filtering samples onto 0.2 and 1.0 μm silver filters (Sterlitech Corporation). Blank filters for each size fraction were made by passing ∼25 ml of 0.2 μm filtered seawater over the respective pore-sized silver filters and processed the same as the particulate samples. The filters were immediately dried at 60°C and stored dry until processing. Prior to analysis, the samples were fumed with concentrated HCl (37%) for ∼12 h, dried (60°C), and packed into tin capsules (Costech Analytical Technologies, Inc.) for analysis on an Elementar Vario EL Cube or Micro Cube elemental analyzer (Elementar Analysensysteme GmbH, Hanau, Germany) interfaced to a PDZ Europa 20-20 isotope ratio mass spectrometer (Sercon Ltd., Cheshire, United Kingdom). Peach leaves and glutamic acid were used as calibration standards. The limits of detection for POC and PON, calculated as three times the standard deviation of the average blank filters, were 1.8 and 18 μg N and C, respectively.
Phytoplankton and Heterotrophic Prokaryote Abundance
A flow cytometer (Accuri C6, Becton-Dickson) was used to determine the abundance of phytoplankton <10 μm. A detailed description of the flow cytometric protocols used here is outlined in Laney and Sosik (2014). Briefly, seawater samples were prefiltered through Nitex screening (200 μm mesh size) to remove larger cells, chains, and colonies that might clog the instrument flow cell. For phytoplankton cells, approximately 200 μl of sample were counted. Distilled water blanks were measured after each set of samples at every station, and standard beads (PeakFlow P14827, 2.5 μm, 515 nm emission) were also run periodically during the cruise to track instrument behavior, to determine the instrument sensitivity in detecting cells or other particles, and to provide reference data for normalizing the phytoplankton cell scattering measurements into bead units. Custom software was used to interpret the measured cell scattering and fluorescence data and determine the abundance of <10 μm cells. Phytoplankton cells were discriminated from other particles by their relative combinations of chlorophyll fluorescence and side scattering. Phytoplankton taxa (∼>8 μm) were enumerated using an Imaging FlowCytobot (IFCB) as described in Laney and Sosik (2014). The IFCB uses a combination of flow cytometric and video technology to capture high-resolution images of phytoplankton in the nano- and micro-size fraction (Olson and Sosik, 2007). Briefly, seawater samples (5 ml) were injected through an 860 μm × 180 μm flow cell through which a 635 nm laser beam was focused. Chl a-containing particles that passed through this beam emitted a fluorescence signal that triggered the digital camera capturing a micrograph of that particular cell, chain, or colony. A Nitex screen (nominal mesh size 130 μm) placed on the sample intake prevented large particles from clogging the flow cell. This screen, combined with the camera field of view, set the effective upper size limit of cells, chains, or colonies to a length <∼300 μm. The lower size limit of cells was a function of the minimum fluorescence intensity needed to trigger the camera, typically >8 μm. The cells imaged using the IFCB allowed for quantification of different taxa in the > 8 μm size class. Additionally, non-algal classes such as detritus and diatom frustules were also identified in images where present. Using the same methods presented in Laney and Sosik (2014), the data were converted to equivalent C units for each taxonomic group.
Heterotrophic prokaryotes were counted on board using a 488 nm laser on the flow cytometer. Samples were fixed with glutaraldehyde (0.25% final concentration) and stored at -80°C until processing (within a few days after collection). Samples were thawed and SYBR Green-I was added at a final dilution of 1:10,000. Samples were incubated in the dark for 15 min before analysis. Heterotrophic prokaryotes were identified on a plot of green fluorescence (515–545 nm) versus right-angle light scatter (SSC), using the green fluorescence as a threshold parameter. The prokaryote population was sorted into the commonly grouped high nucleic acid (HNA) and low nucleic acid (LNA) containing cells (Gasol and Del Giorgio, 2000) according to their green fluorescence and counted separately (Marie et al., 1997).
FRRf Measurements
The bulk Fv:Fm, σPSII, and 1/τQa of the phytoplankton community was measured on dark-acclimated (30 min.) aliquots of initial and treated waters using a Light Induced Fluorescence Transients Fast Repetiton Rate fluorometer (LIFT-FRRf1). Briefly, the sample chamber was exposed to a FRRf excitation protocol composed of a series of microsecond-long flashlets of controlled excitation power. The saturation phase of the excitation was comprised of 100 flashlets at 2.5 ms intervals. With the pulse excitation power of 30,000–50,000 μmol quanta m-2 s-1, the rate of excitation delivery to PSII centers far exceeded the capacity of photosynthetic electron transport between PSII and PSI. This resulted in a progressive saturation of the observed fluorescence transients within the first 40–60 flashlets, at a rate proportional to the functional absorption cross section. The saturation phase was followed by 90 flashlets applied at exponentially increasing time intervals starting at 20 ms, over a period of 250 ms. As the average excitation power decreased, the fluorescence signal relaxed with kinetics mostly defined by the rate of electron transport between PSII and PSI. Each sample measurement consisted of an average of 32 transients, and each sample was measured three times. Blanks for individual samples analyzed by FRRf were prepared by gentle filtration through a 0.2 mm polycarbonate syringe filter before measurement using identical protocols. All reported values were corrected for blank effects (Cullen and Davis, 2003). Recorded fluorescence transients were processed with FRRf software1 to estimate Fm, Fv/Fm, σPSII, and 1/τQa for all Chl a-containing cells (excitation wavelength of 470 nm).
Rate Measurements
Samples for the determination of 14CO2-fixation and NO3- uptake rates were measured at T = 0 and T = final. 14CO2-fixation rates were determined by measuring 14C-incorporation in subsamples collected from the triplicate control and NO3- amended bottles. To 150 mL of sample, 0.74 MBq of H14CO3 was added and incubated in the on-deck incubators at 50% incident irradiance for 24 h. After incubation, 30 mL was filtered onto 25 mm GF/F filters in triplicate under very low vacuum pressure (<2.5 mm Hg). The filters were transferred to glass scintillation vials acidified with 0.1 mL of 6 N HCl and allowed to sit over the next 24 h to drive off unincorporated inorganic C. After the acidification step, 5 mL of scintillation cocktail (Ecolume) was added to each sample, which were counted (after >3 h) on a PerkinElmer Tri-Carb liquid scintillation counter. Total activity was determined on each sample by combining 50 μL of sample with 50 μL of ethanolamine, 0.5 mL filtered seawater, and 5 mL of scintillation cocktail. T = 0 samples were filtered (30 mL in triplicate) and acidified at the start of the incubation period. Rates of CO2 fixation were then calculated as outlined in Knap et al. (1996).
Initial and final NO3- uptake rates were determined by measuring the incorporation of 15NO3- into the total and >1 μm particulate matter fractions. At each time point, a 20 mL sample was collected to determine the concentration of NO3- in the 2 L experiment bottles and then trace additions (∼10% of ambient [NO3-]) of 99% Na15NO3 were made to each bottle. Immediately following this spike, subsamples collected from each bottle were filtered onto silver filters (0.2 or 1.0 μm pore size for the total and >1.0 μm size fractions, respectively) for determination of the T = 0 atom% 15N. The spiked bottles were returned to their incubators for 24 h after which subsamples were collected onto silver filters, as done at the start of rate measurement. All filters were prepared for analysis in the same manner as the POC/PON filters. All enriched isotope analyses took place on a Micro Cube elemental analyzer (Elementar Analysensysteme GmbH, Hanau, Germany) interfaced to a PDZ Europa 20-20 isotope ratio mass spectrometer (Sercon Ltd., Cheshire, United Kingdom). The isotopic enrichment of each sample was determined as atom% 15N where atom% and NO3- uptake rates were determined as in Glibert and Capone (1993). The limit of detectable enrichment (0.04%) was determined as three times the standard deviation of the T = 0 samples.
Heterotrophic prokaryote production (BP) was measured by 3H-leucine incorporation (Smith and Azam, 1992). Samples (1.5 mL in triplicate plus one killed control) were added to sterile microcentrifuge tubes containing 20–30 nM [4,5-3 H]-leucine. This concentration was sufficient to saturate heterotrophic prokaryote leucine uptake. Incorporation rates were measured after 2 h incubations at in situ temperature and incubations were stopped by the addition of trichloroacetic acid (5% final concentration). The mean sample dpm was on average 4.4-fold greater than the mean blank dpm. Contamination was not detected in the leucine batches. Leucine incorporation rates were converted to C production using the conversion factor of 1.5 kg C produced per mole leucine incorporated (Kirchman, 1993), assuming no isotope dilution.
Comparison Between Experiments
The similarity of responses between the different experiments were analyzed by comparing the treatment to the control response at T = final for multiple variables. Hierarchical clustering using Ward’s minimum variance method was used to group experiments with similar relative responses. Visualization of the relative responses and the hierarchical clustering were calculated using RStudio v.1.1.453 and the gplots and ggdendro packages.
Results
Initial Conditions
The initial starting conditions were partially dictated by where on the shelf, and thus in what water mass, the experimental water was collected (Figure 1B). The temperature and salinity relationships indicate that surface waters at Stns. 8, 46, and 152 were ACW. Of these, the coastal Stn. 152 was the warmest (∼7°C), with both Stns. 8 and 46 being approximately 4°C cooler. While the entire water column was well mixed at Stn. 8, the same was not true at Stn. 46 (MLD = 25 m, Table 1) where surface ACW overlaid a BCSW layer and a WW bottom layer. Stratification at Stn. 152 was relatively weak, with only a 0.25 difference in salinity between the surface and bottom water. The surface water at Station 73 was a shallower (MLD = 14 m) BCSW layer while the bottom layer was WW. Finally, the two stations located furthest north, at the shelf break (Stn. 101, MLD = 19 m) and off the shelf (Stn. 128, MLD = 38 m), were characterized by low salinity meltwater at the surface overlying BCSW and WW (Figure 1B).
Significant concentrations of dissolved inorganic nitrogen (DIN) were detected only at Stn. 8 (Bering Strait) and Stn. 128 (off-shelf easternmost site) (Table 1 and Figure 1A). At the Bering Strait station, both NO3- (2.7 ± 0.3 mmol m-3, mean ± SD) and NH4+ (1.6 ± 0.6 mmol m-3) concentrations were relatively high, while at Stn. 128, detectable NO3- concentrations (0.5 ± 0.02 mmol m-3) were measured only in relatively deep (63 m) waters. At the sampling depth at all other stations, the DIN concentrations were below or at the limit of detection of our instrument. In contrast, PO43- was detectable at all sites, and as with DIN, Stns. 8 and 128 had the highest concentrations (0.9 mmol m-3) (Table 1). Si(OH)4 was also detectable at all stations, with Stn. 8 having the highest concentrations (13.4 ± 0.06 mmol m-3). Similarly, high concentrations of Si(OH)4 were measured at the shelf Stn. 73 (12.2 ± 0.12 mmol m-3), while at the remaining stations, initial Si(OH)4 concentrations ranged between 1.3 and 5.2 mmol m-3.
The initial concentrations of Chl a in waters used for the experiments ranged from 0.1 to 1.3 mg m-3, being highest at the southernmost Bering Strait station (1.3 ± 0.11 mg m-3) and generally decreasing northward (Table 1). Additionally, initial Chl a concentrations were significantly correlated to Si(OH)4 concentrations [slope = 0.6 μg Chl a μmol-1 Si(OH)4, r = 0.78, p < 0.05], although not to other dissolved nutrient pools. Autotrophic cell abundance showed no trends with latitude. Concentrations of POC and PON were higher at the shelf stations relative to the two northern off-shelf stations (Stns. 102 and 128).
Fv:Fm of initial samples ranged approximately 1.5-fold, from 0.31 to 0.49, while σPSII ranged 1.6-fold (297–495 × 10-20 m2 quanta-1) and 1/τQA ranged 1.9-fold (0.7–1.3 ms-1). Neither Fv:Fm, σPSII, nor 1/τQA changed systematically with either latitude, surface irradiance, or nutrient concentrations. However, both Fv:Fm and σPSII increased significantly with MLD (Fv:Fm vs. MLD: m = 0.003 m-1, r = 0.63, p < 0.05; σPSII vs. MLD: m = 4.6 × 10⁻²⁰ m quanta-1, r = 0.77, p < 0.05). There was no relationship between 1/τQA and MLD.
CO2 fixation rates of the initial samples were highest at the inshore coastal station (Stn. 152: 37.7 ± 0.66 mg C m-3 d-1) followed by the two mid-shelf stations (Stn. 46: 8.3 ± 0.45 mg C m-3 d-1 and Stn 73: 12.6 ± 0.25 mg C m-3 d-1). The lowest initial rates of CO2 fixation were measured at the two northern stations (Stn 101: 3.4 ± 1.82 mg C m-3 d-1 and Stn.128: 3.6 ± 0.09 mg C m-3 d-1). No data were available for the Bering Strait station (Stn. 8). Overall, the rate of CO2 fixation was highly correlated with sea surface temperature (CO2 fixation rate vs. temp.: m = 3.9 mg C m-3 d-1 °C-1, r = 0.92, p < 0.05), but was independent of nutrient concentration and MLD.
The initial rate of NO3- uptake was highest at the Bering Strait (Stn. 8, 1.0 ± 0.16 mmol NO3- m-3 d-1, Table 1). At the two mid-shelf sites, NO3- uptake was variable, with the rate at Stn. 46 (0.4 ± 0.26 mmol NO3- m-3 d-1) being 20-fold higher than at Stn. 73 (0.02 ± 0.003 mmol NO3- m-3 d-1). Similarly, the rate of NO3- uptake differed between the two most northern sites, where rates measured at Stn. 101 (0.2 ± 0.016 mmol NO3- m-3 d-1) were 20-fold higher than at Stn. 128 (0.01 ± 0.002 mmol NO3- m-3 d-1). At the coastal ACC site (Stn. 152), rates were also low (0.01 ± 0.006 mmol NO3- d-1). Similar to CO2 fixation rate, NO3- uptake rate was independent of nutrient concentrations or MLD, but was highly correlated with sea surface temperature (NO3- uptake rate vs. temp.: m = 0.16 mmol NO3- m-3 d-1 °C-1, r = 0.89, p < 0.05).
Lastly, initial heterotrophic prokaryote abundance was highest at the Bering Strait site (Stn. 8: 2.2 ± 0.20 × 10⁸ cells m-3) and the coastal ACC station (Stn.152: 2.4 ± 0.05 × 10⁸ cells m-3). Only slightly lower abundances were measured at the two mid-shelf sites (Stn. 46: 1.9 ± 0.06 × 10⁸ cells m-3 and Stn. 73: 1.7 ± 0.16 × 10⁸ cells m-3) while the northern, shallower, station (Stn. 101) and the deeper northern site (Stn. 128) had the lowest abundance of heterotrophic prokaryotes (0.6 ± 0.01 × 10⁸ and 0.7 ± 0.02 × 10⁸ cells m-3, respectively). The %HNA of the community ranged from 30.6 to 79.5% (Table 1) but showed no relationship to heterotrophic prokaryote abundance (r = 0.40, p > 0.05). Heterotrophic prokaryote production, on the other hand, was positively correlated with heterotrophic prokaryote abundance (r = 0.84, p < 0.05). As such, the mid-shelf site (Stn. 101) and the coastal ACC station (Stn. 152) had the lowest heterotrophic prokaryote production rates while the highest rates (∼5-fold higher) were measured at the Bering Strait and the other mid-shelf (Stn. 73) station (Table 1). Additionally, a weak relationship was observed between %HNA and heterotrophic prokaryote production (m = 0.53%[μg C m-3 d-1]-1, r = 0.71, p < 0.05). While heterotrophic prokaryote abundance was weakly correlated to Chl a concentrations (m = 1.02 × 10⁸ cells m-3[mg Chl a m-3]-1, r = 0.57, p < 0.05), both BP and %HNA were more strongly correlated with Chl a (%HNA vs. Chl a: m = 35.74%[mg Chl a m-3]-1, r = 0.77, p < 0.05; BP vs. Chl a: m = 44.37 μg C m-3 d-1 [mg Chl a m-3]-1, r = 0.72, p < 0.05).
Treatment Responses
Nutrients
Consumption of NO3- in the control treatment at the two sites with detectable NO3- in the sampled waters (Stns. 8 and 128) was complete during the incubations (Figures 2A,E). At all other sites, initial NO3- concentrations were undetectable and remained so for the entirety of the experiments. NO3- was consumed in the treated bottles of most of the experiments (Figures 2A–F). The greatest consumption was at the Bering Strait site (Stn. 8) where close to 7.0 mmol m-3 was taken up during the 96 h experiment. Consumption of NO3- at the mid-shelf site (Stn. 73) was ∼5 mmol m-3, while at the other mid-shelf site (Stn. 46) NO3- consumption was ∼1.75 mmol m-3. Likewise, NO3- was taken up in the treated bottles at the coastal shelf site (Stn. 152, ∼1 mmol m-3) and at the deeply sampled off-shelf site (Stn. 128, ∼3 mmol m-3). At only the shallow off-shelf site (Stn. 101) there was an insignificant amount of NO3- consumed in the treated bottles during the experiment.
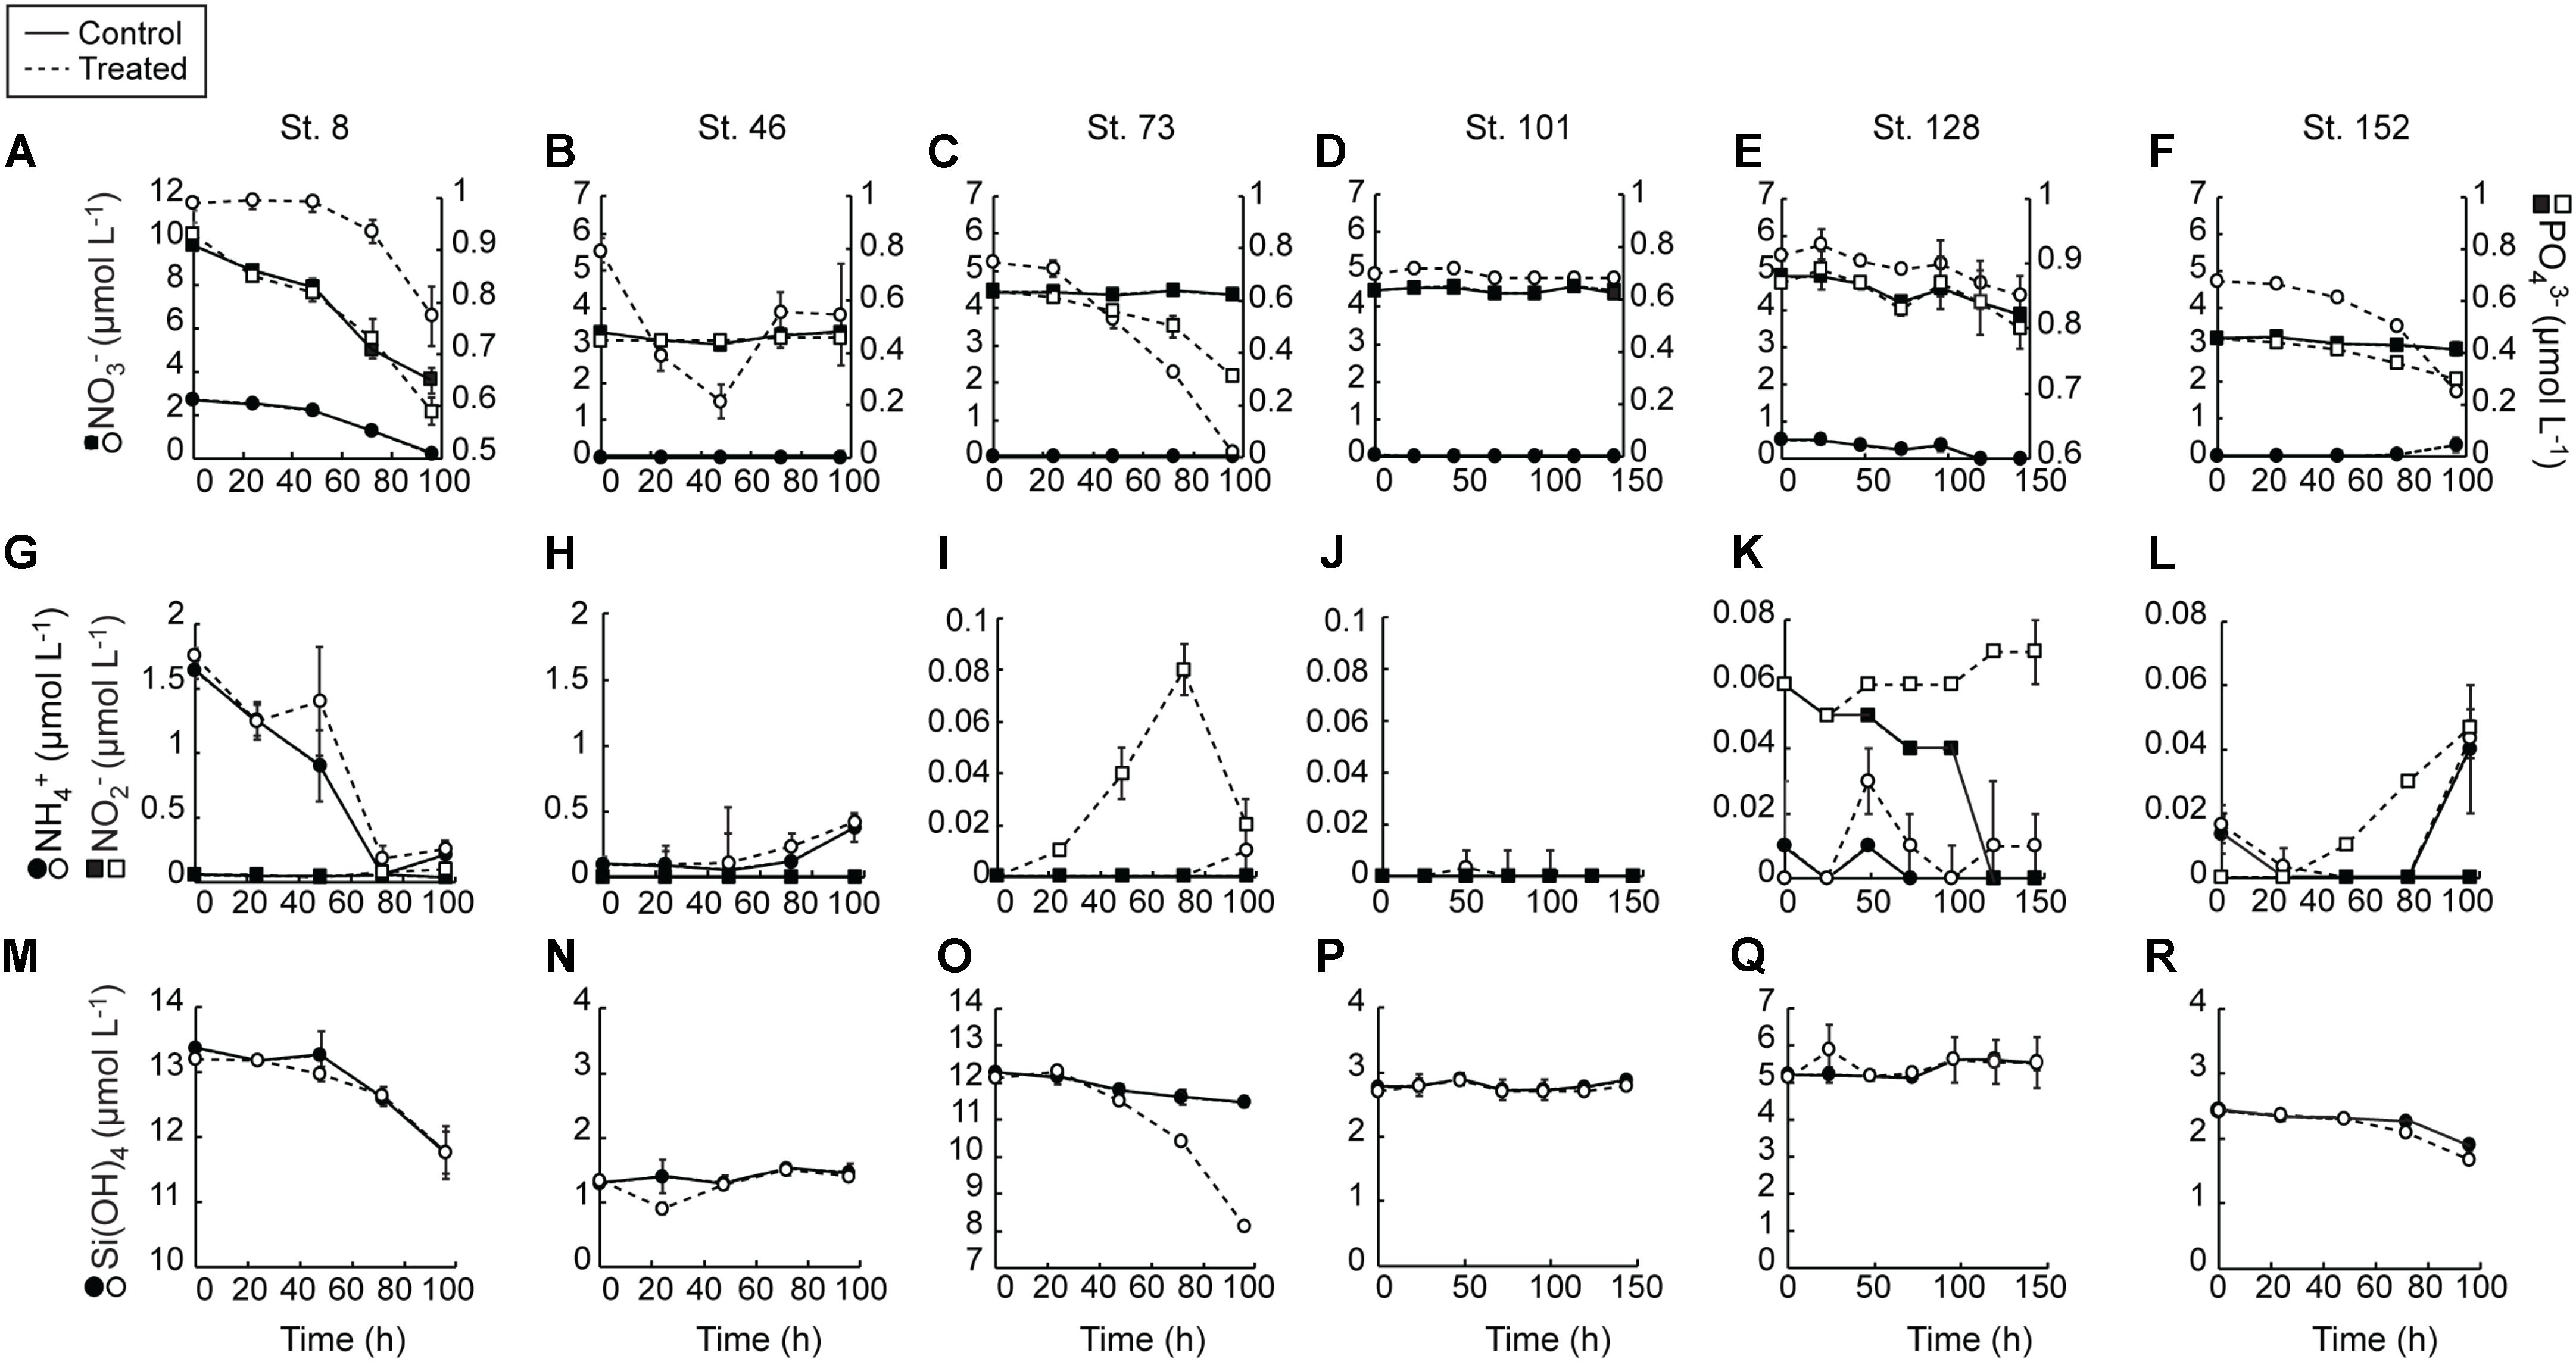
FIGURE 2. Average (±SD) nutrient concentrations measured during the nutrient amendment experiments. Solid lines are control and dashed lines are treated bottles. NO3- and PO43- (A–F), NH4 and NO2- (G–L), Si(OH)4 (M–R).
PO43- was consumed more in the +NO3- treatments than in the controls in three of the six experiments (Stns. 8, 73, 152) (Figures 2A–F). The greatest difference between treated and controls was at the mid-shelf site (Stn. 73), where close to 0.3 mmol PO43- m-3 was consumed in waters with added NO3-, relative to no PO43- uptake in the control. At Stns. 8 and 128, the differences in PO43- consumption between the control and treated bottles was <0.15 mmol m-3. At the more deeply sampled off-shelf site, which had initially detectable NO3- concentrations, approximately 0.05 mmol PO43- m-3 was consumed in both the control and treatment, while at the shallowly sampled off-shelf site, no PO43- uptake was detected during the incubation. Likewise, at the mid-shelf site (Stn. 46) no PO3- uptake was recorded in either the control or the NO3- treated bottles.
NH4+ concentrations were only initially detectable (∼1.65 mmol m-3) at the Bering Strait site (Stn. 8) and were depleted at the same rate in both the control and +NO3- treatments by the T = 72 h sampling (Figures 2G–L). Concentrations then rose to ∼0.25 mmol m-3 in both treatments at the final T = 96 h time point. The only other site with detectable T = 0 NH4+ concentrations was the mid-shelf site (Stn. 46) where concentrations were ≤0.1 mmol m-3. These NH4+ concentrations remained low until the final 48 h in both treatments when they started to increase. NH4+ concentrations remained below detection (0.02 mmol m-3) in both treatments at the other mid-shelf site (Stn. 73) and at the shallowly sampled off-shelf site (Stn. 101). At the more deeply sampled off-shelf site (Stn. 128), NH4+ was only detectable at the T = 48 h time point in the +NO3- treatment, while at the coastal site (Stn. 152) NH4+ concentrations rose to detectable levels (∼0.04 mmol m-3) in both the control and NO3- treated bottles.
Concentrations of NO2- were only initially detectable at the Bering Strait site (Stn. 8) and the deeply sampled off-shelf site (Stn. 128) (Figures 2G–L). The NO2- concentrations were depleted in the control treatment during all experiments at these sites. At all other sites, NO2- remained undetectable in the controls throughout the experiments. At multiple sites, however, NO2- concentrations increased in the +NO3- treatment during the incubations. For example, at the Bering Strait site (Stn. 8), the NO2- concentrations were 0.04 mmol m-3 higher at the end of the experiment (Figure 2G). Likewise, NO2- concentrations rose 0.08 and 0.03 mmol m-3 at the mid-shelf (Stn. 73) and coastal sites (Stn. 152), respectively (Figures 2I,L). No significant increases in NO2- concentrations were recorded in the treated bottles at the shallowly sampled off-shelf site (Stn. 101) (Figure 2J), and they remained below detection (0.03 μmol L-1) at the deeply sampled off-shelf site (Stn. 128) (Figure 2K).
Finally, Si(OH)4 was detectable at the start of all the experiments (Figures 2M–R). At only three sites (Stn. 8, Stn. 73, and Stn. 152) did concentrations decrease over the course of the experiments. There was no treatment effect at the Bering Strait site (Stn. 8) (Figure 8M), while consumption of Si(OH)4 was stimulated in the NO3- treated bottles relative to the control at the mid-shelf (Stn. 73) (Figure 2O) and coastal (Stn. 152) sites (Figure 2R). At Stn. 73, ∼4 mmol Si(OH)4 m-3 was consumed in the +NO3- treatment while only 0.8 mmol Si(OH)4 m-3 was consumed in the control. This difference was less at the coastal site [Stn. 152, Control: 0.5 mmol Si(OH)4 m-3, +NO3- treatment: 0.8 mmol Si(OH)4 m-3].
Pigments and Biomass
NO3- addition resulted in Chl a concentrations that were 1.4 – 6.8-fold above the control at all sites except the mid-shelf sites (Stn. 46) (Figures 3A–F). The difference between control and treatment Chl a concentrations was lowest at the two sites with initially detectable levels of NO3- (Stn. 8. treatment:control accumulation ratio = 1.4, Stn. 128 treatment:control accumulation ratio = 1.8) (Figures 3A,E). At those sites where NO3- was not detected in the sampled water, the treatment:control Chl a accumulation ratios were much higher (4.6 – 6.8) (Figures 3C,D,F).
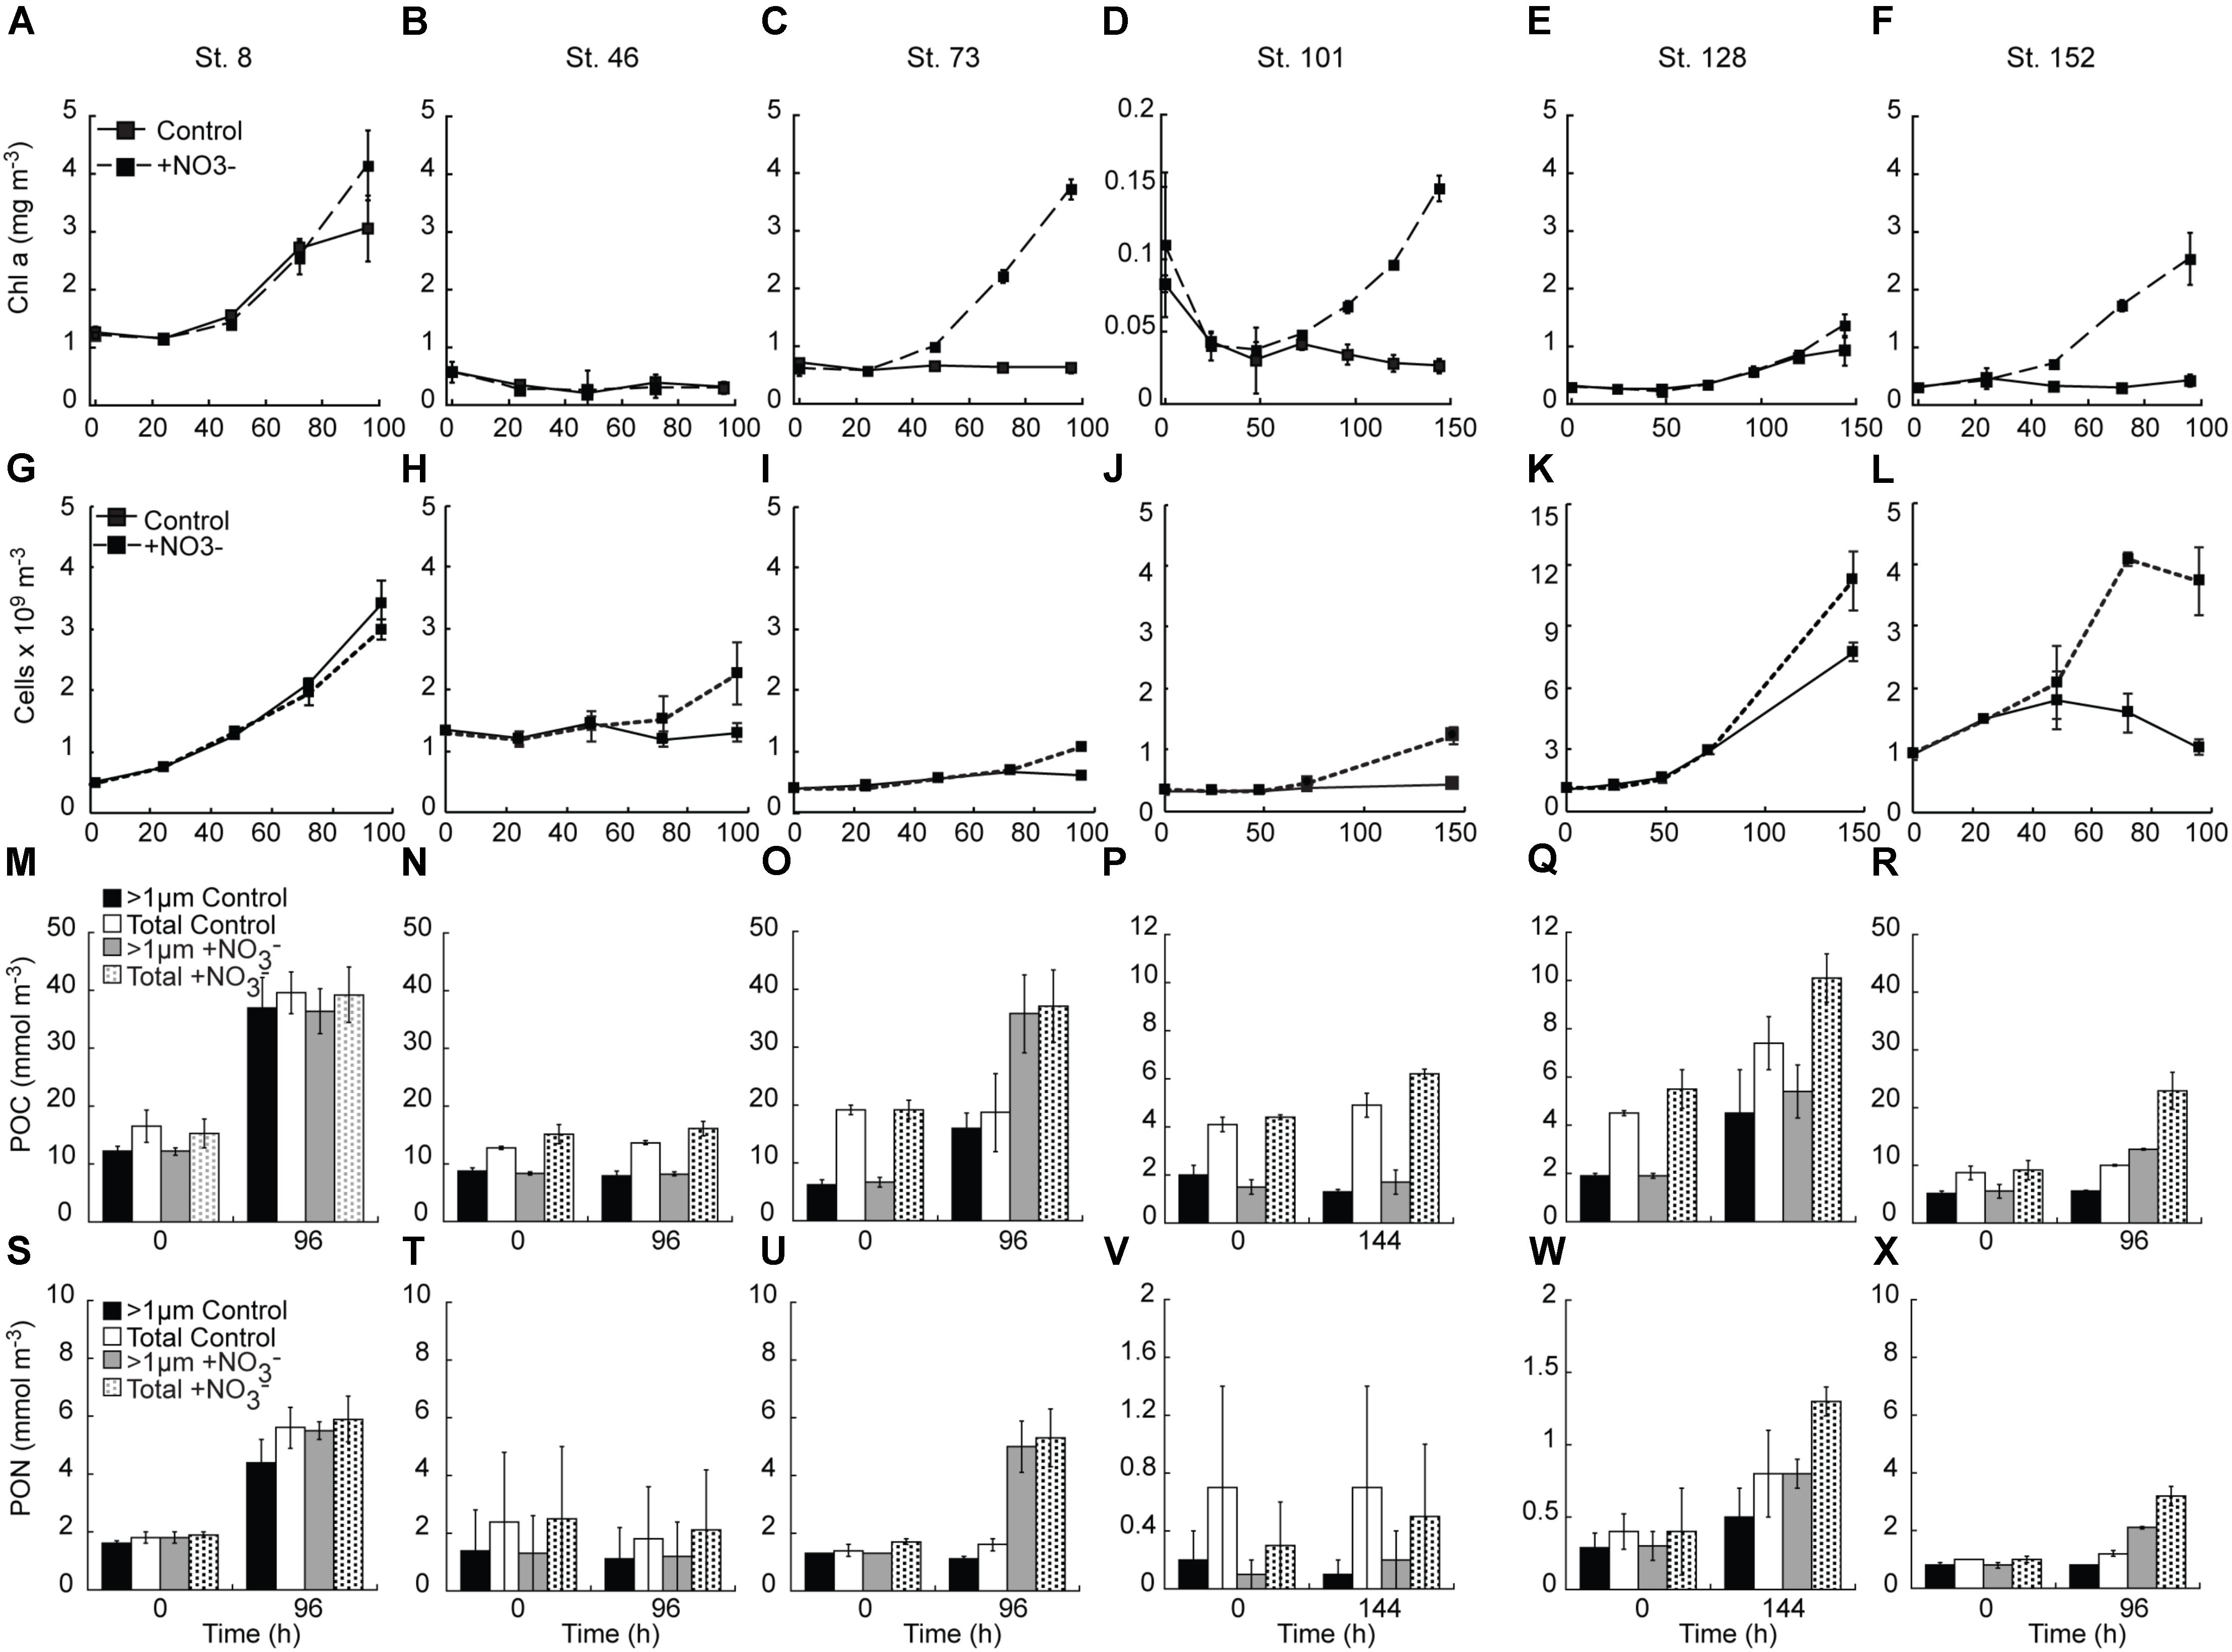
FIGURE 3. Response of chlorophyll a (A–F), phytoplankton (<10 μm) cell concentration (G–L), POC (M–R) and PON (S–X) concentrations to the addition of NO3-. Shown are average (±SD) concentration at each time point sampled.
The abundance of phytoplankton cells <10 μm responded similarly to the addition of NO3- as did Chl a concentrations, with two exceptions (Figures 3G–L). First, there was no significant treatment difference in the abundance of the <10 μm phytoplankton in the Bering Strait experiment (Stn. 8), with both the control and NO3- treatments showing similar increases. Secondly, a treatment difference in <10 μm phytoplankton cell abundance was detected at the mid-shelf site Stn. 46 with the NO3- treatment having ∼2-fold higher abundance than the control (which showed no increase) at the final time point (T = 96 h). This was in contrast to the Stn 46 Chl a response which showed no increase in either the control or NO3- treatments (Figure 3B). At all other sites, the final abundance of the <10 μm phytoplankton cells was higher (1.5–3.6-fold) in the +NO3- treatment than in the control. It should be noted that in those experiments with no initially detectable NO3-, the final abundance of the <10 μm phytoplankton cells in the control was not significantly different from the start, while at the Bering Strait and deeply sampled off-shelf site, increases were observed in both the control and NO3- treatments (Figures 3G,K). Additionally, in all experiments, except for the shallowly sampled off-shelf station (St. 101), the C concentration of the >8 μm class increased in response to the addition of NO3- (Figures 4A–L).
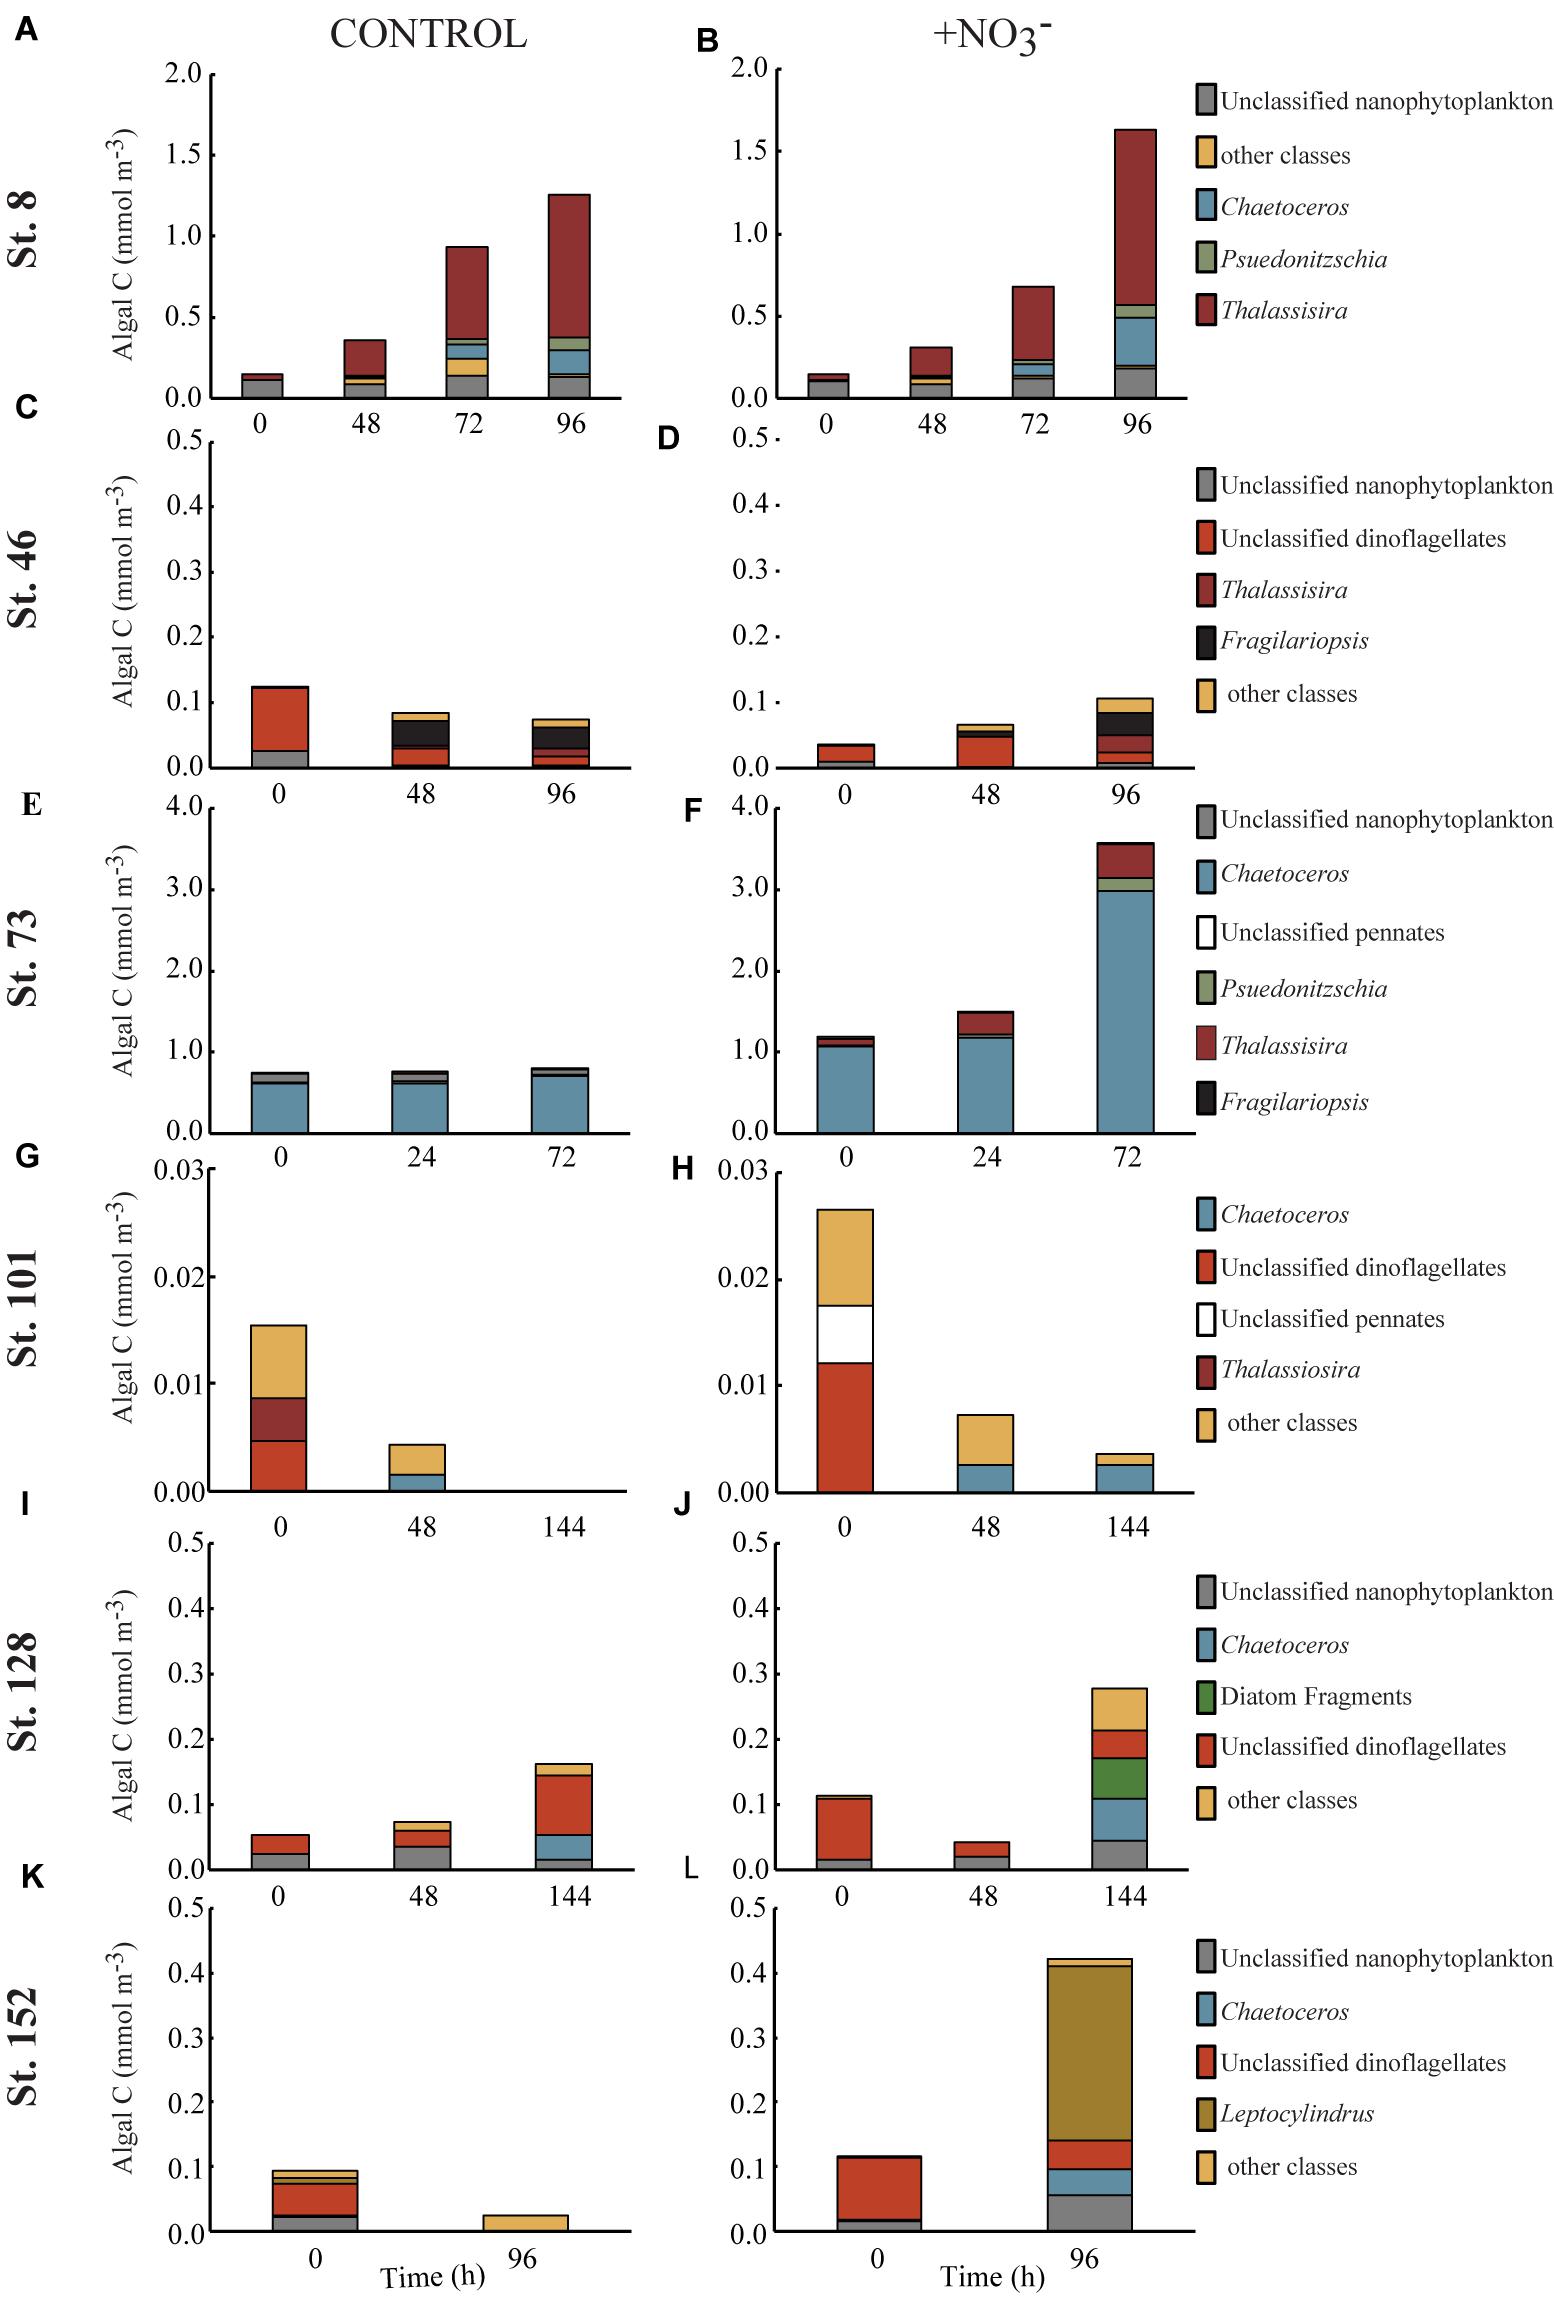
FIGURE 4. Concentration of phytoplankton biomass (mmol C m-3) found in the top 5–6 contributing taxonomic classes in the control (A,C,E,G,I,K) and nutrient amended (B,D,F,H,J,L) treatments.
Concentrations of POC and PON also tracked the changes observed in Chl a concentrations, with relatively greater increases observed in the NO3--amended waters (Figures 3M–X). Notable exceptions were again observed in the experiments at the Bering Strait (Stn. 8) and the first mid-shelf site (Stn. 46). At the former site, both the control and treated waters increased two–threefold in POC and PON while at the latter site POC and PON remained unchanged in both the control and treated bottles. At the remaining sites, relatively greater increases in both POC and PON were detected where NO3- was added, although little difference in PON was detected at the shallowly sampled off-shelf site (Stn. 101) (Figure 3V) because of high variability due to sample mass being close to detection limits.
The POC and PON responses by the two size classes measured varied in the different experiments. At the second mid-shelf site (Stn. 73), the >1 μm-sized POC comprised ∼33% of the total POC pool. At T = final, this increased to 85 and 96% in the control and +NO3- treatments, respectively. PON of the >1 μm size class, on the other hand, made up 80–90% of the initial PON pool but was only 70% of the total pool in the control, and 94% of the total pool in the NO3--amended bottles, at T = final. The two off-shelf sites differed from one another in that the primary particulate organic response at the shallowly sampled site was dominated by the <1 μm size fraction (i.e., while the total POC concentration increased, the >1 μm fraction remained constant) (Figure 3P). At the more deeply sampled off-shelf site (Stn. 128), this was not the case; the >1 μm sized POC increased from 30–40 to 50–60% of the total POC pool between the start and end of the incubation (Figure 3Q). Thus, while the <1 μm fraction was a significant component of the initial POC pool, accumulation of POC during the incubation was dominated by the >1 μm fraction. This was similar for PON at this station as well. Finally, there was no change in the amount of POC, or relative fraction of the >1 μm component in the control at the coastal site (Stn. 152). However, POC was stimulated by the addition of NO3- at this site, although the relative fraction of POC >1 μm remained unchanged at 60% over the course of the experiment (Figure 3R). The PON response at this site differed with the fraction of total PON in the >1 μm size class, dropping from ∼73 to 63% in both the control and NO3- treatments during the experiment (Figure 3X).
Composition of the POC Pool
The >8 μm phytoplankton size fraction decreased 86% at the shallowly sampled off-shelf site (Figure 4H). At all other sites, the POC concentration of the >8 μm phytoplankton size class increased where NO3- was available, primarily due to diatom growth (Figures 4B,D,F,J,L). The diatom Thalassiosira was dominant, responding in the experiments at the Bering Strait site (Stn. 8) and the second mid-shelf site (Stn.73) (Figures 4B,E), while at the first mid-shelf site (Stn. 42) diatoms (e.g., Thalassiosira and Fragilariopsis) combined for ∼60% of the C increase in the >8 μm phytoplankton size class (Figure 4D). At the deeply sampled off-shelf site (Stn. 128), a mix of diatoms, nanoflagellates, and “other classes” all increased, while dinoflagellates decreased (Figure 4J). At the coastal site (Stn. 152) diatoms dominated the increase, primarily Leptocylindrus which increased ∼200%, from <0.01 to 0.27 mmol C m-3 (Figure 4L).
However, phytoplankton did not comprise the largest fraction of the >8 μm particulate pool. At all sites, except for the mid-shelf sites (Stn. 46 and 73), detritus made up >50% of the initial particulate C pool (Figures 5C,E). In the case of Stn. 46, the particulate pool was composed of a mix of detritus (∼46% in T = 0 control) and phytoplankton that could not be classified as either diatom, dinoflagellate, prymnesiophyte, or nanoflagellate (i.e., “other taxa”) (53%), while at Stn. 73, diatoms made up 85–88% of the initial particulate C pool. Composition of the initial non-detrital C pool at the non-mid-shelf sites was a mix of different algal taxa. At the Bering Strait site (Stn. 8), nanoflagellates and diatoms dominated the algal portion of the particulate C pool while at the off-shelf shallow site (Stn. 101), the algal particulate pool was composed primarily of equal fractions (5–14%) of diatoms and dinoflagellates (Figures 5G,H). At the more deeply sampled off-shelf site, nanoflagellates (5–15%) and dinoflagellates (17–28%) dominated the starting algal community (Figures 5I,J). Finally, at the coastal site, the algal fraction of the particulate C pool was made up of diatoms (2–5%), nanoflagellates (4–6%), and dinoflagellates (15–26%) (Figures 4K,L).
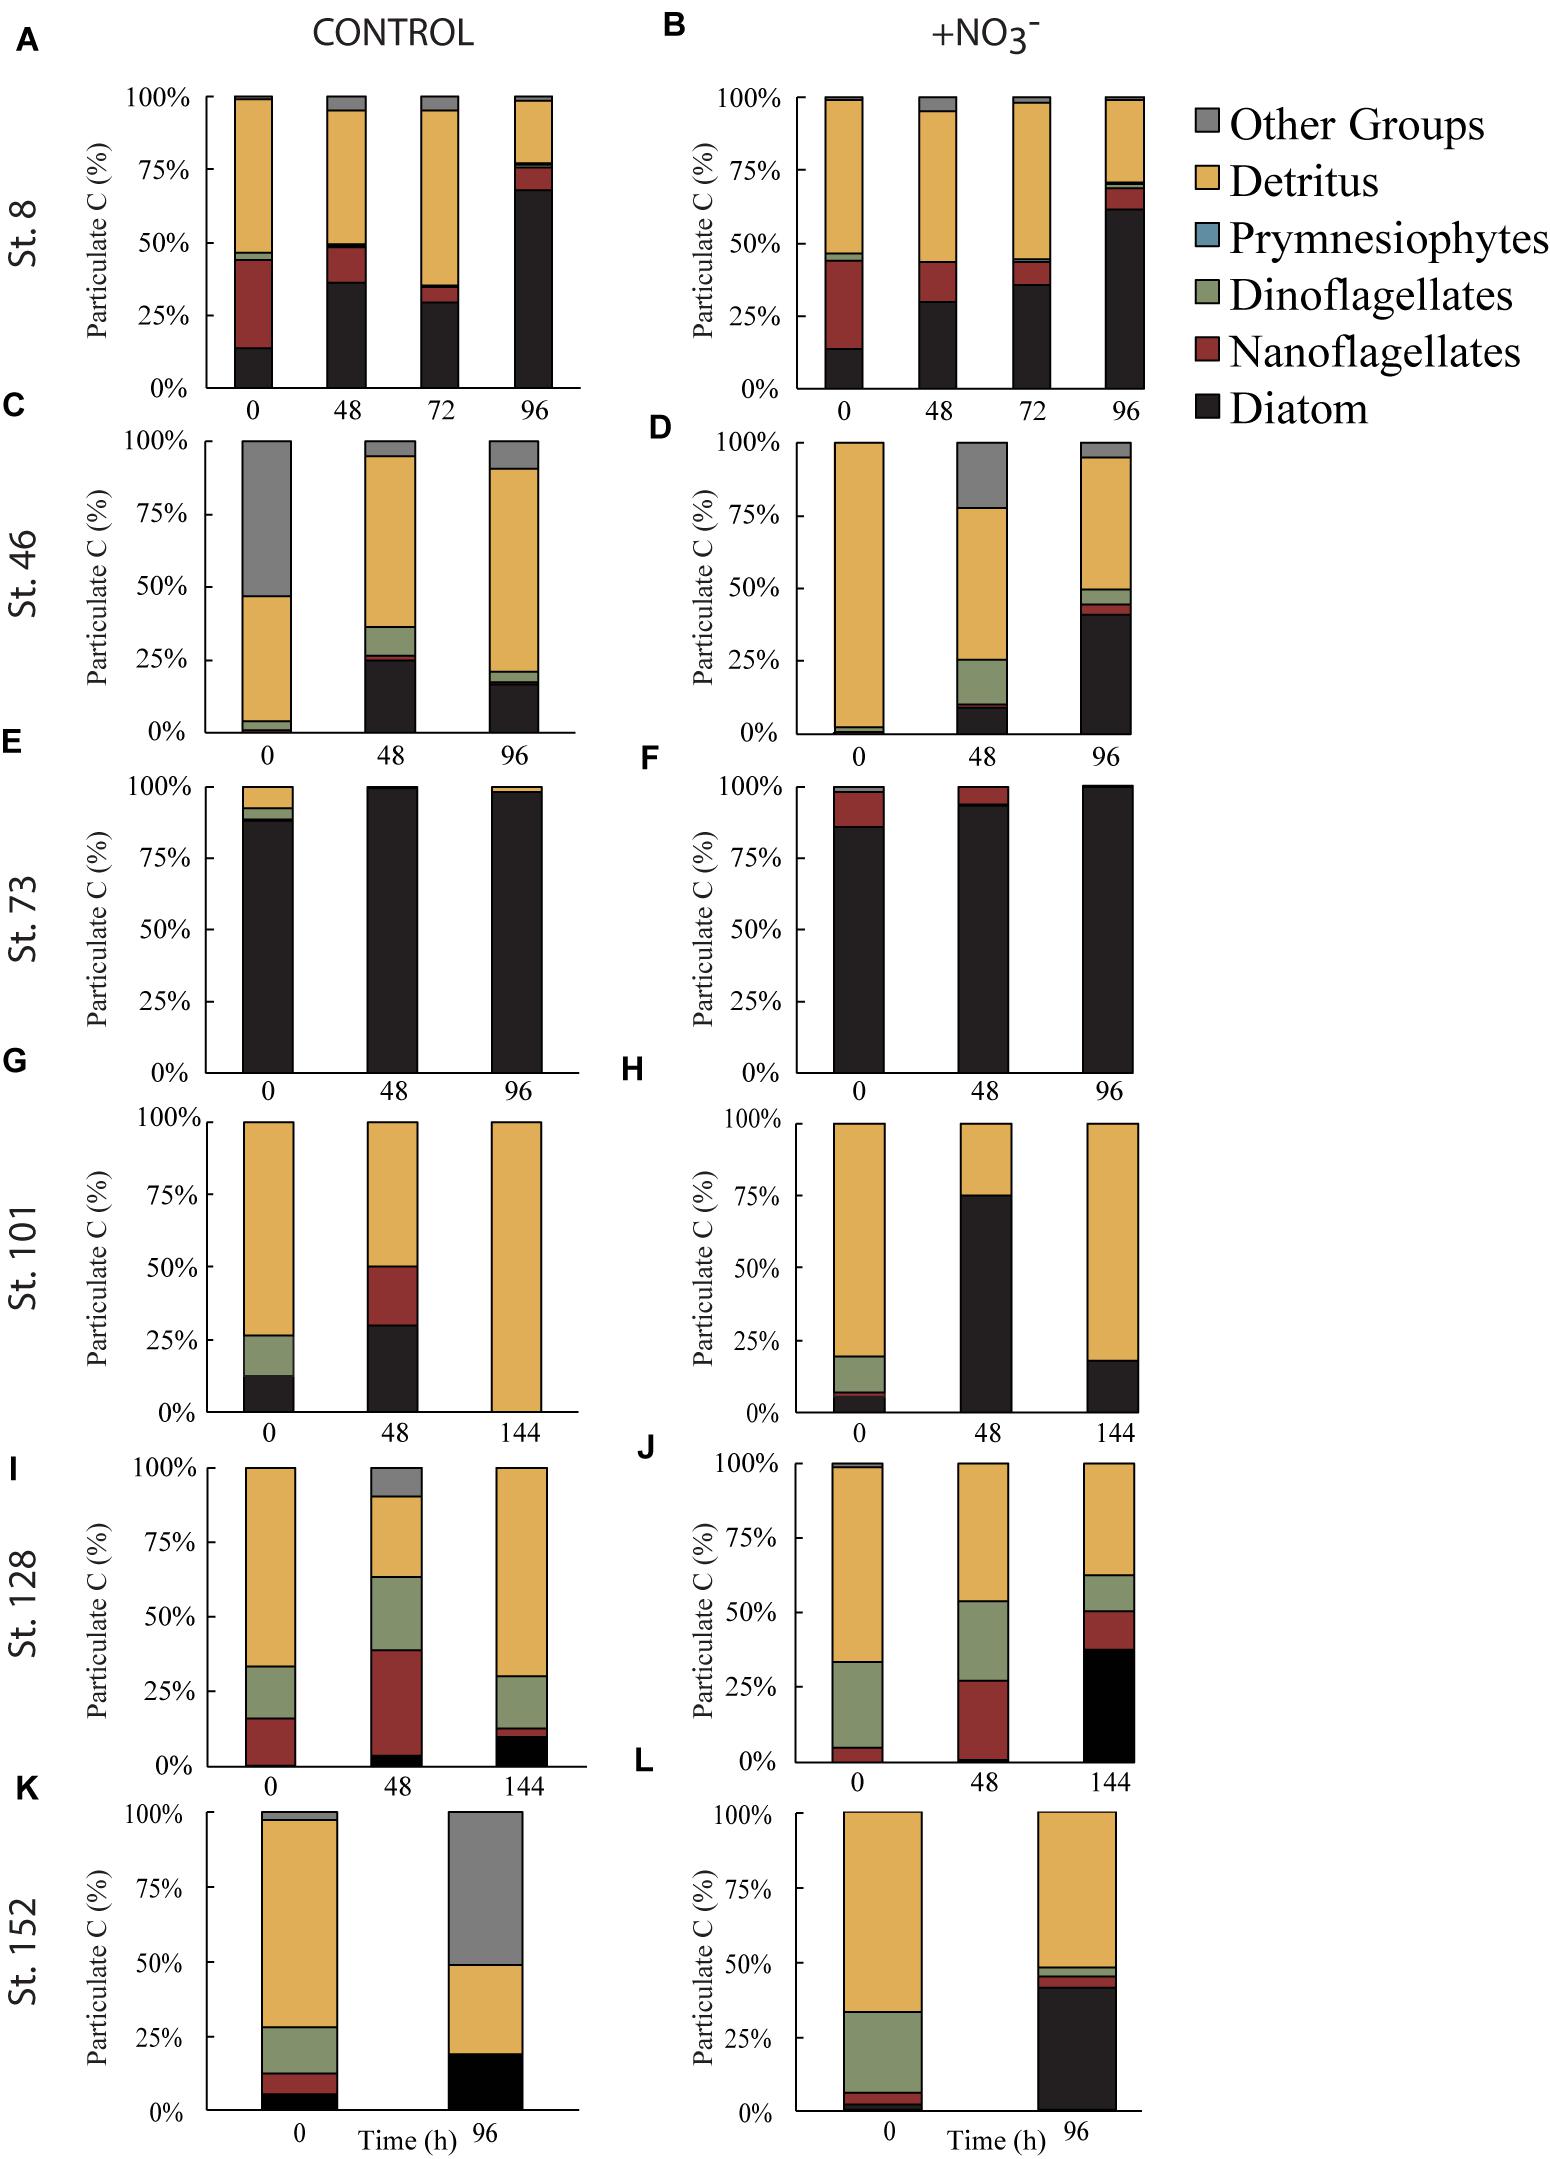
FIGURE 5. Fraction of particulate C biomass separated into algal taxonomic groups or detritus during the control (A,C,E,G,I,K) and nutrient amended (B,D,F,H,J,L) treatments. Other groups represent phytoplankton that do not fall into one of the listed categories.
Across all experiments, diatoms were the phytoplankton taxonomic group that responded most to the addition of NO3- (Figure 5). Changes in the relative abundance of diatoms ranged from 12 to 41% across all experiments, with the greatest relative increases being at the first mid-shelf site (Stn. 46, 41%), the deeply sampled off-shelf site (Stn. 128, 37%) and the coastal site (Stn. 152, 39%) (Figures 5D,I,J). Diatoms in the control also became a relatively greater fraction of the phytoplankton community at several sites, although the changes were smaller (max = 16% at Stn. 42).
Active Fluorescence Measurements
Fv:Fm was variable with respect to treatment differences between experiments (Figures 6A–F). At three sites there was a clear increase in Fv:Fm in the NO3- treated waters relative to the controls. At the second mid-shelf site (Stn. 73), the shallowly sampled off-shelf site (Stn. 101), and the coastal site (Stn. 152), Fv:Fm was 1.3-, 1.7-, and 1.1-fold higher in the +NO3- treatment than in the control at T = final (Figures 6C,D,F). At the Bering Strait site, Fv:Fm was higher at T = final relative to the initial, although the response in the control and NO3- treated waters was the same (Figure 6A). In contrast to these four sites, the +NO3- treatment had a lower Fv:Fm relative to the control at some point during the incubation (Figures 4B,E) at the first mid-shelf site (Stn. 46) and the deeply sampled off-shelf site (Stn. 128), although the control and NO3- treated waters were the same at T = final. At both these sites, Fv:Fm was depressed at T = final relative to initial values, while the reverse was true (i.e., it was stimulated) at Stns. 8, 73, 101, and 152 in the NO3- treated bottles.
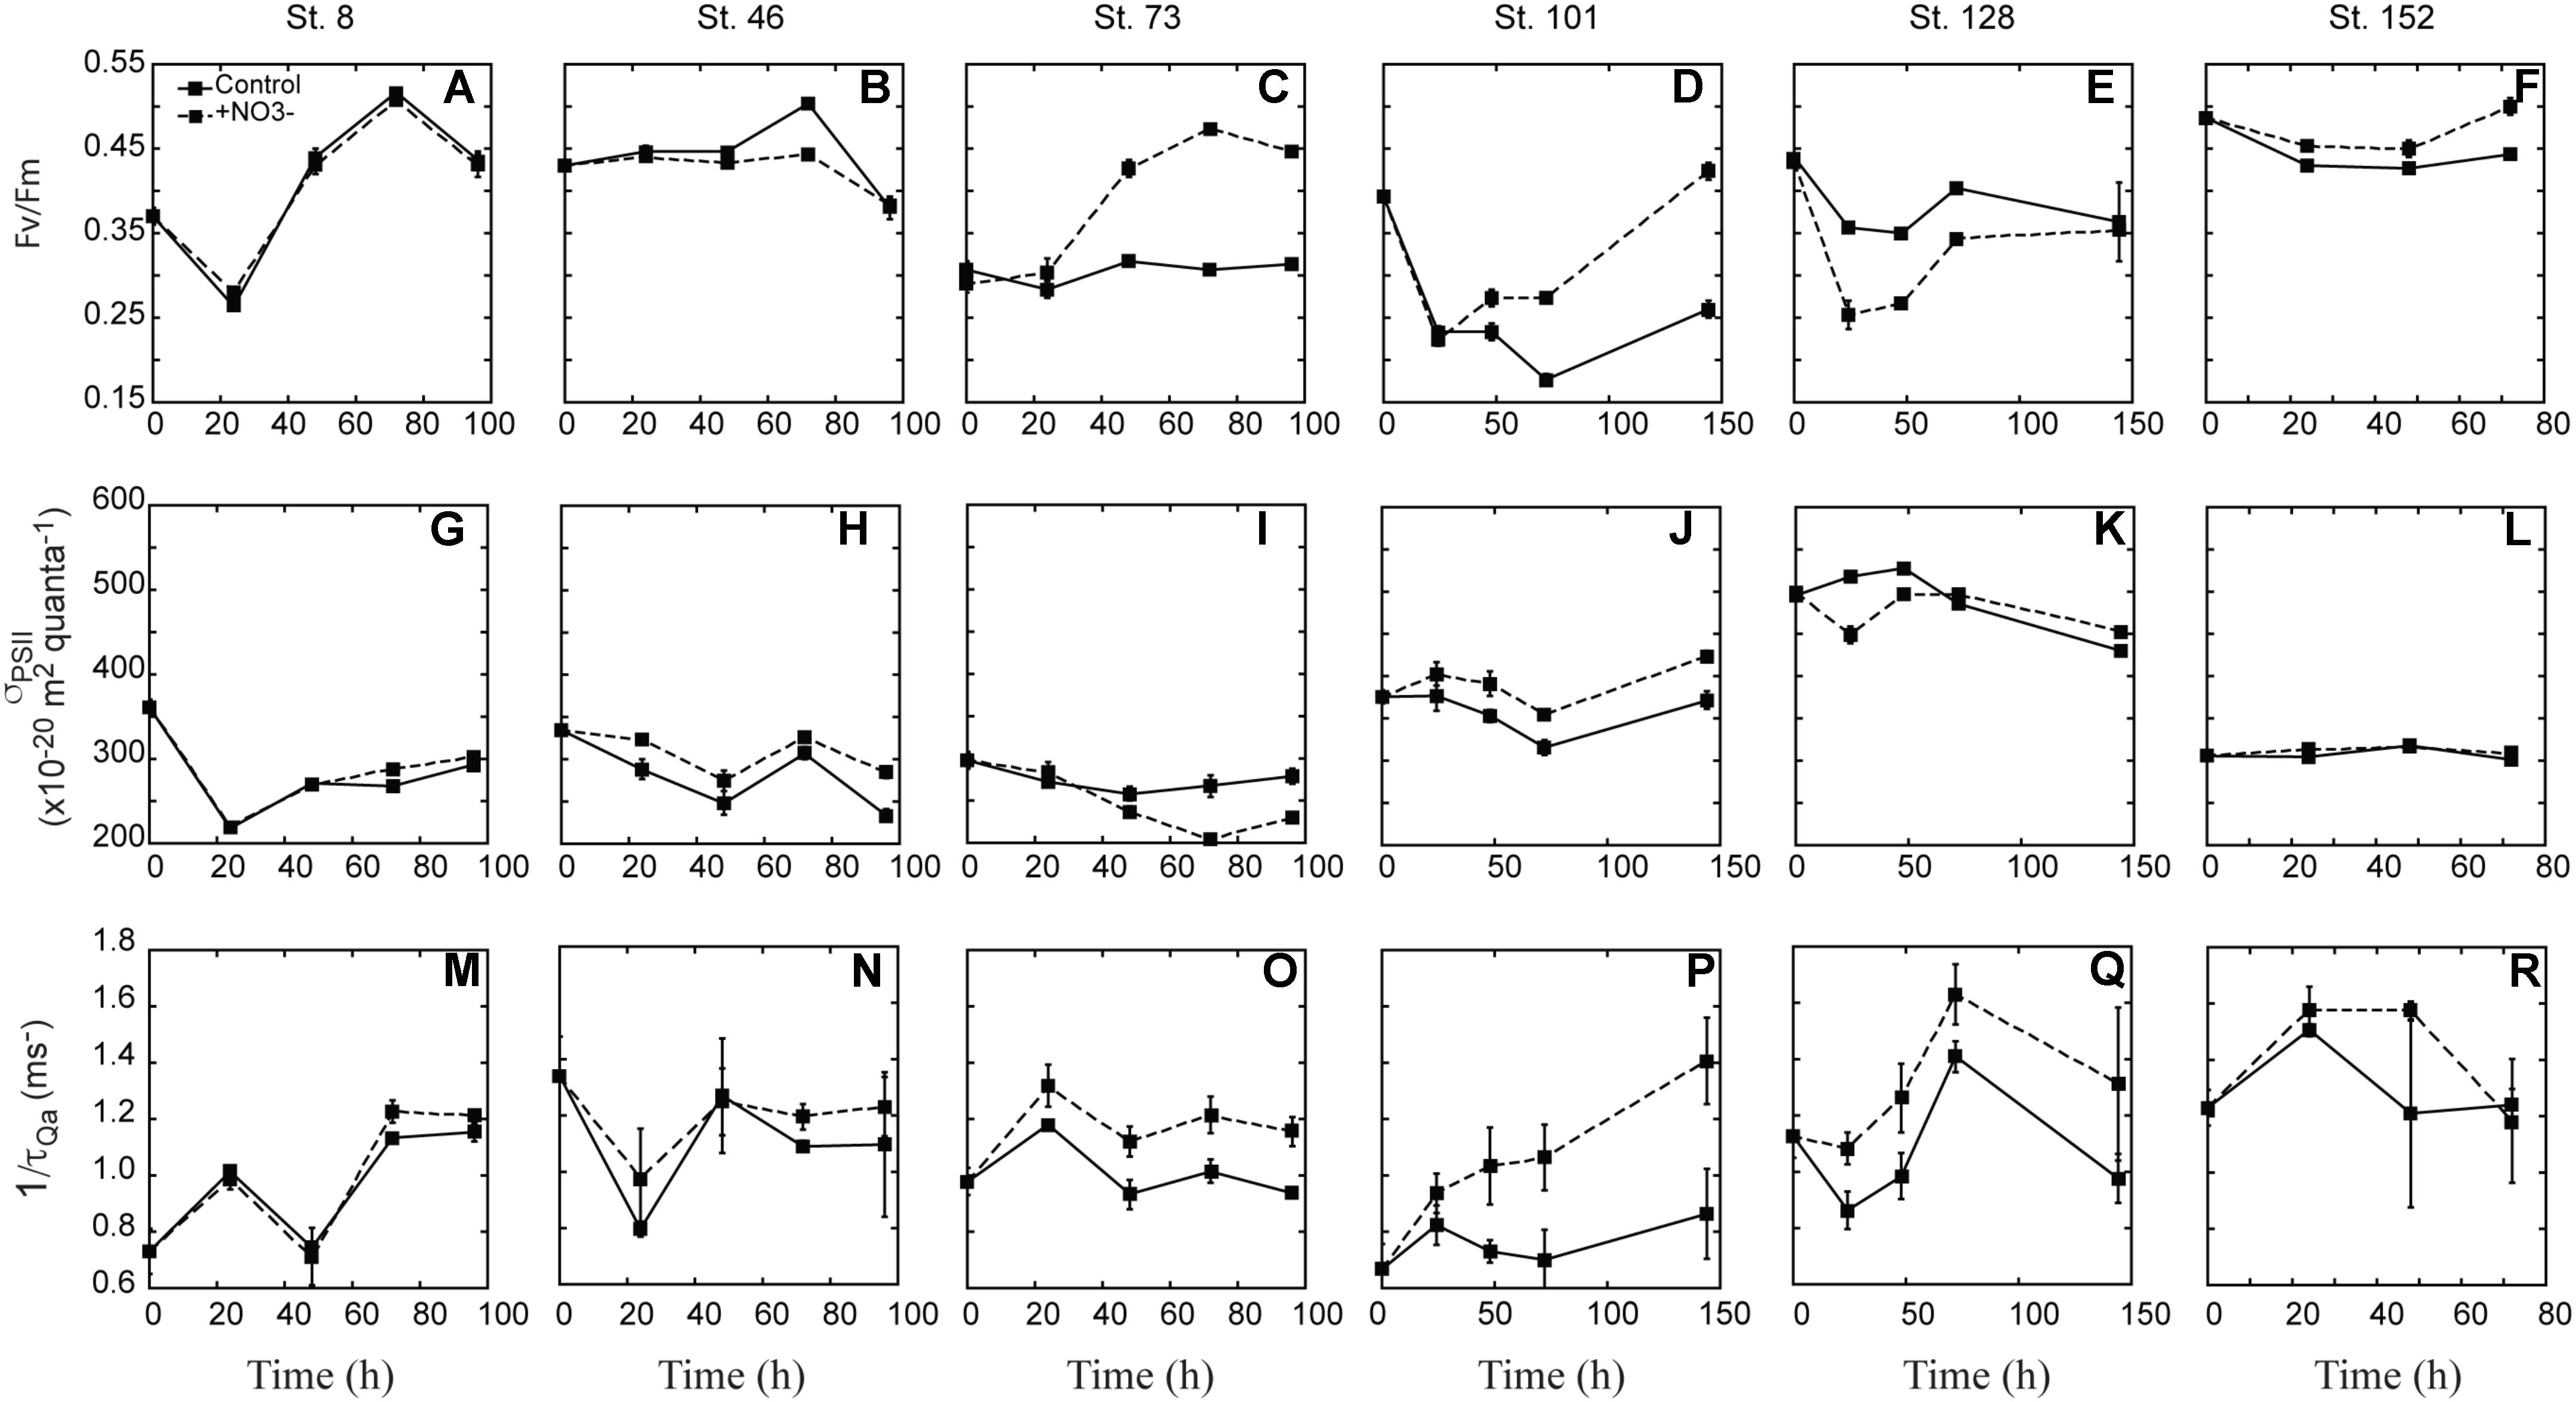
FIGURE 6. Response of FRRf parameters [Fv:Fm (A–F), σPSII (G–L), 1/τQA (M–R)] to the addition of NO3-. Shown are averages (±SD) at each time point sampled.
There was no clear trend across experiments in the response of σPSII with respect to the addition of NO3- (Figures 6G–L). σPSII decreased in both the control and treated bottles at the Bering Strait site (Stn. 8), both mid-shelf sites (Stn. 46 and 73), and the deeply sampled off-shelf site (Stn. 128). The decrease ranged from 6 to 30% of initial values, and was greater in the control than the +NO3- treatment at Stns. 46 and 128. In contrast, a greater σPSII decrease was observed in the control at Stn. 73 while no treatment difference was observed at the Bering Strait site (Stn. 8). At the shallowly sampled off-shelf site (Stn. 101), σPSII increased 10% relative to initial values whereas the control showed little difference at T = final (Figure 6J). There was little to no treatment effect in σPSII over the incubation period at the coastal site (Stn. 152) (Figure 6R).
Lastly, 1/τQa was generally higher in the +NO3- treatments relative to the control at all sites during the incubation period (Figures 6M–R), except for the coastal station (Stn. 152) (Figure 6R). The difference was greatest at the off-shelf sites where 1/τQa in the +NO3- treatment was 34 and 52% higher than the control at Stn. 101 and 128, respectively. At the two mid-shelf sites and the Bering Strait site, the +NO3- treatment increased 12–23 and 5%, respectively.
CO2 Fixation and NO3- Uptake Rates
CO2 fixation rates were stimulated 1.3–8.0-fold above the initial rates in the +NO3 treatment in all experiments, and significantly above the control treatment (2.1–14.3-fold) in all experiments except at Stn. 8 (Bering Strait) and Stn. 73 (mid-shelf station) (Figures 7A–F). The greatest increase in stimulation relative to the control was at the shallowly sampled off-shelf (Stn. 101) and coastal sites (Stn. 152) where the treated waters were ∼13–14-fold higher than the controls. NO3- stimulated CO2 fixation rates above the controls at one of the mid-shelf sites (Stn. 46) and at the deeply sampled off-shelf site (Stn. 128), although the increases were less than above, exhibiting 2.2- and 3.3-fold higher rates, respectively.
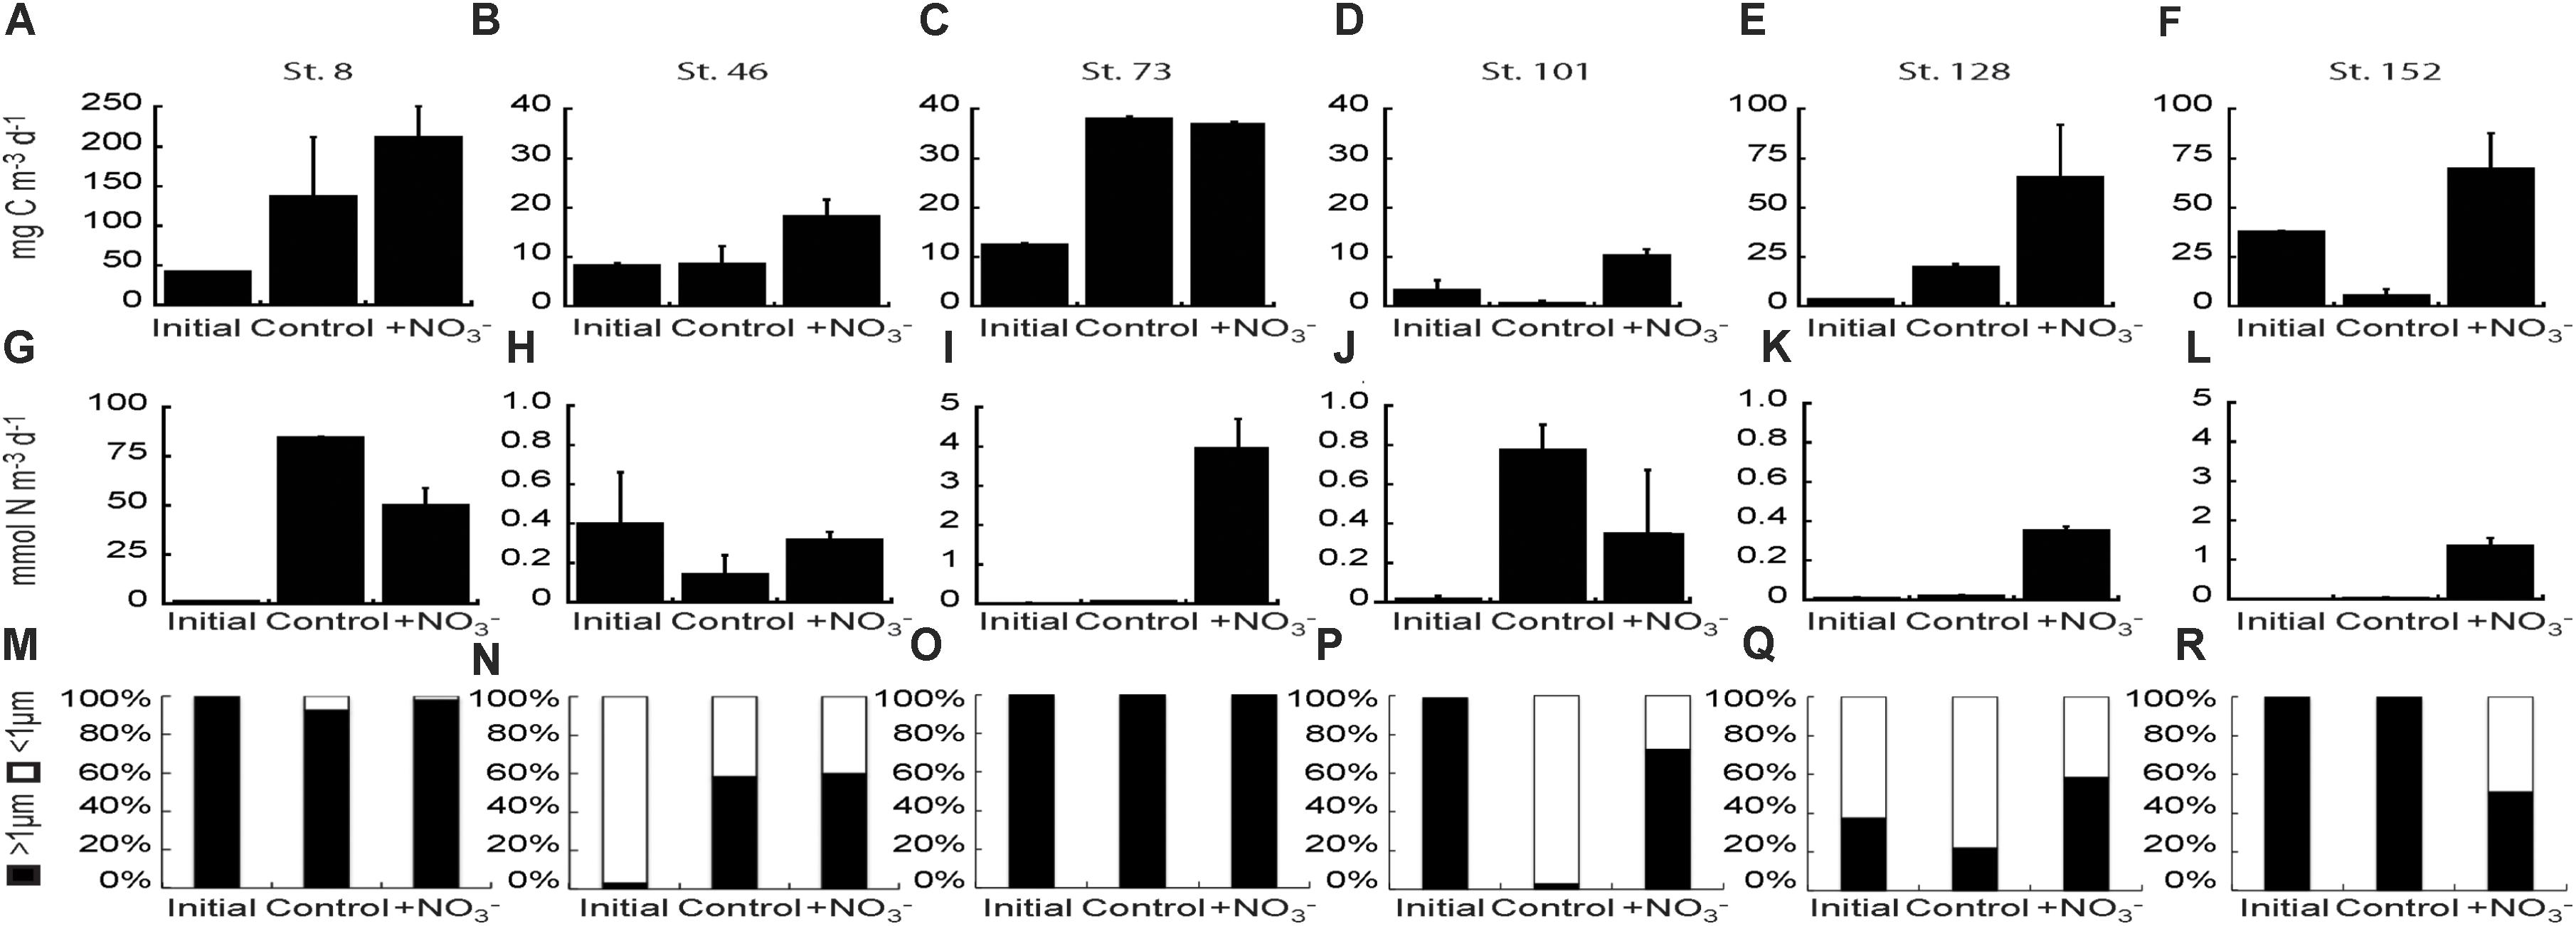
FIGURE 7. Carbon fixation rate (A–F) and NO3- uptake rates (G–L) of the bulk phytoplankton and microbial community at initial and final (Control and +NO3-) time points in the NO3- amendment experiments. Fraction of the NO3- uptake rate attributable to the <1 μm and >1 μm fractions of the community in each NO3- addition experiment (M–R).
NO3- uptake rates were stimulated relative to initial rates in the +NO3- treatments in all the experiments except at the mid-shelf station 46 (Figures 7G–L). However, the addition of NO3- stimulated uptake relative to the control at only three of those five stations (73, 128, and 152). In these experiments, NO3- uptake rates were 14–78-fold higher in the +NO3- treatment than in the controls (Figures 7I,K,L). NO3- uptake rates were usually highest in the >1 μm size fraction (Figures 7M–R), although uptake by <1 μm cells was still significant in several experiments. For example, the <1 μm sized cells accounted for ∼40–90% of NO3- uptake at the mid-shelf Stn. 46 (Figure 7N). Additionally, at the shallow off-shelf site (Stn. 101), the <1 μm sized cells accounted for >90% of measured NO3- uptake rates in the control treatment, but only 25% in the +NO3- treatment (Figure 7P). The reverse was true at the coastal site (Stn. 152) where NO3- uptake in the <1 μm size fraction was undetectable in the control but accounted for ∼50% of the measured rate in the +NO3- treatment (Figure 7R).
Heterotrophic Prokaryote Abundance and Production
There was little treatment difference with respect to abundance of heterotrophic prokaryotes across all experiments (Figures 8A–F). Only the two mid-shelf sites (Stn. 46 and 73) showed a higher abundance (∼12 and 26%, respectively) of heterotrophic prokaryotes where NO3- was added (Figures 8B,C). Despite changes in heterotrophic prokaryote production during the experiments, within treatment variability was high and virtually no treatment differences were detected (Figures 8G–L). Only at the shallowly sampled off-shelf site (Stn. 101) was a treatment difference in heterotrophic prokaryote production rate detected, with the +NO3- treatment having a 4.8-fold higher rate than the control at T = final (Figure 8J). Finally, while changes in the percent of the heterotrophic prokaryote community composed of HNA-containing cells changed in the different experiments (e.g., increased 20–50% in 4 of the 6 experiments), no effect of the added NO3- was detected (Figures 8M–R).
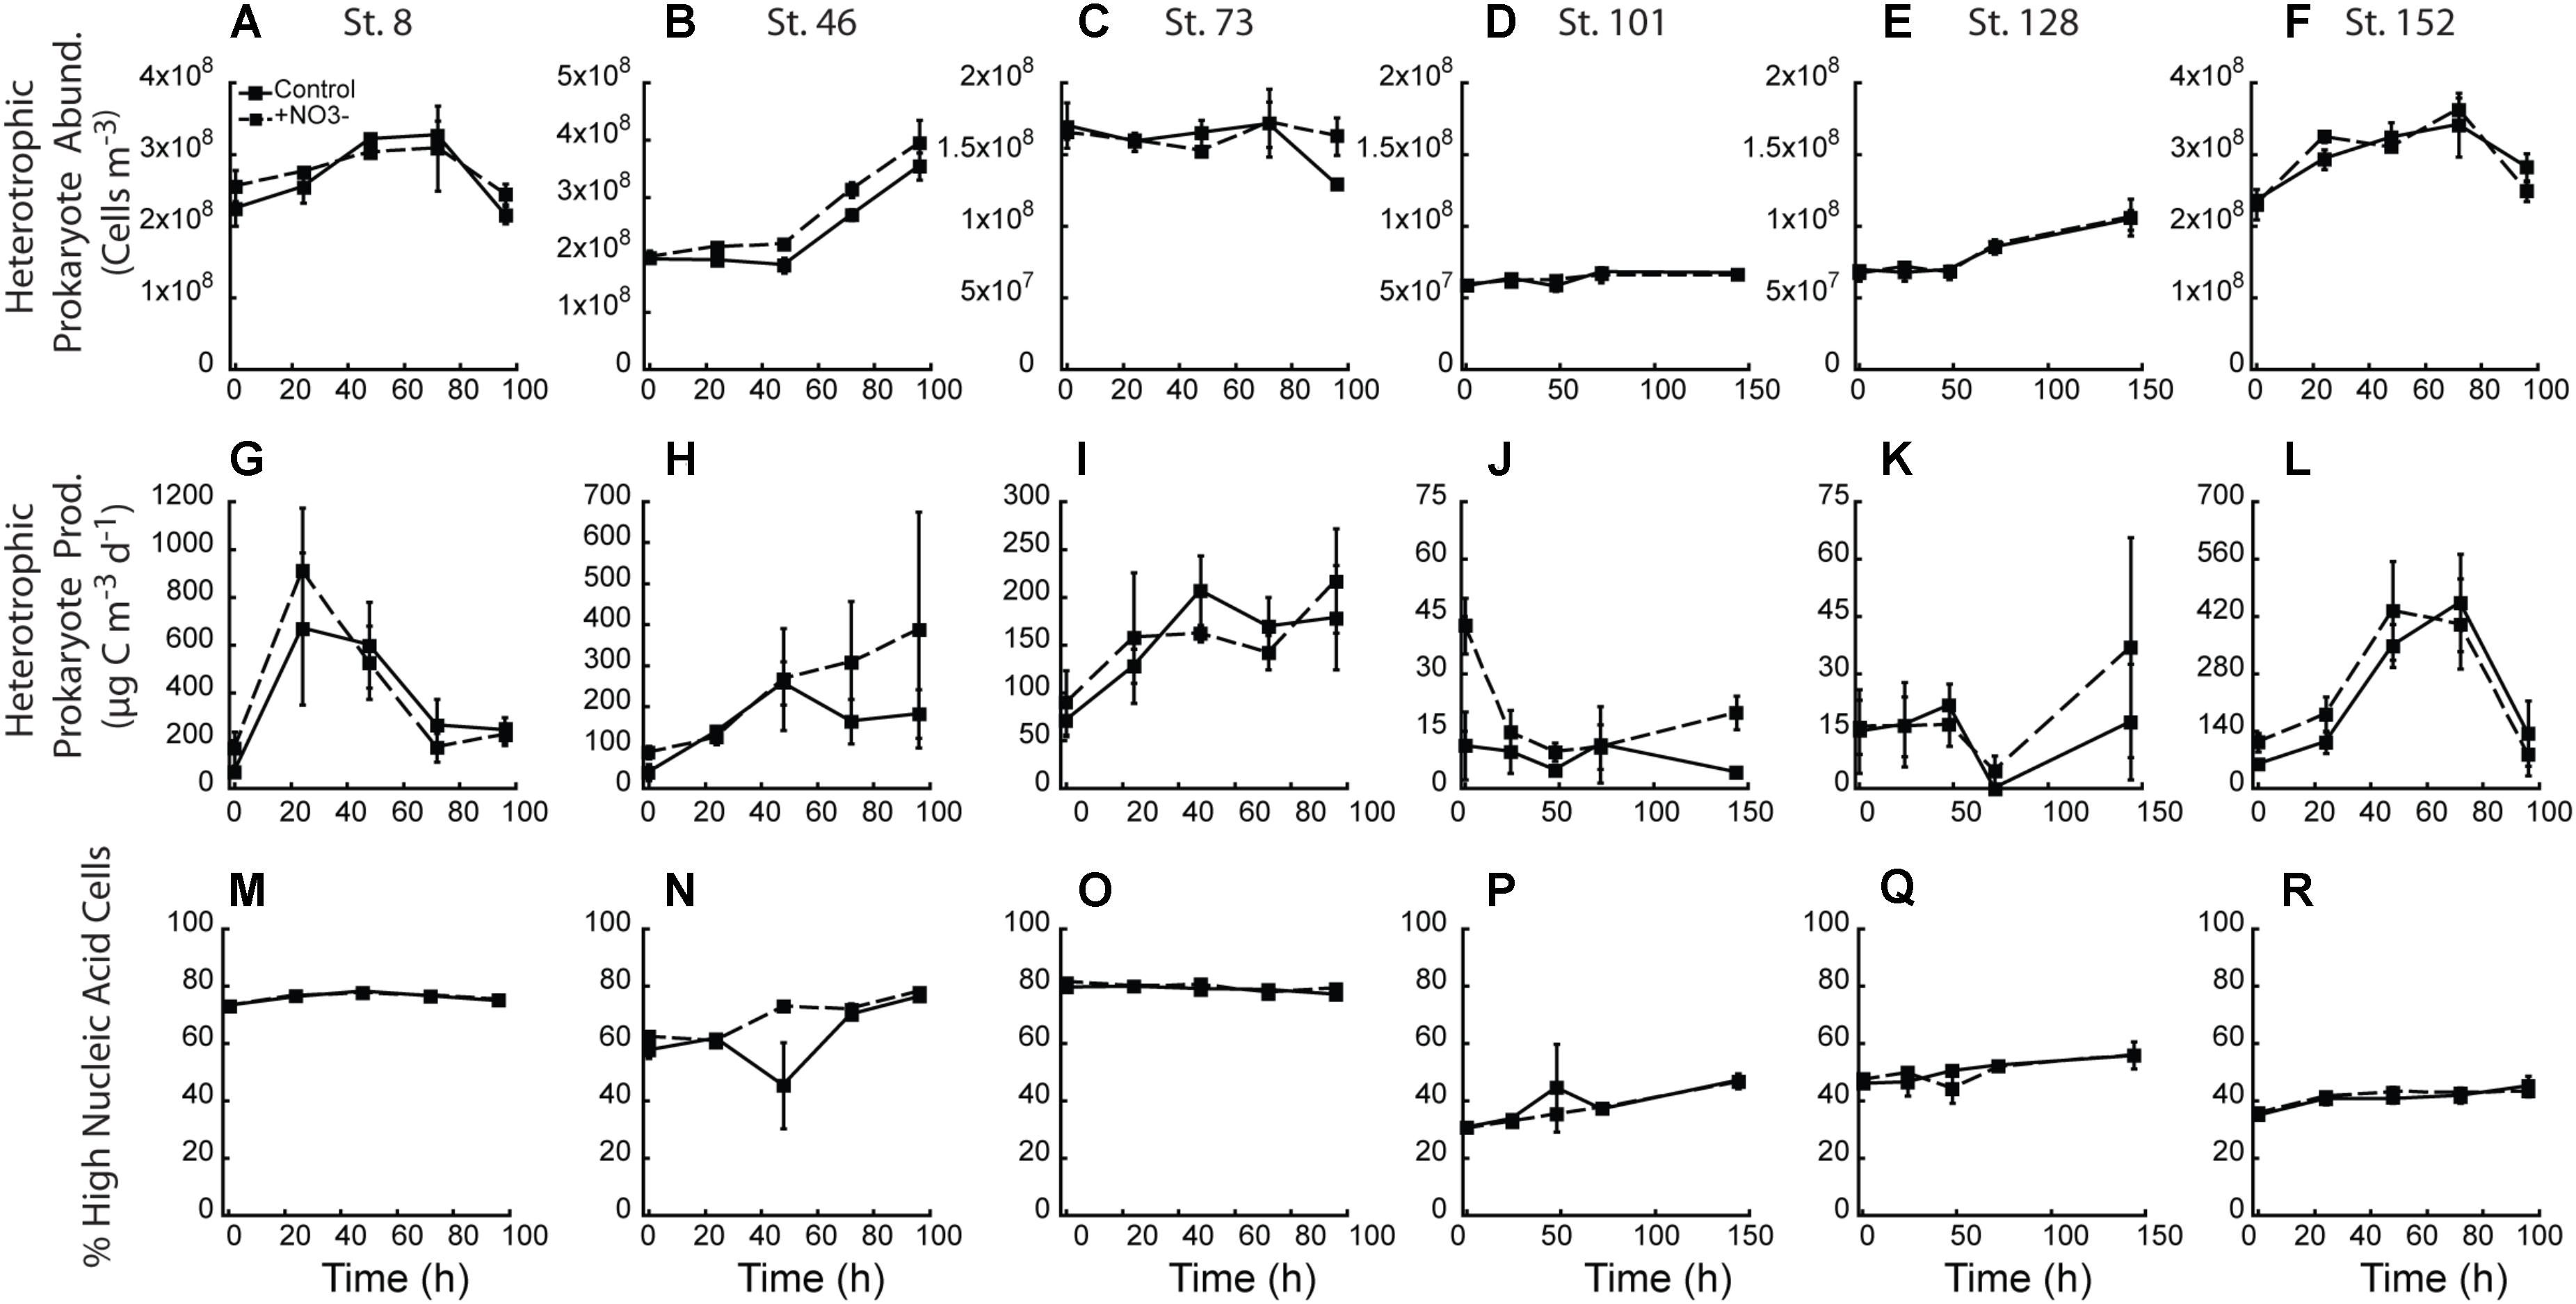
FIGURE 8. Heterotrophic prokaryotic abundance (A–F), heterotrophic prokaryotic production (G–L), and percent of heterotrophic prokaryotic abundance comprised by high nucleic acid (HNA) cells (M–R) in the NO3- addition experiments.
Summary
The relative responses of different variables in the treatments compared to the controls can be used to determine how similarly the different experiments responded to the +NO3- additions (Figure 9). For example, across all experiments, consumption of PO43- was greater in the NO3- treatment than in the control by the final time point. The same was not true for Si(OH)4, where only three of the experiments (Stns. 73, 128, and 152) responded to the NO3- addition with increased Si(OH)4 consumption. Likewise, total POC concentrations increased in the treated waters, relative to the controls, at all sites except the Bering Strait site (Stn. 8). Overall, the cumulative response to NO3- additions was similar between Stns. 73 and 152. These two stations showed relatively greater nutrient consumption, phytoplankton biomass, particulate nutrient concentrations, and NO3- uptake rates in the treated waters than in the control. Of the remaining stations, which clustered together despite some differences, the response to NO3- was most similar between Stn. 46 and 128. Both had relatively similar responses in POC and PON concentrations, CO2 fixation, NO3- uptake, heterotrophic prokaryote production rates, and 1/τQA Stn. 8 was the next most similar to these stations, while the response at Stn. 101 was the most different from any of the stations in this second cluster. Despite the differences between the stations, the overall biological response across all experiments suggested that NO3- resulted in greater consumption of PO43- and increases in phytoplankton cell abundance (<10 μm), POC and PON, CO2 fixation, NO3- uptake, and Fv/Fm, but a decrease in 1/τQA.
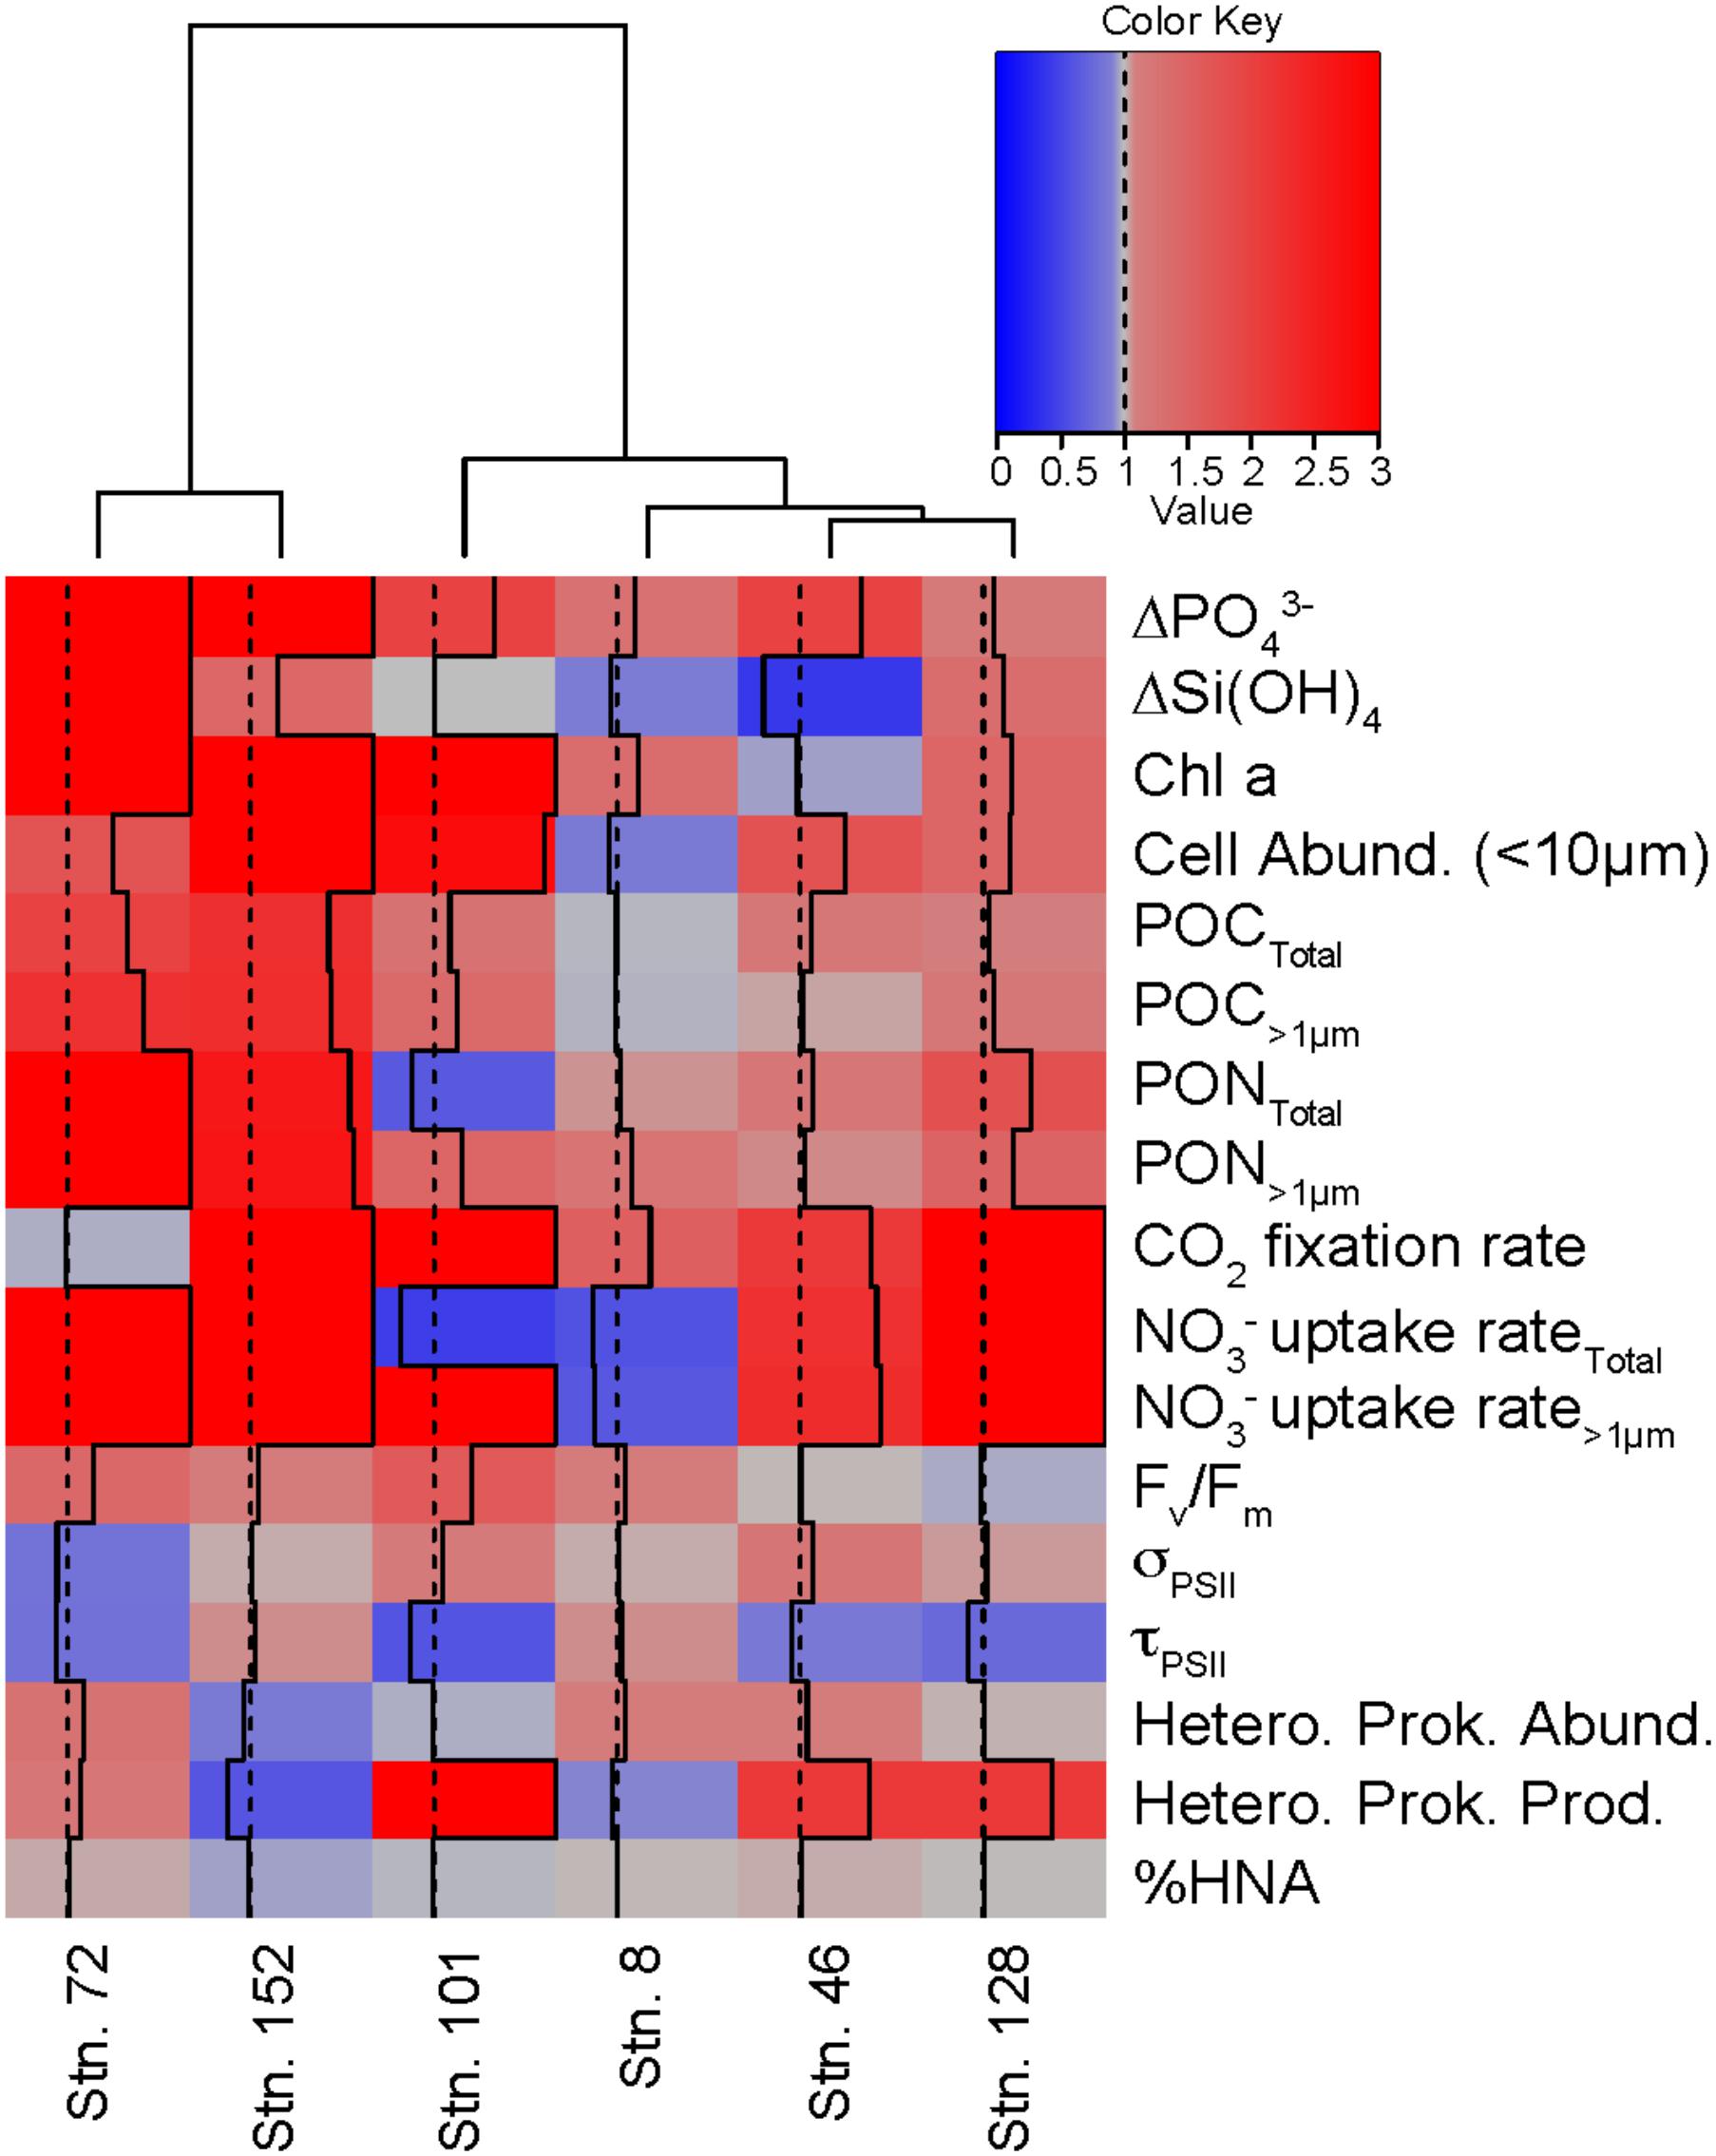
FIGURE 9. Comparison of different experiments showing the relative response (+NO3-: Control) for multiple variables in each experiment. Dotted line indicates value of 1 while solid line indicates the value of the responses. Values ≥ 3 are indicated by solid line on the right edge of the box. Hierarchical clustering using Ward’s minimum variance method was used to group experiments with similar relative responses.
Discussion
Phytoplankton Response to Added NO3-
Our a priori hypothesis was that N availability was the primary factor limiting phytoplankton productivity in the Chukchi Sea during the summertime. Apart from the Bering Strait, the surface waters of the Chukchi Sea were depleted of DIN, and thus were consistent with this hypothesis. The three sites on the shelf (Stns. 46, 73, and 152) all had undetectable surface concentrations of NO3- and NO2-, while NH4+ was detectable only at Stn. 46. Additionally, while NO3- was barely detectable at the shallowly sampled off-shelf site (Stn. 101), both NO2- and NH4+ were also depleted. On the other hand, Stn. 128, which was sampled deeper, did have some available NO3- and NO2-. In contrast to DIN, PO43- and Si(OH)4 were detectable at all sites on and off the shelf.
The biological responses from the three shelf sites, and both off-shelf sites, suggested that the phytoplankton community was N-limited. Concentrations of Chl a, POC, PON, and the proportion of phytoplankton <10 μm increased more in the NO3--treated samples than in the controls. Likewise, CO2 fixation and NO3- uptake rates were higher in the NO3--amended treatment at four of the six stations (not Stns. 8 and 46), especially where surface N was fully depleted. Across multiple experiments, diatom abundance increased in response to this NO3- addition. However, the expected coincident decrease in Si(OH)4 concentrations due to this diatom growth was not always observed. Finally, while both the Fv/Fm and σPSII responses were variable, with only three of the six stations showing a similar response to NO3- (i.e., an increase), 1/τQA was consistently higher in the +NO3--treatment than in the control (discussed below). Together, these biological responses can be interpreted as direct confirmation of proximal N-limitation of the summertime Chukchi Sea phytoplankton community.
Previous work supports N-limited phytoplankton productivity in Arctic waters, with several studies indicating that N is the first nutrient depleted during the spring bloom. Tremblay and Gagnon (2009) reviewed multiple studies and found that the magnitude of the N inventory at the start of the phytoplankton growing season was the primary predictor of water column primary productivity, more so than light or temperature. They noted a positive relationship between phytoplankton productivity and depth and open water duration, suggesting that deeper waters have a larger reservoir of available N that can be mixed upward during storms and/or upwelling periods. The longer ice-free periods allow for a greater likelihood of mixing of nutrients into surface waters, and thus productivity in these waters is sustained by the vertical nutrient fluxes. Tremblay and Gagnon (2009) concluded that only external N inputs, such as river runoff rich in DON or atmospheric deposition, can increase phytoplankton productivity of shallow seas, like the Chukchi Sea, beyond what the start of the season N inventory provides.
Likewise, Yun et al. (2016) related primary production of the Chukchi Sea to nutrient availability. However, they indicated that increased freshwater content results in a decreased NO3- inventory, and consequently, decreased rates of primary production. In fact, they note a decreasing trend in primary production rates in the Chukchi Sea between 1974 and 2012, and suggest that this is the result of a 30–50% decrease in the Chukchi Sea nutrient inventory and associated 40% decrease in depth-integrated Chl a concentration associated with the noted increase of freshwater to the Chukchi Sea (Serreze et al., 2006). Data from the ICESCAPE campaign do not support the conclusion of Yun et al. (2016) that primary productivity is decreasing in the Chukchi Sea. Lewis et al. (2018) show that productivity during our study period averaged 2.5 ± 4.6 g C m-2 d-1 over 39 stations in the Chukchi Sea, which was greater than in any of the studies cited by Yun et al. (2016). In fact, the highest numbers they cite (Hameedi, 1978) were collected in July, the same month as the ICESCAPE campaign. Generally, primary productivity is relatively high in June/July and decreases as nutrients are consumed during the summer season, such that by August/September nutrients are consumed and productivity is low. Satellite ocean color data confirm this seasonal cycle between July and September (Pabi et al., 2008). The multi-decadal decreasing trend noted by Yun et al. (2016) likely reflects the expected annual cycle of productivity and nutrient consumption over the shelf captured during field campaigns conducted over multiple years, with each sampling progressively later in the seasonal cycle. The Yun et al. (2016) conclusions directly contrast the continued increase of Chukchi Sea open water annual net primary production rates estimated by Arrigo and van Dijken (2015) using ocean color satellites, which was linked to greater open water areas and longer open water duration. If the greater open water area is associated with deeper regions of the shelf, the longer open water duration may provide greater opportunity for storms to result in mixing of deeper nutrient reservoirs that increase areal phytoplankton productivity rates (Pabi et al., 2008).
Additional evidence from the ICESCAPE field campaign supports the importance of N as the primary driver of phytoplankton productivity on the Chukchi Shelf during the summer. Enhanced phytoplankton biomass in the Chukchi Sea during both 2010 and 2011 was usually associated with WW (Lowry et al., 2015), defined as water with a potential temperature of ≤-1.6°C, but also containing high nutrient concentrations (Pickart et al., 2016). For example, during ICESCAPE, NO3- concentrations on the Chukchi Shelf were ∼11 times higher in WW than non-WW (Lowry et al., 2015). In regions on the shelf with WW, mean Chl a concentrations were approximately threefold higher and POC concentrations were typically 30% higher than regions not containing WW. Both P and Si are also available at higher concentrations in WW than non-WW, although the non-WW concentrations of these two elements are still relatively high compared to NO3-, which is undetectable in most places on the shelf during our sampling period (June–July). The co-location of elevated phytoplankton biomass and the main WW advective pathways during mid-June and July is further evidence that nutrients, especially N, control summertime phytoplankton productivity in the Chukchi Sea.
Winter Water Stations
During the present study, we sampled only two stations that had WW bottom layers (Figure 1). At Stn. 46, WW was present only in the bottom 3 m of the 46 m water column while the surface water (6 m) had T-S characteristics similar to the ACC (Figure 1). In contrast, at Stn. 73, the WW layer was 20 m thick (bottom depth 39 m) and was separated from the experimental sampling depth (3 m) by 16 m. The mixed layer at Stn. 46 was slightly shallower (MLD = 12 m) than at Stn. 73 (MLD = 14 m), and the greater thickness of the WW bottom layer at Stn. 73 meant that the distance between the base of the mixed layer and the nutrient-rich WW was less at Stn. 73 than at Stn. 46, indicating that nutrients were more easily accessible.
These two sites exhibited significantly different responses to the addition of NO3-. While the concentration of phytoplankton <10 μm and the 14CO2-fixation rates were all higher in the +NO3- treatment than in the controls at Stn. 46, the Chl a concentration, PO43- and Si(OH)4 consumption, and NO3- uptake rates all showed no stimulatory response. At Stn. 73, which had the greater volume of nutrient rich WW below the surface layer, greater biomass changes, CO2-fixation and NO3- uptake rates were observed in the NO3- treatment relative to the control and initials. Likewise, NO3- uptake was dominated by the >1 μm size fraction, and the active fluorescence parameters all responded to the NO3- addition (Fv/Fm increased, σPSII decreased, and 1/τQA increased). The different responses between the two WW stations indicate that the phytoplankton community at Stn. 73 was primed and ready to use NO3- when it became available. We estimate that the diffusive flux of NO3- between the bottom of the mixed layer and the top of the WW to be ∼2.5-fold greater at St. 73 (0.7–4.8 μmol m-2 d-1) than at St. 46 (0.3–1.9 μmol m-2 d-1). Likewise, while PO43- concentrations were similar at both sites, Si(OH)4 was lower at Stn. 46 (1.3 mmol m-3) than at Stn. 73 (12.2 ± 0.12 mmol m-3). Combined, the higher subsurface WW reservoir of NO3- and ambient Si(OH)4 concentrations at Stn. 73 suggest that a background population of diatoms was present and ready to grow once NO3-, the primary limiting nutrient, became available.
The composition of the initial phytoplankton communities at these two shelf sites is consistent with this hypothesis. Analysis using an IFCB determined that phytoplankton C biomass at Stn. 46 was dominated by unclassified dinoflagellates while at Stn. 73, the initial C biomass was dominated by the diatoms Chaetoceros sp. and Thalassiosira sp. (Figures 4E,F). It seems that while N was the element limiting the productivity of the phytoplankton across the Chukchi shelf, community composition at these two sites was controlled by the presence of available Si.
Coastal vs. Off-Shelf Sites
N-limitation was also evident at the coastal shelf site in the nutrient depleted ACC (Stn. 152), as well as at the shallowly sampled off-shelf site (Stn. 101). While these two sites had similar initial nutrient concentrations, the physical environments were very different (Table 1 and Figure 1). Stn 101 was ice covered (86%) and had less available light, had a sea surface temperature of -1.03°C, and a salinity of 28.6. In contrast, the ACC site had no sea ice cover, more light at the sampling depth, and was relatively warm (7°C) and more saline (31.2). Despite these differences, the responses to nutrient additions were remarkably similar. Both sites responded to +NO3- with increases in Chl a concentration, phytoplankton cell abundance, CO2-fixation rate, POC concentration, and in the case of the ACC station, higher PON concentration. Additionally, Fv:Fm, σPSII (at Stn. 101), and 1/τQA were all higher in the +NO3- treatment relative to the control. Likewise, both experiments initially had significant numbers of unidentified dinoflagellates and phytoplankton <10 μm increased 6–11-fold.
However, Stn. 101 was located on the edge of the Beaufort Gyre, which is considered permanently oligotrophic due to the accumulation of freshwater associated with sea ice melt and freshwater inputs at the coast, and is thus more stratified (McLaughlin and Carmack, 2010). In contrast, Stn. 152 was located in the ACC, which develops seasonally as warm nutrient-depleted water travels northward along the coast of Alaska from the Bering Strait. The similar bulk biological and biogeochemical responses between these two physically and chemically (in the case of salinity) different sites (Figure 1B and Table 1) supports the role of N availability ultimately controlling the growth and productivity of phytoplankton in the Chukchi Sea during our study period.
The data from these two sites suggest that during the summer in the Chukchi Sea, the low nutrient availability results in a phytoplankton community that is numerically dominated by small, occasionally non-diatom cells (<10 μm), consistent with the finding of Neukermans et al. (2016). However, if NO3- concentrations increase, diatoms can become dominant when Si(OH)4 is available. Li et al. (2009) suggested that increased freshwater input to the Arctic is resulting in greater stratification and lower nutrient availability and that the abundance of smaller phytoplankton is increasing (i.e., phytoplankton communities are shifting toward smaller cells). Our data support a shift toward smaller cells at lower nutrient availability whether stratification increases or not.
Heterotrophic Prokaryote Response to Added NO3-
In contrast to the phytoplankton communities, the heterotrophic prokaryote community showed only limited evidence of N limitation. While some treatment differences were noted (e.g., higher BA and BP in the NO3- treatment relative to the control at Stns. 73 and 101, respectively), these differences were small. Evidence of N limitation within heterotrophic prokaryote communities in the Arctic is scarce. Ortega-Retuerta et al. (2012) reported that the heterotrophic prokaryotic communities in the Chukchi Sea were either N or N/C co-limited during the summers of 2009 and 2010, the latter year as part of the 2010 ICESCAPE expedition. The majority of studies in the Arctic have identified C as the primary factor limiting heterotrophic prokaryotes (Middelboe and Lundsgaard, 2003; Meon and Amon, 2004; Kirchman et al., 2005; Vallieres et al., 2008; Cuevas et al., 2011). Our study was conducted in the same region as some of those in Ortega-Retuerta et al. (2012) and used the similar methods for measuring BA and BP, yet we saw little evidence of heterotrophic prokaryote N limitation. One difference was that in the present study, the samples were pre-screened using 100 μm mesh to remove large grazers, while in Ortega-Retuerta et al. (2012), a 25 μm mesh was used to remove both macro- and micrograzers. Thus, the lack of N limitation in the heterotrophic prokaryote community we saw could be the result of micrograzers 25–100 μm being present in our incubations. Additionally, while we amended the DIN deplete seawater with NO3-, Ortega-Retuerta et al. (2012) used an equal mixture of NH4+ + NO3-, but not NO3- alone. Allen et al. (2005) noted that while some heterotrophic prokaryotes contain assimilatory NO3- reductase genes, others do not. We did measure some increases in the 0.2–1 μm particulate organic pool and NO3- uptake rates in the amended treatments, suggesting that the prokaryotes in our incubations did use NO3-. However, the increases were small and perhaps only a portion of the prokaryote community was able to use NO3- for growth (the vast majority of the prokaryote community can assimilate NH4+ or DON). Finally, their experiments were conducted in the dark over 48 h while ours were conducted at 50% of incident irradiance, suggesting that when phytoplankton are present and active, they outcompete prokaryotes for NO3-. Thus, differences in light environments, grazing pressure, and/or available N substrates likely account for the observed differences between the present study and Ortega-Retuerta et al. (2012).
Active Fluorescence
Nutrient limited phytoplankton show signs of nutrient stress or nutrient starvation (Moore et al., 2013). Nutrient stressed phytoplankton show a physiological response to a nutrient shortage, but may effectively acclimate to their low nutrient environment (Cullen et al., 1992; Parkhill et al., 2001) and still maintain balanced nutrient limited growth. In this case, the cellular concentrations of compounds requiring the limiting nutrient decrease while the cellular concentrations of the compounds not requiring the limiting nutrient are adjusted until production of all cellular constituents has the same nutrient-limited rate averaged over the photocycle. In contrast, when nutrient starved, phytoplankton are deficient in a specific nutrient (or nutrients in the case of co-limitation) and thus stoichiometrically lack one element (e.g., N) relative to another (e.g., P). Under starved conditions (Moore et al., 2013) cells can no longer maintain balanced growth because cellular constituents are manufactured at variable rates relative to one another averaged over the photocycle. The cells will exhibit significant changes in active fluorescence/growth upon nutrient amendments (Cleveland and Perry, 1987; Kolber et al., 1988).
The dynamics of processing photons through photosystem II has been used as a diagnostic marker to distinguish between phytoplankton nutrient stress and starvation. Parkhill et al. (2001) showed that Fv:Fm of the diatom Thalassiosira pseudonana was insensitive to nutrient stress when grown at different steady state (balanced) growth rates and under different irradiances and inferred that the cells were stressed by, but had acclimated to, the low nutrient concentrations. Similarly, a lack of Fv:Fm sensitivity to N-limitation was seen in cyanobacteria-dominated North Atlantic waters that were amended with inorganic N (Moore et al., 2008), suggesting that these populations were stressed, but in balanced growth and acclimated or adapted to the oligotrophic environment. Suggett et al. (2009) noted that Fv:Fm and σPSII typically remain constant when phytoplankton grow logarithmically, further evidence that fluorescence parameters are insensitive to nutrients under balanced growth. Once a nutrient eventually becomes deficient, a decrease in Fv:Fm and an increase in σPSII is regularly observed, a sign that cells are starved and that growth is becoming unbalanced.
In the present study, NO3--driven changes in photophysiology were detected using active fluorescence, but the changes were not the same across all sites. There were clear increases in Fv:Fm at Stns. 73, 101, and 152, which were consistent with the significant increases in phytoplankton biomass in the NO3- treatment at these stations. The increase in Fv:Fm upon N addition is consistent with N-starved lab cultures of the diatom Phaeodactylum tricornutum (Geider et al., 1993), but not consistent with previous field studies which concluded that phytoplankton that are acclimated to oligotrophic environments are potentially nutrient-stressed, but not starved (Behrenfeld et al., 2006; Moore et al., 2006). One suggestion for a lowered Fv:Fm under N limitation is that cells allocate less N toward photosynthetic enzymes (Yentsch and Vaccaro, 1958; Shimura and Fujita, 1975; Kolber et al., 1988; Falkowski et al., 1989; Plumley and Schmidt, 1989). N is an important component of photosystem proteins and low concentrations have been connected to lower concentrations of the photosynthetic reaction center D1 protein (Kolber et al., 1988). Likewise, a recent proteomic study found that multiple proteins involved in chlorophyll synthesis were significantly lower in abundance when the diatom T. pseudonana became N-limited (Hockin et al., 2012). Transcript levels for T. pseudonana genes encoding chlorophyll biosynthesis were also decreased under N limitation (Mock et al., 2008). The lower Fv:Fm observed here in the control relative to the NO3- treatments supports the idea that the summertime phytoplankton community in the Chukchi Sea is N-starved and likely not in balanced growth.
In addition to a higher Fv:Fm in the +NO3- treatment in these three experiments, 1/τQA, was also elevated, lending further support to the idea of N-starvation of the phytoplankton community. In fact, 1/τQA was higher in the +NO3- treatment at the final time point in all but the experiment in ACC waters (Stn. 152), although at preceding time points, the turnover rate was elevated above the control at this site as well. Phototrophs can increase the rate of electron flow by either decreasing their antennae size (i.e., σPSII), so that electrons spend less time in the pigment bed before reaching reaction centers, or increasing the number of reaction centers (Behrenfeld et al., 1998; Moore et al., 2006; Falkowski and Raven, 2007; Suggett et al., 2010). In the present work, we recorded a corresponding decrease in σPSII and an increase in 1/τQA in response to NO3- at only Stn. 73. At all other sites where 1/τQA increased due to the N amendment, either no change or a slight increase in σPSII was observed. These results suggest that under the depleted ambient DIN concentrations in the Chukchi Sea during our summertime study, the in situ phytoplankton communities lacked N for the repair of damaged or construction of new reaction centers. N amendments likely relieved this N deficit and resulted in the synthesis of more reaction centers and an increase in both Fv:Fm and 1/τQA.
In contrast to these sites, no significant differences in the fluorescence parameters were detected between the control and NO3--treated waters at the Bering Strait site (Stn. 8). This is likely due to the fact that NO3- was not depleted at this site, and thus the in situ phytoplankton community was neither N-starved nor N-limited at the start of our experiment. This is supported by a similar level of biomass accumulation (i.e., POC and PON accumulation) in both the control and NO3- treatments (Figures 3M,S). It should be noted that despite non-limiting NO3- concentrations at T = 0 and the similar increase in biomass, there was some evidence suggesting that at the end of the incubation, the control was beginning to experience N-limitation, based on the leveling off of Chl a concentration and a higher NO3- uptake rate in the control.
Our data support N limitation of the phytoplankton community in the Chukchi Sea, and thus the changes in photophysiology we detected were likely related to nutrient starvation and not stress (i.e., cells were not acclimated or adapted to the nutrient deplete conditions as observed previously in the North Atlantic by Moore et al., 2008). However, caution must be taken when assuming fluorescence changes are a diagnostic for nutrient-stressed cells because fluorescence can differ between taxa. For example, cyanobacteria such as Synechococcus can have lower Fv:Fm than diatoms growing under the same conditions. Likewise, σPSII variability can range two–threefold between taxa (Suggett et al., 2009), even within broad taxonomic groupings (e.g., diatoms). The simultaneous increases in σPSII and 1/τQA at Stn. 101 are likely an indicator of a changing taxonomic community. As Figure 5 indicates, the initial community consisted of a significant dinoflagellate component with few diatoms. At the end of the incubation the dinoflagellates had disappeared in both the control and NO3- treatment and diatoms were a greater fraction of the community biomass in the NO3- treatment, but not in the controls. Thus, while the greater rate of electron turnover (1/τQA) in the NO3- treatment indicates the likely repair or new construction of PSII reaction centers, the simultaneous increase in σPSII suggests that the change in community composition also contributed to the fluorescence response.
NO3- Uptake Rates
Our NO3- uptake rates in the Chukchi Sea are within the range of measurements made previously in the Arctic Ocean. On the low end, Lee and Whitledge (2005) measured Canada Basin summertime NO3- uptake rates for phytoplankton beneath ice floes and in the open water as low as 0.021 ± 0.015 and 0.072 ± 0.072 mmol N m-3 d-1, respectively. At the high end, NO3- uptake rates span three orders of magnitude, from ∼2 to 150 mmol N m-3 d-1 (Smith, 1993, 1995; Kristiansen et al., 1994; Smith et al., 1997; Fouilland et al., 2007). Our initial uptake rates varied by two orders of magnitude (0.01 – 1.0 mmol N m-3 d-1). The lowest shelf rates we measured were at the coastal site (Stn. 152) while the highest rates were in Bering Strait (Table 1). The two off-shelf sites, which were most like the Canada Basin sites sampled by Lee and Whitledge (2005), did not have similar rates. The shallower site (Stn. 101) had higher NO3- uptake rates (0.2 ± 0.016 mmol N m-3 d-1) than the deeper site (Stn. 128, 0.01 ± 0.002 mmol N m-3 d-1), where concentrations of NO3- were detectable. Variability in NO3- uptake rates have been most commonly related to temperature, light, and ambient macro- and micronutrient concentrations (Mulholland and Lomas, 2008). In our study, we saw no statistical relationships between the initial NO3- uptake rates and these three environmental variables. Similarly, Baer et al. (2017) was unable to relate N uptake rates to ambient nutrient concentrations. However, we note that the highest rate of NO3- uptake in the present study was measured at the Bering Strait site, which had the highest in situ NO3- concentration.
Together, the NO3- uptake rates and changes in particulate concentrations (both POC and PON) in the <1 μm fraction indicate that heterotrophic prokaryotes (Bacteria and/or Archaea) utilize NO3- in the Chukchi Sea, and in some sites significantly (e.g., Stns. 46, 101, 128, and 152). Uptake of NO3- by prokaryotes is not a surprise, as previous work suggests that both cyanobacteria and heterotrophic prokaryotes can be significant consumers of NO3- (Ortega-Retuerta et al., 2012). Allen et al. (2001) measured NO3- uptake by bacteria in the Barents Sea and of the 30 bacterial isolates collected, 17 contained the bacterial assimilatory NO3- reductase gene nasA, and were able to grow on NO3- as the sole N source. The nasA-containing isolates were responsible for 17–36% of total NO3- uptake, higher percentages than measured for total NH4+ uptake (Allen et al., 2001). Likewise, uptake by heterotrophic prokaryotes was higher the farther north they sampled, as well as near the marginal ice zone. Additionally, in the coastal waters near Barrow, Alaska, both the LNA and HNA subpopulations of the heterotrophic prokaryote community were shown to take up NO3-, with the HNA subpopulation having higher rates than the LNA subpopulation (Baer, 2013).
Here, we found that NO3- uptake rates by the <1 μm size fraction were a more variable percentage of the total N community uptake rates across the study region than detected by Allen et al. (2001). Average NO3- uptake rates by the <1 μm fraction were 37 ± 42 and 26 ± 23% of total community uptake rates in the control and NO3- treatments, respectively. Likewise, there was no latitudinal trend in the relative importance of the <1 μm fraction to total NO3- uptake. Finally, we were unable to partition NO3- uptake in the <1 μm size fraction between the LNA and HNA groups, and we found little difference between the control and treated bottles in the relative proportion of HNA cells. The fact that changes in %HNA were the same in both the control and NO3--amended bottles suggests that the NO3- amendment did not enhance NO3- uptake in either group.
Conclusion
Our data indicate that the summertime phytoplankton community in the Chukchi Sea is N-limited and that the availability of N at this time of year is unrelated to salinity. More likely, denitrification drives N from the system, and phytoplankton N:P utilization ratios are such that N is consumed prior to other nutrients. Ultimately, the depleted summertime N environment results in a phytoplankton community dominated by smaller cells. Transient input of DIN would likely increase the growth of larger diatom cells. Future changes in the Arctic, such as enhanced stratification, which decreases nutrient availability in surface waters will likely result in a continued shift toward smaller celled phytoplankton populations. However, such a shift would also likely result in productivity and export decreases to the sediments, and thus lower rates of denitrification. This negative feedback could enhance N availability, reduce N limitation of the phytoplankton, and shift the summer phytoplankton community toward larger cells. Alternative predictions suggest the decrease in Arctic ice cover will result in greater wind driven mixing of the surface ocean (Martini et al., 2014), reducing stratification, and increase injection of dissolved N to the surface ocean that will enhance phytoplankton productivity. This enhanced production would then likely increase denitrification rates and potentially decrease the ocean N inventory.
Author Contributions
MM, ZB, and KA conceived and designed the research. All authors contributed to the collection of and processing of samples and data. Specifically, SL was responsible for the phytoplankton abundance and composition work. EO-R was responsible for all heterotrophic prokaryote work. Then manuscript was written by MM and KA with editorial input from all authors.
Funding
Fieldwork and analysis for the ICESCAPE program was supported by Ocean Biology and Biogeochemistry Program of the National Aeronautic and Space Administration under Grant No. NNX10AF42G to KA.
Conflict of Interest Statement
The authors declare that the research was conducted in the absence of any commercial or financial relationships that could be construed as a potential conflict of interest.
Acknowledgments
We would like to acknowledge the captain, crew, and science party of the USCGC Healy for their contributions during cruise HLY1101. We thank S. Martin and A. Santiago for their help collecting and processing samples at sea, as well as, Z. Kolber for loaning us the FRRf.
Footnotes
References
Allen, A. E., Booth, M. G., Frischer, M. E., Verity, P. G., Zehr, J. P., and Zani, S. (2001). Diversity and detection of nitrate assimilation genes in marine bacteria. Appl. Environ. Microbiol. 67, 5343–5348. doi: 10.1128/AEM.67.11.5343-5348.2001
Allen, A. E., Booth, M. G., Verity, P. G., and Frischer, M. E. (2005). Influence of nitrate availability on the distribution and abundance of heterotrophic bacterial nitrate assimilation genes in the Barents Sea during summer. Aquat. Microb. Ecol. 39, 247–255. doi: 10.3354/ame039247
Ardyna, M., Babin, M., Gosselin, M., Devred, E., Rainville, L., and Tremblay, J.-É. (2014). Recent Arctic Ocean sea ice loss triggers novel fall phytoplankton blooms. Geophys. Res. Lett. 41, 6207–6212. doi: 10.1002/2014GL061047
Ardyna, M., Gosselin, M., Michel, C., Poulin, M., and Tremblay, J. É. (2011). Environmental forcing of phytoplankton community structure and function in the Canadian High Arctic: contrasting oligotrophic and eutrophic regions. Mar. Ecol. Prog. Ser. 442, 37–57. doi: 10.3354/meps09378
Armstrong, F. A. J., Stearns, C. R., and Strickland, J. D. H. (1967). The measurement of upwelling and subsequent biological processes by means of the Technicon AutoAnalyzerTM and associated equipment. Deep Sea Res. 14, 381–389.
Arrigo, K. R., Mills, M. M., van Dijken, G. L., Lowry, K. E., Pickart, R. S., and Schlitzer, S. (2017). Late spring nitrate distributions beneath the ice-covered northeastern Chukchi Shelf. J/ Geophys. Res. 122, 2408–2417. doi: 10.1002/2017JG003881
Arrigo, K. R., Perovich, D. K., Pickart, R. S., Brown, Z. W., van Dijken, G. L., Lowry, K. E., et al. (2012). Massive phytoplankton blooms under the Arctic sea ice. Science 336:1408. doi: 10.1126/science.1215065
Arrigo, K. R., Perovich, D. K., Pickart, R. S., Brown, Z. W., van Dijken, G. L., Lowry, K. E., et al. (2014). Phytoplankton blooms beneath the sea ice in the Chukchi Sea. Deep Sea Res. Part II Top. Stud. Oceanogr. 105, 1–16. doi: 10.1126/science.1215065
Arrigo, K. R., and van Dijken, G. L. (2015). Continued increases in Arctic Ocean primary production. Prog. Oceanogr. 136, 60–70. doi: 10.1016/j.pocean.2015.05.002
Baer, S. E. (2013). Seasonal Nitrogen Uptake and Regeneration in the Water Column and sea-ice of the Western Coastal Arctic. Ph.D. thesis, The College of William and Mary, Williamsburg, VA.
Baer, S. E., Sipler, R. E., Roberts, Q. N., Yager, P. L., Frischer, M. E., and Bronk, D. A. (2017). Seasonal nitrogen uptake and regeneration in the western coastal Arctic. Limnol. Oceanogr. 62, 2463–2479. doi: 10.1002/lno.10580
Behrenfeld, M. J., Prasil, O., Kolber, Z. S., Babin, M., and Falkowski, P. G. (1998). Compensatory changes in photosystem II electron turnover rates protect photosynthesis from photoinhibition. Photosynth. Res. 58, 259–268. doi: 10.1023/A:1006138630573
Behrenfeld, M. J., Worthington, K., Sherrell, R. M., Chavez, F. P., Strutton, P., McPhaden, M., et al. (2006). Controls on tropical Pacific Ocean productivity revealed through nutrient stress diagnostics. Nature 442, 1025–1028. doi: 10.1038/nature05083
Berges, J. A., and Falkowski, P. G. (1998). Physiological stress and cell death in marine phytoplankton: induction of proteases in response to nitrogen or light limitation. Limnol. Oceanogr. 43, 129–135. doi: 10.4319/lo.1998.43.1.0129
Bernhardt, H., and Wilhelms, A. (1967). The continuous determination of low level iron, soluble phosphate and total phosphate with the AutoAnalyzerTM. Technicon. Symp. 1:386.
Brown, Z. W., Casciotti, K. L., Pickart, R. S., Swift, J. H., and Arrigo, K. R. (2015). Aspects of the marine nitrogen cycle of the Chukchi Sea shelf and Canada Basin. Deep Sea Res. Part II Top Stud. Oceanogr. 118, 73–87. doi: 10.1016/j.dsr2.2015.02.009
Chang, B. X., and Devol, A. H. (2009). Seasonal and spatial patterns of sedimentary denitrification rates in the Chukchi sea. Deep Sea Res. Part II Top. Stud. Oceanogr. 56, 1339–1350. doi: 10.1016/j.dsr2.2008.10.024
Cleveland, J. S., and Perry, M. J. (1987). Quantum yield, relative specific absorbtion and fluorescence in nitrogen-limited Chaetoceros gracilis. Mar. Biol. 94, 489–497. doi: 10.1007/BF00431395
Cuevas, L. A., Egge, J. K., Thingstad, T. F., and Topper, B. (2011). Organic carbon and mineral nutrient limitation of oxygen consumption, bacterial growth and efficiency in the Norwegian Sea. Polar Biol. 34, 871–882. doi: 10.1007/s00300-010-0944-3
Cullen, J. J., and Davis, R. F. (2003). The blank can make a big difference in oceanographic measurements. Limnol. Oceanogr. Bull. 12, 29–35. doi: 10.1002/lob.200312229
Cullen, J. J., Yang, X., and MacIntyre, H. L. (1992). “Nutrient limitation of marine photosynthesis,” in Preliminary Productivity and Biogeochemical Cycles in the Sea, eds P. G. Falkowski and A. D. Woodhead (Berlin: Springer), 69–88. doi: 10.1007/978-1-4899-0762-2_5
Devol, A. H., Codispoti, L. A., and Christensen, J. P. (1997). Summer and winter denitrification rates in western Arctic shelf sediments. Cont. Shelf Res. 17, 1029–1033. doi: 10.1016/S0278-4343(97)00003-4
Falkowski, P. G., and Raven, J. A. (2007). Aquatic Photosynthesis, 2nd Edn. Princeton, NJ: Princeton Univ. Press.
Falkowski, P. G., Sukenik, A., and Herzig, R. (1989). Nitrogen limitation in Isochrysis galbana (Haptophyceae). 2. Relative abundance of chloroplast proteins. J. Phycol. 25, 471–478. doi: 10.1016/j.gene.2014.04.022
Fouilland, E., Gosselin, M., Rivkin, R. B., Vasseur, C., and Mostajir, B. (2007). Nitrogen uptake by heterotrophic bacteria and phytoplankton in Arctic surface waters. J. Plankton Res. 29, 369–376. doi: 10.1093/femsec/fiy150
Gasol, J. M., and Del Giorgio, P. A. (2000). Using flow cytometry for counting natural planktonic bacteria and understanding the structure of planktonic bacterial communities. Sci. Mar. 64, 197–224. doi: 10.3989/scimar.2000.64n2197
Geider, R. J., Laroche, J., Greene, R. M., and Olaizola, M. (1993). Response of the photosynthetic apparatus of Phaeodactylum-tricornutum (Bacillariophyceae) to nitrate, phosphate, or iron starvation. J. Phycol. 29, 755–766. doi: 10.1111/j.0022-3646.1993.00755.x
Glibert, P. M., and Capone, D. G. (1993). “Mineralization and assimilation in aquatic, sediment, and wetland systems,” in Nitrogen Isotope Techniques, eds R. Knowles and T. H. Blackburn (Cambridge, MA: Academic Press), 243–272.
Gong, D., and Pickart, R. S. (2015). Summertime circulation in the eastern Chukchi Sea. Deep Sea Res. Part II Top. Stud. Oceanogr. 118, 18–31. doi: 10.1016/j.dsr2.2015.02.006
Gong, D., and Pickart, R. S. (2016). Early summer water mass transformation in the eastern Chukchi Sea. Deep Sea Res. Part II Top. Stud. Oceanogr. 130, 43–55. doi: 10.1016/j.dsr2.2016.04.015
Hameedi, M. J. (1978). Aspects of water column primary productivity in the Chukchi Sea during summer. Mar. Biol. 48, 37–48. doi: 10.1007/BF00390529
Hildebrand, M., and Dahlin, K. (2000). Nitrate transporter genes from the diatom Cylindrotheca fusiformis (Bacillariophyceae): mRNA levels controlled by nitrogen source and by the cell cycle. J. Phycol. 36, 702–713. doi: 10.1046/j.1529-8817.2000.99153.x
Hockin, N. L., Mock, T., Mulholland, F., Kopriva, S., and Malin, G. (2012). The response of diatom central carbon metabolism to nitrogen starvation is different from that of green algae and higher plants. Plant Physiol. 158, 299–312. doi: 10.1104/pp.111.184333
Holm-Hansen, O., Lorenzen, C. J., Holmes, R. W., and Strickland, J. D. H. (1965). Fluormetric Determination of Chlorophyll. ICES J. Mar. Sci. 30, 3–15. doi: 10.1093/icesjms/30.1.3
Kattner, G., and Budeus, G. (1997). Nutrient status of the Northeast Water Polynya. J. Mar. Syst. 10, 185–197. doi: 10.1016/S0924-7963(96)00070-X
Kerouel, R., and Aminot, A. (1997). A fluorometric determination of ammonia in seas and estuarine waters by direct segmented flow analysis. Mar. Chem. 57, 265–275. doi: 10.1016/S0304-4203(97)00040-6
Kirchman, D. L. (1993). “Leucine incorporation as a measure of biomass production by heterotrophic bacteria,” in Handbook of Methods in Aquatic Microbial Ecology, eds P. F. Kemp, B. F. Sherr, E. B. Sherr, and J. J. Cole (Boca Raton, FL: CRC Press), 509–512.
Kirchman, D. L., Malmstrom, R. R., and Cottrell, M. T. (2005). Control of bacterial growth by temperature and organic matter in the Western Arctic. Deep Sea Res. Part II Top. Stud. Oceanogr. 52, 3386–3395. doi: 10.1016/j.dsr2.2005.09.005
Knap, A., Michaels, A., Close, A., Ducklow, H., and Dickson, A. (eds) (1996). Protocols for the Joint Global Flux Study (JGOFS) core measurements. Paris: UNESCO, 170.
Kolber, Z., Zehr, J., and Falkowski, P. G. (1988). Effects of growth irradiance and nitrogen limitation on photosynthetic energy conversion in photosystem II. Plant Physiol. 88, 72–79. doi: 10.1104/pp.88.3.923
Kristiansen, S., Farbrot, T., and Wheeler, P. A. (1994). Nitroegen cycling in the Berrants Sea- Seasonal dynamics of new and regenerated production in the marginal ice-zone. Limnol. Oceanogr. 39, 1630–1642. doi: 10.4319/lo.1994.39.7.1630
Laney, S. R., and Sosik, H. M. (2014). Phytoplankton assemblage structure in and around a massive under-ice bloom in the Chukchi Sea. Deep Sea Res. Part II Top. Stud. Oceanogr. 105, 30–41. doi: 10.1016/j.dsr2.2014.03.012
Lee, S. H., and Whitledge, T. R. (2005). Primary and new production in the deep Canada Basin during summer 2002. Polar Biol. 28, 190–197. doi: 10.1007/s00300-004-0676-3
Lee, S. H., Yun, M. S., Kim, B. K., Joo, H. T., Kang, S.-H., Kang, C. K., et al. (2013). Contribution of small phytoplankton to total primary production in the Chukchi Sea. Cont. Shelf Res. 68, 43–50. doi: 10.1016/j.csr.2013.08.008
Lewis, K. M., Arnsten, A. E., Joy-Warren, H., Lowry, K. E., Mills, M. M., van Dijken, G. L., et al. (2018). Photoacclimation of Arctic Ocean phytoplankton to shifting light and nutrient limitation. Limnol. Oceanogr. 9999, 1–18. doi: 10.1002/lno.11039
Li, W. K. W., McLaughlin, F. A., Lovejoy, C., and Carmack, E. C. (2009). Smallest algae thrive as the Arctic Ocean freshens. Science 326, 539–539. doi: 10.1126/science.1179798
Lowry, K. E., Pickart, R. S., Mills, M. M., Brown, Z. W., Dijken, G. L., Bates, N. R., et al. (2015). The influence of winter water on phytoplankton blooms in the Chukchi Sea. Deep Sea Res. Part II Top. Stud. Oceanogr. 118, 53–72. doi: 10.1016/j.dsr2.2015.06.006
Lowry, K. E., Pickart, R. S., Mills, M. M., Selz, V., Pacini, A., Lewis, K. M., et al. (2018). Under-ice phytoplankton bloom dynamics controlled by spring convective mixing in refreezing leads of open water. J. Geophys. Res. 123, 90–109. doi: 10.1002/2016JC012575
Marie, D., Partensky, F., Jacquet, S., and Vaulot, D. (1997). Enumeration and cell cycle analysis of natural populations of marine picoplankton by flow cytometry using the nucleic acid stain SYBR Green I. Appl. Environ. Microbiol. 63, 186–193.
Martini, K. I., Simmons, H. L., Stoudt, C. A., and Hutchings, J. K. (2014). Near-Inertial Internal Waves and Sea Ice in the Beaufort Sea. J. Phys. Oceanogr. 44, 2212–2234. doi: 10.1175/JPO-D-13-0160.1
McLaughlin, F. A., and Carmack, E. C. (2010). Deepening of the nutricline and chlorophyll maximum in the Canada Basin interior, 2003–2009. Geophys. Res. Lett. 37:L24602. doi: 10.1029/2010GL045459
Meon, B., and Amon, R. M. W. (2004). Heterotrophic bacterial activity and fluxes of dissolved free amino acids and glucose in the Arctic rivers Ob, Yenisei and the adjacent Kara Sea. Aquat. Microb. Ecol. 37, 121–135. doi: 10.3354/ame037121
Middelboe, M., and Lundsgaard, C. (2003). Microbial activity in the Greenland Sea: role of DOC lability, mineral nutrients and temperature. Aquat. Microb. Ecol. 32, 151–163. doi: 10.3354/ame032151
Mills, M. M., Brown, Z. W., Lowry, K. E., van Dijken, G. L., Becker, S., Pal, S., et al. (2015). Impacts of low phytoplankton NO3-:PO43- utilization ratios over the Chukchi Shelf, Arctic Ocean. Deep Sea Res. Part II Top. Stud. Oceanogr. 118, 105–121. doi: 10.1016/j.dsr2.2015.02.007
Mock, T., Samanta, M. P., Iverson, V., Berthiaume, C., Robison, M., Holtermann, K., et al. (2008). Whole-genome expression profiling of the marine diatom Thalassiosira pseudonana identifies genes involved in silicon bioprocesses. Proc. Natl. Acad. Sci. U.S.A. 105, 1579–1584. doi: 10.1073/pnas.0707946105
Moore, C. M., Mills, M. M., Arrigo, K. R., Berman-Frank, I., Bopp, L., and Boyd, P. W. (2013). Processes and patterns of oceanic nutrient limitation. Nat. Geosci. 6, 701–710. doi: 10.1038/ngeo1765
Moore, C. M., Mills, M. M., Langlois, R., Milne, A., Achterberg, E. P., and La Roche, J. (2008). Relative influence of nitrogen and phosphorus availability on phytoplankton physiology and productivity in the oligotrophic sub-tropical North Atlantic Ocean. Limnol. Oceanogr. 53, 291–305. doi: 10.4319/lo.2008.53.1.0291
Moore, C. M., Suggett, D. J., Hickman, A. E., Kim, Y. N., Tweddle, J., and Sharples, J. (2006). Phytoplankton photoacclimation and photoadaptation in response to environmental gradients in a shelf sea. Limnol. Oceanogr. 51, 936–949. doi: 10.4319/lo.2006.51.2.0936
Mulholland, M. R., and Lomas, M. W. (2008). “Nitrogen uptake and assimilation,” in Nitrogen in the Marine Environment, 2nd Edn, eds D. Capone, D. A. Bronk, M. R. Mulholland, and E. J. Carpenter (Cambridge, MA: Academic Press), 303–384. doi: 10.1016/B978-0-12-372522-6.00007-4
Neukermans, G., Reynolds, R. A., and Stramski, D. (2016). Optical classification and characterization of marine particle assemblages within the western Arctic Ocean. Limnol. Oceanogr. 61, 1472–1494. doi: 10.1002/lno.10316
Olson, R. J. and Sosik, H. M. (2007). A submersible imaging-in-flow instrument to analyze nano-and microplankton: imaging FlowCytobot. Limnol. Oceanogr. Methods 5, 195–203. doi: 10.4319/lom.2007.5.195
Ortega-Retuerta, E., Jeffrey, W. H., Ghiglione, J. F., and Joux, F. (2012). Evidence of heterotrophic prokaryotic activity limitation by nitrogen in the Western Arctic Ocean during summer. Polar Biol. 35, 785–794. doi: 10.1007/s00300-011-1109-8
Pabi, S., van Dijken, G. L., and Arrigo, K. R. (2008). Primary production in the Arctic Ocean, 1998-2006. J. Geophys. Res. Oceans 113,
Palmer, M. A., Van Dijken, G. L., Mitchell, B. G., Seegers, B. J., Lowry, K. E., and Mills, M. M. (2013). Light and nutrient control of photosynthesis in natural phytoplankton populations from the Chukchi and Beaufort seas, Arctic Ocean. Limnol. Oceanogr. 58, 2185–2205. doi: 10.4319/lo.2013.58.6.2185
Parkhill, J. P., Maillet, G., and Cullen, J. J. (2001). Fluorescence-based maximal quantum yield for PSII as a diagnostic of nutrient stress. J. Phycol. 37, 517–529. doi: 10.1046/j.1529-8817.2001.037004517.x
Perovich, D., Meier, W., Tschudi, M., Farrell, S., Gerland, S., Hendricks, S., et al. (2016). Sea Ice [in Arctic Report Card 2016]. Available at: http://www.arctic.noaa.gov/Report-Card
Perovich, D. K., Jones, K. F., Light, B., Eicken, H., Markus, T., and Stroeve, J. (2011). Solar partitioning in a changing Arctic sea-ice cover. Ann. Glaciol. 52, 192–196. doi: 10.3189/172756411795931543
Perovich, D. K., Light, B., Eicken, H., Jones, K. F., Runciman, K., and Nghiem, S. V. (2007). Increasing solar heating of the Arctic Ocean and adjacent seas, 1979-2005: attribution and role in the ice-albedo feedback. Geophys. Res. Lett. 34:C7. doi: 10.1029/2007GL031480
Pickart, R. S., Moore, G. W. K., Mao, C. Y., Bahr, F., Nobre, C., and Weingartner, T. J. (2016). Circulation of winter water on the Chukchi shelf in early Summer. Deep Sea Res. Part II Top. Stud. Oceanogr. 130, 56–75. doi: 10.1016/j.dsr2.2016.05.001
Pickart, R. S., Pratt, L. J., Proshutinsky, A. Y., Torres, D. J., Whitledge, T. E., Aagaard, K., et al. (2010). Evolution and dynamics of the flow through Herald Canyon in the Western Chukchi Sea. Deep Sea Res. Part II 57, 5–26. doi: 10.1016/j.dsr2.2009.08.002
Plumley, F. G., and Schmidt, G. W. (1989). Nitrogen-dependent regulation of photosynthetic gene-expression. Proc. Natl. Acad. Sci. U.S.A. 86, 2678–2682. doi: 10.1073/pnas.86.8.2678
Serreze, M. C., Barrett, A. P., Slater, A. G., Woodgate, R. A., Aagaard, K., Lammers, R. B., et al. (2006). The large-scale freshwater cycle of the Arctic. J. Geophys. Res. Oceans 111:C11010. doi: 10.1111/gcb.12247
Shimura, S., and Fujita, Y. (1975). Changes in activity of fucoxanthin-excited photosynthesis in marine diatom Phaeodactylum tricornutum grown under different culture conditions. Mar. Biol. 33, 185–194. doi: 10.1007/BF00390922
Simpson, K. G., Tremblay, J. E., Gratton, Y., and Price, N. M. (2008). An annual study of inorganic and organic nitrogen and phosphorus and silicic acid in the southeastern Beaufort Sea. J. Geophys. Res. Oceans 113:C07016. doi: 10.1029/2007JC004462
Smedsrud, L. H., Halvorsen, M. H., Stroeve, J. C., Zhang, R., and Kloster, K. (2017). Fram Strait sea ice export variability and September Arctic sea ice extent over the last 80 years. Cryosphere 11, 65–79. doi: 10.5194/tc-11-65-2017
Smith, D. C., and Azam, F. (1992). A simple, economical method for measuring bacterial protein synthesis rates in seawater usin 3H-leucine. Mar. Microb. Food Webs 6, 107–114.
Smith, W. O. (1993). Nitrogen uptake and new production in the Greenland Sea – The spring Phaeocystis bloom. J. Geophys. Res. Oceans 98, 4681–4688. doi: 10.1029/92JC02754
Smith, W. O. (1995). Primary productivity and new production in the Northeast Water (Greenland) Polynya during Summer-1992. J. Geophys. Res. Oceans 100, 4357–4370. doi: 10.1029/94JC02764
Smith, W. O., Gosselin, M., Legendre, L., Wallace, D., Daly, K., and Kattner, G. (1997). New production in the Northeast Water Polynya: 1993. J. Mar. Sys. 10, 199–209. doi: 10.1016/S0924-7963(96)00067-X
Spall, M. A. (2007). Circulation and water mass transformation in a model of the Chukchi Sea. J. Geophys. Res. 112:C05025. doi: 10.1029/2005JC003364
Spall, M. A., Pickart, R. S., Brugler, E. T., Moore, G. W. K., Thomas, L., and Arrigo, K. R. (2014). Role of shelfbreak upwelling in the formation of a massive under-ice bloom in the Chkchi Sea. Deep Sea Res. Part II 105, 17–29. doi: 10.1016/j.dsr2.2014.03.017
Spielhagen, R. F., Werner, K., Sørensen, S. A., Zamelczyk, K., Kandiano, E., Budeus, G., et al. (2011). Enhanced modern heat transfer to the Arctic by Warm Atlantic Water. Science 331, 450–453. doi: 10.1126/science.1197397
Stroeve, J., Holland, M. M., Meier, W., Scambos, T., and Serreze, M. (2007). Arctic sea ice decline: faster than forecast. Geophys. Res. Lett. 34:L09501. doi: 10.1029/2007GL029703
Suggett, D. J., Moore, C. M., and Geider, R. J. (2010). Estimating aquatic productivity from active fluorescence measurements. Chlorphyll Fluoresc. Aquat. Sci. Methods Appl. 4, 103–127.
Suggett, D. J., Moore, C. M., Hickman, A. E., and Geider, R. J. (2009). Interpretation of fast repetition rate (FRR) fluorescence: signatures of phytoplankton community structure versus physiological state. Mar. Ecol. Prog. Ser. 376, 1–19. doi: 10.3354/meps07830
Tremblay, J. E., Gratton, Y., Carmack, E. C., Payne, C. D., and Price, N. M. (2002). Impact of the large-scale Arctic circulation and the North Water Polynya on nutrient inventories in Baffin Bay. J. Geophys. Res. Oceans 107:3112. doi: 10.1029/2000JC000595
Tremblay, J. E., Simpson, K., Martin, J., Miller, L., Gratton, Y., Barber, D., et al. (2008). Vertical stability and the annual dynamics of nutrients and chlorophyll fluorescence in the coastal, southeast Beaufort Sea. J. Geophys. Res. Oceans 113:C07S90. doi: 10.1029/2007JC004547
Tremblay, J. É, and Gagnon, J. (2009). “The effects of irradiance and nutrient supply on the productivity of Arctic waters: a perspective on climate change,” in Influence of Climate Change on the Changing Arctic and Sub-Arctic Conditions. NATO Science for Peace and Security Series C: Environmental Security, eds J. C. J. Nihoul and A. G. Kostianoy (Dordrecht: Springer).
Vallieres, C., Retamal, L., Ramlal, P., Osburn, C. L., and Vincent, W. F. (2008). Bacterial production and microbial food web structure in a large arctic river and the coastal Arctic Ocean. J. Mar. Syst. 74, 756–773. doi: 10.1016/j.jmarsys.2007.12.002
Weingartner, T., Dobbins, E., Danielson, S., Winsor, P., Potter, R., and Statscewich, H. (2013). Hydrographic variability over the northeastern Chukchi Sea shelf in summer-fall 2008-2010. Cont. Shelf Res. 67, 5–22. doi: 10.1016/j.csr.2013.03.012
Weingartner, T. J., Aagaard, K., Woodgate, R., Danielson, S., Sasaki, Y., and Cavalieri, D. J. (2005). Circulation on the north central Chukchi Sea shelf. Deep Sea Res. Part II 52, 3150–3174. doi: 10.1016/j.dsr2.2005.10.015
Woodgate, R. A., Weingartner, T. J., and Lindsay, R. (2012). Observed increases in Bering Strait oceanic fluxes from the Pacific to the Arctic from 2001 to 2011 and their impacts on the Arctic Ocean water column. Geophys. Res. Lett. 39:L24603. doi: 10.1029/2012GL054092
Yentsch, C. S., and Vaccaro, R. F. (1958). Phytoplankton nitrogen in the oceans. Limnol. Oceanogr. 3, 443–448. doi: 10.4319/lo.1958.3.4.0443
Yun, M. S., Whitledge, T. E., Stockwell, D., Son, S. H., Lee, J. H., Park, J. W., et al. (2016). Primary production in the Chukchi Sea with potential effects of freshwater content. Biogeosciences 13, 737–749. doi: 10.5194/bg-13-737-2016
Zehr, J. P., Falkowski, P. G., Fowler, J., and Capone, D. G. (1988). Coupling of ammonium uptake and incorporation in a marine diatom: experiments with the short-lived radio isotope 13N. Limnol. Oceanogr. 33, 518–527. doi: 10.4319/lo.1988.33.4.0518
Keywords: phytoplankton, nitrogen, Chukchi Sea, nitrate, nutrient limitation
Citation: Mills MM, Brown ZW, Laney SR, Ortega-Retuerta E, Lowry KE, van Dijken GL and Arrigo KR (2018) Nitrogen Limitation of the Summer Phytoplankton and Heterotrophic Prokaryote Communities in the Chukchi Sea. Front. Mar. Sci. 5:362. doi: 10.3389/fmars.2018.00362
Received: 06 July 2018; Accepted: 20 September 2018;
Published: 15 October 2018.
Edited by:
Claire Mahaffey, University of Liverpool, United KingdomReviewed by:
Allison A. Fong, Alfred-Wegener-Institut, Helmholtz-Zentrum für Polar-und Meeresforschung (HZ), GermanyJun Sun, Tianjin University of Science and Technology, China
Copyright © 2018 Mills, Brown, Laney, Ortega-Retuerta, Lowry, van Dijken and Arrigo. This is an open-access article distributed under the terms of the Creative Commons Attribution License (CC BY). The use, distribution or reproduction in other forums is permitted, provided the original author(s) and the copyright owner(s) are credited and that the original publication in this journal is cited, in accordance with accepted academic practice. No use, distribution or reproduction is permitted which does not comply with these terms.
*Correspondence: Matthew M. Mills, bW1taWxsc0BzdGFuZm9yZC5lZHU=