 Sarah K. Gaichas1*
 Geret S. DePiper1
 Richard J. Seagraves2
 Brandon W. Muffley2
 Mary G. Sabo2
 Lisa L. Colburn3Andrew J. Loftus4
- 1NOAA NMFS Northeast Fisheries Science Center, Woods Hole, MA, United States
- 2Mid-Atlantic Fishery Management Council, Dover, DE, United States
- 3NOAA NMFS Northeast Fisheries Science Center, Narragansset, RI, United States
- 4Fisheries Consultant, Annapolis, MD, United States
Fishery managers worldwide are evaluating methods for incorporating climate, habitat, ecological, social, and economic factors into current operations in order to implement Ecosystem Approaches to Fishery Management (EAFM). While this can seem overwhelming, it is possible to take practical steps toward EAFM implementation that make use of existing information and provide managers with valuable strategic advice. Here, we describe the process used by the U.S. Mid-Atlantic Fishery Management Council (Council) to develop an ecosystem-level risk assessment, the initial step proposed in their recently adopted EAFM guidance document. The Council first defined five types of Risk Elements (ecological, economic, social, food production, management) and identified which management objectives aligned with each element. Based on an existing ecosystem status report for the region and other existing sources (including expert opinion), potential ecological, social, economic, and management indicators were identified for each risk element. Finally, low, low-moderate, moderate-high, and high risk criteria were defined for each indicator, and the indicator data were used to score each risk element using the criteria. The ultimate outcome is a ranked risk assessment in order to focus on the highest risk issues for further evaluation and mitigation. The risk assessment highlights certain species and certain management issues as posing higher cumulative risks to meeting Council management objectives when considering a broad range of ecological, social, and economic factors. Tabular color coded summaries of risk assessment results will be used by the Council to prioritize further EAFM analyses as well as research plans over the coming 5 years. As ecosystem reporting and operational EAFM continue to evolve in future years, the Council foresees integrating these efforts so that ecosystem indicators are refined to meet the needs of fishery managers in identifying and managing risks to achieving ecological, social, and economic fishery objectives. Overall, ecosystem indicator-based risk assessment is a method that can be adapted to a wide range of resource management systems and available information, and therefore represents a promising way forward in the implementation of EAFM.
1. Introduction
For more than a decade, an Ecosystem Approach to Fishery Management (EAFM) has been promoted as desirable policy worldwide to support ecological sustainability and human well-being (Garcia and Cochrane, 2005; Sherman et al., 2005). While tactical applications of ecosystem approaches to date are few (Skern-Mauritzen et al., 2016), perceived barriers to adopting ecosystem approaches are diminishing (Patrick and Link, 2015), and there are practical steps in progress toward EAFM implementation in many regions worldwide (e.g., Fletcher et al., 2012; Heenan et al., 2015; Ramírez-Monsalve et al., 2016; Smith et al., 2017). Here, we describe the initial EAFM step implemented by the U.S. Mid-Atlantic Fishery Management Council (Council), which was to develop an ecosystem-level risk assessment. This risk assessment was developed rapidly with existing information, and is intended to provide managers with a comprehensive overview of risks to meeting management objectives to prioritize further integrated EAFM analyses.
The Council is one of eight regional fishery management councils in the United States, and is responsible for conservation and management of fishery resources within U.S. federal waters in the mid-Atlantic region (New York-North Carolina). U.S. law defines the overarching objective of fishery management as achieving and maintaining optimum yield (OY):
‘The term “optimum,” with respect to the yield from a fishery, means the amount of fish which— (A) will provide the greatest overall benefit to the Nation, particularly with respect to food production and recreational opportunities, and taking into account the protection of marine ecosystems; (B) is prescribed as such on the basis of the maximum sustainable yield from the fishery, as reduced by any relevant economic, social, or ecological factor; and (C) in the case of an overfished fishery, provides for rebuilding to a level consistent with producing the maximum sustainable yield in such fishery (U.S. Code, Title 16, Chapter 38, Subchapter I § 1802)'.
Thus, OY is at most maximum sustainable yield (MSY). Further U.S. fishery management objectives are specified in the National Standard Guidelines for developing fishery management plans, including basing measures on the best scientific information available, fair and equitable allocation, economic efficiency, safety at sea, and consideration of social and economic impacts to human communities (U.S. Code, Title 16, Chapter 38, Subchapter IV § 1851, and see DePiper et al., 2017). Balancing these multiple objectives is the charge of each Council; an ecosystem approach offers a way to evaluate these objectives comprehensively.
The Council is a co-management body with stakeholders integrated into decision processes indirectly through representation by federal and state fisheries management agencies, and private-sector stakeholders (commercial and recreational fisheries and conservation organizations) and directly through participation on advisory committees and during public comment periods at Council meetings. Council meetings are held every other month at different locations within the region. Council standard operating procedures are focused on stakehoder engagement: meetings are open and widely advertised with opportunities for public comment in person and in writing (http://www.mafmc.org/s/2017-06-08_MAFMC-SOPP-final.pdf, sections 3.1.4-3.1.5). Advisory Panels comprised of fishing industry, environmental, and other interested stakeholders are appointed to provide advice to Council committees (http://www.mafmc.org/s/2017-06-08_MAFMC-SOPP-final.pdf, section 2.6.2). In the Mid-Atlantic, the Council further incorporated stakeholder feedback on its management through a “visioning” process (2011–2013) which shaped the Council's strategic planning (http://www.mafmc.org/strategic-plan/). The visioning process identified implementation of EAFM as a high priority across all stakeholder groups. The Council therefore had a series of workshops and developed several white papers between 2014 and 2016 regarding forage fish, climate, habitat, and species interactions (see http://www.mafmc.org/eafm/ for details).
The Council adopted an EAFM Guidance Document in 2016 which outlined a path forward to more fully incorporate ecosystem considerations into marine fisheries management (http://www.mafmc.org/s/EAFM_Guidance-Doc_2017-02-07.pdf). The Council's stated goal for EAFM is “to manage for ecologically sustainable utilization of living marine resources while maintaining ecosystem productivity, structure, and function.” Ecologically sustainable utilization is further defined as “utilization that accommodates the needs of present and future generations, while maintaining the integrity, health, and diversity of the marine ecosystem.” Of particular interest to the Council was the development of tools to incorporate the effects of species, fleet, habitat and climate interactions into its management and science programs. To accomplish this, the Council agreed to a structured framework that first prioritizes ecosystem interactions, second specifies key questions regarding high priority interactions, and third tailors appropriate analyses to address them (Gaichas et al., 2016). Because there are many possible ecosystem interactions to consider, risk assessment was adopted as the first step to identify a subset of high priority interactions (Fletcher, 2015; Holsman et al., 2017).
This paper describes the process, methods, and ecosystem indicators used to develop the Council's initial EAFM risk assessment. This risk assessment will help the Council decide where to focus limited resources to address ecosystem considerations by first clarifying priorities for specific actions. Overall, the purpose of the EAFM risk assessment is to provide the Council with a proactive strategic planning tool for the sustainable management of marine resources under its jurisdiction, while taking interactions within the ecosystem into account. We provide this example to illustrate that ecosystem-level risk assessment is a transparent and accessible tool that can be adapted to a wide range of resource management systems and available information, and is therefore a promising way forward in the implementation of EAFM.
2. Methods
A series of public meetings were held in 2016–2017 to develop the risk assessment, which used data from existing ecosystem reporting efforts, information from previously published reports, and expert knowledge. The general approach was for Council staff and analysts to develop and refine prototypes after discussion with Council members, advisors, and stakeholders, which a Council committee (a subset of the Council appointed to make initial recommendations on particular topics) and then full Council would then adjust and refine. This iterative approach allowed the risk assessment to develop fairly quickly to meet management needs and timeframes. Specific methods used at each stage are detailed below.
A risk assessment prototype was developed as an example during Council review of potential approaches for integrating climate, habitat, social, and economic interatcions into fishery management (see Figure 10 in Gaichas et al., 2016). This example was reviewed by the Council's Ecosystem and Ocean Planning Committee (EOP) in July 2016. Although the example risk table was based on analyst expert knowledge and was for illustration only, it facilitated discussion of which risks (“columns” in the table) were relevant and which managed resources (“rows” in the table) the assessment should address. The EOP concluded that the example table contained many ecological elements of value, but was missing risks to economic and social objectives that were of interest the Council. As a result, further work on the risk assessment was conducted jointly by analysts with specific expertise in economics, anthropology, and ecology. Further, the EOP requested that recreational and commercial fisheries be distinguished in the assessment to differentiate risks between sectors. This outlined the potential scope of analysis and data required.
The risk assessment was developed between August and December of 2017. The initial scoping step was to determine which risks were of concern to the full Council: i.e., to map out the “columns” for analysis. At the August 2017 Council Meeting, the Council agreed upon a list of areas of concern/risks which included those in the prototype table from Gaichas et al. (2016), and expanded to include many economic, social, and management-oriented risks (http://www.mafmc.org/s/EAFM-Risk-Elements-post-August-Council-meeting.pdf).
In September 2017, the EOP and EOP Advisory Panel members met to further refine the Council's risk list, as well as to determine the desired level of analyses for the risk assessment (species, species/sector, ecosystem). This was initially a wide ranging discussion, and it became apparent that EOP members, advisors, and analysts were unclear on how to assess all of the items on the Council's list within a consistent analytical framework. The goal was to evaluate a diverse range of potential risks to different components of the management system, including managed species, stakeholders, and fishing communities. Development and use of consistent and clearly defined terminology was critical to conducting the assessment within the Council process. It was necessary to define what was being measured, why it was being measured, how it was being measured, and how the measurement could be used to evaluate risk. Analysts and Council staff therefore worked together to more clearly define each aspect of the risk assessment.
What are we measuring? A Risk Element is a category related to achieving the biological, economic, or social objectives that the Council desires from a fishery (Table l). For example, achieving biological objectives for a stock could be at risk from excessive fishing mortality, from habitat degradation, from climate change, or from a combination of these elements. Risk elements were derived from existing legislation (particularly the Magnuson-Stevens Act), public comment, manager feedback, or a mix of these things. Some Risk Elements may be added as conditions change or new information becomes available. The Council explicitly planned for this EAFM risk assessment to be a dynamic and evolving process that will be revisited and updated in future years.
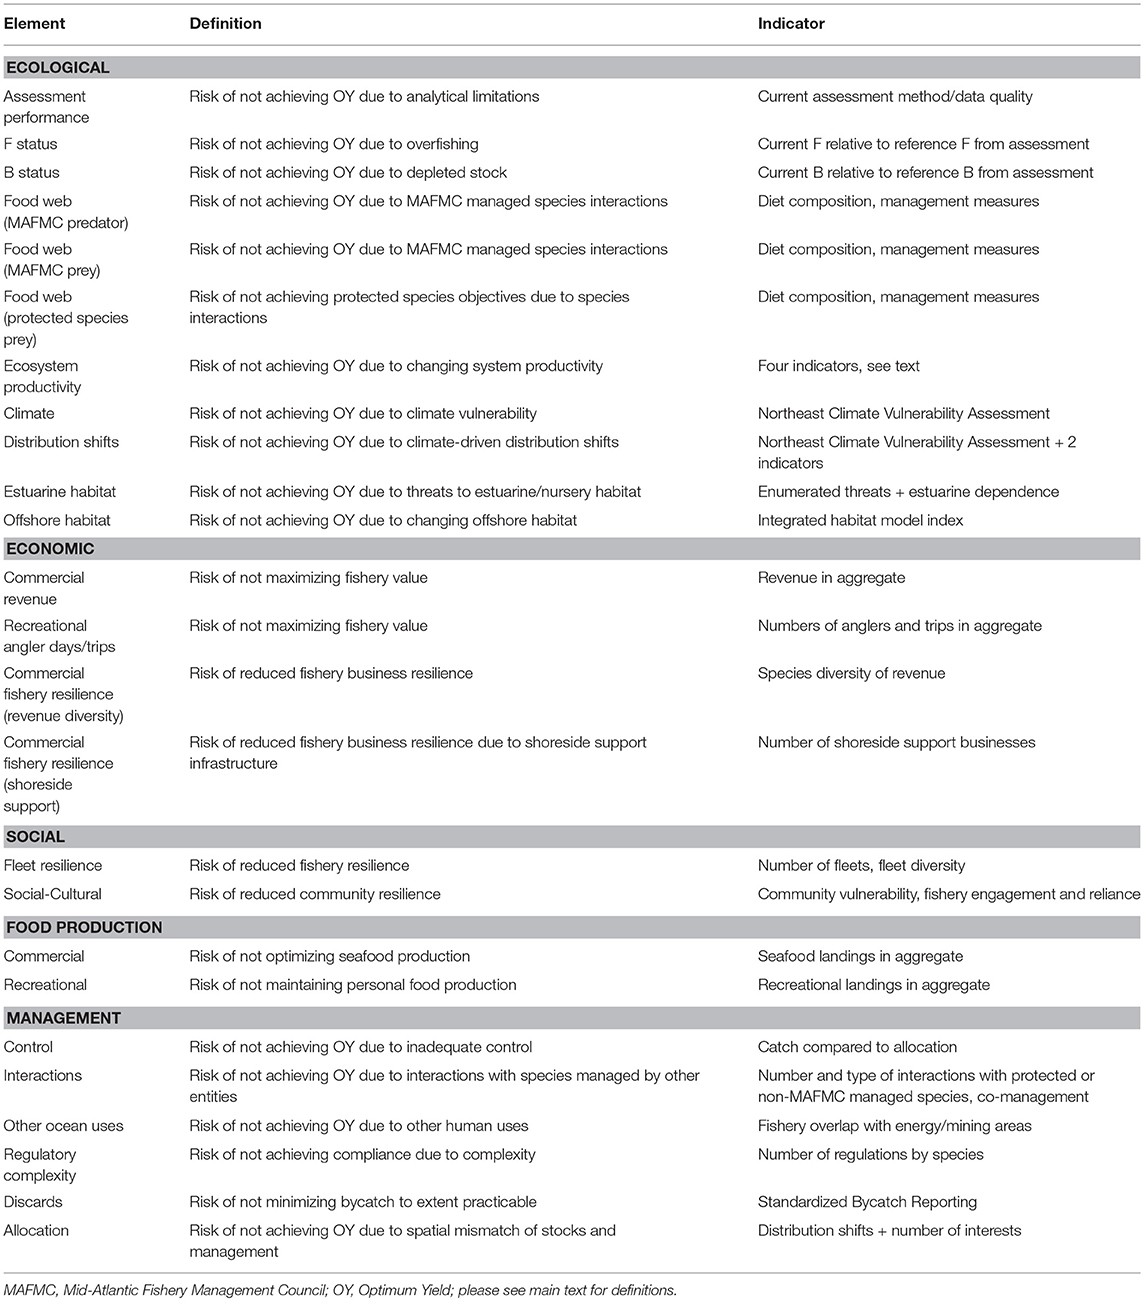
Table 1. Risk Elements, Definitions, and Indicators Used.
Why are we measuring it? The Risk Definition clearly states what is at risk. In general, because the Council is charged with managing fisheries for Optimum Yield (OY), risk definitions often centered on a particular element's potential impact on achieving OY. However, some Risk Elements addressed additional Council objectives (e.g., maximizing fishery value, optimizing employment).
How are we measuring it? An Indicator is an observation that gives information about the Risk Element. It may be a time series of data or it may come from an individual study (even a previous risk assessment). To the extent possible, data for defining level of risk needed to be applicable and comparable coast-wide.
Risk Elements were organized into five categories: Ecological (including stock biology, habitat, and ecosystem interactions), Economic, Social, Food Production, Management. These categories align roughly with management objectives for US fisheries as specified in an integrated ecosystem assessment context (DePiper et al., 2017). Therefore, ecosytem, economic, and social indicators had already been identified and presented for many of the general management objectives in the region prior to development of the risk assessment (http://www.mafmc.org/s/Tab02_2017-04_State-of-the-Ecosystem-and-EAFM.pdf).
After defining the assesment more clearly, the EOP and EOP Advisory Panel members reached consensus on the list of Risk Elements, and had a preview of available indicators/information to evaluate risks for each element in early October. During the October 2017 Council Meeting the following week, the full Council agreed on the list of Risk Elements to go forward for evaluation.
Between the October and December Council meetings, analysts assembled indicators for each element from available sources, including the indicators from the State of the Ecosystem report presented to the Council earlier in 2017 (linked above), an estuarine habitat assessment (EPA, 2012), a climate vulnerability analysis for species in the Northeast U.S. (Hare et al., 2016), existing social vulnerability analyses (Colburn and Jepson, 2012; Jepson and Colburn, 2013), and a climate vulnerability analysis for northeast U.S. fishing communities (Colburn et al., 2016). Additional information came from literature searches and from expert opinion for some elements. Detailed sources for the final indicators selected by the Council are presented in sections below. Given these data sources and the Council-approved list of Risk Elements, the final analytical decision was translating the indicators and other data into a level of risk.
What is the risk? The final Risk Ranking Criteria were developed iteratively between analysts and the Council to use the available indicator(s). The intent was to provide a transparent and “structured process that identifies how objectives may be affected, and analyses the risk in terms of consequences and their probabilities” (ISO, 2009a). Analysts proposed initial criteria for low, low-moderate, moderate-high, and high risk based on the elements and indicators available. For trend-based risk definitions, a Mann-Kendall test for monotonic trends was used to test significance (p < 0.05) of both long term (full time series) and recent (2007–2016) trends. Autocorrelation in the time series was addressed by prewhitening the data as suggested by Yue et al. (2002): the time series is detrended, the lag-1 serial autocorrelation coefficient of the detrended time series is computed and then removed from the detrended time series, then the trend and residuals remaining after removal of autocorrelation are summed and the Mann-Kendall test for trend is applied to the time series with lag-1 autocorrelation removed.
The proposed risk ranking criteria were presented to the EOP and advisors at a meeting in early December 2017. We note that for many Risk Elements, there are no established risk thresholds or targets for low, low-moderate, moderate-high, or high risk, so the consensus of the EOP, and ultimately the Council, was used to establish risk levels. The EOP discussed the proposed risk ranking criteria for each element, and modified them as necessary to reflect a ranking rationale aligned with their risk tolerance. If clear targets/thresholds become available for any element/indicator combination, they can be substituted into future assessments. Similarly, if the risk tolerance of the Council changes over time, the ranking criteria and risk level can be adjusted.
Upon review of available indicator data in early December, the EOP also identified several indicators that, although important, were considered either preliminary or unreliable based on their experience. Therefore, the elements associated with these indicators were not ranked in this assessment, but are still under consideration for future assessments. At their December 2017 Meeting, the full Council reached agreement on element ranking criteria and the results of the risk assessment based on those criteria.
3. Results
As a result of the full (August-December) process, the Council settled on 25 Risk Elements with definitions and indicators for evaluation in this assessment (Table 1). Eight additional Risk Elements were considered by the Council, but ultimately removed from this initial assessment (Table S1). These elements required either further definition, improved data availability or analyses, clearer indicator interpretability, or some combination of these factors. The eight elements that were put aside are still of interest to the Council, and may be included in future assessments as information improves.
In sections below, each Risk Element, final risk ranking criteria agreed on by the Council, indicator(s), and ranking results are described (see also Table 2). Summary results across all risk categories are presented in Table 3 (species level), Table 4 (species and sector level), and Table 5 (ecosystem level).
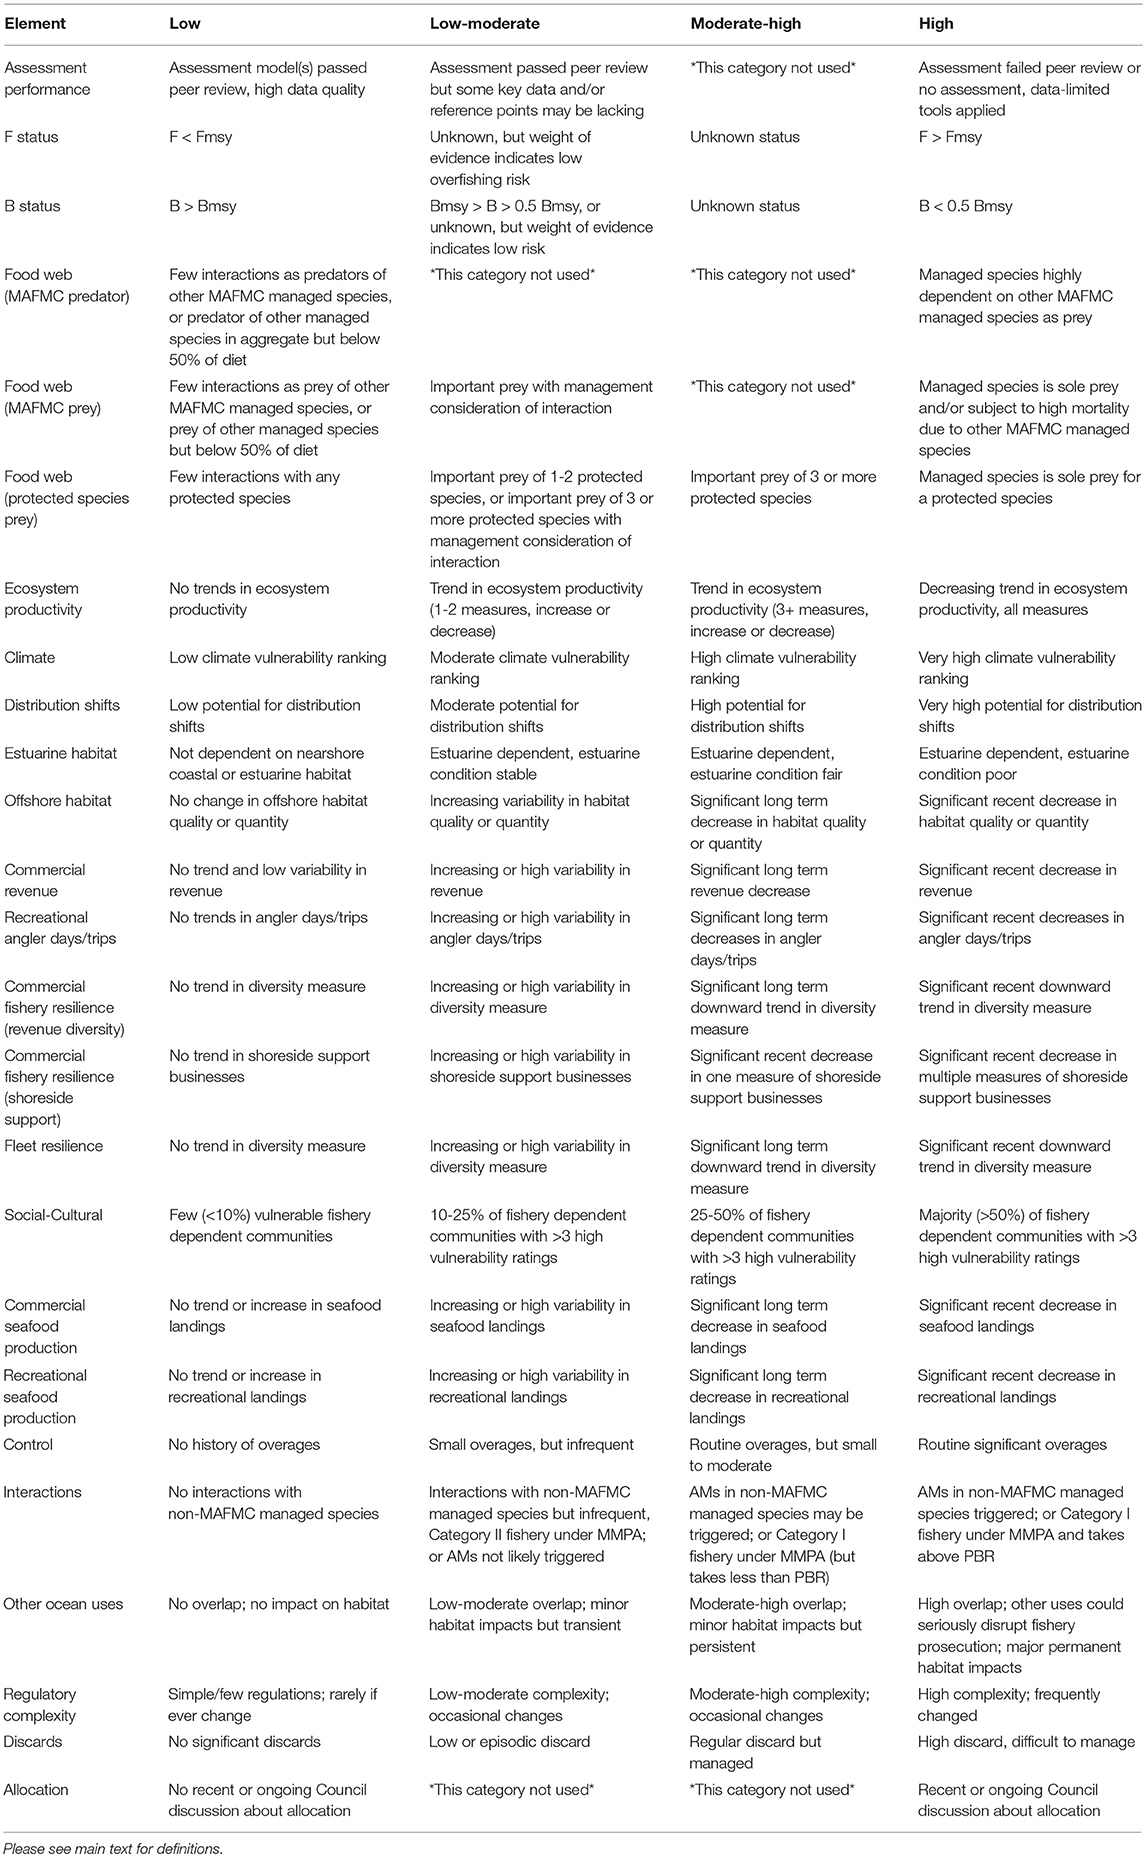
Table 2. Risk Ranking Criteria used for each Risk Element.
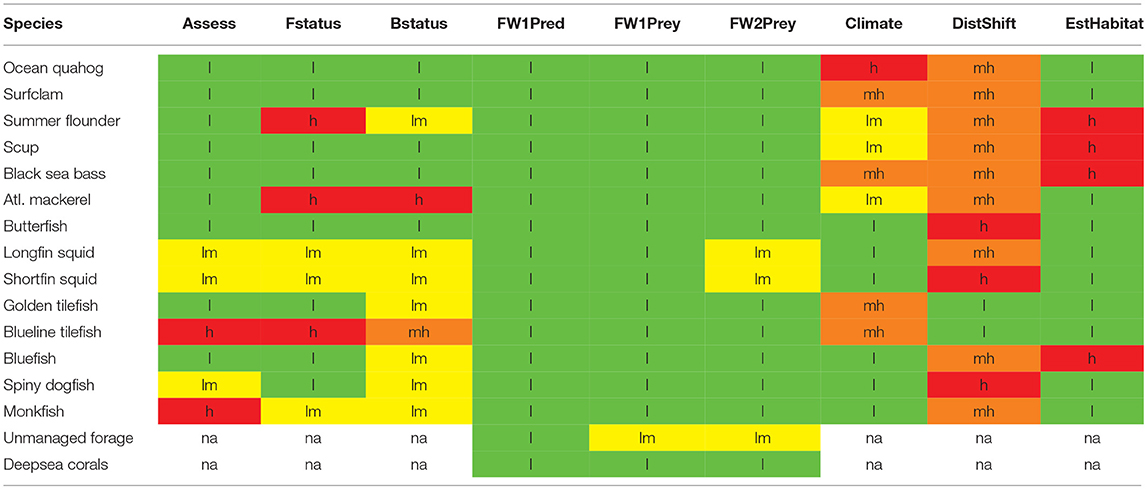
Table 3. Species level risk analysis results; l = low risk (green), lm = low-moderate risk (yellow), mh = moderate to high risk (orange), h = high risk (red).
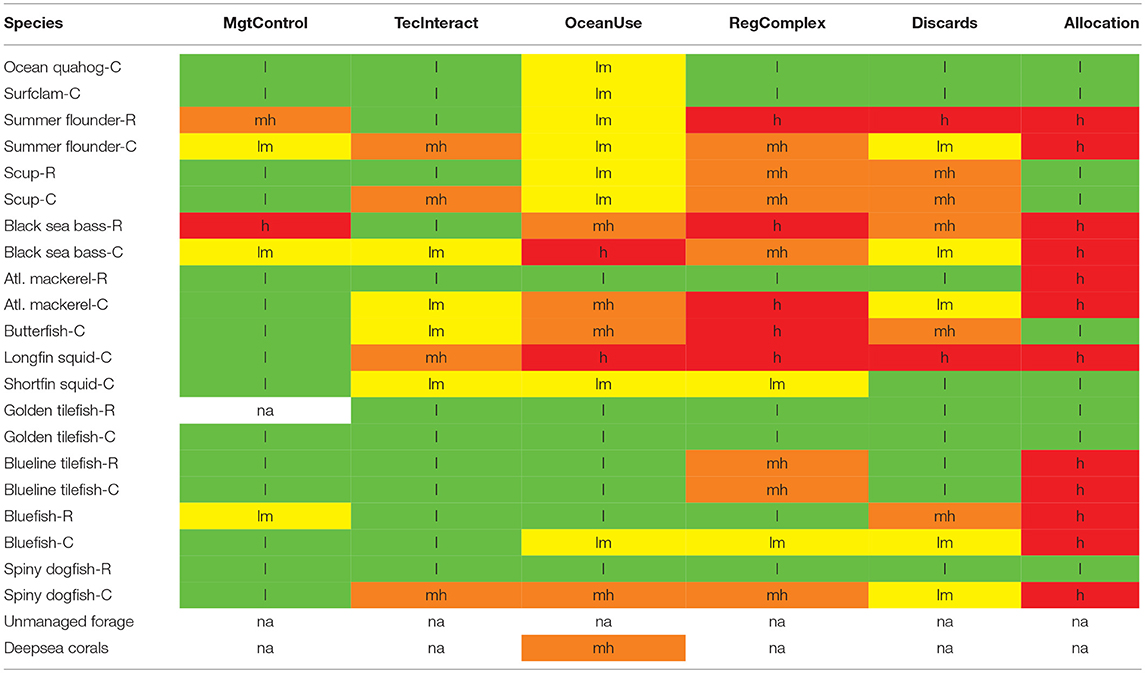
Table 4. Species and sector (C, commerical; R, recreational) level risk analysis results; l, low risk (green); lm = low-moderate risk (yellow), mh = moderate to high risk (orange), h = high risk (red).

Table 5. Ecosystem level risk analysis results; l = low risk (green), lm = low-moderate risk (yellow), mh = moderate to high risk (orange), h = high risk (red).
3.1. Ecological Elements
3.1.1. Assessment Performance
This element is applied at the species level. Other assessment-related risk elements (F status and B status) describe risks according to our best understanding of stock status, but assessment methods and data quality shape that understanding. This risk element addresses risk to achieving OY due to scientific uncertainty based on analytical and data limitations. The Council risk policy accounts for scientific uncertainty in assessments, with methods for determining scientific uncertainty currently being refined by the Council's Scientific and Statistical Committee (SSC). Ranking for this risk element will be adjusted in the future, if necessary, to ensure consistency with SSC methods.
Low risk for assessment performance was defined as stock assessment model(s) passing peer review, and stocks having high data quality. Low-Moderate risk was assessment passing peer review, but some key data and/or reference points are lacking. The Moderate-High risk category was not used for this element. High risk was the assessment failing peer review, and/or that considerable data shortcomings required the use of data-limited tools.
Stocks with low risk due to assessment performance include ocean quahog, surfclam, summer flounder, scup, black sea bass, Atlantic mackerel, butterfish, golden tilefish, and bluefish. Squids and dogfish are assessed with index-based assessment methods which rank low-moderate risk due to incomplete survey coverage in some years, and reference points for squids are lacking. The monkfish 2016 operational assessment was unable to model growth or population status due to innaccurate aging methods (Richards, 2016), so both northern and southern stocks rank high risk for this element. At present, blueline tilefish ranks as high risk for assessment type because it is assessed with the data limited methods toolkit (https://cran.r-project.org/web/packages/DLMtool/index.html; Carruthers et al., 2014).
3.1.2. Fishing Mortality and Biomass Status
These elements are applied at the species level. Because OY is the objective, and OY is at most MSY under U.S. law, fishing mortality (F) limit reference points are based on FMSY, while the stock biomass (B) target is biomass at MSY (BMSY). F and B status relative to established MSY-based target and limit reference points or proxies (Gabriel and Mace, 1999) from stock assessments therefore indicate the level of risk to achieving OY from either overfishing or stock depletion, respectively.
We applied low and high risk criteria for these elements as defined in U.S. law. Low risk criteria are F < FMSY and B > BMSY for an individual stock. High risk criteria are F > FMSY and B < 0.5 BMSY for an individual stock. The Council established the intermediate risk categories to address stocks with unknown status. Moderate-high risk was defined as unknown status in the absence of other information for both F and B. Low-moderate risk was defined as unknown status, but with a weight of evidence indicating low overfishing risk for F. Similarly, low-moderate risk for B was either 0.5 BMSY < B < BMSY or unknown status, but with a weight of evidence indicating low risk that the population is depleted.
Current assessment results for all Council managed stocks are summarized in Figure 1. Based on these results, F and B status are both in the low risk category for surfclams, ocean quahogs, scup, black sea bass, and butterfish. Bluefish, golden tilefish, and spiny dogfish F status is in the low risk category, and B risk is in the low-moderate risk category. Summer flounder F status is in the high risk category and B status is in the low-moderate risk category. F and B status for northern and southern monkfish stocks were formerly in the low risk categories, but a recent assessment update was unable to determine status, so they were provisionally ranked low-moderate risk (unknown but weight of evidence supports lower risk). Longfin squid B is above the established B threshold, and both squid stocks have unknown F status, but F is difficult to estimate because it is very low relative to natural mortality, so they were also ranked low-moderate risk. Blueline tilefish are high risk for F status and have unknown B status and little auxiliary information in the Mid-Atlantic region, and so rank moderate-high risk for B status. Finally, Atlantic mackerel has high risk for both F and B status.
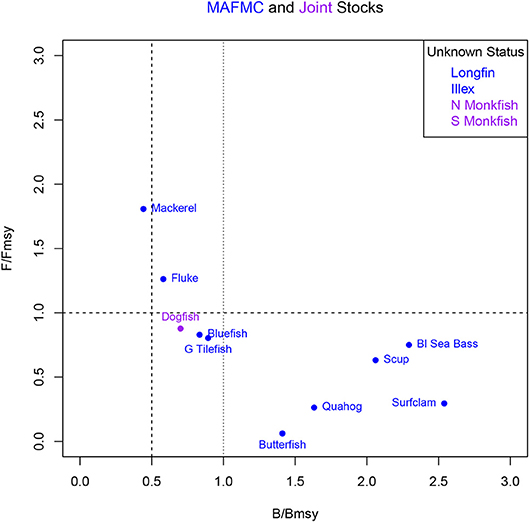
Figure 1. Summary of single species status for Mid-Atlantic Fishery Management Council (MAFMC) and jointly managed (Joint) stocks, based on the most recent stock assessment or assessment update for each stock (2017 unless otherwise noted): Mackerel (NEFSC, 2018), 2016 Fluke (summer flounder,http://www.mafmc.org/s/Summer_flounder_2015_Assess_Update.pdf), Dogfish (http://www.mafmc.org/s/2017-Status-Report-for-spiny-dogfish.pdf), Tilefish (http://www.mafmc.org/s/Golden_Tile_Assessment_Update2017-POPDY.pdf), 2015 Bluefish (NEFSC, 2015), Butterfish (http://www.mafmc.org/s/Butterfish-2017-Stock-Assessment-Update.pdf), Ocean quahog (NEFSC, 2017c), Scup (http://www.mafmc.org/s/5Scup_2017_Assesssment_Update.pdf), Black sea bass (NEFSC, 2017b), Surfclam (NEFSC, 2017a), Longfin squid (http://www.mafmc.org/s/Doryteuthis_update_April_2017.pdf), Illex squid (http://www.mafmc.org/s/Illex-illecebrosus_data_update_report_for_2017_MAFMC_SSC_ABC.pdf), Northern and Southern Monkfish (Richards, 2016).
3.1.3. Food Web (Council-Managed Predators)
This element is applied at the species level. This element ranks the risk of not achieving OY due to predatory interactions between Council managed species. To rank these risks, the “importance” of each species as a predator must be assessed. There are not clear standardized thresholds to define this. We used diet information to develop thresholds: an important predator of Council managed species can be defined as having more than a specified threshold level of Council managed species in the diet by weight.
The EOP Committee agreed that high dependence on a single prey represented high risk to a predator, but could not come to agreement on thresholds for intermediate risk levels, so this risk ranking uses only low and high levels. Low risk was defined as few interactions as predators of other Council managed species, or predator of other managed species below 50% of diet in aggregate. High risk was that a managed predator species was highly dependent on other Council managed species as prey (50%+ of diet).
Diet information was gathered from the Northeast Fisheries Science Center (NEFSC) food habits database and other sources (Johnson et al., 2008; Smith and Link, 2010). Surfclams and ocean quahogs are not predators of other Council managed species, so they rank low risk for this element. Similarly, scup, black sea bass, and golden and blueline tilefish eat primarily benthic invertebrates and rank low risk. Summer flounder, spiny dogfish, bluefish, and monkfish are predators of Council managed species, but do not meet the threshold of >50% of diet. Summer flounder prey on other Council managed species, including longfin and other squid, Atlantic mackerel, scup, and butterfish (not resolved in food web; combined diet >30%). Dogfish have ~20% of total diet from squids and mackerel, bluefish have ~25% of diet from butterfish, squids, bluefish, mackerel, and scup, and monkfish have ~20% of diet from squids, mackerel, summer flounder, scup, and monkfish. Therefore, these three predators rank low risk for food web interactions with other Council managed species.
3.1.4. Food Web (Council-Managed Prey)
This element has the same characteristics as the element above, but viewing the role of Council managed species as prey. Similar risk criteria were applied, with one addition. Low risk was assigned to prey comprising <50% of a predator diet. Low-moderate risk was that an otherwise vulnerable prey had management measures specifically considering its role as prey. High risk used the 50% threshold to determine that the managed species is sole prey and/or subject to high mortality due to other Council managed species.
The same diet data was used as above. Surfclams and ocean quahogs are not prey of other Council managed species, so they rank low risk for this element. Similarly, spiny dogfish, bluefish, monkfish, summer flounder, scup, black sea bass, and golden and blueline tilefish do not show up individually as >10% of prey by weight in any Council managed species diets, so they rank low risk. While some Council managed species are prey of other managed species, none meet the defined risk threshold, so all are ranked low risk. Atlantic mackerel is a prey of spiny dogfish (~10% of diet with high interannual variability). Butterfish is a prey of bluefish, but is below the threshold (~12% of diet), and the reference point applied to butterfish considers its role as a forage fish in general. Cephalopods, as a group, are prey of summer flounder (~33% of diet), with approximately half of this attributed to “Loligo species” in the diet data, very little to Illex species, and the rest as unidentified squid. Similarly, Cephalopods as a group are important prey of shortfin squid (>30% of diet), but how much of this is longfin squid is unknown, and some is cannibalism; therefore we rank this interaction low-moderate risk. Unmanaged forage (e.g., anchovies, sandlance, >50% of inshore diet) are important prey of bluefish, but Council measures restrict fishery development on these species so they rank low-moderate risk under this element.
3.1.5. Food Web (Protected Species Prey)
This element is applied at the species level. This element ranks the risks of not achieving protected species objectives due to species interactions with Council managed species. In the US, protected species include marine mammals (under the Marine Mammal Protection Act), Endangered and Threatened species (under the Endangered Species Act), and migratory birds (under the Migratory Bird Treaty Act). In the Northeast US, endangered/threatened species include Atlantic salmon, Atlantic and shortnose sturgeon, all sea turtle species, and five whales.
As above, food web models and diet information can be used to establish thresholds of “importance” for predators and prey. Although monkfish occasionally ingest seabirds (Perry et al., 2013), there are no Council-managed species that are important predators of protected species (Smith and Link, 2010), so here we rank only risks where Council managed species represent prey of protected species. An important prey of protected species is defined here as individually comprising >30% of the predator's diet by weight. Critical prey warranting a high risk ranking would be a majority (>50%) of diet for an individual protected species.
Risk ranking criteria for the multispecies protected species category were developed to address interactions across species. Low risk ranking criteria were few interactions with any protected species. Low risk was defined as few interactions with any protected species. Low-Moderate risk was a Council-managed species being important prey of 1–2 protected species, or important prey of 3 or more protected species with management consideration of the interaction. Moderate-High risk criteria was a Council-managed species being important prey of 3 or more protected species. Finally, High risk criteria was a Council-managed species being critical (>50%) prey for a protected species.
Diet information for protected species tends to be more uncertain than for fished species, and diet compositions are not reported to the species level, so we consider diet at the family level for these rankings. Atlantic salmon, both species of sturgeon, and sea turtles rarely if ever prey on Council managed species, as reviewed in the Council Forage Fish white paper (Shoop and Kenney, 1992; Burke et al., 1993, 1994; Johnson et al., 1997; McClellan and Read, 2007; Savoy, 2007; Seney and Musick, 2007). We restrict further analysis to marine mammal and seabird prey. Longfin squids are estimated to comprise >30% of diet for one protected species, pilot whale, in the Northeast US (Gannon et al., 1997; Smith et al., 2015), therefore we rank this species low-moderate risk for this element. Shortfin squid were identified as important prey for two pelagic seabirds in the Northeast US (Powers and Backus, 1987), and therefore ranked low-moderate risk. Unmanaged forage fish such as sand lance and saury were identified as important prey for >3 seabird species in the Northeast US (Powers and Backus, 1987), as well as gray seals (Smith et al., 2015). The Council has enacted measures to restrict fishing on unmanaged forage species, such that they rank low-moderate risk for this element. All other Council-managed species do not meet the threshold of important prey of protected species based on available information for marine mammal diets in the Northeast US (Smith et al., 2015), and seabird diets (Powers, 1983; Powers and Backus, 1987; Powers and Brown, 1987; Schneider and Heinemann, 1996; Barrett et al., 2007; Bowser et al., 2013), so they rank low risk for this element.
3.1.6. Ecosystem Productivity
This element is applied at the ecosystem level (the Mid-Atlantic Ecosystem Production Unit, Figure 2). This element ranks the risk of not achieving OY due to changes in ecosystem productivity at the base of the food web. A combination of four indicators are used to assess risk of changing ecosystem productivity. We examine trends in total primary production, zooplankton abundance for a key Mid-Atlantic species, and two aggregate fish productivity measures: condition factor (weight divided by length of individual fish) and a survey based “recruitment” (small fish to large fish) index. Because benthic crustaceans are important prey for many Council-managed species, we note a benthic production indicator is desirable but not yet available.
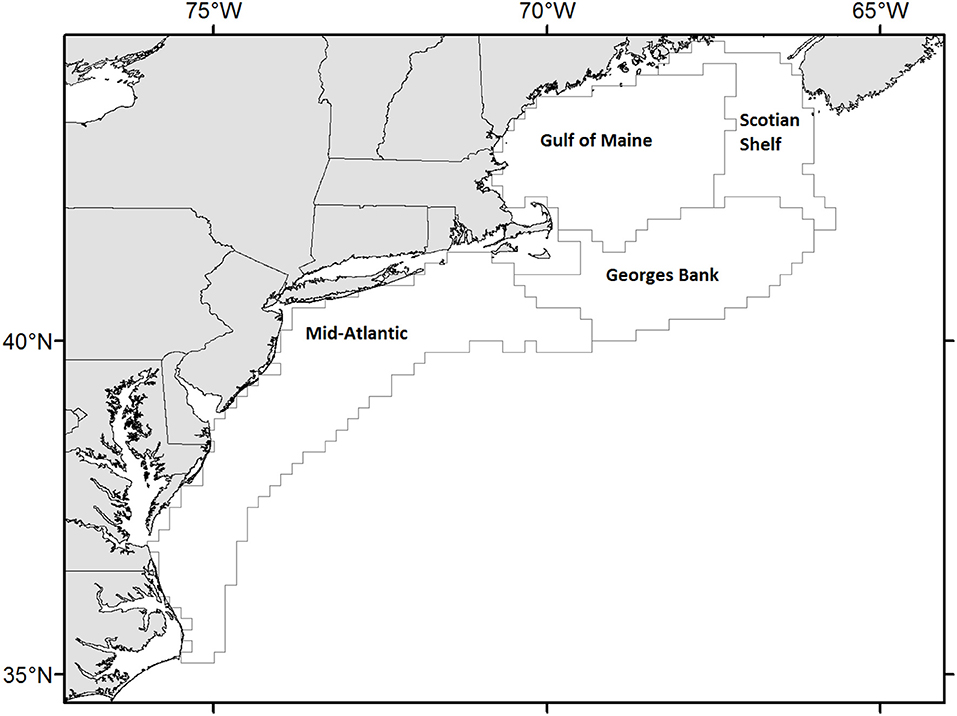
Figure 2. Ecosystem production units Defined for the northeast US shelf (see https://noaa-edab.github.io/tech-memo/epu.html).
Low risk for this element was defined as no trends in ecosystem productivity across all four indicators. The Low-Moderate risk criterion was trend(s) in ecosystem productivity for 1–2 indicators, whether increasing or decreasing. The Moderate-High risk criterion was trends in ecosystem productivity (3+ measures, increase or decrease). The High risk criterion was decreasing trends across all 4 indicators.
3.1.6.1. Primary production
Primary production has fluctuated recently with current conditions near average (Figure 3, top left). The observed stability in system productivity is in contrast to an apparent shift in the timing of the bloom cycle in the Mid-Atlantic. Comparing remote sensing information from the 1970–80s to 1997–2015 information suggests that winter productivity was historically higher in the MAB and that the spring bloom we see today was less prominent. Shifts in timing of low trophic level production can affect Council managed fish species through early life history stages that feed on zooplankton.
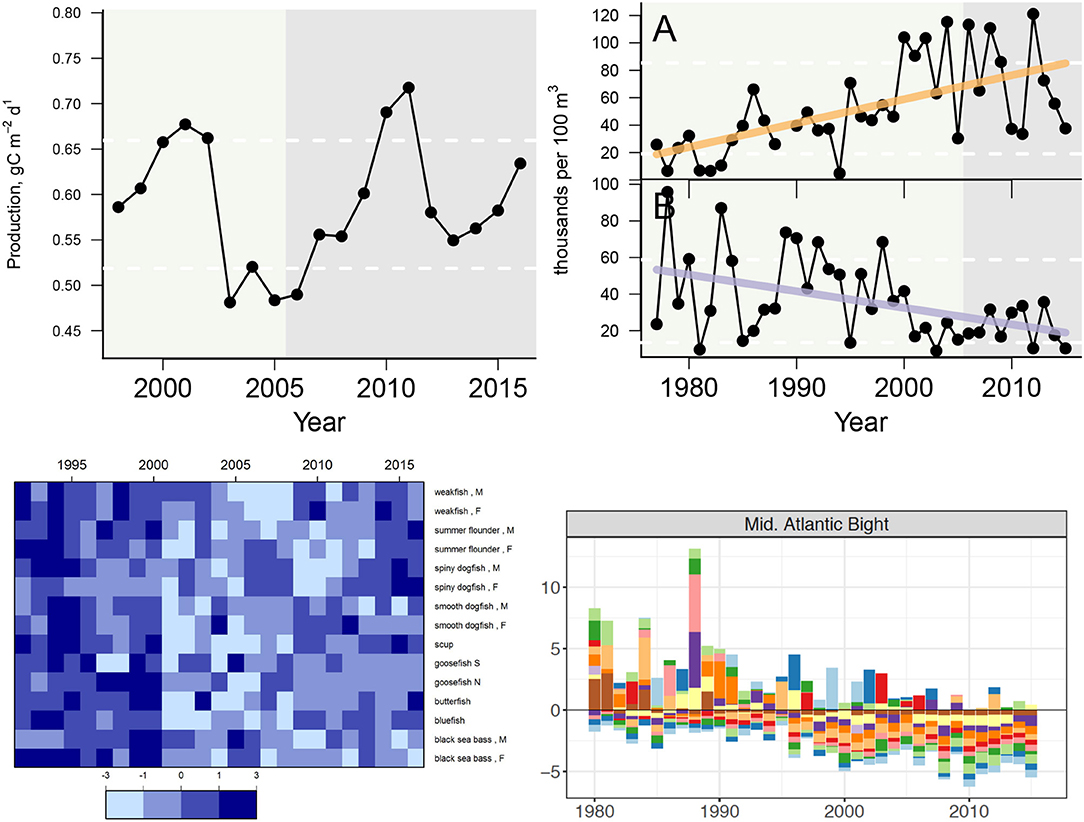
Figure 3. Primary production in the Mid Atlantic Bight (Top right); A: Centropages typicus spring, B: Centropages typicus fall, where light orange trendlines indicate significant long term increases and light purple trendlines indicate significant long term decreases (Top left); Fish condition, proportional weight/length anomaly from that predicted by growth curves, where (Bottom right); Fish productivity: Anomalies of recruit abundance per spawner biomass for species in the Mid-Atlantic Bight. Annual anomalies shown are the average of spring and fall anomalies. Colors indicate anomalies for individual species: light blue=black sea bass, dark blue=butterfish, light green=clearnose skate, dark green=fourspot flounder, pink=little skate, red=scup, light orange=dogfish, dark orange=summer flounder, light purple=thorny skate, dark purple=windowpane, yellow=winter flounder, brown=winter skate (Bottom left).
3.1.6.2. Zooplankton abundance
The time series of zooplankton biovolume suggest that overall zooplankton production has not changed over time. However, the dominant species of zooplankton in the Mid-Atlantic, Centropages typicus, shows a seasonal shift in abundance (Figure 3, top right). This suggests a change in timing of zooplankton reproductive cycles, which may impact fish species such as Atlantic mackerel.
3.1.6.3. Fish condition
Fish condition is measured as the weight per length–a measure of “fatness.” This information is from NEFSC bottom trawl surveys and shows a change in condition across all species at around 2000 (Figure 3, bottom left). Around 2010–2013 many species started to have better condition, though black sea bass remain thinner for their length on average.
3.1.6.4. Fish productivity
The number of small fish relative to the biomass of larger fish of the same species, as derived from the NEFSC survey, is a simple measure of productivity intended to complement model-based stock assessment estimates of recruitment. There is a general decrease in this indicator when aggregated across managed and unmanaged species in the Mid-Atlantic (Figure 3, bottom right). The plot includes black sea bass, butterfish, clearnose skate, fourspot flounder, little skate, scup, spiny dogfish, summer flounder, thorny skate, windowpane flounder, winter flounder, and winter skate.
To summarize, primary production shows no trend (although the seasonal timing of primary production may be changing). Similarly, there are no trends in overall zooplankton abundance, but a dominant Mid-Atlantic species shows different trends by season, possibly also indicating a shift in timing. Fish condition showed a drop across all species in the early 2000s, but most species appear to have recovered. There is a significant decreasing trend in aggregate numbers of small fish per large fish (Figure 3). This one clear trend, along with changes in timing at lower trophic levels, suggest a low-moderate risk of changing ecosystem productivity in the Mid-Atlantic ecosystem.
3.1.7. Climate
This element is applied at the species level. Risks to species productivity (and therefore to achieving OY) due to projected climate change in the Northeast US were evaluated in a comprehensive assessment (Hare et al., 2016). This assessment evaluated exposure of each species to multiple climate threats, including ocean and air temperature, ocean acidification, ocean salinity, ocean currents, precipitation, and sea level rise. The assessment also evaluated the sensitivity (not extinction risk) of each species based on habitat and prey specificity, sensitivity to temperature and ocean acidification, multiple life history factors, and number of non-climate stressors. This assessment is intended to be conducted iteratively, so these results can be updated in the future.
All Council-managed species were either highly or very highly exposed to climate risk, and range from low to very high sensitivity to expected climate change. The combination of exposure and sensitivity results in the overall vulnerability ranking. We applied those climate vulnerability rankings directly here as risk ranking criteria.
Low risk ranking was defined as a low climate vulnerability ranking. Low-Moderate risk was a moderate climate vulnerability ranking. Moderate-High risk was a high climate vulnerability ranking. High risk was a very high climate vulnerability ranking.
While this risk assessment focuses on overall vulnerability to impacts of climate, not all impacts will be negative. Some Council managed species, including black sea bass, bluefish, butterfish, longfin squid, and shortfin squid, may benefit from projected future climate conditions (Hare et al., 2016).
3.1.8. Distribution Shifts
This element is applied at the species level. Species distribution shifts can increase risks of ineffective spatial catch allocation; if catch allocation is greatly mismatched with species distribution OY may not be achieved. Risks of species distribution shifts due to projected climate change in the Northeast US were assessed in a comprehensive assessment (Hare et al., 2016). We applied those distribution shift risk rankings directly here, as explained above. In addition, changes in species distribution are monitored using fisheries independent bottom trawl surveys. Two distribution shift indicators are derived from these surveys: kernel density plots of recent distribution compared with 1970s distribution, and time series of the along shelf position of the center of distribution.
All Council-managed species, with the exception of golden tilefish, had either high or very high risk of distribution shifts in the Northeast US.
3.1.8.1. Historical vs. current distribution
Spatial distribution has changed over time for some species more than for others. The distribution of black sea bass, as measured by NEFSC surveys, has shifted northward relative to historical distributions. In contrast, the distribution of longfin squid in the Mid-Atlantic has remained relatively stable. A full suite of these maps is available at http://www.nefsc.noaa.gov/ecosys/current-conditions/kernel-density.html.
3.1.8.2. Changes in along shelf position
As reported semi-annually by NEFSC, “the annual centroid of a species' distribution can be characterized by the position in the ecosystem along an axis oriented from the southwest to the northeast, referred to as the along shelf distance, and by depth. Along shelf distances range from 0 to 1,360 km, which relates to positions along the axis from the origin in the southwest to the northeast (https://www.nefsc.noaa.gov/ecosys/current-conditions/species-dist.html).” The mean annual along shelf distance for several Council-managed species is shown; most are consistent with theoretical predictions (Hare et al., 2016) and, aside from squids, show a northeastward change in distribution (Figure 4). Mean depth has not changed significantly for these species. Information for more species is available at the website above.
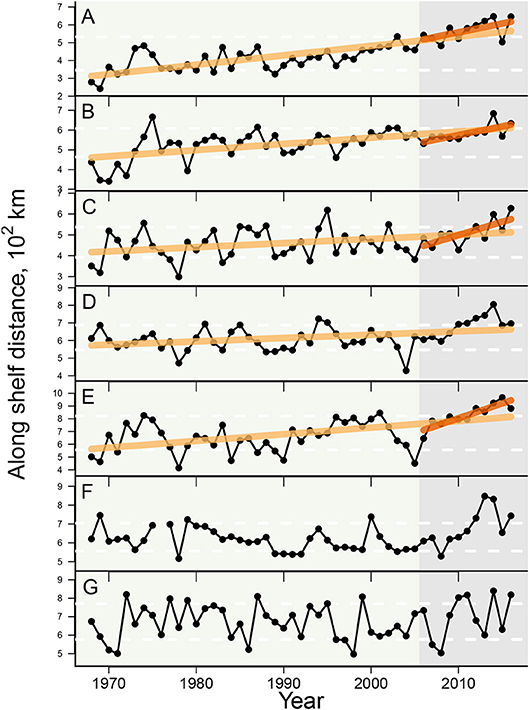
Figure 4. Shifts in species distribution over time, where light orange trendlines indicate significant long term increases, and dark orange trendlines indicate significant recent (10 year) increases. Points are derived from fishery-independent bottom trawl survey data collected by the Northeast Fisheries Science Center,and represent the mean distance in km of the population centroid from the southwest origin of the along-shelf axis at 0 km. The along-shelf axis runs from 76.53 degrees W 34.60 degrees N to 65.71 W 43.49 N. (see https://www.nefsc.noaa.gov/ecosys/current-conditions/species-dist.html); (A) Black sea bass, (B) Summer flounder, (C) Scup, (D) Butterfish, (E) Atlantic mackerel, (F) Longfin squid, (G) Shortfin squid.
3.1.9. Estuarine and Coastal Habitat
This element is applied at the species level. Risk of not achieving OY due to threats to estuarine and nearshore coastal habitat/nursery grounds (estuarine) was determined by first evaluating the estuarine dependence of species, and then by enumerating threats to the estuarine habitat required by these species. An assessment of national coastal and estuarine condition was used in this assessment. Water and habitat quality assessments produced for Chesapeake Bay, Delaware Bay, Long Island Sound, and other coastal estuaries can be considered in the future.
Species were defined as low risk if not dependent on nearshore coastal or estuarine habitat. Low-Moderate risk were estuarine dependent species with a stable estuarine condition. Moderate-High risk were estuarine dependent species with a fair estuarine condition. High risk were estuarine dependent species with a poor estuarine condition.
The National Coastal Condition Assessment for the Northeast US (US EPA, 2012) was used to evaluate estuarine and coastal condition. This report lists water, sediment, benthic, and coastal habitat quality as well as fish contamination. Coastal waters in the Mid-Atlantic region rated fair to poor for water quality, fair for sediment quality, poor for benthic quality, good to fair for coastal habitat, and fair to poor for fish contamination. These ratings were based on 2003–2006 nearshore and estuarine summer sampling. Although the overall coastal condition was rated fair for the entire region, this includes offshore conditions which the Council intended to address separately (see next section). Therefore, estuarine dependent species (summer flounder, scup, black sea bass, and bluefish; Able, 2005) were ranked high risk based on overall poor estuarine condition, and all others were ranked low risk due to lower dependence on this habitat type.
3.1.10. Offshore Habitat
This element is applied at the species level. The risk of achieving OY due to changes in offshore habitat quality and quantity can be assessed using trends derived from species-specific habitat modeling. Because the habitat index was still being studied and improved, habitat risk rankings based on this were considered preliminary by the EOP, and were not included in the risk assessment (see Supplement for details).
3.2. Economic Elements
3.2.1. Commercial Revenue
This element is applied at the ecosystem level, and addresses the risk of not maximizing fishery value. Revenue serves as a proxy for commercial profits, which is the component of a fishery's value that this element is ultimately attempting to assess risk toward. Lack of cost information across all fleet segments precludes the assessment of risk to profitability itself at the ecosystem level.
Low risk was defined as no trend and low variability in revenue. Low-Moderate risk was increasing or overall high variability in revenue. Moderate-High risk was a significant long-term revenue decrease. High risk was a significant recent decrease in revenue.
Aggregate commercial revenue for Council-managed species was calculated (Figure 5, Upper left). Consistent with other published work (Gaichas et al., 2016; Figures 2, 3) there is a long term significant decrease in revenue, indicating moderate-high risk to commercial fishery profit.
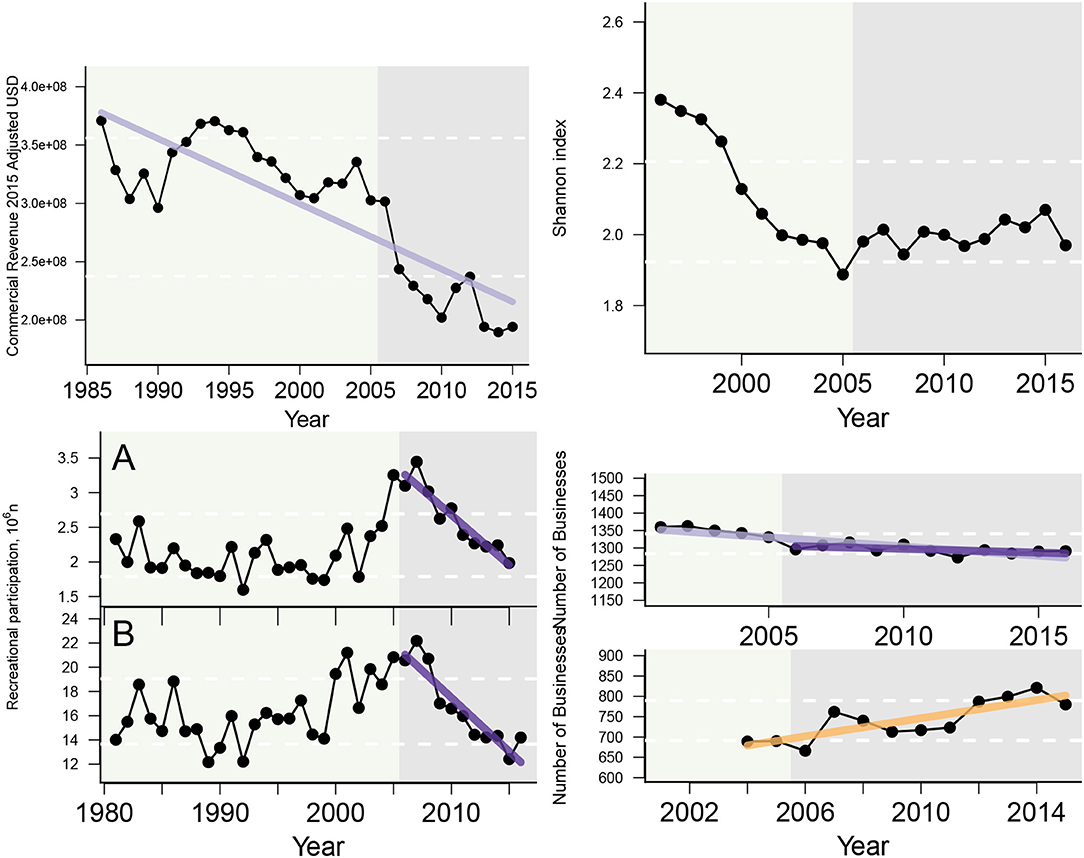
Figure 5. Economic indicators: light purple trendlines indicate significant long term decreases, dark purple trendlines indicate significant recent (10 year) decreases, and light orange trendlines indicate significant long term increases. Aggregate Mid-Atlantic managed species revenue (Top left); Diversity in species revenue (Top right); Recreational participation: (A) number of anglers, (B) number of trips (Bottom left); Shoreside support businesses: Number of Companies (upper, bottom right) and Number of Nonemployer entities (lower, bottom right).
3.2.2. Marine Recreational Angler Days/Trips
This element is assessed at the ecosystem level where it applies equally to all recreationally fished species. Providing recreational opportunities is a stated goal of optimal fishery management under the legal definition of “benefits to the nation.” Recreational fishing is important in the Mid-Atlantic region with the economic and social aspects of many coastal communities being highly dependent on recreational fishing. Angler days and trips are the proxy indicators for the value generated from recreational fishing. Low risk was defined as no trend and low variability in angler days/trips. Low-Moderate risk was increasing variability or overall high variability in angler days/trips. Moderate-High risk was significant long-term decreases in angler days/trips. High risk was significant recent decreases in angler days/trips.
Both trends and interannual variability in recreational participation are affected by economic drivers including human population growth, changes in disposable income and generational shifts in leisure time preferences, management actions such as species bag limits, fish population availability, and a host of other issues that affect how people choose to spend their time. Although there is an overall long-term trend of increasing recreational fishery participation in terms of number of angler days, the most recent 10 years has shown a striking decline in both recreation indices (Figure 5, Lower left). These significant recent decreases in number of anglers and number of trips indicate high risk to recreational value generated from the species with substantial recreational fisheries (summer flounder, scup, black sea bass, bluefish).
3.2.3. Commercial Fishery Resilience (Revenue Diversity)
This element is applied at the ecosystem level, and addresses the potential risk of reduced commercial fishery business resilience by evaluating species diversity of revenue at the permit level.
Low risk was defined as no trend and low variability in the diversity measure. Low-Moderate risk was increasing or overall high variability in the diversity measure. Moderate-High risk was a significant long term decrease in the diversity measure. High risk was a significant recent decrease in the diversity measure.
This diversity index is the average effective Shannon index for species revenue at the permit level, for all permits landing any amount of Council-managed species within a year (including both monkfish and spiny dogfish). Although the exact value of the effective Shannon index is relatively uninformative in this context, the major change in diversity seems to have occurred in the late 1990's, with much of the recent index relatively stable.
This index shows no significant trend, which would suggest a low risk to fishery business resilience based on diversity in species revenue (Figure 5, Upper right).
3.2.4. Commercial Fishery Resilience (Shoreside Support)
This element is applied at the ecosystem level, and ranks the risk of reduced fishery business resilience due to shoreside support infrastructure by examining the number of shoreside support businesses.
Low risk was defined as no trend and low variability in the number of shoreside support businesses. Low-Moderate risk was increasing variability or overall high variability in shoreside support businesses. Moderate-High risk was a significant recent decrease in one measure of shoreside support businesses. High risk was a significant recent decrease in multiple measures of shoreside support businesses.
The number of shoreside support businesses were tallied for all Mid-Atlantic states in two categories: number of companies (Quarterly Census of Employment and Wages. Obtained September 27, 2017. US Department of Labor, Bureau of Labor Statistics. https://www.bls.gov/cew/home.htm) and number of non-employer entities Nonemployer Statistics.” Obtained September 28, 2017. U.S. Census Bureau. https://www.census.gov/programs-surveys/nonemployer-statistics.html), which we consider separately. Nonemployer entities are businesses that have no paid employees (i.e., entrepreneurs, or the owner is the workforce), while the shoreside support companies include all businesses with paid employees. Some state level data was not included due to confidentiality. The number of shoreside support companies include seafood merchant wholesalers, seafood product preparation and packaging, and seafood markets across all Mid-Atlantic states. The indicator shows a significant long-term and short-term decrease, which represents moderate-high risk to fishery resilience. The number of non-employer entities, including seafood preparation and packaging and seafood markets, shows a long-term increase (Figure 5, Lower right). Data from other shoreside fishery supporting businesses, such as gear manufacturers and welding companies, are not included here due to aggregation of the statistics across non-fishing industries (e.g., net manufacturers combined with all other businesses).
3.3. Social-Cultural Elements
3.3.1. Fleet Diversity
This element is applied at the ecosystem level, and ranks the risk to maintaining equity in access to fishery resources. Two indicators of commercial fleet diversity, including the number of distinct fleets and diversity of revenue across fleets are used in combination to evaluate current fleet diversity throughout the Mid-Atlantic region.
Beyond equity concerns, maintaining diversity can provide the capacity to adapt to change at the ecosystem level for dependent fishing communities, and can address objectives related to stability. Below are diversity estimates for fleets landing Council-managed species. This measure identifies the diversity in revenue generated by different fleet segments. A fleet is defined here as the combination of gear (Scallop Dredge, Other Dredge, Gillnet, Hand Gear, Longline, Bottom Trawl, Midwater Trawl, Pot, Purse Seine, or Clam Dredge) and vessel length category (<30 ft, 30 to 50 ft, 50 to 75 feet, 75 ft and above).
Low risk was defined as no trend and low variability in the diversity measure. Low-Moderate risk was increasing variability or overall high variability in the diversity measure. Moderate-High risk was a significant long-term decrease in the diversity measure. High risk was a significant recent decrease in the diversity measure. A declining trend in diversity indicates a less diverse fleet is currently active in Council-managed fisheries. However, it cannot distinguish whether specialization (by choice), or alternatively stovepiping (constrained choices), is occurring, rather merely that the fleet composition is changing, which might warrant additional scrutiny. There is a long term decrease in the fleet count metric (Figure 6, top panel). Therefore, this element ranks moderate-high risk. The number of fleets in the Mid-Atlantic seems to be negatively correlated to the revenue diversity metric in the most recent 5 years, which indicates that the latter results are being dominated by changes in the distribution of revenue across fleets, as opposed to the number of active fleets.
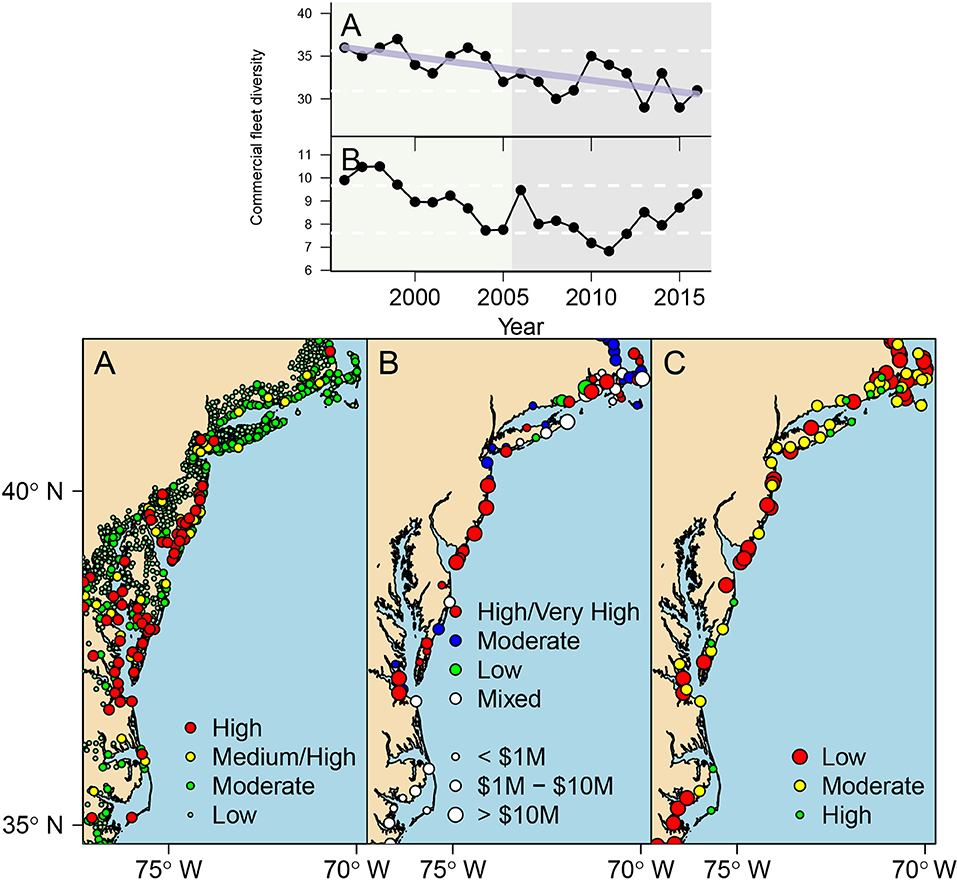
Figure 6. Fishing community resilience: light purple trendlines indicate significant long term decreases. Fleet diversity measures (A) fleet count (the number of distinct fleets, see text for fleet definitions), (B) diversity of revenue across fleets (Top); (A) risks from sea level rise, (B) reliance on climate-vulnerable species, (C) catch diversity (Bottom).
3.3.2. Community Vulnerability
This element is applied at the ecosystem level. The NOAA Fisheries Community Social Vulnerability Indicators (CSVIs; Jepson and Colburn, 2013) are statistical measures of the vulnerability of communities to events such as regulatory changes to fisheries, wind farms, and other ocean-based businesses, as well as to natural hazards, disasters, and climate change. The CSVIs currently serve as indicators of social vulnerability, gentrification pressure vulnerability, commercial and recreational fishing dependence (with dependence being a function of both reliance and engagement), sea level rise risk, species vulnerability to climate change, and catch composition diversity. We use a combination of these five indicators for the most fishery dependent communities to evaluate overall social risk levels.
Below is a brief description for each vulnerability category based on the NOAA social indicator study (Jepson and Colburn, 2013; Colburn et al., 2016):
• Fishing dependence indices portray the importance or level of dependence of commercial or recreational fishing to coastal communities.
• Social vulnerability indices represent social factors that can shape either an individual or community's ability to adapt to change. These factors exist within all communities regardless of the importance of fishing.
• Gentrification pressure indices characterize those factors that, over time may indicate a threat to commercial or recreational working waterfront, including infrastructure.
Here, we define gentrification in fishing communities as described by Colburn and Jepson (2012), where coastal population growth combined with an influx of higher-income people seeking waterfront property can increase property values and displace working-class residents engaged in resource-dependent activities. “Three common elements of gentrification are reuse of waterfront structures, construction of new housing, and growth within the services sector (Colburn and Jepson, 2012).”
Communities are ranked as high, medium high, moderate, or low relative to the respective indicator (Table 6). Community dependence on commercial and recreational fishing is mixed, with notably more communities in the Mid-Atlantic dependent on recreational fishing. While communities with high to medium high risk for social vulnerability are broadly distributed in suburban and rural areas of the Mid-Atlantic region, communities with high to medium high gentrification pressure are concentrated in beachfront communities near urban areas in New York and New Jersey.
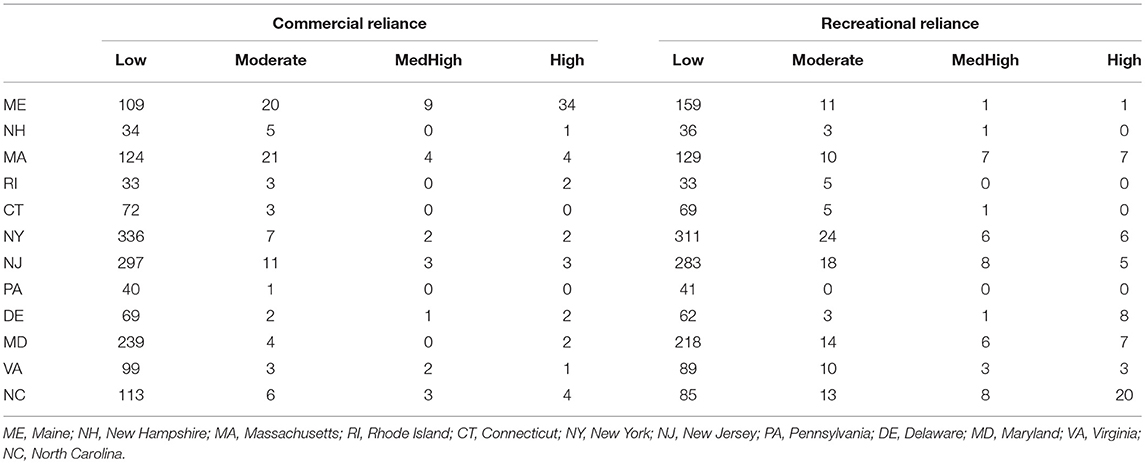
Table 6. Number of communities at each level of commercial (left) and recreational (right) reliance.
The social and economic impacts of climate change have been modeled through application of social indicators of fishing dependent communities (Jepson and Colburn, 2013). Assessment of a range of social indicators has been applied in the Mid-Atlantic Region to predict vulnerability of communities to regulatory changes and disasters. More recently this methodology has been extended to include specific indicators of vulnerability to climate change and linked to species vulnerability assessments (Colburn et al., 2016; Hare et al., 2016). The tools developed through this approach are vital to an evaluation of the risks of climate change facing coastal communities dependent on fishing. Below is a description of the CSVIs related to climate change.
• Sea level rise index is a measure of the overall risk of inundation from sea level rise based on community area lost from one to six foot level projections over the next ~90 years. A high rank indicates a community more vulnerable to sea level rise.
• Species vulnerability is measured by the proportion of community fish landings attributed to species vulnerable to climate change.
• Catch composition diversity is the relative abundance of species landed in a community. It is measured by Simpson's Reciprocal Index, and a higher index value indicates greater diversity. Communities with a diverse array of species landed may be less vulnerable to climate change.
Sea level rise is predicted to have variable impacts on coastal communities. The Mid-Atlantic region has a 3–4 times higher than global average sea level rise rate (Sallenger et al., 2012). Mid-Atlantic communities clustered around the Chesapeake Bay area and the New Jersey shore had especially high vulnerability to sea level rise (Figure 6). These vulnerabilities include infrastructure (docks, marinas, bait shops, gear storage) and access to shore-based facilities due realignment of coastal communities.
Mid-Atlantic fishing communities with total landings value of $100,000 or more were mapped for their dependence on species vulnerable to climate change and catch composition diversity (Simpson Reciprocal Index). A number of communities in southern New Jersey, Maryland and Virginia are highly dependent on species such as clams that are highly vulnerable to climate change while displaying low catch composition diversity. Communities with this situation are considered more vulnerable to climate change in general.
While the maps provide an overview of the social and climate indicator results for the Mid-Atlantic coastal communities, Table 7 identifies Mid-Atlantic communities that are most highly dependent on both commercial and recreational fishing. The varying vulnerability level to social factors, gentrification pressure, and climate change in these communities provide a more comprehensive profile and should be taken into account in the decision making process for fishery management.
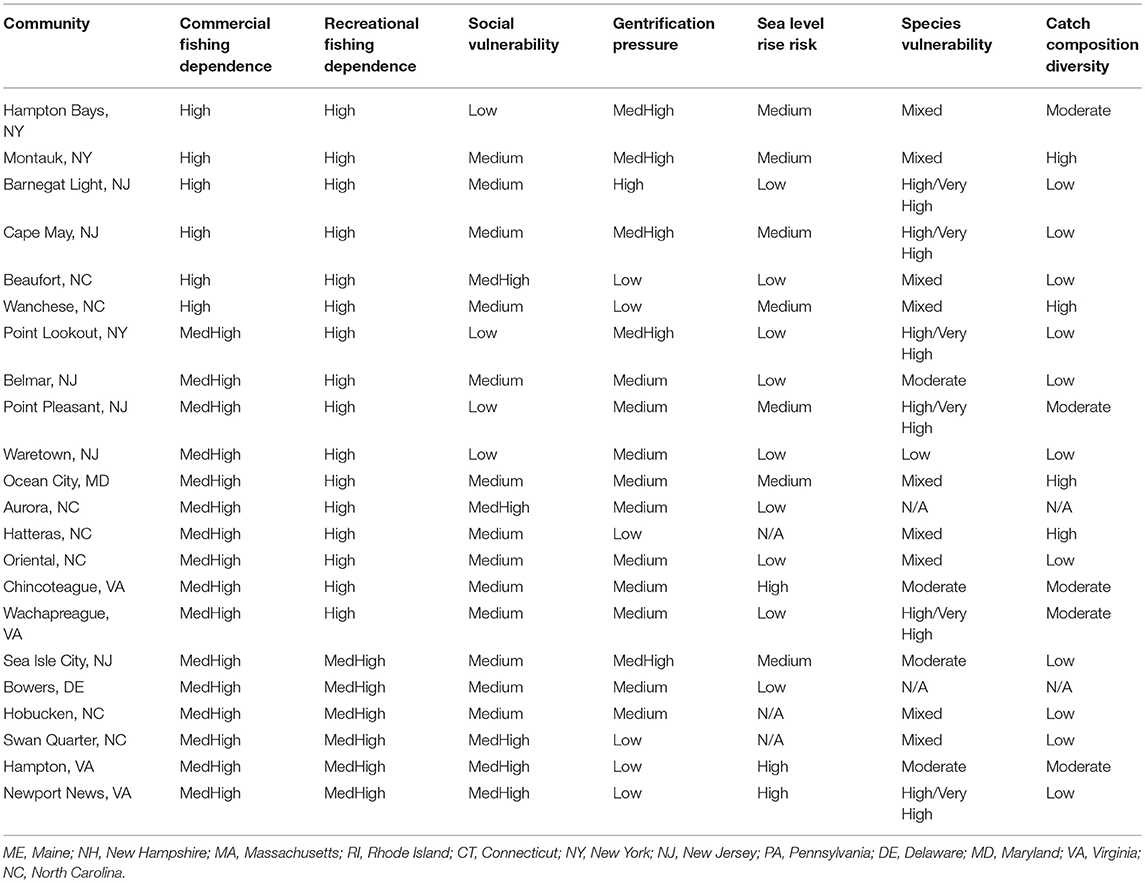
Table 7. Selected Mid-Atlantic Fishing Communities with Medium High to High Dependence on both Commercial and Recreational Fishing.
To estimate “high” vulnerability across all current indicators (which are ranked on different scales), we tallied rankings from Table 7 of MedHigh or High for social vulnerability and gentrification pressure, along with rankings of High risk from sea level rise, High/Very High species vulnerability, and rankings of Low catch composition diversity. We considered a majority (3 or more out of 5) to represent high risk to a community overall because with only 5 indicators, this means that a majority (60–100%) of the individual indicators were high risk. Low risk ranking was defined as few (<10%) vulnerable fishery dependent communities with 3 or more high vulnerability rating. Low-Moderate risk was 10–25% of fishery dependent communities with 3 or more high vulnerability ratings. Moderate-High risk was 25–50% of fishery dependent communities with 3 or more high vulnerability ratings. High risk was a majority (>50%) of fishery dependent communities with 3 or more high vulnerability ratings.
Four communities (20%) have three or more of these high risk rankings, so we rank overall social-cultural risk as low-moderate for these Mid-Atlantic communities.
More information on Northeast coastal communities is available here: https://www.nefsc.noaa.gov/read/socialsci/communitySnapshots.php
3.4. Food Production Elements
3.4.1. Commercial Seafood Production
This element is applied at the ecosystem level, and describes the risk of not optimizing domestic seafood production from Council-managed species. Commercial seafood landings (as opposed to total landings which include bait and industrial uses) were used to assess seafood provision.
Low risk ranking was defined as no trend, or an increase in seafood landings. Low-Moderate risk was increasing or high variability in seafood landings. Moderate-High risk was a significant long-term decrease in seafood landings. High risk was a significant recent decrease in seafood landings.
Commercial seafood landings from Council managed species were assembled (Figure 7, Left). Because this is total landings, years prior to 1977 include foreign landings (in particular, of Atlantic mackerel, which account for much of the observed spike). Recent landings are all domestic fisheries. Looking across all regions, there is a significant recent decrease in seafood landings, indicating high risk to regional domestic seafood production.
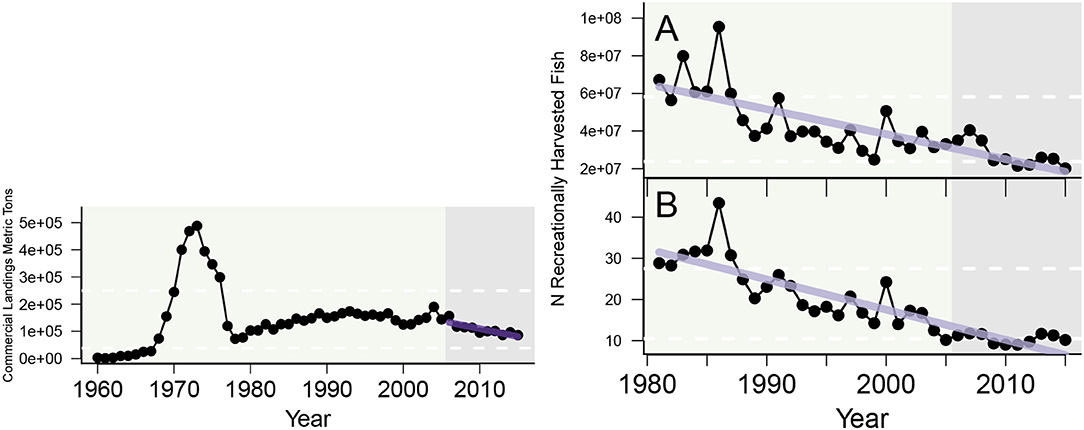
Figure 7. Seafood production indicators: light purple trendlines indicate significant long term decreases, and dark purple trendlines indicate significant recent (10 year) decreases. Aggregate Mid-Atlantic managed species commercial landings (Left) ; (A) Total recreational harvest, (B) Harvest per angler (Right).
3.4.2. Recreational/Subsistence Food Production
This element is applied at the ecosystem level, and describes the risk of not maintaining personal food production. Recreational seafood landings (as opposed to total catch which includes catch and release that are captured under other Risk Elements/indicators) were used to assess food use of recreationally caught fish. Low risk was defined as no trend, or an increase in recreational seafood landings. Low-Moderate risk was increasing or high variability in recreational seafood landings. Moderate-High risk was a significant long-term decrease in recreational seafood landings. High risk was a significant recent decrease in recreational seafood landings.
Total recreational harvest (all species) and harvest per angler were evaluated indicators in the Mid-Atlantic region (Figure 7, Right).
This significant long term decrease in both recreational landings and recreational landings per angler represents a moderate-high risk to recreational food production.
3.5. Management Elements
3.5.1. Fishing Mortality Control
This element is applied at the species and sector (commercial and recreational) level, and addresses the level of management control in terms of catch estimation (measurement) and monitoring to prevent overfishing. Adequate management control indicates a low risk of overfishing, while poor management control indicates a higher risk of overfishing and hence not achieving OY. Actual catch is compared with the specified Acceptable Biological Catch (ABC, a reduction from MSY based on scientific uncertainty to ensure <50% probability of overfishing; Prager and Shertzer, 2010) over the most recent 5 year history of the fishery.
The ability to control total catch within the ABC is necessary to prevent overfishing (F in excess of FMSY), which is a fundamental requirement of US fisheries law. Chronic or persistent overfishing can lead to stock depletion and ultimately to a stock being declared as overfished (B < 0.5 BMSY) and requiring a stock rebuilding plan. The ability to constrain catch is a function of the efficacy of the catch monitoring program for each species which relies on both proactive (in-season closure) and reactive (pay backs for overages in subsequent years) accountability measures (AMs). Under certain circumstances, specification of management measures which are too strict could lead to “underfishing” (not achieving the desired quota) and hence not achieving OY.
This element was evaluated by fishery sector (commercial and recreational). For the commercial fishery, NMFS dealer data in conjunction with estimates of dead discards are used to compare the annual catch target to actual annual catch. For the recreational sector, Marine Recreational Information Program (MRIP) estimates of recreational landings and dead discards are used to compare the annual catch target to actual annual catch estimates. Small overages are defined as <5%, moderate as 5–10%, and significant overages as >10%. For both sectors, low risk was defined as no history of overages. Low-moderate risk was small but infrequent overages. Moderate-high risk was routine, but small-moderate overages, and high risk was routine, significant overages.
Both surfclam and ocean quahog were low risk because they are well within recent quotas and are managed as ITQ fisheries. Recreational fisheries for scup, Atlantic mackerel, blueline tilefish, and spiny dogfish and commercial fisheries for scup, mackerel, butterfish, longfin squid, shortfin squid, golden and blueline tilefish, bluefish, and spiny dogfish were also low risk with no overages for the past 5 years and generally sufficient measures are in place to avoid overages. Recreational golden tilefish was unranked because there are no catch and landings limits associated with the recreational fishery which appears to be a minor component of total removals. Recreational bluefish and commercial summer flounder and black sea bass fisheries were low-moderate risk with catches always within <2% of quota and limits exceeded by <5% twice in the past 5 years. Recreational summer flounder ranked moderate-high risk with highly variable performance relative to catch limits with two minor harvest limit overages between 2012 and 2016. Recreational black sea bass was ranked high risk because catch limits were exceeded substantially in all of the past 5 years.
3.5.2. Technical Interactions
This element is applied at the species and sector (commercial and recreational) level, and addresses the risk of not achieving OY due to interactions with non-Council-managed species, including protected species. Here the risk is caused by negative consequences from fishing activity regulated under Council FMPs which interacts with species managed by other agencies, including bycatch of protected species. For example, interactions with species protected under the U.S. Marine Mammal Protection Act (MMPA) could result in greater restrictions in Council managed fisheries, increasing the risk that OY would not be achieved in those fisheries.
Evaluation of this risk element requires quantification of the likelihood that non-Council AMs would be triggered and impactfishing activities for Council managed species. In addition, NMFS manages incidental mortality of mammals through take reductions plans which could negatively impact a fishery. Low risk were defined as no interactions with species managed by another agency. Low-Moderate risk were infrequent interactions with non-Council managed species, equivalent to a Category II fishery under MMPA, or non-Council AMs not likely triggered. Moderate-High risk were that AMs in non-Council managed species may be triggered by Council-managed fishing activity, or a Category I fishery under MMPA but takes less than potential biological removal (PBR) threshold. High risk were triggered AMs in non-Council managed species, or a Category I fishery under MMPA and takes above PBR.
All recreational sector fisheries and commercial fisheries for surfclams, ocean quahogs, bluefish, golden and blueline tilefish were ranked low risk as there are no known interactions with protected resources or AMs in other fisheries. Black sea bass, Atlantic mackerel, butterfish, and shortfin squid commercial fisheries were low-moderate risk as Category II fisheries and/or having infrequent interactions with marine mammals or river herring and shad. Moderate-high risk rankings included commercial sector summer flounder and scup (Category II fisheries with potential to trigger AMs for windowpane flounder, a New England managed species), longfin squid (marine mammal interactions and turtle takes) and spiny dogfish (marine mammal interactions and sturgeon takes).
3.5.3. Other Ocean Uses
This element is applied at the species and sector (commercial and recreational) level, and addresses the risk of fishery displacement or damage of a fishery resource and/or supporting habitat as a result of non-fishing activities in the ocean (e.g., energy development/sand mining/other industrial uses, etc.). Many of these activities are in planning stages but not yet active in the region. It also includes evaluation of risk to Council fisheries from area-based measures outside of the control of the Council, including area closures implemented by other Councils to protect sensitive habitats, spawning areas, etc. and/or through marine monument or other types of area-based management designations.
Council staff used expert knowledge to determine impacts to fishery access and habitat quality and function due to other ocean uses, as quantitative evaluation of activities in early planning stages is not practical. Low risk ranking was defined as no overlap of the fishery with other ocean activities and/or no impact on habitat. Low-Moderate risk was defined as potential for fishery overlap and/or minor habitat impacts but transient. Moderate-High risk were potential loss of access to some fishing areas and/or minor habitat impacts but persistent. High risk were other ocean uses would restrict fishing in the prime fishing areas and/or result in major permanent habitat impacts. As the footprint of offshore energy development becomes clearer, this element could be evaluated through GIS analyses which quantify the degree of overlap ocean uses and quantitative risk criteria (e.g., 30% overlap) could also be used.
Recreational fisheries for Atlantic mackerel, golden and blueline tilefish, bluefish, and spiny dogfish and commercial fisheries for both tilefish were low risk due to no overlap with other ocean uses. Commercial fisheries for surfclams, ocean quahogs, shortfin squid, and bluefish, and both sectors for summer flounder and scup ranked low-moderate risk due to the potential for minor habitat or fishery impacts from other ocean uses; these will depend on extent of development of those activities (i.e., energy, aquaculture, etc.). Recreational black sea bass and commercial Atlantic mackerel, butterfish, and spiny dogfish ranked moderate-high risk due to potential for loss of access to fishing grounds (especially by mobile gear) and habitat loss due to offshore energy development in some prime fishing areas. However, it was noted for black sea bass that hard subsurface structures associated with energy production might provide some mitigation of habitat loss. Commercial black sea bass (mobile gear) and longfin squid ranked high risk due to potential for loss of access to fishing grounds and habitat loss due to offshore energy development in many prime fishing areas. Deepsea corals are also under management as protected habitat by the Council, and were ranked moderate-high risk for other ocean uses due to their sensitivity to benthic disturbance by offshore energy development, deep sea exploration, and mining.
3.5.4. Regulatory Complexity and Stability
This element is applied at the species and sector level. Constituents have frequently raised concerns about the complexity of fishery regulations and the need to simplify them to improve their efficacy. Complex regulations may lead to non-compliance and/or impact other fisheries.
This element could be evaluated by quantifying the number of regulations and/or the frequency of regulatory changes, based on evaluation of the Code of Federal Regulations. In terms of recreational fisheries, the magnitude and frequency of change in management measures (size and bag limits, seasons, etc.) could also be evaluated/quantified. For this assessment, Council staff used expert opinion to assess risk. Low risk rankings were simple/few regulations that rarely, if ever, change. Low-Moderate risk were low-moderate complexity regulations and/or occasional changes. Moderate-High risk were moderate-high complexity and occasional changes. High risk were highly complex or frequently changing regulations.
Surfclam, ocean quahog, recreational bluefish, Atlantic mackerel and spiny dogfish and both golden tilefish fisheries ranked low risk for complexity with only minor/no changes to regulations in recent years, relatively stable catch specifications and/or limited regulatory complexity. Commercial bluefish and shortfin squid ranked low-moderate risk with fairly complex regulations that have been stable over time, but may change in the near future. Both sectors for scup and commercial summer flounder and black sea bass fisheries ranked moderate-high risk with minimum size, commercial gear requirements, quota allocation systems, and reporting all very stable, but regulations can be complex, particularly at the state level with varying trip limits, permitting, and reporting systems. The moderate-high risk rankings for both recreational and commercial blueline tilefish and commercial spiny dogfish fisheries were based on recent and frequent changes in regulations. Recreational fisheries for summer flounder and black sea bass ranked high risk due to nearly annual changes in size, season, and possession limits, significant differences between states, reporting, and data estimation changes. Similarly, commercial fisheries for Atlantic mackerel, butterfish, and longfin squid regulations are highly complex and frequently changed, resulting in a high risk ranking.
3.5.5. Discards
This element is applied at the species and sector level. Stakeholders have identified the reduction of discards as a high priority in the Council management program, especially those caused by regulations since they represent biological and economic waste. Discards of either the target or non-target species in the fishery would be taken into consideration.
NMFS provides estimates of discards by species based, in large part, on at-sea observations collected in the Northeast Fisheries Observer Program, for stock assessment purposes and quota monitoring. In addition, the MRIP provides estimate of discards by species for the recreational fisheries. Discards were evaluated for each species and fishery with a focus on identifying discards caused by regulations for each fishery sector. Low risk was defined as no significant discards (<5%). Low-Moderate risk was low or episodic discarding (<20%). Moderate-High risk was regular discarding (20% or more) but managed at an acceptable level. High risk was high discarding (>40%) and difficulty in management.
Surfclams and ocean quahogs ranked low risk because discards are a small percentage of total catch; these fisheries are allocated minimal observer coverage as a result. Recreational spiny dogfish, recreational Atlantic mackerel, all tilefish, and shortfin squid fisheries were also determined to be of low risk because of low discards and/or low mortality associated with discards. Commercial fisheries for summer flounder, black sea bass, Atlantic mackerel, bluefish, and spiny dogfish ranked low-moderate risk due to relatively low (<20% of total catch) but consistent levels of overall discards. Moderate-high risk fisheries included scup (both sectors), commercial butterfish, recreational black sea bass, and recreational bluefish due to relatively high, regular discarding. Recreational summer flounder fishery was ranked high risk due to live discards making up over 85% of recreational catch; however these estimates can be uncertain and variable. Longfin squid fisheries ranked high risk due to high discards of both squid and butterfish.
3.5.6. Allocation
This element is applied at the species and sector level, and addresses the risk of not achieving OY due to spatial mismatch of stocks and management allocations or because of sub-optimal allocation by sector and/or area. Indicators quantifying the difficulty of allocation could include a combination of distribution shifts (see above) and the number of interests (sectors, states, etc.) requiring allocation. Ultimately a more qualitative assessment was used.
Each species and sector's risk level was evaluated based on whether there is ongoing or recent (last 3 years) discussion of allocation by the Council. The EOP was unable to specify intermediate levels of risk for this element, so only low and high risk criteria were developed. A Low risk ranking was no recent or ongoing Council discussion about allocation. High risk was defined as recent or ongoing Council discussion abou allocation.
Surfclam and ocean quahog rank low risk, with a single allocation applied to entire EEZ, plus a small allocation for the Maine quahog fishery and there has been no recent Council discussion of allocation. Similarly, scup (both sectors), butterfish, shortfin squid, golden tilefish (both sectors), and recreational spiny dogfish are not subject to recent allocation discussions, and ranked low risk. All other fisheries (summer flounder, black sea bass, Atlantic mackerel, blueline tilefish, bluefish, and commercial spiny dogfish) have recent and often contentions ongoing allocation discussions and thus rank high risk.
4. Discussion
We have presented the process and results of the initial EAFM risk assessment for the U.S. Mid-Atlantic Fishery Management Council. This is a useful example for the general implementation of ecosystem approaches to natural resource management in at least three ways, outlined here and detailed below. First, it demonstrates that risk assessment is a rapid, familiar, scaleable, and transparent method to move forward with EAFM within a real-world operational fishery management context. Second, we identify several areas where improvement to the process will be possible in both future iterations of this assessment and in other applications. Third, this risk assessment can be used in multiple ways to identify scientific and management priorities and next steps for the Council within its EAFM policy guidance framework. While governance and management frameworks differ, the flexibility and practicality of this type of risk assessment make it a valuable tool in other contexts as well.
Ecological risk assessment has been applied in worldwide in fisheries and natural resource situations (US EPA, 1998; Fletcher, 2005; Smith et al., 2017). Further, it is a component of integrated ecosystem assessment (Levin et al., 2009; DePiper et al., 2017), with examples (Samhouri and Levin, 2012; Fletcher et al., 2016; Newman et al., 2018) as well as frameworks for applying risk assessment within the ecosystem assessment process (Fletcher, 2015; Holsman et al., 2017). However, there are relatively few examples of EAFM risk assessment applications in U.S. and European fishery management. We offer the following advantages of this risk assessment to encourage further uptake. This risk assessment was rapid: it was implemented in under 6 months using existing data to meet management timeframes. Risk assessment is scaleable and can be tailored to the problem at hand: here, the Council determined the appropriate dimensions of the assessment. However, risk assessment can be expert-based at an aggregate level and take even less time (e.g., Gaichas et al., 2014), or at the species level and addressing detailed components of one risk element, taking more time (e.g., Chin et al., 2010; Hare et al., 2016), or hierarchichal, with quick simple coverage of many low risks and more detailed, time consuming analysis devoted to high risks (e.g., Hobday et al., 2011). Risk assessment is familiar: many Council members and stakeholders unfamiliar with aspects of EAFM are familiar with the concepts of risk assessment due to its widely applicable standards and common use across many industries and businesses (ISO, 2009a,b,c). This makes risk assessment an accessible entry point for management organizations.
Risk assessment can be conducted transparently and collaboratively within existing stakeholder processes (Fletcher, 2015). Here, the Council discussed, defined, and selected Risk Elements at public meetings where the standard Council stakeholder engagement processes applied (consensus-driven decision making by a group representing interests in the fisheries using open public meetings, online access, and allowing and following recommendations from public comment). As the risk assessment developed, public comment during EOP and full Council meetings was considered alongside proposals by Council members. This resulted in the Council adding several risk elements to the analysis, adjusting risk ranking criteria, and investigating alternate sources of indicator data. Results and potential uses of the assessment were also discussed in public meetings (with members of the public at the table participating in discussion), and for this assessment there was no need to fully understand complex quantitative methods. Concerns raised by the public regarding the use of risk assessment results (e.g., to change a quota established through a different Council process) were also addressed during the process by Council members, staff, and analysts who reinforced the strategic use of risk assessment information (i.e., it would not be used to change existing quotas). The most important lesson was maintaining open lines of communication between analysts, decision makers, and concerned stakeholders and responding to these concerns. The collaborative, iterative nature of this risk assessment may transfer well to other contexts and allow broader use of ecological risk assessment in decision making.
Because this was the initial EAFM risk assessment for the Council in what is intended to be a continuing and adaptive process rather than a static product, we were able to identify areas to improve in future years as the process is repeated. For example, the short timeframe for completing this risk assessment required that we postpone work on statistical methods for indicator selection (Oudenhoven et al., 2012; Otto et al., 2017). However, many elements selected by the Council had only one indicator time series available, such that selection methods were not required. Nevertheless, further testing of the indicators for consistency and reliability (Samhouri et al., 2009; Fay et al., 2013; Shin et al., 2018) should be a high priority for use in future assessments. In addition, statistical analysis of time series requires further examination. We attempted to account for autocorrelation in indicator time series that could result in unreliable statistical significance tests (Yue et al., 2002). However, further simulation work is required to determine the reliability of significance tests for time series indicators with different degrees of autocorrelation and trend strength (see e.g., Planque and Arneberg, 2018). Given the flexible nature of the risk assessment, any necessary updates can be incorporated in future iterations. Finally, we reiterate that for many of these elements (aside from biomass and fishing mortality status), there are no established risk thresholds, so the consensus of the Council and committee were used to establish risk levels. If clear thresholds become available for any element/indicator combination, in particular through further indicator analysis (Large et al., 2013; Fay et al., 2015) they can be substituted into future assessments.
Risk assessment provides a starting point for prioritizing further, more detailed analysis. An indicator-based assessment does not provide a mechanistic assessment of the system, which is only possible through a structural modeling approach, which could be focused specifically on fully assessing and mitigating identified risks. According to the Council's accepted framework within the EAFM policy guidance, risk assessment results will be used to prioritize and refine the key management questions and issues for further evaluation (Gaichas et al., 2016). The ultimate outcome is a ranked risk assessment in order to focus on the highest risk issues for further evaluation and mitigation. The next step will be the development of example conceptual models which aim to showcase different approaches the Council could use to move from this initial risk assessment to specifying a more in-depth analysis of particular high prority questions. One potential approach focuses on the species with the largest number of high risk rankings across all elements, which is either black sea bass or summer flounder (8 high Risk Elements, Tables 3–5). A second approach focuses on the species complex with the highest landings value (as a proxy for benefits), which is longfin squid, a species with uncertainties in assessment and potential for distribution shifts along with high risks identified across multiple management elements (Tables 3–4). A third approach focuses on the risk element with the most high risk categorizations across species, which is allocation (12 high risk species/sector combinations; Table 4). As of October 2018, the Council has used the first approach to select summer flounder as a high-risk species for development of a conceptual model over the next year. The Council plans to re-evaluate risk annually based on updates from the State of the Ecosystem report as well as outcomes of management actions taken to mitigate the highest risks as a result of more detailed EAFM analyses.
In the Council EAFM framework, specifying a conceptual model in turn provides the initial scoping for more in-depth management strategy evaluation (MSE), where simulation modeling is used to test alternative methods for achieving specific management objectives under uncertainty (Sainsbury, 2000; Butterworth, 2007; Punt and Donovan, 2007; Punt et al., 2016). MSE is generally recognized as a core component of the ecosystem approach (Smith et al., 2007; Levin et al., 2009, 2014), but can be a resource-intensive process when applied even to relatively simple single species harvest control rules (e.g., Jones et al., 2016). EAFM potentially expands the scope of interactions and uncertainties to consider in evaluating harvest control rules and other fishery management procedures. How can managers ensure that the most important MSE gets done first? Risk assessment provides a systematic framework to ensure that limited MSE resources address the highest priority ecosystem interactions and risks. A risk matrix, such as the one developed in this study, can be used to quickly evaluate where further integrated analysis and MSE should be focused–which fishery management plans, which species, and which Risk Elements need to be included in the analysis. Further, because the risk assessment includes social and economic elements as well as the more standard ecological elements, the conceptual model and resulting MSE are designed to include the relevant linkages and therefore avoid unintended consequences of management actions (Degnbol and McCay, 2007).
Similar to many other regions worldwide, natural resource management challenges are mounting in the Mid-Atlantic, from climate change to increasing needs for food and recreational opportunities to increasing uses of ocean areas (e.g., wind farm development). The process described here was completed within the current management system without displacing other processes, and adds value now and for future planning. This EAFM risk assessment highlights certain species and certain management issues as posing higher cumulative risks to meeting Council-derived management objectives when considering a broad range of ecological, social, and economic factors. The risk assessment result summaries will be used by the Council to prioritize further EAFM analyses as well as develop research plans and Council planning priorities over the coming 5 years. As ecosystem reporting and operational EAFM continue to evolve in future years, the Council foresees refining the process so that ecosystem indicators monitor risks to achieving ecological, social, and economic fishery objectives, which can then be mitigated through management action. Overall, ecosystem indicator-based risk assessment is a method that can be adapted to a wide range of resource management systems and available information, and therefore a promising way forward in the implementation of EAFM.
Data Availability
Data sources are listed within the manuscript as references if published, or with URL links if online. State of the Ecosystem indicator data used by the Northeast Fisheries Science Center is available at the NOAA IEA website https://www.integratedecosystemassessment.noaa.gov/regions/northeast/Indicator-data#MidAtlanticIndicators, and technical methods are documented at https://noaa-edab.github.io/tech-doc/.
Author Contributions
SG, GD, and RS planned and executed the overall project, led the ecological, economic, food production, and management analyses, edited the full paper, and wrote individual sections. BM wrote the detailed management results, provided background on the Council process, and edited the full paper. BM and MS coordinated and recorded meetings to reach decisions, facilitated communication with the Council committee and advisors, and contributed to management analyses. LC led the social analysis and contributed to writing that section. AL placed the project in context during Council meetings and contributed to the introduction and discussion sections.
Funding
This work was prepared by employees of the Mid-Atlantic Fishery Management Council and the US Federal Government (Department of Commerce, National Oceanic and Atmospheric Administration) as part of their official duties. AL was funded by the Mid-Atlantic Fishery Management Council.
Conflict of Interest Statement
The authors declare that the research was conducted in the absence of any commercial or financial relationships that could be construed as a potential conflict of interest.
Acknowledgments
We gratefully acknowledge the members of the Mid Atlantic Fishery Management Council, in particular the members of the Ecosystem and Ocean Planning Committee, and the Advisors to the Ecosystem and Ocean Planning Committee. Richard Robins, Jr. (past Council chair), Mike Luisi (current Council chair), and Warren Elliott (chair of the Ecosystem and Ocean Planning Committee) were instrumental in moving this project forward to achieve the results reported here. Mid Atlantic Council Staff members Julia Beatty, Jessica Coakley, Kiley Dancey, Jason Didden, José Montañez, and Matthew Seeley contributed rankings of the management elements by species and sector. Northeast Fisheries Science Center staff contributed to development and presentation of the ecosystem indicators used in this analysis: Kevin Friedland, Sean Hardison, Kimberly Hyde, Sean Lucey, Ryan Morse, Charles Perretti, Vincent Saba, and Laurel Smith. This work benefitted from interactions with the International Council for the Exploration of the Seas Working Group on the Northweast Atlantic Regional Sea (ICES WGNARS), a scientific expert group developing methods and best practices for integrated ecosystem assessment. The manuscript was greatly improved by the suggestions of Scott Large and the two peer reviewers.
Supplementary Material
The Supplementary Material for this article can be found online at: https://www.frontiersin.org/articles/10.3389/fmars.2018.00442/full#supplementary-material
References
Able, K. W. (2005). A re-examination of fish estuarine dependence: Evidence for connectivity between estuarine and ocean habitats. Estuarine Coast. Shelf Sci. 64, 5–17. doi: 10.1016/j.ecss.2005.02.002
Barrett, R. T., Camphuysen, K., Anker-Nilssen, T., Chardine, J. W., Furness, R. W., Garthe, S., et al. (2007). Diet studies of seabirds: a review and recommendations. ICES J. Mar. Sci. 64, 1675–1691. doi: 10.1093/icesjms/fsm152
Bowser, A. K., Diamond, A. W., and Addison, J. A. (2013). From puffins to plankton: a DNA-based analysis of a seabird food chain in the northern Gulf of Maine. PLoS ONE 8:e83152. doi: 10.1371/journal.pone.0083152
Burke, V., Morreale, S., and Standora, E. (1994). Diet of the Kemps ridley sea turtle, Lepidochelys kempii, in New York waters. Fish. Bull. 92, 26–32.
Burke, V., Standora, E., and Morreale, S. (1993). Diet of Juvenile Kemp's ridley and loggerhead sea turtles from long Island, New York. Copeia 1993, 1176–1180.
Butterworth, D. S. (2007). Why a management procedure approach? Some positives and negatives. ICES J. Mar. Sci. 64, 613–617. doi: 10.1093/icesjms/fsm003
Carruthers, T. R., Punt, A. E., Walters, C. J., MacCall, A., McAllister, M. K., Dick, E. J., et al. (2014). Evaluating methods for setting catch limits in data-limited fisheries. Fish. Res. 153, 48–68. doi: 10.1016/j.fishres.2013.12.014
Chin, A., Kyne, P. M., Walker, T. I., and McAuley, R. B. (2010). An integrated risk assessment for climate change: analysing the vulnerability of sharks and rays on Australia's Great Barrier Reef. Glob. Change Biol. 16, 1936–1953. doi: 10.1111/j.1365-2486.2009.02128.x
Colburn, L. L., and Jepson, M. (2012). Social indicators of gentrification pressure in fishing communities: a context for social impact assessment. Coast. Manag. 40, 289–300. doi: 10.1080/08920753.2012.677635
Colburn, L. L., Jepson, M., Weng, C., Seara, T., Weiss, J., and Hare, J. A. (2016). Indicators of climate change and social vulnerability in fishing dependent communities along the Eastern and Gulf Coasts of the United States. Mar. Policy 74, 323–333. doi: 10.1016/j.marpol.2016.04.030
Degnbol, P., and McCay, B. J. (2007). Unintended and perverse consequences of ignoring linkages in fisheries systems. ICES J. Mar. Sci. 64, 793–797. doi: 10.1093/icesjms/fsm040
DePiper, G. S., Gaichas, S. K., Lucey, S. M., Pinto da Silva, P., Anderson, M. R., Breeze, H., et al. (2017). Operationalizing integrated ecosystem assessments within a multidisciplinary team: lessons learned from a worked example. ICES J. Mar. Sci. 74, 2076–2086. doi: 10.1093/icesjms/fsx038
EPA U. (2012). National Coastal Condition Report IV, EPA-842-R-10-003. Washington, DC: United States Environmental Protection Agency Office of Research; Development/Office of Water Available online at: http://citeseerx.ist.psu.edu/viewdoc/download?doi=10.1.1.646.1973&rep=rep1&type=pdf (Accessed September 21, 2017).
Fay, G., Large, S. I., Link, J. S., and Gamble, R. J. (2013). Testing systemic fishing responses with ecosystem indicators. Ecol. Model. 265, 45–55. doi: 10.1016/j.ecolmodel.2013.05.016
Fay, G., Link, J. S., Large, S. I., and Gamble, R. J. (2015). Management performance of ecological indicators in the Georges Bank finfish fishery. ICES J. Mar. Sci. 72, 1285–1296. doi: 10.1093/icesjms/fsu214
Fletcher, W. (2005). The application of qualitative risk assessment methodology to prioritize issues for fisheries management. ICES J. Mar. Sci. 62, 1576–1587. doi: 10.1016/j.icesjms.2005.06.005
Fletcher, W., Gaughan, D. J., Metcalf, S. J., and Shaw, J. (2012). “Using a regional level, risk-based framework to cost effectively implement ecosystem-based fisheries management,” in Global Progress in Ecosystem-Based Fisheries Management (Fairbanks, AK: Alaska Sea Grant, University of Alaska Fairbanks), 129–146. doi: 10.4027/gpebfm.2012.07
Fletcher, W. J. (2015). Review and refinement of an existing qualitative risk assessment method for application within an ecosystem-based management framework. ICES J. Mar. Sci. 72, 1043–1056. doi: 10.1093/icesjms/fsu142
Fletcher, W. J., Wise, B. S., Joll, L. M., Hall, N. G., Fisher, E. A., Harry, A. V., et al. (2016). Refinements to harvest strategies to enable effective implementation of ecosystem based fisheries management for the multi-sector, multi-species fisheries of Western Australia. Fish. Res. 183, 594–608. doi: 10.1016/j.fishres.2016.04.014
Gabriel, W. L., and Mace, P. M. (1999). “A review of biological reference points in the context of the precautionary approach,” in Proceedings of the Fifth National NMFS Stock Assessment Workshop: Providing Scientific Advice to Implement the Precautionary Approach Under the Magnuson-Stevens Fishery Conservation and Management Act. NOAA Tech Memo NMFS-F/SPO-40, 34–45. Available online at: https://www.st.nmfs.noaa.gov/Assets/stock/documents/workshops/nsaw_5/gabriel_.pdf (Accessed January 21, 2016).
Gaichas, S., Seagraves, R., Coakley, J., DePiper, G., Guida, V., Hare, J., et al. (2016). A framework for incorporating species, fleet, habitat, and climate interactions into fishery management. Front. Mar. Sci. 3:105. doi: 10.3389/fmars.2016.00105
Gaichas, S. K., Link, J. S., and Hare, J. A. (2014). A risk-based approach to evaluating northeast US fish community vulnerability to climate change. ICES J. Mar. Sci. 71, 2323–2342. doi: 10.1093/icesjms/fsu048
Gannon, D. P., Read, A. J., Craddock, J. E., and Mead, J. G. (1997). Stomach contents of long-finned pilot whales (Globicephala melas) stranted on the U.S. Mid-Atlantic coast. Mar. Mammal Sci. 13, 405–418.
Garcia, S. M., and Cochrane, K. L. (2005). Ecosystem approach to fisheries: A review of implementation guidelines. ICES J. Mar. Sci. 62, 311–318. doi: 10.1016/j.icesjms.2004.12.003
Hare, J. A., Morrison, W. E., Nelson, M. W., Stachura, M. M., Teeters, E. J., Griffis, R. B., et al. (2016). A vulnerability assessment of fish and invertebrates to climate change on the northeast U.S. continental shelf. PLOS ONE 11:e0146756. doi: 10.1371/journal.pone.0146756
Heenan, A., Pomeroy, R., Bell, J., Munday, P. L., Cheung, W., Logan, C., et al. (2015). A climate-informed, ecosystem approach to fisheries management. Mar. Policy 57, 182–192. doi: 10.1016/j.marpol.2015.03.018
Hobday, A. J., Smith, A. D. M., Stobutzki, I. C., Bulman, C., Daley, R., Dambacher, J. M., et al. (2011). Ecological risk assessment for the effects of fishing. Fish. Res. 108, 372–384. doi: 10.1016/j.fishres.2011.01.013
Holsman, K., Samhouri, J., Cook, G., Hazen, E., Olsen, E., Dillard, M., et al. (2017). An ecosystem-based approach to marine risk assessment. Ecosyst. Health Sustainabil. 3:e01256. doi: 10.1002/ehs2.1256
ISO (2009a). Risk Management-Risk Assessment Techniques. International Standards Organization. IEC/ISO 31010. International Standards Organization.
ISO (2009b). Risk Management Principles and Guidelines. International Standards Organization. ISO31000:2009(E). International Standards Organization.
ISO (2009c). Risk Management Vocabulary. International Standards Organization. ISO GUIDE 73:2009(E/F). International Standards Organization.
Jepson, M., and Colburn, L. L. (2013). Development of Social Indicators of Fishing Community Vulnerability and Resilience in the US Southeast and Northeast Regions. NOAA Technical Memorandum NMFS-F/SPO-129 (US Dept Commerce, 2013). Available online at: http://www.nmfs.noaa.gov/sfa/management/councils/training/2014/r_h3_fishing_community_vulnerability.pdf (Accessed September 25, 2015).
Johnson, A., Richards, A., Cullen, D. W., and Sutherland, S. J. (2008). Growth, reproduction, and feeding of large monkfish, Lophius americanus. ICES J. Mar. Sci. 65, 1306–1315. doi: 10.1093/icesjms/fsn138
Johnson, J., Dropkin, D., Warkentine, B., Rachlin, J., and Andrews, W. (1997). Food habits of atlantic sturgeon off the Central New Jersey Coast. Trans. Am. Fish. Soc. 126, 166–170.
Jones, M. L., Catalano, M. J., Peterson, L. K., and Berger, A. M. (2016). Stakeholder-centered development of a harvest control rule for Lake Erie walleye. Manag. Sci. Fish. 163–183. doi: 10.4324/9781315751443
Large, S. I., Fay, G., Friedland, K. D., and Link, J. S. (2013). Defining trends and thresholds in responses of ecological indicators to fishing and environmental pressures. ICES J. Mar. Sci. 70, 755–767. doi: 10.1093/icesjms/fst067
Levin, P. S., Fogarty, M. J., Murawski, S. A., and Fluharty, D. (2009). Integrated ecosystem assessments: developing the scientific basis for ecosystem-based management of the ocean. PLoS Biol. 7:e1000014. doi: 10.1371/journal.pbio.1000014
Levin, P. S., Kelble, C. R., Shuford, R. L., Ainsworth, C., deReynier, Y., Dunsmore, R., et al. (2014). Guidance for implementation of integrated ecosystem assessments: a US perspective. ICES J. Mar. Sci. 71, 1198–1204. doi: 10.1093/icesjms/fst112
McClellan, C. M., and Read, A. J. (2007). Complexity and variation in loggerhead sea turtle life history. Biol. Lett. 3, 592–594. doi: 10.1098/rsbl.2007.0355
NEFSC (2015). 60th northeast regional stock assessment workshop (60th SAW) assessment report. US Dept. Commer. Northeast Fish. Sci. Cent. Ref. Doc. 15-08, 870. doi: 10.7289/V5W37T9T
NEFSC (2017a). 61st northeast regional stock assessment workshop (61st SAW) assessment report. US Dept. Commer. Northeast Fish. Sci. Cent. Ref. Doc. 17-05, 466. doi: 10.7289/V5/RD-NEFSC-17-05
NEFSC (2017b). 62nd northeast regional stock assessment workshop (62nd SAW) assessment report. US Dept. Commer. Northeast. Fish. Sci. Cent. Ref. Doc. 17-03, 822. doi: 10.7289/V5/RD-NEFSC-17-03
NEFSC (2017c). 63rd northeast regional stock assessment workshop (63rd SAW) assessment report. US Dept. Commer. Northeast Fish. Sci. Cent. Ref. Doc. 17-10, 409. doi: 10.7289/V5/RD-NEFSC-17-10
NEFSC (2018). “64th Northeast Regional Stock Assessment Workshop (64th SAW) Assessment Report,” in US Department of Commerce Northeast Fisheries Science Center Reference Document 18-06. Woods Hole, MA Available at: https://www.nefsc.noaa.gov/publications/crd/crd1806/crd1806.pdf [Accessed October 4, 2018].
Newman, S. J., Brown, J. I., Fairclough, D. V., Wise, B. S., Bellchambers, L. M., Molony, B. W., et al. (2018). A risk assessment and prioritisation approach to the selection of indicator species for the assessment of multi-species, multi-gear, multi-sector fishery resources. Mar. Policy 88, 11–22. doi: 10.1016/j.marpol.2017.10.028
Otto, S., Kadin, M., Casini, M., Torres, M., and Blenckner, T. (2017). A quantitative framework for selecting and validating food web indicators. Ecol. Indic. 84 619–631. doi: 10.1016/j.ecolind.2017.05.045
Oudenhoven, A. P. E., van Petz, K., Alkemade, R., Hein, L., and Groot, R. S. de. (2012). Framework for systematic indicator selection to assess effects of land management on ecosystem services. Ecol. Indic. 21, 110–122. doi: 10.1016/j.ecolind.2012.01.012
Patrick, W. S., and Link, J. S. (2015). Myths that Continue to Impede Progress in Ecosystem-Based Fisheries Management. Fisheries 40, 155–160. doi: 10.1080/03632415.2015.1024308
Perry, M. C., Olsen, G. H., Richards, A., and Osenton, P. C. (2013). Predation on dovekies by goosefish over deep water in the Northwest Atlantic Ocean. Northeast. Nat. 20, 148–154. doi: 10.1656/045.020.0112
Planque, B., and Arneberg, P. (2018). Principal component analyses for integrated ecosystem assessments may primarily reflect methodological artefacts. ICES J. Mar. Sci. 75, 1021–1028. doi: 10.1093/icesjms/fsx223
Powers, K. (1983). Pelagic Distributions of Marine Birds off the Northreastern United States. NOAA Technical Memorandum NMFS-F/NEC 27. Woods Hole, MA.
Powers, K. D., and Backus, E. H. (1987). “Energy transfer to seabirds,” in Georges Bank, eds R. H. Backus and D. W. Bourne (Cambridge, MA: MIT Press), 372–374.
Powers, K. D., and Brown, R. G. (1987). “Seabirds,” in Georges Bank, eds R. H. Backus and D. W. Bourne (Cambridge, MA: MIT Press), 359–371.
Prager, M. H., and Shertzer, K. W. (2010). Deriving acceptable biological catch from the overfishing limit: implications for assessment models. North Am. J. Fish. Manag. 30, 289–294. doi: 10.1577/M09-105.1
Punt, A. E., Butterworth, D. S., Moor, C. L., de De Oliveira, J. A. A., and Haddon, M. (2016). Management strategy evaluation: best practices. Fish Fish. 17, 303–334. doi: 10.1111/faf.12104
Punt, A. E., and Donovan, G. P. (2007). Developing management procedures that are robust to uncertainty: lessons from the international whaling commission. ICES J. Mar. Sci. 64, 603–612. doi: 10.1093/icesjms/fsm035
Ramírez-Monsalve, P., Raakjær, J., Nielsen, K. N., Santiago, J. L., Ballesteros, M., Laksá, U., et al. (2016). Ecosystem approach to fisheries management (EAFM) in the EU–current science–policy–society interfaces and emerging requirements. Mar. Policy 66, 83–92. doi: 10.1016/j.marpol.2015.12.030
Richards, R. (2016). “2016 Monkfish Operational Assessment,” in US Department of Commerce Northeast Fisheries Science Center Reference Document 16-09. National Marine Fisheries Service, Woods Hole, MA. Available online at: https://www.nefsc.noaa.gov/publications/crd/crd1609/crd1609.pdf [Accessed October 2, 2018].
Sainsbury, K. (2000). Design of operational management strategies for achieving fishery ecosystem objectives. ICES J. Mar. Sci. 57, 731–741. doi: 10.1006/jmsc.2000.0737
Sallenger, A. H., Doran, K. S., and Howd, P. A. (2012). Hotspot of accelerated sea-level rise on the Atlantic coast of North America. Nat. Clim. Change 2, 884–888. doi: 10.1038/nclimate1597
Samhouri, J. F., and Levin, P. S. (2012). Linking land- and sea-based activities to risk in coastal ecosystems. Biol. Conserv. 145, 118–129. doi: 10.1016/j.biocon.2011.10.021
Samhouri, J. F., Levin, P. S., and Harvey, C. J. (2009). Quantitative evaluation of marine ecosystem indicator performance using food web models. Ecosystems 12, 1283–1298. doi: 10.1007/s10021-009-9286-9
Savoy, T. (2007). “Prey eaten by Atlantic sturgeon in Connecticut waters,” in Anadromous sturgeons: Habitats, Threats, and Management, eds J. Munro, D. Hatin, J. E. Hightower, K. McKown, K. J. Sulak, A. W. Kahnle, and F. Caron, American Fisheries Society, Symposium 56. American Fisheries Society (Bethesda, MD), 157–166.
Schneider, D. C., and Heinemann, D. W. (1996). “The state of marine bird populations from Cape Hatteras to the Gulf of Maine,” in The Northeast Shelf Ecosystem: Assessment, Sustainability, and Management, eds K. Sherman, N. A. Jaworski, and T. J. Smayda (Cambridge, MA: Blackwell Science), 197–216.
Seney, E. E., and Musick, J. A. (2007). Historical diet analysis of loggerhead sea turtles (Caretta caretta) in Virginia. Copeia 2007, 478–489. doi: 10.1643/0045-8511(2007)7[478:HDAOLS]2.0.CO;2
Sherman, K., Sissenwine, M., Christensen, V., Duda, A., Hempel, G., Ibe, C., et al. (2005). A global movement toward an ecosystem approach to management of marine resources. Mar. Ecol. Progr. Ser. 300, 275–279. doi: 10.3354/meps300275
Shin, Y.-J., Houle, J. E., Akoglu, E., Blanchard, J. L., Bundy, A., Coll, M., et al. (2018). The specificity of marine ecological indicators to fishing in the face of environmental change: a multi-model evaluation. Ecol. Indic. 89, 317–326. doi: 10.1016/j.ecolind.2018.01.010
Shoop, C., and Kenney, R. (1992). Seasonal distributions and abundances of loggerhead and leatherback sea turtles in waters of the Northeastern United States. Herpetol. Monogr. 6, 43–67.
Skern-Mauritzen, M., Ottersen, G., Handegard, N. O., Huse, G., Dingsør, G. E., Stenseth, N. C., et al. (2016). Ecosystem processes are rarely included in tactical fisheries management. Fish Fish. 17, 165–175. doi: 10.1111/faf.12111
Smith, A. D. M., Fulton, E. J., Hobday, A. J., Smith, D. C., and Shoulder, P. (2007). Scientific tools to support the practical implementation of ecosystem-based fisheries management. ICES J. Mar. Sci. 64, 633–639. doi: 10.1093/icesjms/fsm041
Smith, B. E., and Link, J. S. (2010). The Trophic Dynamics of 50 Finfish and 2 Squid Species on the Northeast US Continental Shelf. NOAA Technichal Memorandum NMFS-NE-216. National Marine Fisheries Service, 166 Water Street, Woods Hole, MA. Available online at: http://www.nefsc.noaa.gov/publications/tm/tm216/ (Accessed April 26, 2016).
Smith, D. C., Fulton, E. A., Apfel, P., Cresswell, I. D., Gillanders, B. M., Haward, M., et al. (2017). Implementing marine ecosystem-based management: Lessons from Australia. ICES Journal of Marine Science 74, 1990–2003. doi: 10.1093/icesjms/fsx113
Smith, L. A., Link, J. S., Cadrin, S. X., and Palka, D. L. (2015). Consumption by marine mammals on the Northeast U.S. continental shelf. Ecol. Appl. 25, 373–389. doi: 10.1890/13-1656.1
US EPA (1998). Guidelines for Ecological Risk Assessment. EPA/630/R-95/002F. U.S. Environmental Protection Agency, Washington DC. Published on May 14, 1998, Federal Register 63, 26846-26924. Available online at: http://www.epa.gov/raf/publications/pdfs/ECOTXTBX.PDF.
US EPA (2012). National Coastal Condition Report IV, EPA-842-R-10-003. Washington, DC: United States Environmental Protection Agency, Office of Research; Development/Office of Water Available online at: http://www.epa.gov/nccr.
Keywords: ecosystem approach, natural resource management, risk assessment, fisheries, integrated ecosystem assessment, ecosystem indicators, economic indicators, management objectives
Citation: Gaichas SK, DePiper GS, Seagraves RJ, Muffley BW, Sabo MG, Colburn LL and Loftus AJ (2018) Implementing Ecosystem Approaches to Fishery Management: Risk Assessment in the US Mid-Atlantic. Front. Mar. Sci. 5:442. doi: 10.3389/fmars.2018.00442
Received: 13 July 2018; Accepted: 05 November 2018;
Published: 23 November 2018.
Edited by:
Simone Libralato, Istituto Nazionale di Oceanografia e di Geofisica Sperimentale (OGS), ItalyReviewed by:
Brett W. Molony, Department of Primary Industries and Regional Development of Western Australia (DPIRD), AustraliaCatherine Sarah Longo, Marine Stewardship Council (MSC), United Kingdom
Copyright © 2018 Gaichas, DePiper, Seagraves, Muffley, Sabo, Colburn and Loftus. This is an open-access article distributed under the terms of the Creative Commons Attribution License (CC BY). The use, distribution or reproduction in other forums is permitted, provided the original author(s) and the copyright owner(s) are credited and that the original publication in this journal is cited, in accordance with accepted academic practice. No use, distribution or reproduction is permitted which does not comply with these terms.
*Correspondence: Sarah K. Gaichas, c2FyYWguZ2FpY2hhc0Bub2FhLmdvdg==