 Samantha Andrzejaczek
 Adrian C. Gleiss
 Charitha B. Pattiaratchi
 Mark G. Meekan
- 1Oceans Graduate School, The UWA Oceans Institute, The University of Western Australia, Crawley, WA, Australia
- 2The Australian Institute of Marine Science, Crawley, WA, Australia
- 3Centre for Sustainable Aquatic Ecosystems, Harry Butler Institute, Murdoch University, Murdoch, WA, Australia
The expanding use of biologging tags in studies of shark movement provides an opportunity to elucidate the context and drivers of fine-scale movement patterns of these predators. In May 2017, we deployed high-resolution biologging tags on four mature female sandbar sharks Carcharhinus plumbeus at Ningaloo Reef for durations ranging between 13 and 25.5 h. Pressure and tri-axial motion sensors within these tags enabled the calculation of dive geometry, swimming kinematics and path tortuosity at fine spatial scales (m-km) and concurrent validation of these behaviors from video recordings. Sandbar sharks oscillated through the water column at shallow dive angles, with gliding behavior observed in the descent phase for all sharks. Continual V-shaped oscillatory movements were occasionally interspersed by U-shaped dives that predominately occurred around dusk. The bottom phase of these U-shaped dives likely occurred on the seabed, with dead-reckoning revealing a highly tortuous, circling track. By combining these fine-scale behavioral observations with existing ecological knowledge of sandbar habitat and diet, we argue that these U-shaped dives are likely to be a strategy for bentho-pelagic foraging. Comparing the diving geometry of sandbar sharks with those of other shark species reveals common patterns in oscillatory swimming. Collectively, the fine-scale movement patterns of sandbar sharks reported here are consistent with results of previous biologging studies that emphasize the role of cost-efficient foraging in sharks.
Introduction
An understanding of the movement ecology of marine megafauna requires investigation of patterns at a range of spatial and temporal scales across an individual's lifetime (Nathan et al., 2008). Broad-scale movements determined by acoustic and satellite tracking can reveal migratory pathways, environmental preferences and patterns in habitat use and residency (Braccini et al., 2017; Ferreira et al., 2019). Fine-scale movements recorded by advanced biologging tags allow the quantification of patterns in activity, feeding and energetics (e.g., Gleiss et al., 2013; Brownscombe et al., 2014; Brewster et al., 2018), and can provide behavioral and physiological context to other studies of broad-scale movements (Whitney et al., 2012, 2019).
Recent biologging studies on whale sharks (Rhincodon typus) and oceanic whitetip sharks (Carcharhinus longimanus) have shown that the foraging, energetics and movement patterns of sharks are likely linked through behaviors that minimize energy outputs, while maximizing foraging opportunities (cost-efficient foraging) (Gleiss et al., 2011b; Meekan et al., 2015; Papastamatiou et al., 2018a). To date, the applicability of this concept to other sharks is difficult to determine, as relatively few species have been studied using a biologging approach.
Here, we used biologging tags to investigate the fine-scale movement behaviors of adult sandbar sharks (Carcharhinus plumbeus) for the first time. This species is globally distributed in tropical and warm temperate coastal waters, and is commercially important throughout its range (McAuley et al., 2007; Ebert et al., 2013). K-selected species traits, such as low fecundity and late age at maturity, targeted fishing and predicted population declines have led to the sandbar shark being listed as Vulnerable on the IUCN Red List (Musick et al., 2009). Largely because of its commercial importance, there exists a robust understanding of the broad-scale (10–1,000 km) distribution, movements and diet of the species (Stevens and McLoughlin, 1991; McElroy et al., 2006; Ellis and Musick, 2007; Grubbs et al., 2007; McAuley et al., 2007; Barnes et al., 2016; Braccini and Taylor, 2016; Braccini et al., 2017). Tracking studies have found that sandbar sharks are generally wide-ranging, undergo large migrations (>1,000 km) but also display evidence of site-fidelity (Grubbs et al., 2007; Papastamatiou et al., 2010; Barnes et al., 2016; Braccini et al., 2017). Diet studies in a number of regions have found a preference for feeding on benthic prey, predominately demersal fishes, cephalopods and crustaceans (Cliff et al., 1988; Stevens and McLoughlin, 1991; McElroy et al., 2006; Ellis and Musick, 2007). Our use of biologging tags allowed our study to record fine spatial and temporal scale (m and seconds) behavior that linked foraging to movement. Our aim was to determine the extent to which these movements conformed to patterns of cost-efficient foraging seen in other species monitored with this type of technology. Patterns consistent across species support the contention that this type of foraging is a key determinant of the vertical movements of sharks and other megafauna in marine environments.
Materials and Methods
Data Collection
In Western Australia, mature sandbar sharks are predominately found in north and north-west tropical waters (McAuley et al., 2007; Braccini and Taylor, 2016), and some degree of site fidelity have been revealed around Ningaloo Reef (Figure 1A) (Braccini et al., 2017). We captured sandbar sharks at this locality using baited drumlines inside the reef lagoon (22.99°S, 113.8°E) in May 2017 (Figure 1A). Drumlines were equipped with a single 20/0 circle hook baited with fish scraps. Three drumlines were deployed ~100 m apart at depths of 8–12 m between 7:00 and 16:00, and were monitored continuously. Once a shark was caught, it was secured alongside a 5.8 m vessel by the leader of the fishing line and a tail rope. Each shark was measured and its sex recorded before a biologging tag was clamped to the base of its dorsal fin.
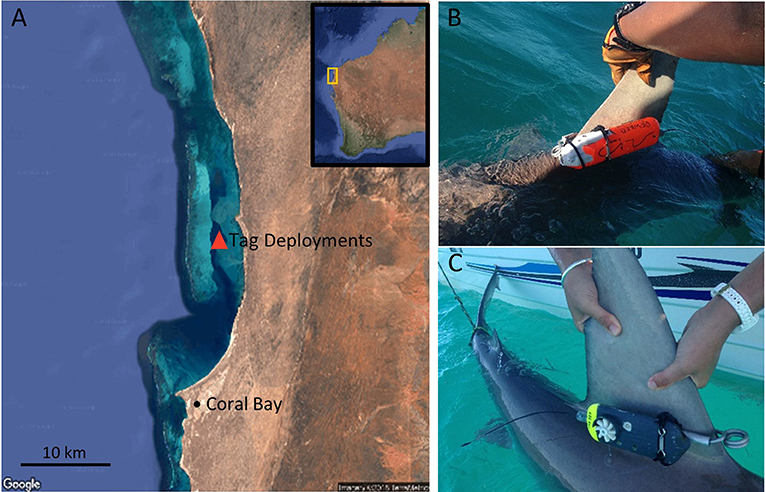
Figure 1. Tagged sandbar sharks at Ningaloo Reef. (A) Location of tag deployments. (B) CATS Cam tag clamped to the dorsal fin. (C) CATS Diary tag clamped to the dorsal fin.
Either a CATS Diary Tag (Customized Animal Tracking Solutions, Australia) or CATS Cam Tag was deployed on sandbar sharks (Figures 1B,C). Both are equipped with tri-axial accelerometers, magnetometers and gyroscopes, depth, temperature, and light sensors. In addition, the Cam tag housed a HD video camera, and speed sensors were present, but not functional, in the diary tags. Active sensors recorded all parameters at 20 Hz, and video recorded at pre-programmed hours of the day. CATS tags were attached to a stainless steel spring clamp [CATS, Australia (Gleiss et al., 2009; Chapple et al., 2015)] via docking pin and a corrodible galvanic timed release (GTR, Ocean Appliances, Australia) allowing the tags to be rigidly attached to the dorsal fin. The GTRs were designed to dissolve in seawater after 24 h. After this time the tag would release from the clamp and float to the surface. Floating tag packages were tracked down in the days following tagging using a hand-held VHF receiver operated from the vessel (Lear and Whitney, 2016). The magnesium sleeve on the clamp also dissolved after 7 days, detaching the clamp from the shark.
Data Processing
Depth Record
Zero offset corrections were applied to the depth record based on times when sharks were being tagged at the surface. The depth record was then split into vertical swimming phases (“ascending,” “descending,” and “level swimming”) using vertical velocity (VV). To do this the depth record was firstly smoothed using a 10 s running mean and the average VV was calculated by taking the difference of this smoothed depth between successive points at 1 s intervals. Ascents and descents were defined where VV exceeded an absolute value of 0.05 m/s for more than 10 s, and level where this value was not exceeded (Whitney et al., 2016).
Tri-axial Sensor Data
Data recorded by the accelerometer (acceleration) and gyroscope (angular velocity) were analyzed using Igor Pro ver. 7.0.4.1 (Wavemetrics, Inc. Lake Oswego, USA) and Ethographer (Sakamoto et al., 2009). The gravitational component of acceleration (static acceleration) was determined using a 3 s box smoothing window on the raw acceleration data (Shepard et al., 2008). Shark body pitch angles (orientation of the shark with regard to the horizontal plane) were derived by calculating the arcsine of the static acceleration in the surging (posterior–anterior) axis. To correct for the tag attachment angle on each individual shark, we determined the pitch when the shark was swimming at a constant depth (when VV was equal to zero), and subtracted this value from all pitch estimates (Kawatsu et al., 2009). The dynamic component of acceleration was calculated by subtracting the gravitational component from the raw acceleration for each axis. We then used a continuous wavelet transformation on the dynamic component of the sway (lateral) axis to calculate the acceleration signal amplitude and frequency of tailbeats. Using these same methods, amplitude and frequency were calculated using the angular velocity data, and the resulting signals were compared with those derived from the acceleration data to determine the best measure of tailbeat kinematics.
The angular velocity data produced the clearest tailbeat signal and consequently was used to quantify the incidence of gliding behavior (cessation of tailbeats for more than 1 s) using a combination of two methods. Gliding behavior was firstly computed using the k-means cluster function in Ethographer. This algorithm clusters the spectra computed by the wavelet transformation based on similarity of shape. The behavioral spectrum with the lowest peaks in amplitude was assumed to represent gliding behavior (Nakamura et al., 2011). The incidence of the resulting cluster was then inspected against the dynamic sway data. As this cluster did not match with gliding behavior in some individuals (i.e., tailbeats evident in sway data classified to be gliding and vice versa), a mask was created using the characteristics of the tailbeat amplitude and frequency where the cluster was judged to correctly classify gliding behavior (from visual inspection of the dynamic sway and concurrent videos). This mask was then used to extract glides from all sharks, and an additional manual quality control was undergone in the case where the mask obviously misclassified glides.
Tailbeat signals were also examined for evidence of a recovery period following the stress of capture following Whitney et al. (2016).
Shark Heading and Pseudo-Track Calculation
Acceleration and magnetometer data were used to calculate head yaw angle (hereafter referred to as “heading”) and pseudo-tracks in the software Framework 4 (Walker et al., 2015; Whitney et al., 2019). Heading calculations required input of orientation of the sensors in the tags, and magnetometer and acceleration data. The orientation of the device was corrected using orientation specifications provided by CATS (N. Liebsch pers. comm). Pitch and roll calculated from the accelerometer data were used to correct for tilt (Walker et al., 2015). In addition to the calculations applied by Framework 4, we applied a 3 s box smoothing window to the heading data to filter out the dynamic movements of the sharks caused by tail beating that created significant yaw.
Heading was then used to calculate pseudo-tracks for each shark using dead-reckoning (Mitani et al., 2003; Wilson et al., 2007). These calculations operate under the principle that the heading and speed of an individual at time “t” can be used to calculate the position at time “t + 1” (Walker et al., 2015). As we had no estimate of speed, a fixed value was used to compute the pseudo-tracks. Because a fixed value of speed is unlikely to be representative of individual sharks, the dead-reckoning will accumulate errors over the course of the track. Therefore, tracks were used only for plotting short-term movements of the sharks in three-dimensional space (“pseudo-tracks”) and could not be used to estimate geographical positions (Wilson et al., 2007; Walker et al., 2015). Heading data were also used to calculate the turning angles of individuals on a second-by-second basis. Data were resampled to a 1 s frequency and converted to a 0–360° scale. The minimum difference in angle between consecutive observations was used to determine turning angle.
Window Size and Statistics
The time window used for analysis was selected by determining the window for which the highest variance in turning angle was observed. This time window was estimated to be 15 min (900 s), and within this period, a number of vertical movement parameters were summarized including mean and maximum depth, ascent pitch, descent pitch, ascent VV, and descent VV. The proportion of time spent moving vertically (ascending and descending), termed the “diving ratio,” (Table 1) was also calculated for each window as per:
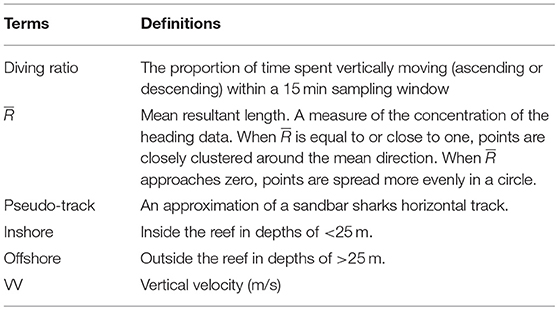
Table 1. Terms and definitions used repetitively throughout manuscript.
This parameter allowed us to discriminate between sampling windows where vertical movements consisted of continuous oscillations through the water column or extended periods of level swimming between dives. In addition, heading data were used to calculate measurements of path tortuosity and direction. Firstly, turning angles were summed for each window to obtain an estimate of tortuosity. This was also separately calculated for each vertical phase (level swimming, ascending, and descending), and standardized by the time spent in the relative phase within a sampling window (i.e., the mean). Secondly, the Circular package in R was used to calculate the mean resultant length, or of the heading, a measure of the concentration of unimodal circular data (Pewsey et al., 2013). When is close to or equal to one, points are closely clustered around the mean direction and are highly directional, and as approaches zero, points spread more evenly in a circle and become tortuous.
Video Analysis
Video recorded by the tags was analyzed in BORIS (Behavioral Observation Research Interactive Software, Friard and Gamba, 2016). This open-source software allows the user to set an ethogram and record the timing of these events. We set an ethogram to mark burst swimming events, presence of seabed in the field of view, habitat type, and other notable behaviors. Video was also used to validate parameters recorded and calculated from the tri-axial sensor data, such as tailbeat frequency, bursts and glides.
Statistical Analysis
To investigate if changes in vertical movements were related to changes in horizontal movements, we constructed a series of generalized linear models (GLMs) for each individual sandbar shark (N = 4). Diving ratio within a sampling window (see Window Size and Statistics) was set as the response variable in all models, and turning (a proxy for tortuosity) as the explanatory variable. The first set of models used summed turning angles to explore the general relationship between tortuosity and diving behavior in tagged sharks. For the remaining models, mean turning angle for each phase of vertical movement (level swimming, ascent and descent, see Window Size and Statistics) was sequentially set as the explanatory variable. Inspection for correlation at lag = 1 found no serial correlation in the data. Statistical analysis was performed in R 3.4.0 (R Core Team, 2017).
Results
Four mature female sandbar sharks ranging in length from 1.76 to 1.89 m TL were caught and tagged at Ningaloo Reef in May 2017 (two camera tag and two diary tag deployments, Table 2). Time from capture to release did not exceed 25 min for any of the tagged sharks. All deployed tags were recovered after a mean attachment duration of 18 h (range 13–25.5 h). All sensors recorded continuously for all four tag deployments, excluding the video camera, which only recorded a total 5.5 h and 30 min in two deployments.
Table 2. Summary details of tagged sandbar sharks.
The quantification of the post-release recovery period for sandbar sharks using tailbeat data was confounded by the immediate movement into deeper water by three of the tagged individuals (Supplementary Figures 1, 2). For these sharks, increases in tailbeat frequency were associated with deeper dives. Shark 4 remained inshore and no recovery period was observed i.e., there was no apparent effect of capture on activity (Supplementary Figure 1). As a result, the entire recorded track from shark release to tag detachment for each individual was used in the analysis.
Vertical Movements
Tagged sandbar sharks swam at a mean depth of 23.4 ± 17.5 m, reaching a maximum depth of 96.6 m (Table 3). Sharks moved vertically in an oscillating pattern for a mean 57 ± 17.6% of their track at a mean ascent angle of 11.4 ± 2.2° and descent angle of −11.5 ± 3.5° (Table 3). Sharks displayed a mean tailbeat frequency of 0.65 ± 0.19 Hz, averaging 0.72 ± 0.12 Hz on ascent and 0.57 ± 0.13 Hz on descent. Gliding behavior was observed throughout 13.2 ± 14.3% of the descent phase (range 0–75%), with a maximum continuous glide time of 210 s (Figure 2; Table 3). Sparse tailbeats often interrupted glides during descents (Figure 2). For other summary statistics of vertical movements, see Table 3.
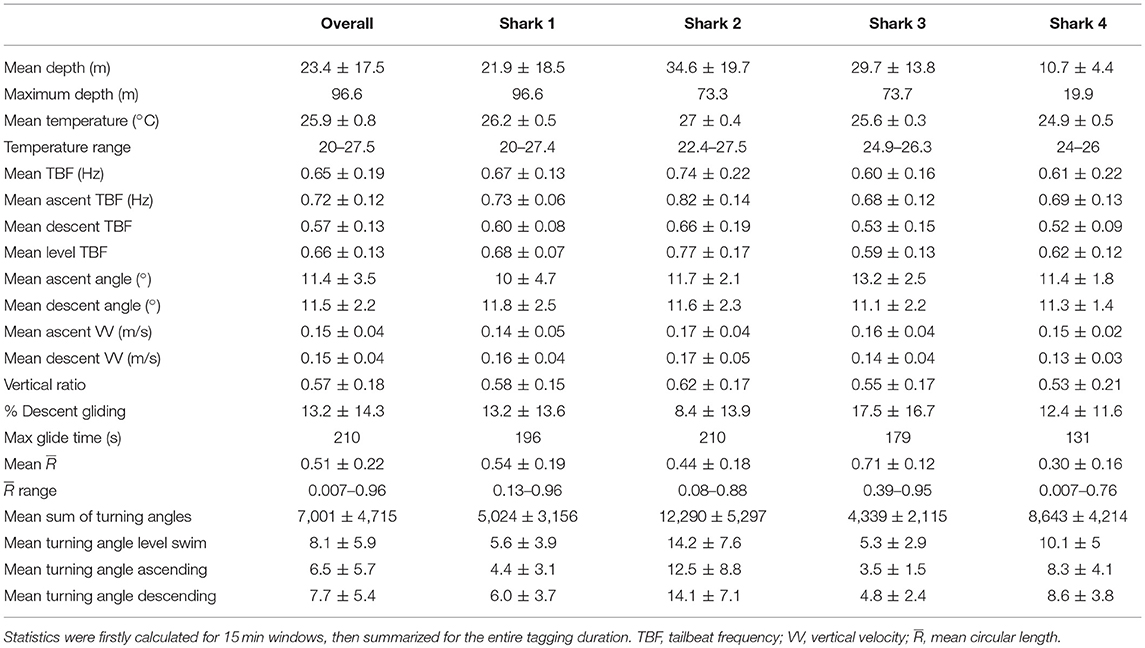
Table 3. Summary statistics calculated for the entire dataset, and each tagged individual.
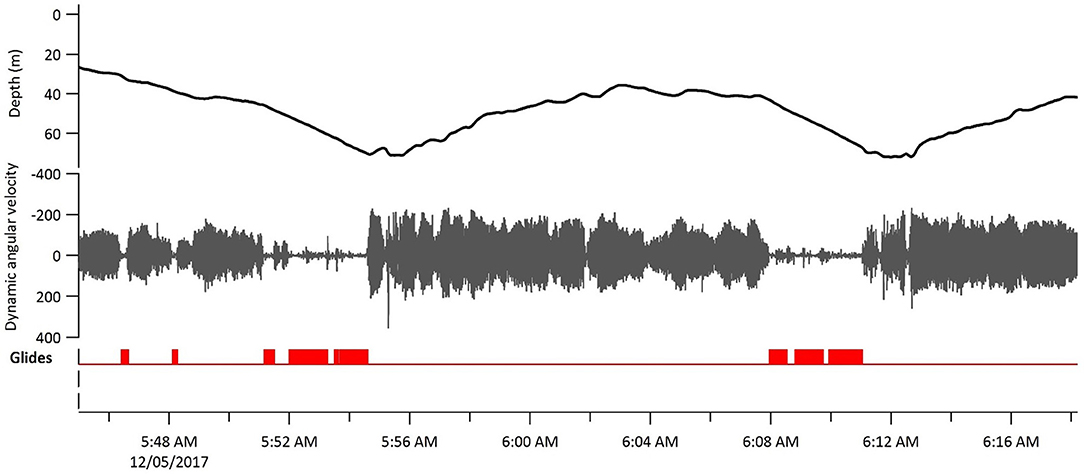
Figure 2. Gliding behavior in a tagged sandbar shark (Shark 3) over the course of ~30 min. Dynamic angular velocity was taken from the lateral (sway) axes recorded by the gyroscope. Glides are marked where the mask analysis determined gliding was occurring.
The depth record for each shark consisted of continual V-shaped oscillatory vertical movements, interspersed by occasional U-shaped dives with extended bottom periods (Figure 3). These U-shaped dives occurred predominately around dusk for all individuals. Through a combination of seabed observations in the video, dead-reckoning and the gradual increase in window maximum depth as three sharks moved offshore, we assumed that the oscillations were limited vertically by the seabed. Comparing these maximum depths with bathymetry of the study site, three sharks moved offshore (maximum depths >70 m), and one shark appeared to remain inside the reef (Shark 4, maximum depth < 20 m).
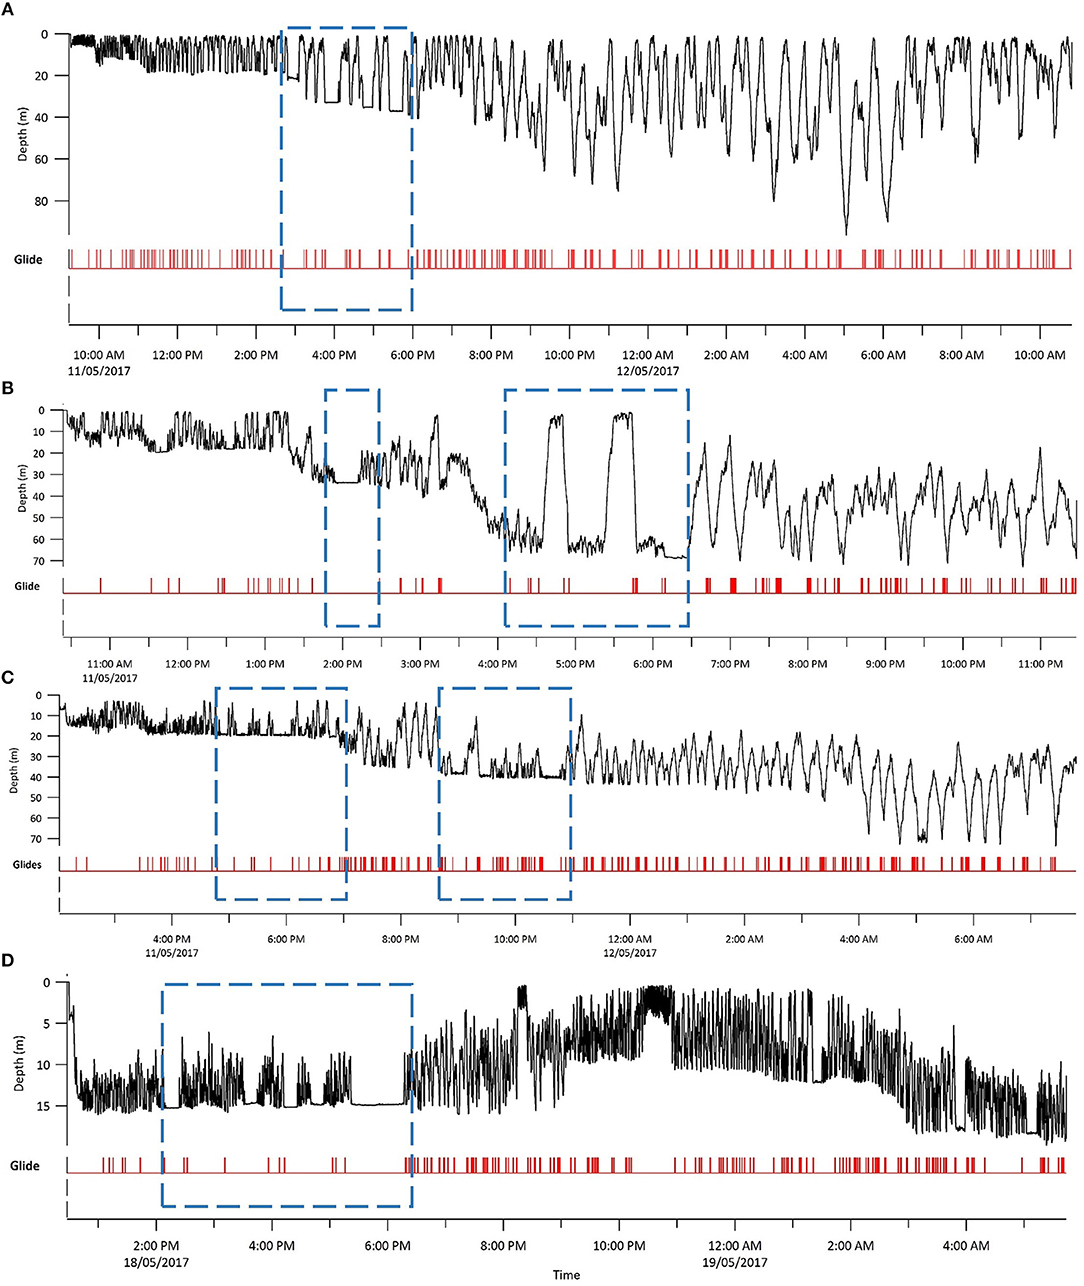
Figure 3. Entire depth record and gliding behavior for each tagged sandbar shark. Glides are marked where the mask analysis determined gliding was occurring. Dashed blue squares denote extended periods of U-shaped diving, and associated looping behavior. (A) Shark 1; (B) Shark 2; (C) Shark 3; and (D) Shark 4. Note that both x- and y-axes scales differ between sharks.
Tortuosity and Three-Dimensional Paths
All sharks displayed periods of both directional and tortuous travel, with an overall mean of 0.51 ± 0.22 (range among indivduals 0.007–0.96, Table 3). The GLMs revealed a significant negative relationship between tortuosity and diving ratio for three of the four individual sharks, with turning explaining 53–66% of the variation in diving ratio (Table 4; Supplementary Figure 3). Shark 2 showed no significant relationship between tortuosity and diving ratio, with this individual observed to display relatively high levels of tortuosity throughout the track in comparison to the other sharks (Table 3). Further investigation of the windows with the highest tortuosity (high sum of turning angles and low ), found tortuous windows to be associated with U-shaped dives (Figure 4). Due to extended periods of level swimming, the diving ratio was relatively low in sampling windows containing U-shaped dives. For all tagged sharks, pseudo-tracks displayed repeated circling on the bottom phase of these dives, irrespective of depth (Figure 5). For example, U-shaped dives dives recorded throughout dusk periods had circling phases at depths of 36.5, 67, 67, and 14.6 m for each individual shark, respectively (Figure 5). These bottom phases lasted a maximum of 55 min.
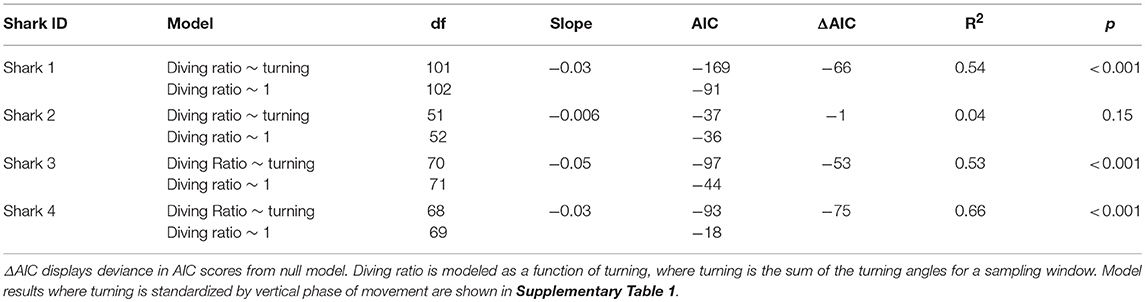
Table 4. Linear model comparisons using Akaike's Information Criterion (AIC), R2, and p-values.
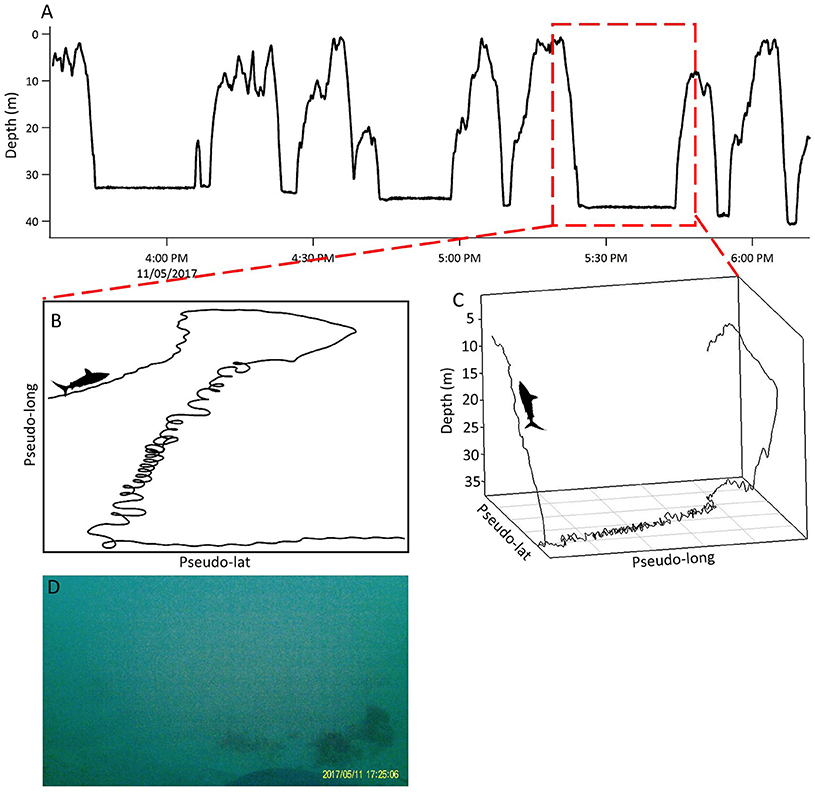
Figure 4. U-shaped dives and looping behavior in Shark 1. (A) Depth record displaying U-shaped dives in the late afternoon and dusk. Red square denotes 15 min period of looping behavior displayed in (C) and (D). (B) Pseudo-track. (C) 3D track. (D) Screenshot of Shark 1 swimming at the seabed on the bottom phase of a U-shaped dive. Shark silhouette indicates direction of travel by shark. Note that the x and y-axes in (B) and (C) represent arbitrary units of latitude and longitude as they were created by dead-reckoning using magnetometer and accelerometer data assuming a constant speed.
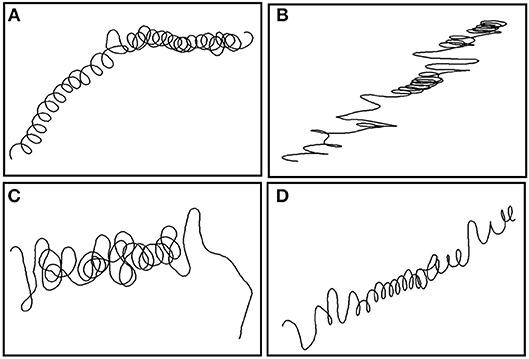
Figure 5. Fifteen minute pseudo-tracks of looping behavior from each sandbar individual around dusk. (A) Shark 1 at 17:30 at depth 36 m; (B) Shark 2 at 18:08 at depth 67 m; (C) Shark 3 at 17:47 at depth 67 m; and (D) Shark 4 at 17:42 at depth 15 m.
As sampling windows of low or high diving ratio represented U- or V-shaped dives, respectively, models were taken a step further to investigate changes in turning angle for each phase of vertical movement. Significant negative relationships were revealed between diving ratio and turning angles for both level and ascent phases in Sharks 1, 3 and 4 (Supplementary Table 1). The relationship was stronger for level swimming phases (R2 = 0.32–0.42) than ascent phases (R2 = 0.12–0.19). More tortuous ascents were evident in U-shaped dives, and directional ascents in V-shaped dives (Figure 6). No relationship was found between descent turning angles and diving ratio, and similar patterns of descent were found in both V- and U-shaped dives (e.g., Figure 6).
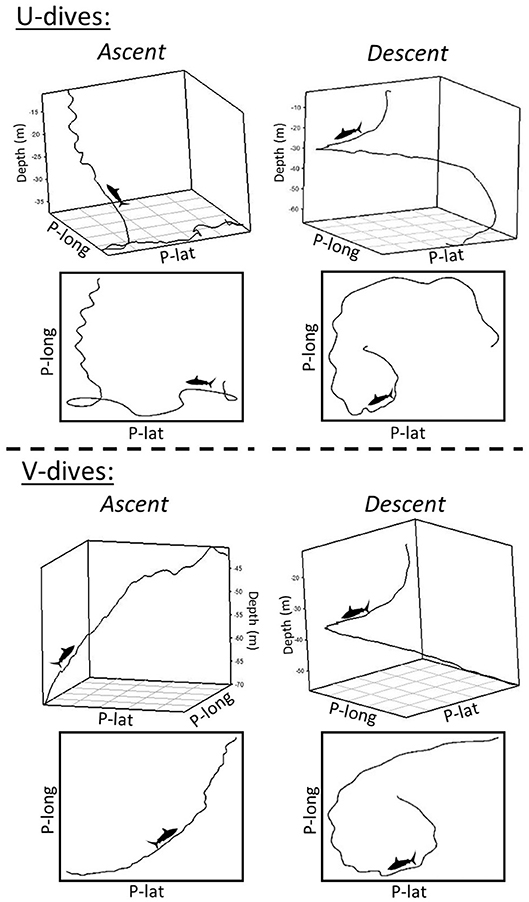
Figure 6. Five minute 3D tracks and pseudo-tracks of turning behavior throughout the ascents and descents of U-shaped dives and V-shaped dives. X and Y axes represent arbitrary units of latitude (P-lat) and longitude (P-long) as they were created by dead-reckoning using magnetometer and accelerometer data assuming a constant speed. The Z axes in the 3D plots represents depth (m).
Video
The 6 h of video validated gliding and turning behavior, and identified seabed habitat at the bottom of dives. No interactions with prey or conspecifics were observed, and the only other animals observed were trevally accompanying the shark, and one school of baitfish briefly swimming through the field of view. For Shark 1, a 24 min video recorded a U-shaped dive at dusk. The video confirmed the bottom phase of the dive occurred at the seabed in a sandy habitat with patchy weed and reef, and validated the circling behavior (Supplementary Video 1).
Discussion
Our deployment of biologging tags on adult female sandbar sharks revealed oscillatory and tortuous movement paths. Tagged sharks underwent continual V- and U-shaped dives through the water column, diving at shallow angles and displaying tortuous circling behaviors throughout the bottom phase of U-shaped dives.
Tortuous Circling Behavior
As traveling in a straight line is the most energetically efficient form of movement, the higher energetic costs of turning should be offset by other benefits, such as enhanced foraging success (Wilson et al., 2013). Because turn costs increase linearly with angle, Wilson et al. (2013) predicted that more acute turns should be strongly motivated, and would have a tendency to be clustered in time and space. The tortuous circling behavior observed in all sandbar sharks supported these predictions, occurring on the seabed throughout the bottom phase of U-shaped dives, and predominately occurring around dusk. Possible explanations for this behavior include intra-specific interactions, the presence of favorable oceanographic conditions, or foraging behavior. Given that no conspecifics were observed in any of the recorded video, and circling behavior was observed in both well-mixed offshore and protected inshore environments, it is unlikely that intra-specific interactions or oceanographic conditions are acting as the primary drivers of the recorded patterns. The most likely explanation for such behavior is that it aids in foraging in this species.
Tortuous movement paths across a range of both aquatic and terrestrial taxa have been used as a proxy to identify foraging and may be associated with prey pursuit, or search for prey either upon encountering a cue or based on past learning experiences (Austin et al., 2006; Wilson et al., 2007; Byrne and Chamberlain, 2012; Papastamatiou et al., 2012; Adachi et al., 2017). Sandbar shark diets are dominated by demersal fauna, such as bentho-pelagic fishes, cephalopods and crustaceans (McElroy et al., 2006; Ellis and Musick, 2007), and at dusk many nocturnal benthic species emerge from their diurnal refuges (Helfman, 1986). The circling behavior that sandbar sharks were recorded to display on the seabed may therefore represent a strategy to increase the chance of capturing prey at this time. In addition to undertaking circling behavior on the bottom phase of U-shaped dives, relatively higher turning angles were recorded on the ascent phase of U-shaped dives in comparison to V-shaped dives. It is possible that sandbar sharks may also be searching for prey throughout the ascent phase of U-shaped dives while moving between benthic foraging patches. On ascent, sharks may be able to search for prey that are backlit and silhouetted against the surface, and potentially ambush them from below (Martin and Hammerschlag, 2012). No changes in turning angle were observed between dive types during descent, indicating that individuals may be less motivated to search for prey in this phase.
Vertical Movements
Previous studies reporting vertical movements of sandbar sharks have found these animals to reach maximum depths of over 250 m and display diel patterns in movement (Papastamatiou et al., 2006; Barnes et al., 2016). Barnes et al. (2016) found that sandbar sharks tagged off eastern Australia exhibited a preference for deeper waters throughout daylight hours. Our fine-scale movement data showed that sandbar sharks displayed continual patterns of oscillatory vertical movements in both inshore and offshore habitats that were likely bathymetrically limited, reaching a maximum depth of 96.6 m. Shallow dive angles occurred throughout the tracks, with relatively symmetrical patterns in ascent and descent. Due to the limited duration of tag attachment, we were not able to explore diel patterns in vertical movement, particularly as patterns during the day were biased to the shallow inshore waters in which the sharks were tagged. U-shaped dives, however, occurred in both inshore and offshore habitats, predominately around dusk. Several other species of elasmobranch have been found to display diel patterns in foraging-related behaviors, with crepuscular periods commonly being associated with enhanced activity rates (Gleiss et al., 2013, 2017a; Papastamatiou et al., 2015, 2018b). Despite a potential preference for foraging at this time, sandbar sharks may still feed opportunistically throughout other diel periods, as occurs in gray reef sharks (Carcharhinus amblyrhynchos) (Papastamatiou et al., 2018b). This may account for occasional U-shaped dives observed throughout the night in sandbar shark depth traces (Figure 3). However, we again highlight the limited duration of tag attachment in our study and longer tag deployments are required to determine if these patterns occur on a diel cycle.
Species Comparisons
Repetitive oscillatory movements through the water column are a common feature of the tracks of nearly all epipelagic fishes for which fine-scale depth traces have been recorded (Carey and Scharold, 1990; Klimley et al., 2002; Schaefer et al., 2009). Recent studies using biologging tags on tiger sharks (Galeocerdo cuvier) and oceanic whitetip sharks (Carcharhinus longimanus) suggested that these dives likely function as a means of searching for prey (Nakamura et al., 2011; Papastamatiou et al., 2018a). However, if sandbar sharks are predominately searching for prey on the seabed, continual hunting forays through the water column are unlikely to be the primary motivator of these movements. Alternatively, these animals may be indirectly searching for benthic prey by oscillating through vertically stratified layers for olfactory cues in between patches (Carey and Scharold, 1990; Klimley et al., 2002). In addition, data from tri-axial sensors suggest that they are doing so in an energetically efficient manner. Shallow dive angles and gliding behavior appear to be common feature of the vertical movements of all large epipelagic fishes for which detailed data records are available (Furukawa et al., 2011; Gleiss et al., 2011a,b; Meekan et al., 2015; Papastamatiou et al., 2018a). Given the need to oscillate through the water column to search for cues, shallow dive angles and intermittent gliding behavior have been calculated to minimize the cost of transport, culminating in patterns of cost-efficient foraging (Gleiss et al., 2011b; Papastamatiou et al., 2018a). Sandbar sharks descended at very shallow dive angles (mean 11.4 ± 2.2 and −11.5 ± 3.5° for ascent and descent, respectively), with uninterrupted glides of up to 210 s in duration. These angles are comparable with mean dive angles for tiger sharks, oceanic whitetip sharks, and whale sharks (Rhincodon typus). Mean ascent and descent angles for tiger sharks were recorded at 9.4 and −11°, respectively (Andrzejaczek, unpublished data), and rarely exceeded absolute dive angles of 11° for oceanic whitetip sharks (Papastamatiou et al., 2018a). For whale sharks mean descent angles of 12–13° were documented, with highly variable ascent angles varying 10–25° depending on dive type (Gleiss et al., 2011b). The shallower dive angles were estimated to minimize the cost of horizontal travel for whale sharks, and may have been near the minimum angle required for gliding to be possible. However, in contrast to sandbar sharks, whale sharks would continuously glide on a majority of descents. A number of factors may be responsible for these inter-specific differences in gliding behavior, including body composition (i.e., ratio lipids to lean tissue) (Gleiss et al., 2017b), morphometrics influencing lift and drag, and the increased drag incurred by smaller sharks carrying relatively large biologging tags.
Limitations and Future Considerations
Despite our limited sample size and tag attachment durations, consistent patterns emerged among tagged individuals. Populations of sandbar sharks at Ningaloo mostly consist of adult females (Braccini and Taylor, 2016; Braccini et al., 2017), therefore tagging in other locations will likely be required to obtain a more representative sample of both sexes and all size classes. Durations of attachment (>24 h) in our study were limited by our need to recover biologging tags to download the data. Offshore swimming behavior of the tagged individuals meant that the distances involved in tag recovery following 24 h of attachment were at the limit of our VHF radio range and offshore boat license in two cases (25–30 km). Longer durations of tag attachment will provide a greater understanding of diel cycles of movement in this species, and an increased capacity to record and store video will aid in revealing more about the drivers of movements, particularly in relation to foraging behaviors. We also acknowledge that the recovery rate of sharks from capture processes can be difficult to define, and that we may not be recording natural behaviors in our current study. Although continuous glides of up to 210 s were recorded by sandbar sharks, sparse tailbeats frequently interrupted gliding descents. The possibility that drag due to the tag (Whitney et al., 2019) may be playing a role in inhibiting natural gliding behaviors in this and other studies that use relatively large biologging devices requires future investigation. Lastly, accurate speed measurements and GPS anchor points would considerably enhance dead-reckoning analyses, allowing further insight into fine-scale locational and habitat preferences (Walker et al., 2015).
Conclusions
Evaluating the results of our study in the context of broad scale ecological knowledge for the species provided new ecological insights into the fine spatial and temporal scale movement behaviors of the sandbar shark. Collectively, patterns recorded by biologging tags on sandbar sharks suggested energetically efficient oscillatory swimming behaviors whilst moving between benthic hunting patches, consistent with biologging studies emphasizing the role of cost-efficient foraging. Larger sample sizes with extended tag recording durations will enable greater ecological insight into these behaviors.
Ethics Statement
All methods were performed in accordance with approved guidelines by the University of Western Australia Animal Ethics Committee (RA/3/100/1437), and under permit numbers 2,881 (WA Department of Fisheries) and 08-000322-3 (WA Department of Parks and Wildlife).
Author Contributions
SA, MM, and AG conceived the study. SA and AG performed fieldwork/data collection. SA, AG, CP and MM analyzed and interpreted the data. SA led the writing of the manuscript. All authors read and approved the final manuscript.
Conflict of Interest Statement
The authors declare that the research was conducted in the absence of any commercial or financial relationships that could be construed as a potential conflict of interest.
Acknowledgments
We thank Murdoch University and Coral Bay Research Station for accommodation and vessel use while conducting fieldwork. This work would not have been possible without the generous support of numerous field volunteers, particularly: Karissa Lear, Frazer McGregor, Abraham Sianipar, Adam Jolly, Evan Byrnes, Garry Teesdale and Michael Tropiano. Nikolai Liebsch provided invaluable assistance with tag functioning. We are grateful to Lauren Peel and two reviewers, whose comments greatly improved this manuscript.
Supplementary Material
The Supplementary Material for this article can be found online at: https://www.frontiersin.org/articles/10.3389/fmars.2018.00483/full#supplementary-material
Funding
Funding for this research was provided by crowdfunding on the Experiment platform (DOI: 10.18258/7190), a Holsworth Wildlife Research Endowment and a UWA Graduate Research School fieldwork award. SA was funded by an Australian Postgraduate Award and UWA top-up scholarship. Two CATS tags were provided by Big Wave Productions.
References
Adachi, T., Costa, D. P., Robinson, P. W., Peterson, S. H., Yamamichi, M., Naito, Y., et al. (2017). Searching for prey in a three-dimensional environment: hierarchical movements enhance foraging success in northern elephant seals. Funct. Ecol. 31, 361–369. doi: 10.1111/1365-2435.12686
Austin, D., Bowen, W. D., McMillan, J. I., and Iverson, S. J. (2006). Linking movement, diving, and habitat to foraging success in a large marine predator. Ecology 87, 3095–3108. doi: 10.1890/0012-9658(2006)87[3095:lmdaht]2.0.co;2
Barnes, C. J., Butcher, P. A., Macbeth, W. G., Mandelman, J. W., Smith, S. D. A., and Peddemors, V. M. (2016). Movements and mortality of two commercially exploited carcharhinid sharks following longline capture and release off eastern Australia. Endanger Species Res. 30, 193–208. doi: 10.3354/esr00730
Braccini, M., Rensing, K., Langlois, T., and McAuley, R. (2017). Acoustic monitoring reveals the broad-scale movements of commercially important sharks. Mar. Ecol. Prog. Ser. 577, 121–129. doi: 10.3354/meps12251
Braccini, M., and Taylor, S. (2016). The spatial segregation patterns of sharks from Western Australia. R. Soc. Open Sci. 3:160306. doi: 10.1098/rsos.160306
Brewster, L. R., Dale, J. J., Guttridge, T. L., Gruber, S. H., Hansell, A. C., Elliott, M., et al. (2018). Development and application of a machine learning algorithm for classification of elasmobranch behaviour from accelerometry data. Mar. Biol. 165:62. doi: 10.1007/s00227-018-3318-y
Brownscombe, J. W., Gutowsky, L. F., Danylchuk, A. J., and Cooke, S. J. (2014). Foraging behaviour and activity of a marine benthivorous fish estimated using tri-axial accelerometer biologgers. Mar. Ecol. Prog. Ser. 505, 241–251. doi: 10.3354/meps10786
Byrne, M. E., and Chamberlain, M. J. (2012). Using first-passage time to link behaviour and habitat in foraging paths of a terrestrial predator, the racoon. Anim. Behav. 84, 593–601. doi: 10.1016/j.anbehav.2012.06.012
Carey, F. G., and Scharold, J. V. (1990). Movements of blue sharks (Prionace glauca) in depth and course. Mar. Biol. 106, 329–342. doi: 10.1007/bf01344309
Chapple, T. K., Gleiss, A. C., Jewell, O. J. D., Wikelski, M., and Block, B. A. (2015). Tracking sharks without teeth: a non-invasive rigid tag attachment for large predatory sharks. Anim. Biotelemetry 3, 1–8. doi: 10.1186/s40317-015-0044-9
Cliff, G., Dudley, S. F. J., and Davis, B. (1988). Sharks caught in the protective gill nets off Natal, South Africa. 1. The sandbar shark Carcharhinus plumbeus (Nardo). South Afr. J. Mar. Sci. 7, 255–265. doi: 10.2989/025776188784379035
Ebert, D. A., Fowler, S., and Compagno, L. (2013). Sharks of the World: A Fully Illustrated Guide. Plymouth: Nature Press.
Ellis, J. K., and Musick, J. A. (2007). Ontogenetic changes in the diet of the sandbar shark, Carcharhinus plumbeus, in lower Chesapeake Bay and Virginia (USA) coastal waters. Environ. Biol. Fishes 80, 51–67. doi: 10.1007/s10641-006-9116-2
Ferreira, L. C., Mansfield, K. L., Thums, M., and Meekan, M. G. (2019). “Satellite tracking technologies and their application to shark movement ecology,” in Shark Research: Emerging Technologies and Applications for the Field and Laboratory, eds. J. C. Carrier, R. Heithaus Michael, and C. A. Simpfendorfer (Boca Raton, FL: CRC Press).
Friard, O., and Gamba, M. (2016). BORIS: a free, versatile open-source event-logging software for video/audio coding and live observations. Methods Ecol. Evol. 7, 1325–1330. doi: 10.1111/2041-210x.12584
Furukawa, S., Kawabe, R., Ohshimo, S., Fujioka, K., Nishihara, G., Tsuda, Y., et al. (2011). Vertical movement of dolphinfish Coryphaena hippurus as recorded by acceleration data-loggers in the northern East China Sea. Environ. Biol. Fishes 92, 89–99. doi: 10.1007/s10641-011-9818-y
Gleiss, A. C., Jorgensen, S. J., Liebsch, N., Sala, J. E., Norman, B., Hays, G. C., et al. (2011a). Convergent evolution in locomotory patterns of flying and swimming animals. Nat. Commun. 2:352. doi: 10.1038/ncomms1350
Gleiss, A. C., Morgan, D. L., Whitty, J. M., Keleher, J. J., Fossette, S., and Hays, G. C. (2017a). Are vertical migrations driven by circadian behaviour? Decoupling of activity and depth use in a large riverine elasmobranch, the freshwater sawfish (Pristis pristis). Hydrobiologia 787, 181–191. doi: 10.1007/s10750-016-2957-6
Gleiss, A. C., Norman, B., Liebsch, N., Francis, C., and Wilson, R. P. (2009). A new prospect for tagging large free-swimming sharks with motion-sensitive data-loggers. Fish. Res. 97, 11–16. doi: 10.1016/j.fishres.2008.12.012
Gleiss, A. C., Norman, B., and Wilson, R. P. (2011b). Moved by that sinking feeling: variable diving geometry underlies movement strategies in whale sharks. Funct. Ecol. 25, 595–607. doi: 10.1111/j.1365-2435.2010.01801.x
Gleiss, A. C., Potvin, J., and Goldbogen, J. A. (2017b). Physical trade-offs shape the evolution of buoyancy control in sharks. Proc. R. Soc. B Biol. Sci. 284:20171345. doi: 10.1098/rspb.2017.1345
Gleiss, A. C., Wright, S., Liebsch, N., Wilson, R. P., and Norman, B. (2013). Contrasting diel patterns in vertical movement and locomotor activity of whale sharks at Ningaloo Reef. Mar. Biol. 160, 2981–2992. doi: 10.1007/s00227-013-2288-3
Grubbs, R. D., Musick, J. A., Conrath, C. L., and Romine, J. G. (2007). “Long-term movements, migration, and temporal delineation of summer nurseries for juvenile sandbar sharks in the Chesapeake Bay region,” in Shark Nursery Grounds of the Gulf of Mexico and the East Coast Waters of the United States, Vol. 50, eds C. T. McCandless, N. E. Kohler, and H. L. Pratt Jr. (Bethesda, MD: American Fisheries Society Symposium), 87–108.
Helfman, G. S. (1986). “Fish behaviour by day, night and twilight,” in The Behaviour of Teleost Fishes, ed. T. J. Pitcher (Boston, MA: Springer US), 366–387.
Kawatsu, S., Sato, K., Watanabe, Y., Hyodo, S., Breves, J. P., Fox, B. K., et al. (2009). A new method to calibrate attachment angles of data loggers in swimming sharks. EURASIP J. Adv. Signal Process. 2010:732586. doi: 10.1155/2010/732586
Klimley, A. P., Beavers, S. C., Curtis, T. H., and Jorgensen, S. J. (2002). Movements and swimming behavior of three species of sharks in La Jolla Canyon, California. Environ. Biol. Fish. 63, 117–135. doi: 10.1023/A:1014200301213
Lear, K. O., and Whitney, N. M. (2016). Bringing data to the surface: recovering data loggers for large sample sizes from marine vertebrates. Anim. Biotelemetry 4:1. doi: 10.1186/s40317-016-0105-8
Martin, R. A., and Hammerschlag, N. (2012). Marine predator–prey contests: ambush and speed versus vigilance and agility. Mar. Biol. Res. 8, 90–94. doi: 10.1080/17451000.2011.614255
McAuley, R. B., Simpfendorfer, C. A., Hyndes, G. A., and Lenanton, R. C. J. (2007). Distribution and reproductive biology of the sandbar shark, Carcharhinus plumbeus (Nardo), in Western Australian waters. Mar. Freshw. Res. 58, 116–126. doi: 10.1071/MF05234
McElroy, W. D., Wetherbee, B. M., Mostello, C. S., Lowe, C. G., Crow, G. L., and Wass, R. C. (2006). Food habits and ontogenetic changes in the diet of the sandbar shark, Carcharhinus plumbeus, in Hawaii. Environ. Biol. Fish. 76, 81–92. doi: 10.1007/s10641-006-9010-y
Meekan, M., Fuiman, L., Davis, R., Berger, Y., and Thums, M. (2015). Swimming strategy and body plan of the world's largest fish: implications for foraging efficiency and thermoregulation. Front. Mar. Sci. 2:64. doi: 10.3389/fmars.2015.00064
Mitani, Y., Sato, K., Ito, S., Cameron, M. F., Siniff, D. B., and Naito, Y. (2003). A method for reconstructing three-dimensional dive profiles of marine mammals using geomagnetic intensity data: results from two lactating Weddell seals. Polar Biol. 26, 311–317. doi: 10.1007/s00300-003-0487-y
Musick, J., Stevens, J. D., Baum, J. K., Bradai, M., Clò, S., Fergusson, I., et al. (2009). “Carcharhinus plumbeus,” in The IUCN Red List of Threatended Species 2009: e.T3853A10130397.
Nakamura, I., Watanabe, Y. Y., Papastamatiou, Y. P., Sato, K., and Meyer, C. G. (2011). Yo-yo vertical movements suggest a foraging strategy for tiger sharks Galeocerdo cuvier. Mar. Ecol. Prog. Ser. 424, 237–246. doi: 10.3354/meps08980
Nathan, R., Getz, W. M., Revilla, E., Holyoak, M., Kadmon, R., Saltz, D., et al. (2008). A movement ecology paradigm for unifying organismal movement research. Proc. Natl. Acad. Sci. U.S.A. 105:19052. doi: 10.1073/pnas.0800375105
Papastamatiou, Y. P., DeSalles, P. A., and McCauley, D. J. (2012). Area-restricted searching by manta rays and their response to spatial scale in lagoon habitats. Mar. Ecol. Prog. Ser. 456, 233–244. doi: 10.3354/meps09721
Papastamatiou, Y. P., Iosilevskii, G., Leos-Barajas, V., Brooks, E. J., Howey, L. A., Chapman, D. D., et al. (2018a). Optimal swimming strategies and behavioral plasticity of oceanic whitetip sharks. Sci. Rep. 8:551. doi: 10.1038/s41598-017-18608-z
Papastamatiou, Y. P., Itano, D. G., Dale, J. J., Meyer, C. G., and Holland, K. N. (2010). Site fidelity and movements of sharks associated with ocean-farming cages in Hawaii. Mar. Freshw. Res. 61, 1366–1375. doi: 10.1071/MF10056
Papastamatiou, Y. P., Watanabe, Y. Y., Bradley, D., Dee, L. E., Weng, K., Lowe, C. G., et al. (2015). Drivers of daily routines in an ectothermic marine predator: hunt warm, rest warmer? PLoS ONE 10:e0127807. doi: 10.1371/journal.pone.0127807
Papastamatiou, Y. P., Watanabe, Y. Y., Demšar, U., Leos-Barajas, V., Bradley, D., Langrock, R., et al. (2018b). Activity seascapes highlight central place foraging strategies in marine predators that never stop swimming. Mov. Ecol. 6:9. doi: 10.1186/s40462-018-0127-3
Papastamatiou, Y. P., Wetherbee, B. M., Lowe, C. G., and Crow, G. L. (2006). Distribution and diet of four species of carcharhinid shark in the Hawaiian Islands: evidence for resource partitioning and competitive exclusion. Mar. Ecol. Prog. Ser. 320, 239–251. doi: 10.3354/meps320239
Pewsey, A., Neuhäuser, M., and Ruxton, G. D. (2013). Circular Statistics in R. Oxford: Oxford University Press.
R Core Team (2017). R: A Language and Environment for Statistical Computing. Vienna: R.F.f.S. Computing.
Sakamoto, K. Q., Sato, K., Ishizuka, M., Watanuki, Y., Takahashi, A., Daunt, F., et al. (2009). Can ethograms be automatically generated using body acceleration data from free-ranging birds. PLoS ONE 4:e5379. doi: 10.1371/journal.pone.0005379
Schaefer, K. M., Fuller, D. W., and Block, B. A. (2009). “Vertical movements and habitat utilization of Skipjack (Katsuwonus pelamis), Yellowfin (Thunnus albacares), and Bigeye (Thunnus obesus) Tunas in the Equatorial Eastern Pacific Ocean, ascertained through archival tag data,” in Tagging and Tracking of Marine Animals with Electronic Devices, eds. J. L. Nielsen, H. Arrizabalaga, N. Fragoso, A. Hobday, M. Lutcavage, and J. Sibert (Dordrecht: Springer Netherlands), 121–144.
Shepard, E. L. C., Wilson, R. P., Quintana, F., Laich, A. G., Liebsch, N., Albareda, D. A., et al. (2008). Identification of animal movement patterns using tri-axial accelerometry. Endanger. Species Res. 10, 47–60. doi: 10.3354/esr00084
Stevens, J. D., and McLoughlin, K. J. (1991). Distribution, size and sex composition, reproductive biology and diet of sharks from northern Australia. Mar. Freshw. Res. 42, 151–199. doi: 10.1071/MF991015
Walker, J. S., Jones, M. W., Laramee, R. S., Holton, M. D., Shepard, E. L. C., Williams, H. J., et al. (2015). Prying into the intimate secrets of animal lives; software beyond hardware for comprehensive annotation in ‘Daily Diary' tags. Mov. Ecol. 3:29. doi: 10.1186/s40462-015-0056-3
Whitney, N. M., Lear, K. O., Gleiss, A. C., Payne, N., and White, C. F. (2019). Advances in the application of high-resolution biologgers to Elasmobranch fishes,” in Shark Research: Emerging Technologies and Applications for the Field and Laboratory, eds. J. C. Carrier, H. M. R., and C. Simpfendorfer (Boca Raton, FL: CRC Press).
Whitney, N. M., Papastamatiou, Y. P., and Gleiss, A. C. (2012). “Integrative multi-sensor tagging of elasmobranchs: emerging techniques to quantify behavior, physiology, and ecology,” in Biology of Sharks and Their Relatives, eds. J. Carrier, J. A. Musick, and M. Heithaus (Boca Raton: CRC Press).
Whitney, N. M., White, C. F., Gleiss, A. C., Schwieterman, G. D., Anderson, P., Hueter, R. E., et al. (2016). A novel method for determining post-release mortality, behavior, and recovery period using acceleration data loggers. Fish. Res. 183, 210–221. doi: 10.1016/j.fishres.2016.06.003
Wilson, R. P., Griffiths, I. W., Legg, P. A., Friswell, M. I., Bidder, O. R., Halsey, L. G., et al. (2013). Turn costs change the value of animal search paths. Ecol. Lett. 16, 1145–1150. doi: 10.1111/ele.12149
Keywords: tagging, movement ecology, tortuosity, vertical movement, dive energetics
Citation: Andrzejaczek S, Gleiss AC, Pattiaratchi CB and Meekan MG (2018) First Insights Into the Fine-Scale Movements of the Sandbar Shark, Carcharhinus plumbeus. Front. Mar. Sci. 5:483. doi: 10.3389/fmars.2018.00483
Received: 24 October 2018; Accepted: 29 November 2018;
Published: 10 December 2018.
Edited by:
Alastair Martin Mitri Baylis, South Atlantic Environmental Research Institute, Falkland IslandsReviewed by:
Yannis Peter Papastamatiou, Florida International University, United StatesMatthew Ajemian, Florida Atlantic University, United States
Copyright © 2018 Andrzejaczek, Gleiss, Pattiaratchi and Meekan. This is an open-access article distributed under the terms of the Creative Commons Attribution License (CC BY). The use, distribution or reproduction in other forums is permitted, provided the original author(s) and the copyright owner(s) are credited and that the original publication in this journal is cited, in accordance with accepted academic practice. No use, distribution or reproduction is permitted which does not comply with these terms.
*Correspondence: Samantha Andrzejaczek, c2FuZHJ6ZWphY3pla0BnbWFpbC5jb20=