 Erik R. Veldhuis
 Maarten Schrama
 Marten Staal1
 J. Theo M. Elzenga
- 1Plant Ecophysiology, Groningen Institute for Evolutionary Life Sciences, University of Groningen, Groningen, Netherlands
- 2Institute of Environmental Sciences, Leiden University, Leiden, Netherlands
It is increasingly acknowledged that stressors can resonate across the boundaries between ecosystems. Salt marshes, vast areas shaped by ocean-shore interactions, constitute prime examples of ecosystems where multiple stress factors arising from one ecosystem act on the local community of another ecosystem. Although it is generally recognized that zonation of plant communities on salt marshes is strongly affected by marine stress factors associated with frequent flooding (salinity, anoxia), it is largely unknown what the isolated and interacting effect are of these different stressors. This calls for experiments to disentangle the relative effects of these single and interacting multiple stressors. In this study, we determined the single and interacting effects of two main abiotic stress factors on salt marshes: salinity and anoxia (as a result of flooding) and one biotic stress factor: soil compaction (as a result of livestock grazing) on the growth of the twelve dominant salt marsh plant species, using a full-factorial experiment. To link the experimental work to distributions of natural plant communities along a natural stress gradient, we related our experimental results to observed plant species distributions on a salt marsh that is exposed to all these three stressors. Salinity strongly affected ten species with two high-marsh species not surviving the highest salinity levels whereas anoxia only consistently affected growth of four species. Interestingly, we observed no synergistic effect of anoxia and salinity in salt marsh plants. Moreover, we observed a trade-off between the amount of aerenchyma and mechanical strength, indicating that species vary in their resistance to soil compaction. Overall, our results suggest that salinity is a major determinant of plant species composition on the salt marsh, followed by anoxia. The importance of soil compaction depends on salt marsh elevation: on the low marsh, increased oxygen supply by aerenchyma seems to outweigh resistance against mechanical stress whereas on the anaerobe low marsh, the reverse applies. Using the experimental data to predict cover of plant species in the field, our results suggest that the combination of plant responses to the various stressors may be a powerful predictor for explaining the plant composition on the salt marsh.
Introduction
Coastal salt marshes represent a series of important habitats for a unique and highly specific assemblage of plants and animals. Almost all species in these habitats possess particular adaptations to deal with the stressful abiotic conditions that are associated with frequent flooding with seawater and a water-saturated, compacted clay soil with limited gas exchange (Justin and Armstrong, 1987; Jackson and Armstrong, 1999). The plant species composition follows a typical zonation pattern along the elevation gradient (Eleuterius and Eleuterius, 1979; Roozen and Westhoff, 1985; Olff et al., 1988; Brewer et al., 1997). Elevation determines the duration and frequency of inundations: the lower parts of the salt marsh are flooded daily whereas the higher parts flood only a few times per year (Bockelmann et al., 2002). Periodic flooding with seawater results in environmental gradients in salinity, redox potential, soil N content, soil clay content and soil organic matter, all of which strongly covary (Davy et al., 2011; Janousek and Folger, 2014). Anoxia and elevation (Davy et al., 2011) or salinity and elevation (Janousek and Folger, 2014) have previously been proposed to explain most variation in plant species composition. However, these conclusions were not based on experiments designed to quantify the relative contribution of the different stressor and therefore, hierarchical partitioning models were used to address these. As such, the possible interactions, causality and relative contribution of each of these stress factors has, to date, not been determined experimentally. Understanding the abiotic drivers of plant species distribution and of vegetation composition patterning thus requires experiments to determine the relative effect of each individual stress factor on each plant species. The aim of this study is therefore to disentangle the effects of the different stress factors on plant performance investigate to what extent they interact and correlate these effects with the relative species abundance on the salt marsh.
Oxygen availability is lowest on the low marsh, since it is inundated most often, and gradually increases toward the high marsh. Root apical meristems always suffer from oxygen deficiency (Ober and Sharp, 1996; Geigenberger, 2003) and especially in anoxic environments this will negatively affect plant performance (Bailey-Serres and Voesenek, 2008; Elzenga and Veen, 2010). A common adaptation to anoxia is the formation of aerenchyma (Armstrong, 1980), a system of connected intercellular air-filled spaces in plants, which facilitates internal ventilation and enhances oxygen supply to the roots and prevents accumulation of carbon dioxide, ethylene and methane (ButterbachBahl et al., 1997; Colmer, 2003; Evans, 2004; Pedersen et al., 2010). Despite these benefits, in many species aerenchyma is only formed under special conditions, for example during waterlogging (Visser et al., 2000). Since aerenchyma is absent in many plant species and underdeveloped in most conditions, it is likely that there may be costs associated with aerenchyma or its formation. To date, there is a lack of quantitative information on such possible disadvantages (Ryser et al., 2011; Huber and Linder, 2012).
Salinity is highest on the low marsh and decreases toward the high marsh (Olff et al., 1997). Plants have developed several adaptations to deal with high salinities (see Yan et al., 2013; Zhang and Shi, 2013), but most of these adaptations are rather energy-expensive (Flowers and Colmer, 2008). Since oxygen depletion decreases ATP production and thus the energy availability, a synergic effect of salinity and anoxia can be expected, which can be lethal for glycophytic plant species (Barrett-Lennard, 2003; Colmer and Flowers, 2008). Although there is a lack of quantitative information, the effects of salinity and anoxia do not seem to be synergic in halophytes (Colmer and Flowers, 2008).
The effects of oxygen deficiency and salinity can be expected to be exacerbated by herbivore-induced soil compaction. Well-known effects of large herbivores on vegetation composition operate via selective grazing (Olff and Ritchie, 1998) and nutrient cycling (Bardgett and Wardle, 2003). However, soil compaction, as a result of herbivore trampling (Hamza and Anderson, 2005), can be an important additional factor explaining plant species distributions (Schrama et al., 2013a; Veldhuis et al., 2014). Particularly on wet, fine textured soils like in salt marshes, compaction (through crushing) could affect root survival specifically in species with a fragile root structure due to aerenchyma formation. Herbivore-induced soil compaction can increase soil water saturation, and thereby reduce the amount of oxygen and the rate of nitrogen cycling in the soil (Schrama et al., 2013b), and increase soil salinity (Srivastava and Jefferies, 1996). These effects could depend on the elevation gradient, since on the one hand densities of large herbivores are higher around the fresh water sources on the high marsh (Nolte et al., 2014) and on the other hand, anoxia effects of compaction are more pronounced on the low marsh (Schrama et al., 2013a).
Here, we examine the separate impact of three stress factors, namely anoxia, salinity, and mechanical pressure, on the performance of a range of different salt marsh plant species to better understand plant distributions on a salt marsh. We expected that plants respond to salt, anoxia, and compaction pressure according to their place on the gradient: plant species from the low end of the elevation gradient are expected to be most capable of dealing with these stressors. In addition, we examined possible trade-offs between the various stress factors. The trade-offs between different acclimations to distinct, but simultaneously occurring stress factors, potentially reflect the observed vegetation distribution on a salt marsh. To this end, we collected twelve dominant plant species from the salt marsh and cultured them under different concentrations of salt and oxygen while we measured their relative growth rate (RGR). As a proxy for the effect of mechanical stress caused by trampling, the compression as a result of increasing lateral force was measured. The root diameter as well as type and volume of aerenchyma were determined. These parameters were linked to the strength of the root, i.e., the resistance to compression by a laterally applied force. Finally we compared the results with the species abundance of the grazed and ungrazed, high and low salt marsh to determine which stress factors shape plant species composition in the field.
Materials and Methods
Plant Material
For this study, twelve dominant salt marsh species were selected from a total species pool of 20 species (Esselink et al., 2015). Specimens of each of the twelve dominant or characteristic plant species selected for this study were collected on March 17th, 2013 on a mainland salt marsh at the Dutch Wadden sea coast (Noord Friesland Buitendijks, 53°20′N; 05°43′E) and taken to the glasshouse facility of the University of Groningen. General species information (main plant association and location on the salt marsh) is given in Table 1. After removing most of the soil from the roots, the plants were potted on a mixture of sand and loam and allowed to recover for two to four weeks. Plants were grown in a glasshouse at a day/night temperature of 22/18°C with a 14-h photoperiod at a minimum of PPFD of 150 μmol m-2 s-1 at plant level supplied by Philips HPI-T (400 W) lamps.
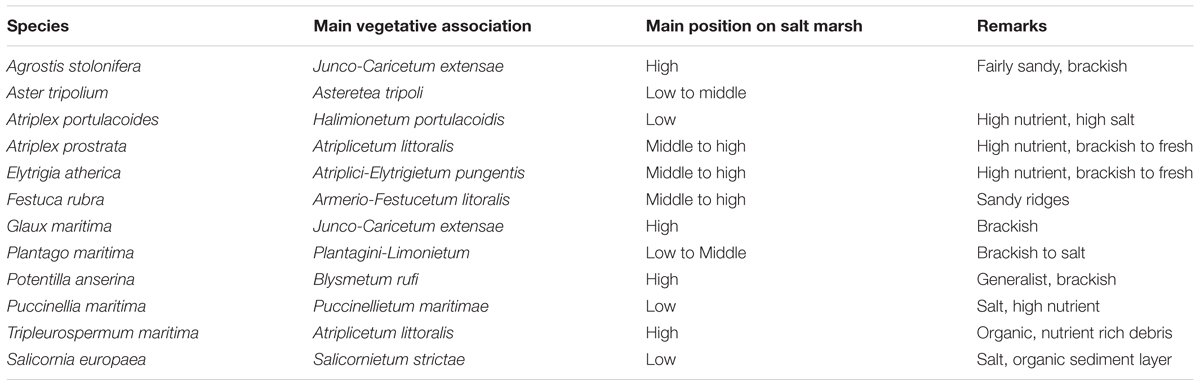
Table 1. Overview of the ecological position on the salt marsh of the species used.
At least 20 plants of each species were removed from the soil mixture and transferred to 30 l tanks (dimensions 60 cm × 25 cm × 20 cm) filled with a 50% Hoagland solution (Hoagland and Arnon, 1938) supplemented with 10 mM NaCl and continuously bubbled with air. In the solution used to culture Salicornia europaea the NaCl concentration was raised to 50 mM, as this species did not survive on 10 mM NaCl. Aster tripolium, Potentilla anserina, and Glaux maritima were cultivated on 25% Hoagland solution until day 7 (day 13 for A. tripolium) of the oxygen experiment (see section “Aerobic and anoxic treatment”) after which the culturing was continued on a 50% Hoagland solution (doubling the available nutrients) to prevent nutrient deficiency development.
Aerobic and Anoxic Treatments
From the container with Hoagland solution the plants were transferred, at least eleven plants per species each, to two tanks containing a 50% Hoagland, 10 mM NaCl and 0.05% (w:v) agar solution. The agar was added to decrease convection in the tank (Wiengweera et al., 1997). After one day one tank was flushed with air, creating aerobe conditions and the other was flushed with nitrogen gas, creating anoxic conditions. Due to low germination success of S. europaea, we transferred 4 and 7 individuals to aerobe and anoxic conditions, respectively. By doing so the plants with the anoxic treatment were exposed for one day to mild hypoxia and after flushing with nitrogen gas to anoxia (Colmer and Greenway, 2011). This two-step approach is used to avoid cell death and simulate the gradually changing field conditions after flooding (Drew, 1997; Evans, 2004; Bailey-Serres and Voesenek, 2008). The aerobic and anoxic tanks were flushed for 5 min every other day with air and nitrogen gas, respectively. The flushing with N2 resulted in a 0% O2 level in the tank. After the flushing with air the oxygen concentration in the nutrient solution of the aerobic treatment was 21%, but this slowly decreased in the course of 2 days to 2–5%, due to respiratory activity of the roots and microbes. Although the aerobic treatment thereby became hypoxic, the regular elevation of the oxygen concentration does increase the oxygen availability to the roots as is evidenced by the growth stimulatory effect that was observed earlier (Colmer and Greenway, 2011). The plant growth measurements were started after 5 days of acclimation of the plants to the new conditions. The RGR (g g-1 d-1) was determined on the basis of FW measurements every second day during a 6-day period.
Salt Treatment
For the salt experiment 4–9 plants of eleven species from the aerobic treatment were transferred to a container with 50% Hoagland and 0.05% (w:v) agar supplemented with 10 mM NaCl and 4–9 plants were transferred to an identical solution, but with an NaCl concentration of 300 mM. The flushing of these tanks with air for 5 min every other day was maintained for these plant treatments. The plants from the anoxic treatment were identically distributed over two new containers containing 10 and 300 mM NaCl, respectively. These tanks were flushed with nitrogen gas for 5 min every other day. Since too few individuals of S. europaea survived the oxygen experiment this species was excluded from the salt experiment. For both the oxygen and salt experiment the plants were allowed to acclimate to the new conditions for 5 days before the growth measurements were started. The RGR (g g-1 d-1) was determined on the basis of FW measurements every second day during a 6-day period. To avoid algal growth the solutions in both the oxygen and the salt experiment were replaced every week.
Root Cross Sections
The effect of oxic and anoxic treatments on aerenchyma development was measured by making thin (25 μm) slices of roots at 2 cm behind the root tip with a MT.5503 hand microtome (Euromex Microtome, Arnhem, Netherlands). The slices were examined under an Olympus CX-41 microscope and photographed using a Euromex CMEX 5000 camera with ImageFocus v3.0 software. The photographs of microscopic cross sections were analyzed with Photoshop (version 11.0.2), determining percentage area occupied by air cavities (root porosity) and root diameter. The type of aerenchyma was determined using the classification following Jung et al. (2008).
Mechanical Strength
To determine the effect of porosity of the root cortex on the resistance to deformation of the root by lateral force, five plants from the anoxia treatment were randomly selected for each species. For Elytrigia atherica, Festuca rubra, and Tripleurospermum maritima plants were also selected from the oxic treatment to increase the variation in root porosity for these species and study the relation between root mechanical strength and percentage aerenchyma in more detail. Of each individual plant, three roots were used to measure the mechanical strength with a Linkam TST350 tensile stag. This device contains two measuring blocks (20 mm × 20 mm × 8 mm) between which the root is placed, after which the blocks are slowly moved toward each other at a rate of 20 μm s-1. It then measures the force that acts on the blocks while the gap between the two measuring blocks is closed and lateral pressure is exerted on the root. Since aerenchyma is fully developed from 2 cm from the root tip onward (Visser et al., 2000; Striker et al., 2007), root samples 2–4 cm from the root tip were placed between the blocks of the TST350. For a few experiments the lateral distortion of the root was recorded on video visualize the different stages of the force-compression: compression without visual damage at low force, until crushing at the final force applied. The slope of root diameter (in μm) vs. applied compression force at 1.3N (see Figure 1) was used as a proxy for root strength. This force was chosen, as the compression of the root was only a few percent in all species and by visual observation it was confirmed that only the epidermis and cortex were involved in the deformation. Graphs were analyzed using GraphPad Prism 6. Roots of S. europaea and Atriplex maritima were too small to determine mechanical strength and were therefore not investigated. The effect of oxygen availability on aerenchyma formation and mechanical strength was determined in detail for A. tripolium (n = 5 and 4 for the aerobe and anaerobe treatment, respectively) and E. atherica (n = 8 and 10 for the aerobe and anaerobe treatment, respectively).
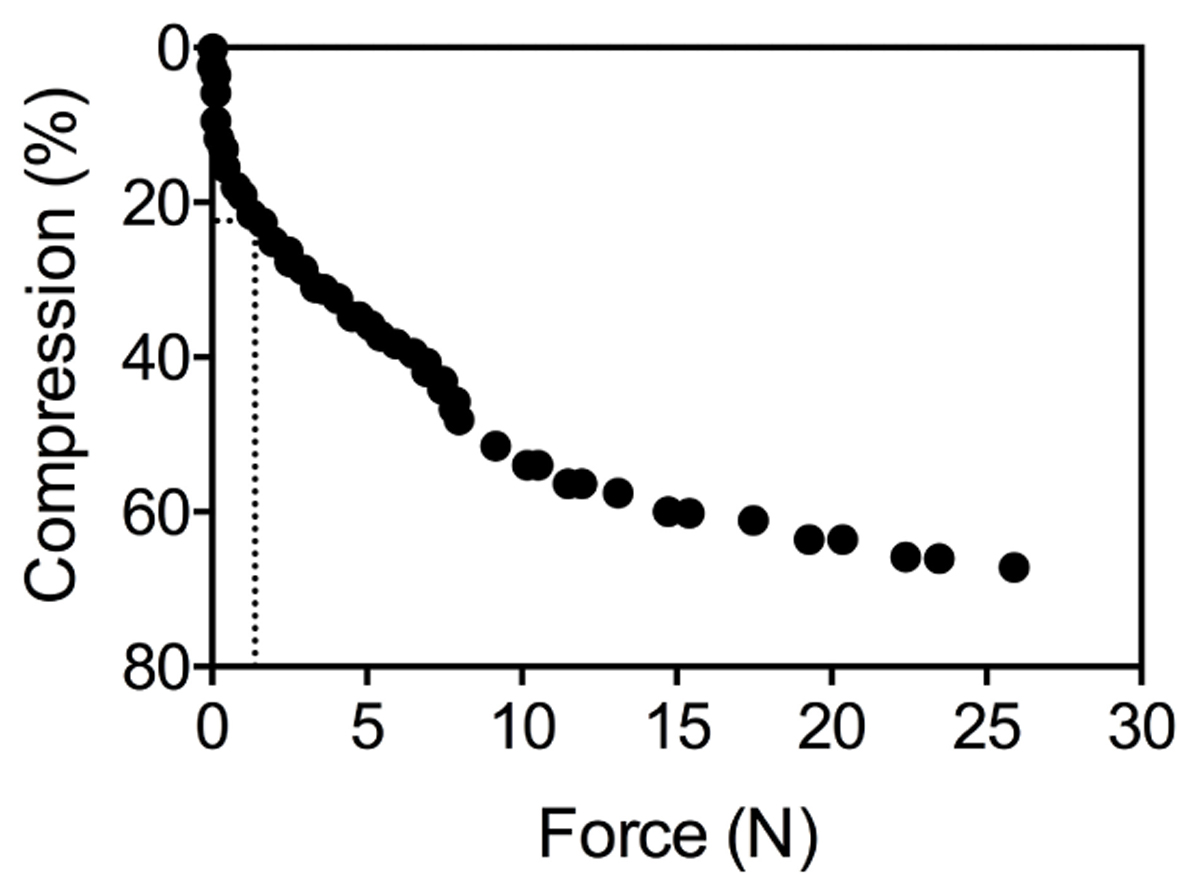
Figure 1. Raw data of the compression (%) of one root under an increasing mechanical pressure (N). The dotted lines show that a force of 1.3N corresponds with a 22% change in root diameter.
Plant Abundance on Salt Marsh vs. Laboratory Experiment
To examine whether salt, oxygen and mechanical strength can explain plant species abundance in the field, our data were compared with the species abundance on the high and low salt marsh (Nolte et al., 2014). Nolte et al. (2014) determined the plant cover (%) of 40 plant species, including our species between 2010 and 2013. They used 56 plots, which differed in elevation (high and low salt marsh) and grazing regime (cattle, horses, and control). Each treatment contained at least 4 replicates per year. The mean plant cover per species (%, averaged over 4 years period for all replicates of the control treatment) at the low and high marsh, respectively, was compared to the mean RGR’s of our oxygen experiment and the saline treatments of our salt experiment. We expected that species with a high RGR would outcompete other species by means of light competition and therefore would be more abundant than species with a lower RGR. Furthermore, we expected that species cover on the high marsh would be explained best by the RGR’s of plants from the non-saline, aerobe treatment, whereas species composition on the low marsh would be explained best by the saline, anaerobe treatment.
Statistical Analysis
The statistical analyses were performed using R 3.2.3. The effect of species and oxygen availability on the RGR in our oxygen experiment was tested with a two factor generalized least squares model, where the effect of oxygen availability on each species specific RGR was tested using student’s t-tests. To test the assumptions of homogeneity of variance, we used a Bartlett’s test; to meet the assumption of normality of residuals, we inspected the standardized residuals and tested those on normality using a Shapiro-Wilk test. When residuals were not normally distributed or variances were non-homogenous we used a Wilcoxon signed rank test and a t-test for unequal variances, respectively. The effects of anoxia and salinity on RGR in our salt experiment were tested with two factor general linear models for each of the eleven species. Because we expected that species with a higher RGR in our experiment would grow faster and thus outcompete other species in the field, we tested whether the observed RGRs in our experiments correlated with plant abundance in the field using a Pearson product-moment correlation. We compared the plant species RGR of our four treatments with the plant abundance on the ungrazed non-saline aerobe high marsh and the ungrazed saline anaerobe low marsh [data from Nolte et al. (2014)]. We used plant abundance to the power of 0.15 to meet assumptions of normality. A linear regression was used to test the effect of aerenchyma on root compaction. Student’s t-tests were used to test the effect of the oxygen treatment on root compaction and aerenchyma in A. tripolium and E. atherica. Pearson product-moment correlations were used to test the correlations between aerenchyma, root compaction and herbivore induced changes, the relative abundance of a plant species in presence of herbivores (cattle or horses) compared to its abundance in absence of herbivores. In order to meet assumptions on normal distribution and homogeneous variances root compaction and herbivore induced changes were always log-transformed. We used the square root of aerenchyma only when it was compared to herbivore induced changes.
Results
Tolerance to Abiotic Stress
Tolerance of plants to the three different stress factors: anoxia, high salinity and mechanical compression was determined for 12, 11, and 10 dominant salt marsh species, respectively.
Salt marsh species reacted differently to the hypoxia treatment (F1,11 = 14.57, P < 0.001; see Table 2 for the effect per species). Hypoxia inhibited the growth in Atriplex portulacoides, Atriplex prostrata, F. rubra, and Plantago maritima but not in other species. Surprisingly, hypoxic conditions significantly increased the growth in A. tripolium, G. maritima, and T. maritima.
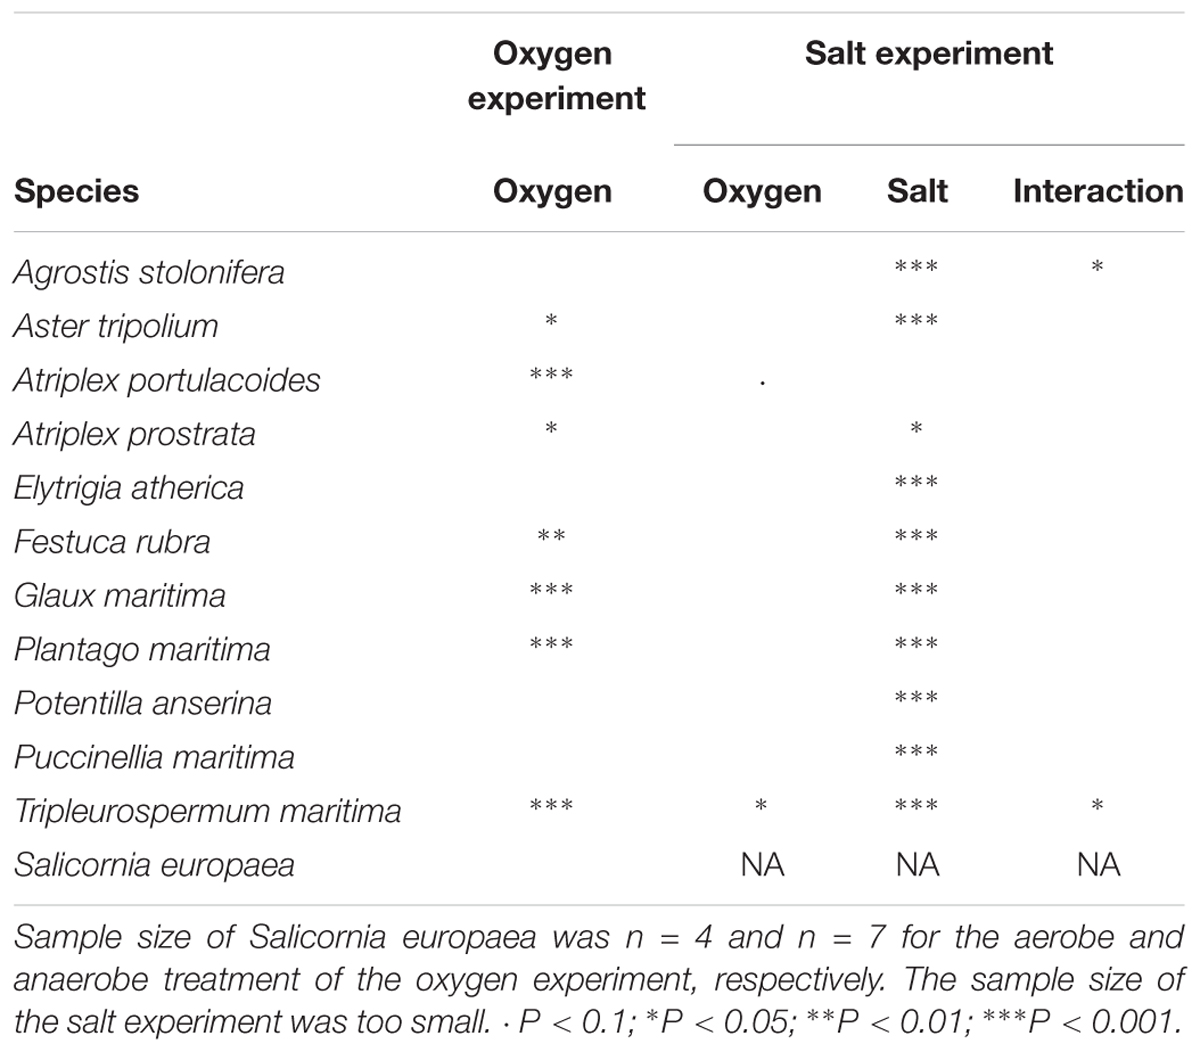
Table 2. Summary of the effects of oxygen and salt on FW relative growth rate (g g-1 d-1) from the oxygen (n = 11–17) and salt experiment (n = 4–9).
We observed four different types of aerenchyma in the roots of salt marsh plants (Table 3). We hypothesized that aerenchyma would improve the hypoxia tolerance – defined as the difference between the average growth under hypoxia treatment and under oxia treatment per species. However, root porosity did not correlate with hypoxia tolerance (r = -0.14, P = 0.68).
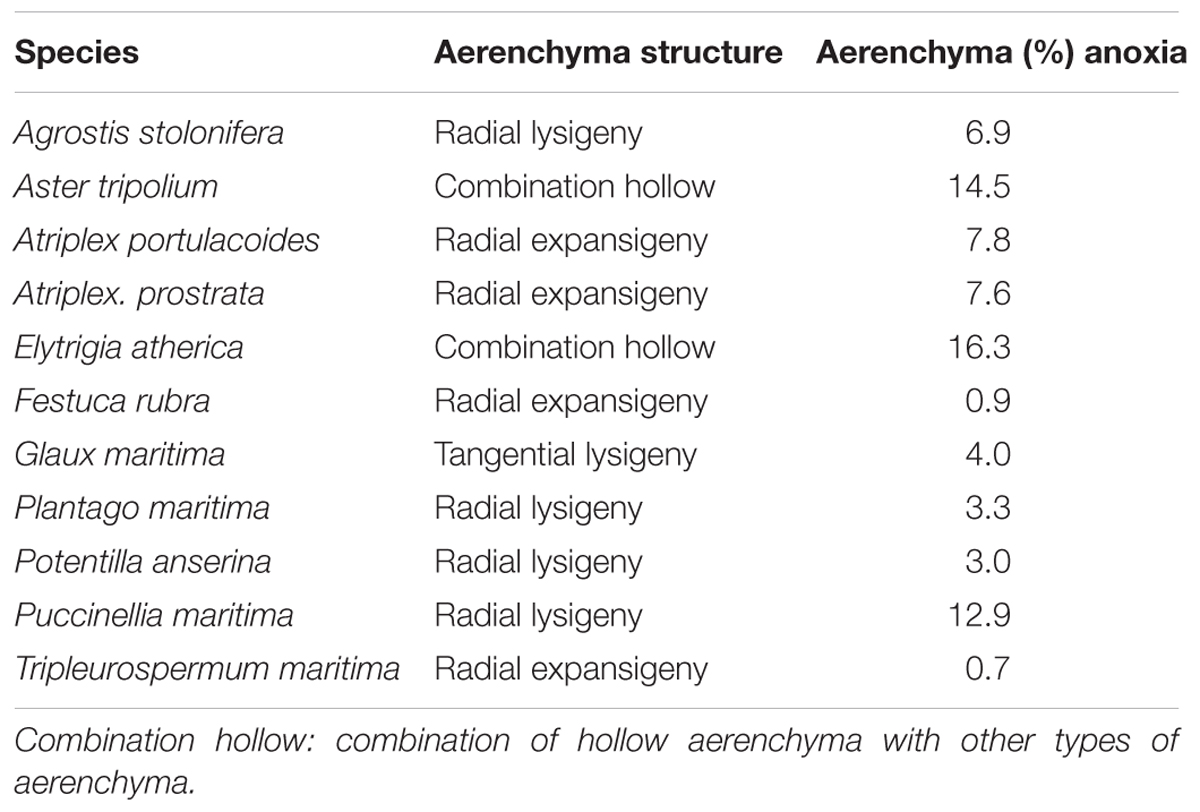
Table 3. Structure and mean percentage of aerenchyma of plants that grew under anoxic conditions per species (n = 5–14).
Plant species responded differently to both salt and oxygen (Figure 2 and Table 2). Salt decreased the growth significantly in 10 out of 11 species. Only the RGR of A. portulacoides, a low-marsh species, was not significantly affected by our salt treatment (Figure 2C). All individuals of Agrostis stolonifera and P. anserina, typical high marsh species, had died at the end of the experiment when exposed to the highest salt concentration (300 mM NaCl) (Figures 2A,I).
Figure 2. FW Relative growth rates (g g-1 d-1; RGR) under different treatments of the glasshouse experiment. Each panel (A–K) represents one species. The RGR of 0 is marked with a black line. Treatments oxia and anoxia represent RGR from the oxygen experiment, n = 11–17except for Salicornia europaea (oxia n = 4, anoxia n = 7). Treatments salt and anoxia salt represent RGR from the salt experiment, n = 4–9. The error bars denote 1SD. ∗P < 0.05; ∗∗∗P < 0.001; ns, not significant.
Comparison Glasshouse Experiment and Field Plant Abundance
We compared the RGR data of each treatment of our glasshouse experiment with the species plant cover on an ungrazed high and low salt marsh.
The relative cover of plant species on the high marsh, an area that can be considered relatively aerated and non-saline, correlates well with plant species RGR of our non-saline (both aerobe and anaerobe) treatments (aerobe r = 0.51, P = 0.11; anaerobe r = 0.54, P = 0.08; Figures 3A,C). When E. atherica and Puccinellia maritima were excluded, the correlation became very strong (aerobe r = 0.84, P = 0.005; anaerobe r = 0.79, P = 0.01) (see section “Discussion” for an explanation for excluding E. atherica and Pu. maritima). The RGR’s of the species in the other treatments did not correlate with the plant abundance on the high marsh (Figures 3E,G and Table 4).
Figure 3. Plant cover per species(%) of the high (A,C,E,G) and low (B,D,F,H) salt marsh as a function of the mean FW relative growth rate (g g-1 d-1) for different treatments of the oxygen (A–D) and salt (E–H) experiment. The dotted lines in A,G show the correlation when Puccinellia maritima and Elytrigia atherica are not taken into account (A,C,E,G, n = 11; B,D,F,H, n = 10). Festuca rubra and Potentilla anserina were not present on the low marsh and not displayed in graphs B,D,F,H. The error bars denote 1SD. Outcomes of the Pearson product-moment correlation tests are listed in Table 4.
Table 4. Summary of the Pearson product-moment correlation tests showing the correlation coefficient between the mean FW relative growth rate (g g-1 d-1) per treatment of the glasshouse experiments and the plant cover on the high and low marsh in the field (n = 11 and n = 10 for the non-saline and saline correlations, respectively).
Plant abundance on the low marsh, which is relatively water-logged and saline, correlated best with the RGR’s of our aerobe, saline treatment (Table 4 and Figure 3F; r = 0.64, P = 0.046).
Oxygen only explained a small part of the correlations of the high marsh (compare a, b, e, f with c, d, g, h, respectively). Salinity on the other hand strongly affected the correlations (compare Figures 3A–D with Figures 3E–H respectively).
Mechanical Strength
Mechanical strength of roots differed between species (F9,116 = 21.7,P < 0.001). We found no significant correlation between root compression – a measure for mechanical strength – and amount of aerenchyma between species (F1,8 = 1.81,P = 0.21) (Figure 4A). The observed lack of relationship between aerenchyma and mechanical strength could be due to large interspecific differences in resistance to lateral compression, as different plants appear to have different aerenchyma architectures (Table 3; i.e., the highly structured, spoke-and-wheel-structure of Pu. maritima vs. the diffuse, sponge-like aerenchyma structure of E. atherica). Within species, however, we did observe a relationship between root porosity and the mechanical strength, and this relationship was influenced by the oxygen treatment. For both A. tripolium and E. atherica, the low oxygen treatment increased root porosity (t = 3.23, df = 7, P = 0.014, and t = 2.05, df = 16, P = 0.057, respectively) and decreased mechanical strength (t = 2.91, df = 7, P = 0.023, and t = 2.95, df = 16, P = 0.009, respectively). We used the range in aerenchyma to test whether the formation of air cavities influenced the mechanical strength. Root porosity correlated negatively with mechanical strength in A. tripolium (Figure 4B; r = 0.90, P = 0.001) and in E. atherica (Figure 4C; r = 0.48, P = 0.045).
Figure 4. The root compression (%) during a force of 1.3N is plotted against the amount of aerenchyma (%) for: (A) all species except Atriplex portulacoides and Salicornia europaea (n = 10), (B) Aster tripolium (n = 9), and (C) Elytrigia atherica (n = 18). The closed and open circles represent roots with an oxic ( ) and anoxic (
 ) treatment, respectively. The dotted lines show confidence intervals of 95%. ∗P < 0.05; ∗∗∗P < 0.001; ns, not significant.
Root Porosity Compared to Trampling
Herbivore-induced changes in plant cover (Figure 5A) is strongly correlated with the root porosity (%) on the high marsh (r = -0.76, cattle P = 0.010; r = -0.60, horse P = 0.068). This indicates that species with a high root porosity performed worse in the grazed high marsh compared to the ungrazed high marsh. Species with low root porosity performed better in the grazed high marsh compared to the ungrazed high marsh. Herbivore-induced changes on the low marsh did not correlate with root porosity (cattle, P = 0.55, horses, P = 0.15; Figure 5B). When T. maritima, a species that is restricted to the organic debris-rich flood mark, is discarded the correlation between root porosity and herbivore-induced changes increased strongly (dotted lines in Figure 5B; cattle, r = -0.66, P = 0.077; horses, r = -0.81, P = 0.015). None of the herbivore-induced changes correlated with the mechanical strength of plant roots of our glasshouse experiment.
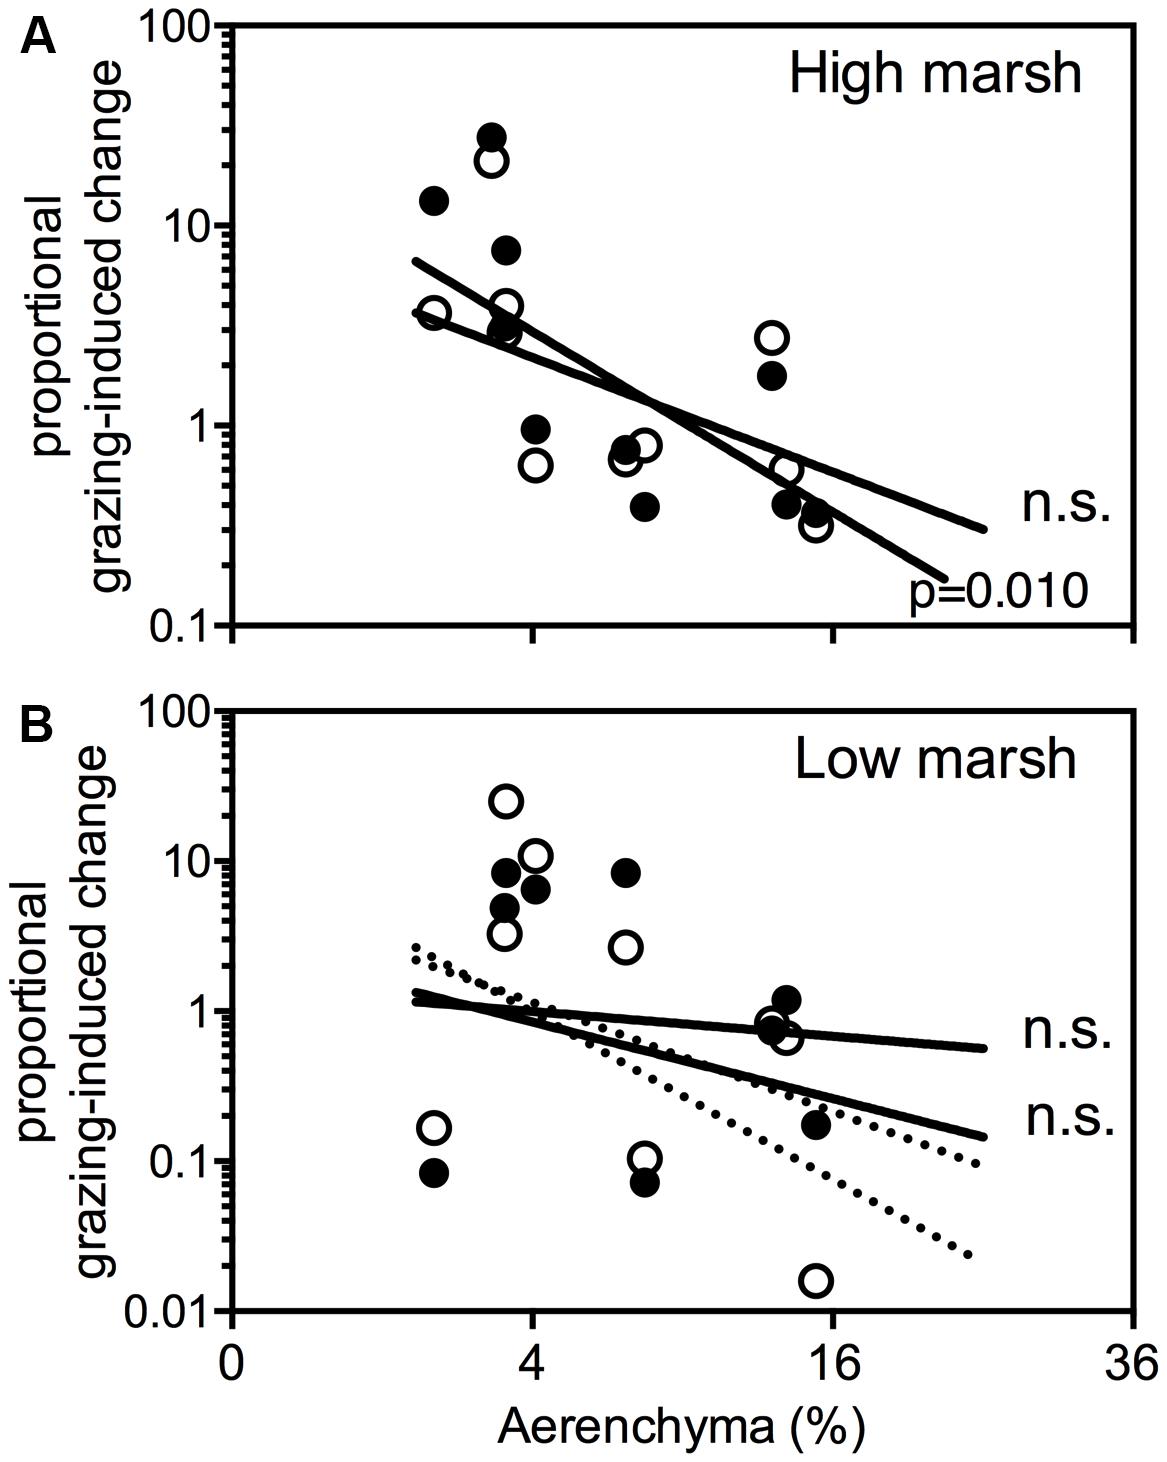
Figure 5. Proportional grazing-induced plant cover change per species on the high marsh (A) and low marsh (B) is plotted against the amount of aerenchyma (%). Proportional grazing-induced change is defined as plant cover (%) in presence of large herbivores [cattle () and horse () divided by plant cover (%) in absence of large herbivores]. The dotted lines in (B) show thecorrelations when Tripleurospermum maritima is not taken into account. ns, not significant.
Discussion
It is generally accepted that plant species distributions on coastal salt marshes follows gradients of abiotic stress factors (Olff et al., 1988; Bockelmann et al., 2002; Davy et al., 2011). Previous studies examined the isolated effects of salinity, anoxia and herbivores (Olff et al., 1988; Ryser et al., 2011; Veeneklaas et al., 2011), or a combined effect of two factors related to herbivory (van Klink et al., 2015), compaction and leaf clipping, showing differential survival rates under these treatments between plant species. This study aimed at separating the effects of salinity, anoxia and mechanical stress on plant distribution.
Some Clear Exceptions
A single plant trait like RGR was not sufficient to explain the abundance of E. atherica and Pu. maritima on the high marsh. E. atherica was more abundant than predicted by its RGR, which may be the result of a specific competitive advantage such as the ability to produce tall growing, clonal patches which out-shade other plants. Pu. maritima was under-represented in the field when compared to predictions based on RGR. This is likely the result of the intense grazing pressure of hare, geese and cattle on this species, which has been linked to its very high soluble sugar concentration (Fokkema et al., 2016).
Plants React Differently to the Various Stress Factors
Plant species varied strongly in their response to different stress factors, but in general showed the strongest response to salt stress. Some species did not survive the high salt treatment, whereas A. portulacoides was not affected by the high salinity levels. Anoxia, on the other hand, only resulted in growth inhibition for some species, like A. portulacoides, which was in accordance with earlier reports [e.g., Cott et al. (2013)]. In general, the effect of anoxia alone on RGR was small, 1% on average per species, compared to the effect of salinity (78%) and could be far less important in explaining salt marsh plant distributions than suggested by field studies (Davy et al., 2011; Janousek and Folger, 2014). In glycophytes the combination of anoxia and salt has a synergistic effect. Colmer and Flowers (2008) suggested that there is no synergistic detrimental effect of anoxia and salinity in halophytes, although there was a lack of quantitative data to support this hypothesis. Here we provide quantitative data that confirms this hypothesis.
Contrary to our expectations, we found no relation between the absolute amount of aerenchyma in the roots and the effect of anoxia. It is important to note that in our glasshouse growth experiment only the direct effect of oxygen depletion was investigated, whereas in the field, plants are exposed to both direct and indirect effects of anoxia. For example, anoxia can indirectly influence plant productivity by increasing the levels of CO2, ethylene, Mn2+, Fe2+, S2- and carboxylic acids (Ingold and Havill, 1984; Colmer and Flowers, 2008). The formation of aerenchyma could be instrumental in removing these toxic compounds (Evans, 2004). Another explanation for the absence of a correlation between root porosity and the effect of the anoxia treatment is that nutrient availability in our laboratory experiment may have been much higher than observed in the field (Kiehl et al., 2001). Plants with little aerenchyma that grow under anoxic conditions may suffer from nutrient limitation because oxygen depletion generally results in decreased nutrient uptake and root functioning (Drew, 1997; Elzenga and Veen, 2010). High nutrient availability in our experiment might therefore have obscured reduced root function caused by anoxia. Hence, the indirect effects of anoxia may be more important than previously thought and could explain the difference between results from our experiments and previous field studies.
Trade-Offs Between Anoxia and Mechanical Stress Explain Observed Vegetation Distributions
Our results indicate a trade-off between aerenchyma and mechanical strength (Figures 4B,C). Mechanical root strength appears relatively important in explaining the difference in plant composition on the grazed and ungrazed high marsh (Figure 5A), but did not improve the model on the low marsh (Figure 5B). We suggest that the trade-off between aerenchyma and mechanical strength is key to understand this finding. Soils on the Dutch high marsh are relatively non-saline and well oxygenated and as such, the benefits of aerenchyma may be low. The reduced mechanical strength caused by aerenchyma can therefore be costly on a high, grazed salt marsh, whereas in an anoxic, highly saline, low marsh soil aerenchyma formation is essential for survival. On the low marsh the reduced mechanical strength is probably greatly outweighed by the benefits of aerenchyma.
Conclusion
Elevation and inundation frequency are often used to explain plant composition on salt marshes but an experimental discrimination investigating the underlying abiotic gradients that could elucidate the mechanisms that determine plant species composition was lacking until now. In this study, we experimentally separated the effects of three important stress factors that can shape plant communities in the field. Our results show that the response of plants to salt stress, anoxia and mechanical stress differs markedly between salt marsh plant species. Moreover, the high correlations between plant performance in the laboratory and plant abundance in the field suggest that RGR s under different oxygen and salt conditions are important predictors for plant species abundance in the field. The observed trade-off between mechanical strength and aerenchyma formation likely explain why salinity and anoxia are most important in determining plant composition on the low marsh whereas mechanical strength becomes more important on the grazed high marsh. Our study thus illustrates that inclusion of a number of plant physiological responses to a multitude of stress factors can improve understanding of the composition of plants in natural communities.
Data Availability Statement
The raw data supporting the conclusion of this manuscript will be made available by the authors, without undue reservation, to any qualified researcher.
Author Contributions
All authors conceived and designed the study. EV and MSt performed the experiments. EV, MSc, and JE analyzed the data and wrote the manuscript.
Conflict of Interest Statement
The authors declare that the research was conducted in the absence of any commercial or financial relationships that could be construed as a potential conflict of interest.
Acknowledgments
We thank Mikhail V. Dutka of the Physics Department of the University of Groningen for providing the possibility to determine root strength. Furthermore, we are grateful to Stefanie Nolte for providing the detailed plant cover data of Noard Fryslan Butendyks. Finally, we also thank It Fryske Gea for giving permission to collect plants from the vast salt marshes of Noard Fryslan.
References
Armstrong, W. (1980). “Aeration in higher plants,” in Advances in Botanical Research, ed. H. W. Woolhouse (Cambridge, MA: Academic Press), 225–332.
Bailey-Serres, J., and Voesenek, L. (2008). Flooding stress: acclimations and genetic diversity. Annu. Rev. Plant Biol. 59, 313–339. doi: 10.1146/annurev.arplant.59.032607.092752
Bardgett, R. D., and Wardle, D. A. (2003). Herbivore-mediated linkages between aboveground and belowground communities. Ecology 84, 2258–2268. doi: 10.1890/02-0274
Barrett-Lennard, E. G. (2003). The interaction between waterlogging and salinity in higher plants: causes, consequences and implications. Plant Soil 253, 35–54. doi: 10.1023/A:1024574622669
Bockelmann, A. C., Bakker, J. P., Neuhaus, R., and Lage, J. (2002). The relation between vegetation zonation, elevation and inundation frequency in a Wadden Sea salt marsh. Aquat. Bot. 73, 211–221. doi: 10.1016/S0304-3770(02)00022-0
Brewer, J. S., Levine, J. M., and Bertness, M. D. (1997). Effects of biomass removal and elevation on species richness in a New England salt marsh. Oikos 80, 333–341. doi: 10.2307/3546601
ButterbachBahl, K., Papen, H., and Rennenberg, H. (1997). Impact of gas transport through rice cultivars on methane emission from rice paddy fields. Plant Cell Environ. 20, 1175–1183. doi: 10.1046/j.1365-3040.1997.d01-142.x
Colmer, T. D. (2003). Long-distance transport of gases in plants: a perspective on internal aeration and radial oxygen loss from roots. Plant Cell Environ. 26, 17–36. doi: 10.1046/j.1365-3040.2003.00846.x
Colmer, T. D., and Flowers, T. J. (2008). Flooding tolerance in halophytes. New Phytol. 179, 964–974. doi: 10.1111/j.1469-8137.2008.02483.x
Colmer, T. D., and Greenway, H. (2011). Ion transport in seminal and adventitious roots of cereals during O2 deficiency. J. Exp. Bot. 62, 39–57. doi: 10.1093/jxb/erq271
Cott, G. M., Reidy, D. T., Chapman, D. V., and Jansen, M. A. K. (2013). Waterlogging affects the distribution of the saltmarsh plant Atriplex portulacoides (L.) Aellen. Flora 208, 336–342. doi: 10.1016/j.flora.2013.04.006
Davy, A. J., Brown, M. J. H., Mossman, H. L., and Grant, A. (2011). Colonization of a newly developing salt marsh: disentangling independent effects of elevation and redox potential on halophytes. J. Ecol. 99, 1350–1357. doi: 10.1111/j.1365-2745.2011.01870.x
Drew, M. C. (1997). Oxygen deficiency and root metabolism: injury and acclimation under hypoxia and anoxia. Annu. Rev. Plant Physiol. Plant Mol. Biol. 48, 223–250. doi: 10.1146/annurev.arplant.48.1.223
Eleuterius, L. N., and Eleuterius, C. K. (1979). Tide levels and salt-marsh zonation. Bull. Mar. Sci. 29, 394–400.
Elzenga, J. T., and Veen, H. (2010). “Waterlogging and plant nutrient uptake,” in Waterlogging Signalling and Tolerance in Plants, eds S. Mancuso and S. Shabala (Berlin: Springer), 23–35. doi: 10.1007/978-3-642-10305-6_2
Esselink, P., Bos, D., Daniels, P., van Duin, W. E., and Veeneklaas, R. M. (2015). Van Polder Naar Kwelder: Tien Jaar Kwelderherstel Noarderleech: Tien Jaar Kwelderherstel Noarderleech. Wageningen: Wageningen University & Research.
Evans, D. E. (2004). Aerenchyma formation. New Phytol. 161, 35–49. doi: 10.1046/j.1469-8137.2003.00907.x
Flowers, T. J., and Colmer, T. D. (2008). Salinity tolerance in halophytes. New Phytol. 179, 945–963. doi: 10.1111/j.1469-8137.2008.02531.x
Fokkema, W., de Boer, W., van der Jeugd, H. P., Dokter, A., Nolet, B. A., De Kok, L. J., et al. (2016). The nature of plant adaptations to salinity stress has trophic consequences. Oikos 125, 804–811. doi: 10.1111/oik.02757
Geigenberger, P. (2003). Response of plant metabolism to too little oxygen. Curr. Opin. Plant Biol. 6, 247–256. doi: 10.1016/S1369-5266(03)00038-4
Hamza, M. A., and Anderson, W. K. (2005). Soil compaction in cropping systems – A review of the nature, causes and possible solutions. Soil Tillage Res. 82, 121–145. doi: 10.1016/j.still.2004.08.009
Hoagland, D. R., and Arnon, D. I. (1938). The Water-Culture Method for Growing Plants Without Soil. Berkeley, CA: University of California.
Huber, M., and Linder, H. P. (2012). The evolutionary loss of aerenchyma limits both realized and fundamental ecohydrological niches in the Cape reeds (Restionaceae). J. Ecol. 100, 1338–1348. doi: 10.1111/j.1365-2745.2012.02022.x
Ingold, A., and Havill, D. C. (1984). The influence of sulfide on the distribution of higher-plants in salt marshes. J. Ecol. 72, 1043–1054. doi: 10.2307/2259550
Jackson, M. B., and Armstrong, W. (1999). Formation of aerenchyma and the processes of plant ventilation in relation to soil flooding and submergence. Plant Biol. 1, 274–287. doi: 10.1111/j.1438-8677.1999.tb00253.x
Janousek, C. N., and Folger, C. L. (2014). Variation in tidal wetland plant diversity and composition within and among coastal estuaries: assessing the relative importance of environmental gradients. J. Veg. Sci. 25, 534–545. doi: 10.1111/jvs.12107
Jung, J., Lee, S. C., and Choi, H. K. (2008). Anatomical patterns of aerenchyma in aquatic and wetland plants. J. Plant Biol. 51, 428–439. doi: 10.1007/BF03036065
Justin, S., and Armstrong, W. (1987). The anatomical characteristics of roots and plant-response to soil flooding. New Phytol. 106, 465–495. doi: 10.1111/j.1469-8137.1987.tb00153.x
Kiehl, K., Esselink, P., Gettner, S., and Bakker, J. P. (2001). The impact of sheep grazing on net nitrogen mineralization rate in two temperate salt marshes. Plant Biol. 3, 553–560. doi: 10.1055/s-2001-17730
Nolte, S., Esselink, P., Smit, C., and Bakker, J. P. (2014). Herbivore species and density affect vegetation-structure patchiness in salt marshes. Agric. Ecosyst. Environ. 185, 41–47. doi: 10.1016/j.agee.2013.12.010
Ober, E. S., and Sharp, R. E. (1996). A microsensor for direct measurement of O2 partial pressure within plant tissues. J. Exp. Bot. 47, 447–454. doi: 10.1093/jxb/47.3.447
Olff, H., Bakker, J. P., and Fresco, L. F. M. (1988). The effect of fluctuations in tidal inundation frequency on a salt-marsh vegetation. Vegetatio 78, 13–19. doi: 10.1007/BF00045634
Olff, H., De Leeuw, J., Bakker, J. P., Platerink, R. J., Van Wijnen, H. J., and De Munck, W. (1997). Vegetation succession and herbivory in a salt marsh: changes induced by sea level rise and silt deposition along an elevational gradient. J. Ecol. 85, 799–814. doi: 10.2307/2960603
Olff, H., and Ritchie, M. E. (1998). Effects of herbivores on grassland plant diversity. Trends Ecol. Evol. 13, 261–265. doi: 10.1016/S0169-5347(98)01364-0
Pedersen, O., Malik, A. I., and Colmer, T. D. (2010). Submergence tolerance in Hordeum marinum: dissolved CO2 determines underwater photosynthesis and growth. Funct. Plant Biol. 37, 524–531. doi: 10.1071/FP09298
Roozen, A. J. M., and Westhoff, V. (1985). A study on long-term salt-marsh succession using permanent plots. Vegetatio 61, 23–32. doi: 10.1007/BF00039807
Ryser, P., Gill, H. K., and Byrne, C. J. (2011). Constraints of root response to waterlogging in Alisma triviale. Plant Soil 343, 247–260. doi: 10.1007/s11104-011-0715-0
Schrama, M. J. J., Cordlandwehr, V., Visser, E. J. W., Elzenga, T. M., de Vries, Y., and Bakker, J. P. (2013a). Grassland cutting regimes affect soil properties, and consequently vegetation composition and belowground plant traits. Plant Soil 366, 401–413. doi: 10.1007/s11104-012-1435-9
Schrama, M. J. J., Heijning, P., Bakker, J. P., van Wijnen, H. J., Berg, M. P., and Olff, H. (2013b). Herbivore trampling as an alternative pathway for explaining differences in nitrogen mineralization in moist grasslands. Oecologia 172, 231–243. doi: 10.1007/s00442-012-2484-8
Srivastava, D. S., and Jefferies, R. L. (1996). A positive feedback: herbivory, plant growth, salinity, and the desertification of an Arctic salt-marsh. J. Ecol. 84, 31–42. doi: 10.2307/2261697
Striker, G. G., Insausti, P., Grimoldi, A. A., and Vega, A. S. (2007). Trade-off between root porosity and mechanical strength in species with different types of aerenchyma. Plant Cell Environ. 30, 580–589. doi: 10.1111/j.1365-3040.2007.01639.x
van Klink, R., Schrama, M., Nolte, S., Bakker, J. P., WallisDeVries, M. F., and Berg, M. P. (2015). Defoliation and soil compaction jointly drive large-herbivore grazing effects on plants and soil arthropods on clay soil. Ecosystems 18, 671–685. doi: 10.1007/s10021-015-9855-z
Veeneklaas, R., Bockelmann, A., Reusch, T., and Bakker, J. (2011). Effect of grazing and mowing on the clonal structure of Elytrigia atherica: a long-term study of abandoned and managed sites. Preslia 83, 455–470.
Veldhuis, M. P., Howison, R. A., Fokkema, R. W., Tielens, E., and Olff, H. (2014). A novel mechanism for grazing lawn formation: large herbivore-induced modification of the plant-soil water balance. J. Ecol. 102, 1506–1517. doi: 10.1111/1365-2745.12322
Visser, E. J. W., Colmer, T. D., Blom, C., and Voesenek, L. (2000). Changes in growth, porosity, and radial oxygen loss from adventitious roots of selected mono- and dicotyledonous wetland species with contrasting types of aerenchyma. Plant Cell Environ. 23, 1237–1245. doi: 10.1046/j.1365-3040.2000.00628.x
Wiengweera, A., Greenway, H., and Thomson, C. J. (1997). The use of agar nutrient solution to simulate lack of convection in waterlogged soils. Ann. Bot. 80, 115–123. doi: 10.1006/anbo.1996.0405
Yan, K., Shao, H. B., Shao, C. Y., Chen, P., Zhao, S. J., Brestic, M., et al. (2013). Physiological adaptive mechanisms of plants grown in saline soil and implications for sustainable saline agriculture in coastal zone. Acta Physiol. Plant. 35, 2867–2878. doi: 10.1007/s11738-013-1325-7
Keywords: aerenchyma, anoxia, salinity, salt marsh, stress gradients, trampling, vegetation patterns
Citation: Veldhuis ER, Schrama M, Staal M and Elzenga JTM (2019) Plant Stress-Tolerance Traits Predict Salt Marsh Vegetation Patterning. Front. Mar. Sci. 5:501. doi: 10.3389/fmars.2018.00501
Received: 08 July 2018; Accepted: 12 December 2018;
Published: 07 January 2019.
Edited by:
Naser A. Anjum, Aligarh Muslim University, IndiaReviewed by:
Conrad Sparks, Cape Peninsula University of Technology, South AfricaChristian Joshua Sanders, Southern Cross University, Australia
Copyright © 2019 Veldhuis, Schrama, Staal and Elzenga. This is an open-access article distributed under the terms of the Creative Commons Attribution License (CC BY). The use, distribution or reproduction in other forums is permitted, provided the original author(s) and the copyright owner(s) are credited and that the original publication in this journal is cited, in accordance with accepted academic practice. No use, distribution or reproduction is permitted which does not comply with these terms.
*Correspondence: Erik R. Veldhuis, ZS5yLnZlbGRodWlzQHJ1Zy5ubA==