 Angel Borja
 Joxe Mikel Garmendia
 Yolanda Sagarmínaga
- AZTI, Marine Research Division, Pasaia, Spain
Substantial progress has been made in assessing marine health in an integrative way. However, managers are still reluctant in undertaking such assessments, because: (i) lack of indicators; (ii) absence of targets; (iii) difficulty of aggregating indicators from different ecosystem components, habitats, and areas; (iv) absence of criteria on the number of indicators to be used; (v) discussion on the use of “one-out, all-out” (OOAO) principle in aggregating; and (vi) lack of traceability when integrating data. Our objective was, using open access databases with indicators across all the European seas with agreed targets, to demonstrate if the Nested Environmental status Assessment Tool (NEAT), can be used at the European scale, serving to managers and policy-makers as a tool to assess the environmental status under the Marine Strategy Framework Directive (MSFD). We have used MSFD Descriptor D3 (commercial fish) from 341 stocks, 119 species and two indicators from each of them (years 2013–2015); D5 (eutrophication) with 90th percentile of Chlorophyll-a (years 2009–2014); and D8 (contaminants), with Anthracene, Fluoranthene, Naphthalene, Cadmium, Nickel, and Lead as indicators (years 2009–2013). We have calculated the environmental status for each European subdivision, subregion, and regional sea, nested at different levels. The analyses include weighting and no-weighting by each assessment area; for ecosystem component (water column, phytoplankton, fish, crustaceans, and molluscs); descriptor (three), and habitat (pelagic, demersal/benthic), with the confidence value of the status. A sensitivity analysis was undertaken to determine a minimum number of indicators to include for a robust assessment. We demonstrated that using NEAT in assessing the status of large marine areas, by aggregating indicators, ecosystem components and descriptors, at different spatial scales, can remove at least four out of the six barriers that managers and policy-makers confront when undertaking such assessments. This can be done by using open-access databases and already established targets. Aggregating indicators of different origin is possible. Around 40 indicators seem to be enough to obtain robust assessments. It is better to integrate the assessment items using an ecosystem-based approach, rather than using the OOAO principle. Using NEAT, this approach supports identifying the problematic environmental issues needing management attention and measures.
Introduction
Due to increasing human activities and pressures in the oceans (Korpinen and Andersen, 2016; Lotze et al., 2018), some initiatives worldwide are intending to assess the status of marine waters in an integrative way, incorporating multiple metrics, indicators and ecosystem components (i.e., from bacteria to mammals), under the ecosystem approach (Inniss et al., 2016). In some cases, the assessments are based upon national, regional, or international legislation (Borja et al., 2008). However, nowadays, there are few methodologies able to assess the status of marine waters under an ecosystem approach (Borja et al., 2016). One of the difficulties when applying these integrative assessment methods is to find adequate indicators and targets (Gibson et al., 2000; Borja et al., 2012; Rossberg et al., 2017). In fact, there are different initiatives looking for essential biodiversity (Pereira et al., 2013) and ocean (Miloslavich et al., 2018) variables to be used as indicators in such kind of marine assessments worldwide.
To obtain these indicators or essential variables, global databases and acquisition methods, publicly available, are being used (Muller-Karger et al., 2018). Hence, the assessment methods which use these databases tend to be attractive for managers and policy makers, due to its ease of use [e.g., the Ocean Health Index (OHI), Halpern et al. (2012)]. However, some of these methods have been criticized because they are more an evaluation of the benefits to humans, provided by oceans, rather than assessing the actual health or environmental status (Duarte et al., 2018). Other methods, such as the Nested Environmental status Assessment Tool (NEAT, Borja et al., 2016), have initially been developed to assess the status under European legislation [i.e., the Marine Strategy Framework Directive (MSFD), (European Commission, 2008)]. In this case, managers usually complain because of the lack of suitable indicators able to be used at large scale (i.e., at regional seas scale, such as the Baltic, Atlantic, Mediterranean and Black Seas), and each Member State can use different indicators, despite the guidance provided by the European Commission (2017). Hence, hundreds of indicators have been listed to be used in the MSFD (Hummel et al., 2015; Teixeira et al., 2016), making any standardized use difficult. In addition, the different indicator aggregation methods, used at different spatial and temporal scales (Borja et al., 2014; Gan et al., 2017), can result in different assessment results, even differing status classes (Langhans et al., 2014; Probst and Lynam, 2016). These differences can difficult the use of these integrative assessment methods by managers and policy-makers, despite of some recent studies showing the usefulness of these methods in responding to human pressures, both spatially and temporally (Pavlidou et al., 2019).
Hence, although substantial progress has been made in the last few years in assessing marine health in an integrative way, at global scale (Borja et al., 2016; Inniss et al., 2016), managers are still reluctant in undertaking such assessments, for different reasons: (i) the supposed lack of indicators able to be used at large scale (Hummel et al., 2015; Teixeira et al., 2016), including its rigorous testing and validation (Moriarty et al., 2018); (ii) the absence of suitable reference conditions or targets for those indicators (Borja et al., 2012); (iii) the difficulty of aggregating indicators from different ecosystem components, habitats, areas, etc. (Borja et al., 2014; Langhans et al., 2014; Probst and Lynam, 2016); (iv) the absence of criteria on the number of indicators to be used for an adequate assessment; (v) the discussion of whether integration should be done using the principle “one-out, all-out” (OOAO) (Borja and Rodríguez, 2010), in which the worst status at any level (indicator, ecosystem component, assessment unit, etc.) determines the global status, or if the integration can be undertaken following other principles; and (vi) the lack of traceability of the problems coming from different human pressures, if data are integrated to obtain a single value.
Taking this into account, our objective is, using open access databases which include indicators across all the European regional seas with agreed targets, to demonstrate if an aggregation method, such as NEAT, can be used at the European scale, serving to managers and policy-makers as a tool to assess the environmental status under the MSFD. Hence, our primary aim is not to determine an actual environmental status for Europe or each of the regional seas, but contribute to remove the six barriers which we have identified, that managers and policy-makers see when being confronted with such an assessment task.
Methods
NEAT Description
NEAT (Borja et al., 2016) is a free software1, which has been applied in different geographical areas, inside and outside Europe (Uusitalo et al., 2016; Nemati et al., 2017; Pavlidou et al., 2019). Its principles are: (i) indicators, which constitute the basis of the assessment, and need a range of values and a target (i.e., the boundary between good status and non-good status); (ii) weighting and hierarchies: its central principle is a hierarchical, nested structure of Spatial Assessment Units (SAUs) and habitats, avoiding the dominance of certain indicators, habitats or SAUs by using a proper weighting procedure, which considers what information is available for different real spatial scales [see (Berg et al., 2017)]; (iii) aggregation: indicators and boundaries are normalized into a scale of 0–1, independently of their original scale, and aggregation is done across all indicators belonging to a SAU; (iv) the aggregation is visualized into a number (NEAT value) and a color, which corresponds to the status (i.e., high, good, moderate, poor, and bad). The NEAT value is obtained for the whole assessed area, but can be visualized at different spatial scales, for different ecosystem component (e.g., fish, water column, etc.), or habitats; and (v) each NEAT value is accompanied by its quantitative estimate of the confidence of the result (Berg et al., 2017).
Spatial Assessment Units Defined
SAUs are needed to determine the environmental status in the four regional seas: Baltic Sea, North East Atlantic Ocean, Mediterranean Sea and Black Sea. Some of them have been subdivided into subregions and subdivisions, resulting in 19 different SAUs: Baltic Sea (1), Black Sea (2), Balearic Sea (3), Lions Gulf (4), Sardinia (5), Adriatic Sea (6), Ionian Sea and Central Mediterranean (7), Aegean Sea (8), Cyprus (9), Greater North Sea (10), Celtic Seas & Rockall (11), Bay of Biscay and Iberian coast (12), Macaronesia (except Azores) (13), Azores (14), Faroes (15), Barents Sea (16), Greenland Sea (17), Iceland Sea (18), and Norwegian Sea (19) (Figure 1). The SAUs were primarily defined taking into account the regions, subregions and subdivisions delineated in the MSFD (Jensen et al., 2017). However, as some parts in the Northern Atlantic, the Arctic, the Mediterranean and Black seas, are not included in the MSFD, these were complemented with the Food and Agriculture Organization (FAO) fishing areas2.
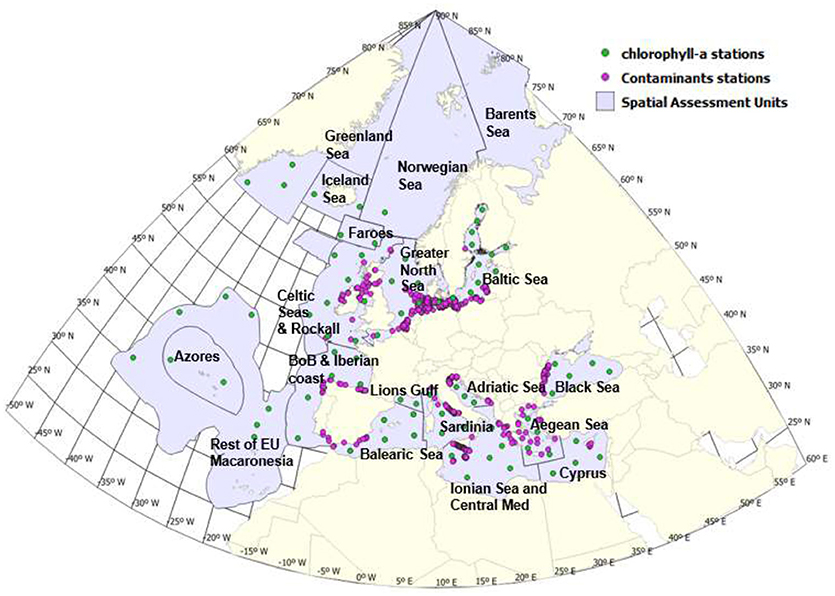
Figure 1. Map of the European seas, showing the Spatial Assessment Units (SAUs) defined in this study, at different levels (subunits, subregions, regional seas). The sampling stations for contaminants (pink points) and chlorophyll a (green points) are shown. BoB, Bay of Biscay; EU, European Union.
Indicators Selected, Reference Conditions, and Thresholds
From the many indicators proposed for the MSFD (Teixeira et al., 2016), only few are available at large scale and open access to undertake an exercise such as this proposed here, to demonstrate the possibility of using NEAT at European scale within the MSFD. This directive is structured into 11 qualitative Descriptors (D) (European Commission, 2008), which includes biodiversity (D1), alien species (D2), commercial fish (D3), food-webs (D4), eutrophication (D5), seafloor integrity (D6), hydrography (D7), contaminants in waters and sediments (D8), contaminants in seafood (D9), noise (D10) and litter (D11).
For commercially exploited fish and shellfish (D3), some of the indicators used to determine the environmental status are fish mortality and spawning stock biomass (European Commission, 2017). The most recent data (years 2013–2015) on 397 European stocks are available in Froese et al. (2018), for each of the regional seas, subregional seas and subdivisions. From these fishing pressure (F/Fmsy; F, fishing pressure; msy, maximum sustainable yield) and stock biomass (B/Bmsy; B, stock biomass) data of 341 stocks, corresponding to 119 species, have been considered in our investigation (obtained from the Supplementary Material in (Froese et al., 2018), and corresponding to FAO fishing areas). The reduction in the initial number of stocks was because: (i) some stocks with data from 2 years were averaged, and (ii) Celtic Seas and Rockall stocks were merged, since they appear in the MSFD as a single sub-region. For each fish stock, and the two associated indicators for each species (this means 238 indicators), mean and standard error values were calculated for each SAU (see Figure 1 for SAUs), using the above time period.
For eutrophication (D5), one of the indicators used across all Member States (e.g., within the Water Framework Directive), is 90th percentile of chlorophyll a, calculated using a period of 5 years (European Commission, 2018). In order to calculate such indicator, we used a web tool3 to extract chlorophyll-a data from 87 different locations distributed through the different subregions and subdivisions considered (Figure 1). These chlorophyll-a data are extracted from different Copernicus marine products depending on the regional sea considered (Table 1). In the case of Barents Sea, the web tool does not provide data for calculation, and in the Norwegian Sea only for the southern part. Then, the 90th percentile of chlorophyll a was calculated, using the period between 2009 and 2014, for each location. Finally, the mean and standard error values of the 90th percentile of chlorophyll-a were calculated for each SAU.
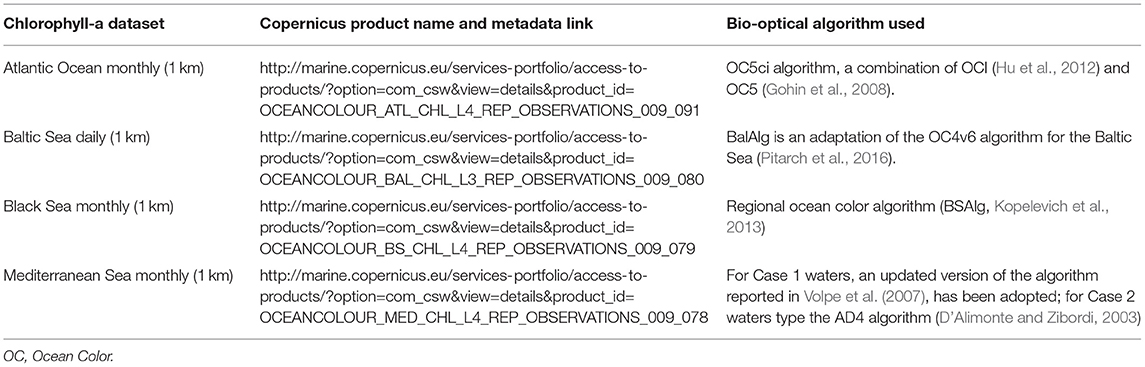
Table 1. Copernicus marine products from which satellite chlorophyll-a data were extracted.
Member States are required to report on contaminants (D8) in coastal and territorial waters (Reker et al., 2015). These data are included in the databases of the European Environment Agency (EEA), on the status and quality of Europe's transitional, coastal and marine waters4. This dataset contains data on many hazardous substances in seawater, and we have selected for the analysis Anthracene, Fluoranthene, Naphthalene, Cadmium, Nickel, and Lead, since they were the only present in the datasets of all Member States. We have used data from the coastal waters (<1 nautical mile—nm), territorial waters (1–12 nm) and offshore (>12 nm), when they were available. A total of 2,841 stations were selected: 231 from Baltic Sea, 62 from Black Sea, 406 from Mediterranean Sea and 2,142 from North East Atlantic Ocean, for years between 2009 and 2013 (Figure 1). Again, mean and standard error values were calculated using the stations and years within each SAU, for each of the six indicators.
The raw data used in the NEAT calculations, for the three descriptors, can be consulted in the Table S1.
To assess the status, all of these indicators need to set reference conditions (i.e., values for the best and the worst environmental status), targets (boundary between good and non-good status), and thresholds for the remainder quality classes (Borja et al., 2012). The origin of data and those values can be consulted in Table 2. Hence, reference conditions and class boundaries for D3 (Commercially exploited fish and shellfish) were obtained from Froese et al. (2018). In the case of D5 (Eutrophication), the boundaries for Chlorophyll a were obtained from the intercalibration exercise undertaken for the Water Framework Directive and published in European Commission (2018). These boundaries depend on the types within the regional and subregional seas. In the Baltic Sea, with several types and countries, we calculated a mean value for the boundaries between good/moderate and good/high (Table 2), since the chlorophyll values used in the calculation are for the whole regional sea. In the North East Atlantic Ocean, with many types and boundaries calculated for very coastal areas, we have used the lowest available boundaries, which correspond to Sweden (Table 2). This can be considered a precautionary principle, since the data used in the calculations are in open ocean and are expected to be much lower than in coastal areas. For the Mediterranean and Black Seas we used the boundaries set for each subregional sea or subdivision (Table 2). NEAT calculates by interpolation the remainder boundaries, between Good/Moderate and the worst value (Berg et al., 2017). Finally, for contaminants (D8), we used the environmental quality standards proposed by the European Commission (2013) (Table 2). In this case, as the worst values are high, to avoid an automatic linear interpolation between the target value (Good/Moderate) and the worst value, we decided to include boundaries of Moderate/Poor and Poor/Bad as three times the target value in the first case and nine times in the second.
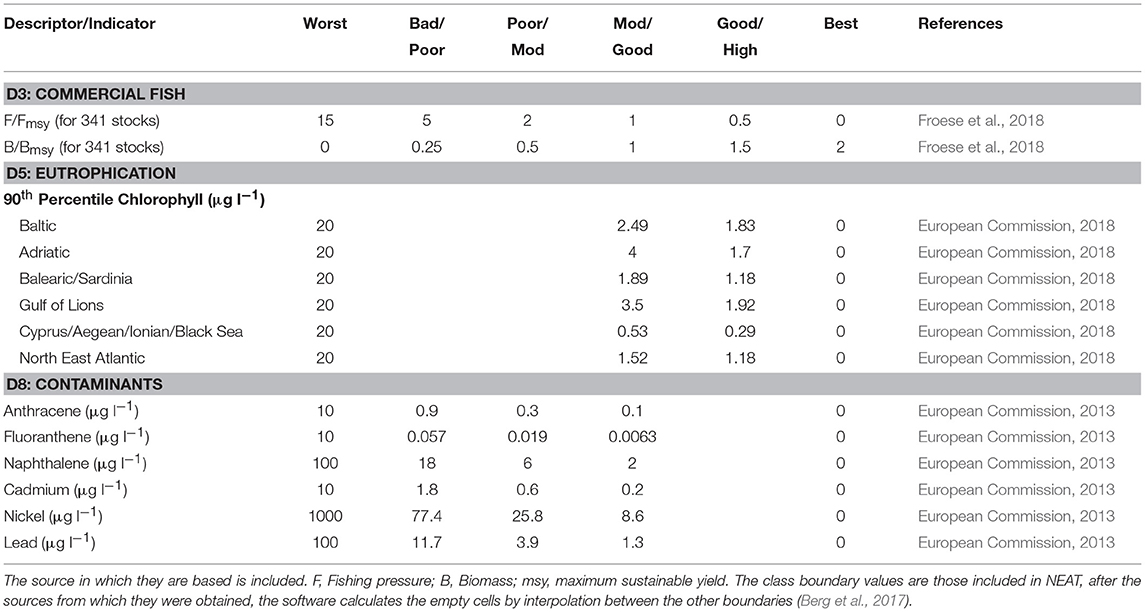
Table 2. Descriptors and indicators used in the analysis, including the range of values and the boundaries or thresholds.
Analysis of Data
NEAT has been calculated for each subunit, subregion, regional seas and the whole Europe, both weighting, by the surface area of each of them, and non-weighting, giving the same weight to each of them irrespective of their area. Also, we have calculated the NEAT value for each ecosystem component studied (water column, phytoplankton, fish, crustaceans, and molluscs), each descriptor (D3, D5, and D8), as well as each habitat (pelagic, demersal/benthic). In all cases, the confidence of the NEAT result has been calculated by 1,000 Monte-Carlo iterations, using the indicator value along with its associated standard error to calculate multiple times the assessment (Berg et al., 2017). The error then propagates through the assessment scheme and leads to different NEAT values, expressed as the percentage of values falling into the five quality classes and showing the probability that the environmental status corresponds to that obtained (Berg et al., 2017).
In addition, we have determined the environmental status using the OOAO principle at different levels: (i) the worst of the values of all indicators; (ii) the worst of the five ecosystem components abovementioned; and (iii) the worst of the three descriptors studied, at the subunits or subregion level and then integrating the worst of them at regional and European levels. Then, we have compared these results with the environmental status obtained using NEAT, calculated weighting and non-weighting by SAU.
Finally, we have investigated the sensitivity of the aggregation, by undertaking a one-way sensitivity analysis in NEAT, varying only one indicator in the model at a time, examining the impact of that change on the quality status result (Nemati et al., 2018). After running an assessment, the NEAT software contains a functionality allowing to undertake the sensitivity analysis automatically. The assessment was run with all indicators. We used randomly selected indicators, using 1,000 Monte Carlo iterations each time an indicator is removed. The analysis continued until there was only one indicator left in the assessment (Berg et al., 2017). This allows to identify when an assessment changes from the initial status set to a different one, or the system becomes unstable with different status, and the number of indicators needed to have a robust assessment.
Results
In the Supplementary Material, several tables present all the analyses undertaken, showing the data as exported from NEAT: Table S2, includes results of ecosystem components by weighting for SAU area; Table S3, the same but for habitat; Table S4, ecosystem components without weighting; and Table S5, the same by habitat. The remainder tables have results weighted by area, referring to each of the MSFD descriptors analyzed: Table S6, shows descriptor 3, of commercial fish; Table S7, the same, but for habitat; Table S8, descriptor 5, of eutrophication; Table S9, descriptor 8, of contaminants in seawater; and Table S10, the sensitivity analysis results.
Tables S2–S9 have been summarized in Table S11. Descriptor 3 (commercial fish) shows the worst status, with all SAUs in poor or moderate status, excepting the Barents Sea, which is in good status. When looking at each of the ecosystem components of this descriptor, crustaceans are the most affected (12 out of the 18 SAUs are in poor or bad status, mainly due to the observed values for B/Bmsy indicator of Nephrops norvegicus, Palinurus elephas, Homarus gammarus, Parapeneaus longirostris, Aristeomorpha foliacea, and Pandalus borealis stocks, and for F/Fmsy indicator of N. norvegicus and Penaeus kerathurus stocks) (Table S1), followed by molluscs and fish (in this case, the only two seas in good status are no MSFD locations: Barents and Iceland Seas) (Table S11). In the case of fish, the worst observed values for B/Bmsy indicator were registered in Ionian Sea, in Aegean Sea and in Sardinia (stocks of Epinephelus marginatus, Solea solea, Scomber scombrus, Dicentrarchus labrax, Atherina boyeri, Mullus barbatus, Dentex dentex, and Belone belone) and for F/Fmsy indicator in North East Atlantic and in Black Sea (stocks of Raja clavata, Trachurus mediterraneus and Scophthalmus maximus) (Table S1). In the case of molluscs, the worst observed values for B/Bmsy indicator were registered in Sardinia, in Adriatic Sea and in Cyprus (stocks of Chamelea gallina, Pecten jacobeus, Loligo vulgaris, and Sepia officinalis) (Table S1).
Regarding Descriptor 5 (Eutrophication, based on Chlorophyll a, as a proxy of phytoplankton), most SAUs are in good or high status, excepting Black and Baltic Seas, classified as moderate status (Table S11).
In the case of contaminants (Descriptor 8), most SAUs are in good or high status, except the coastal areas (<1 nm) of Balearic Sea and Black Sea, which are in moderate status. In Balearic Sea there are some high concentrations of cadmium and lead, whilst in the Black Sea, in addition to these two metals, there are also high concentrations of anthracene and fluoranthene. When there are data close to the coast (<1 nm), territorial (1–12 nm), and offshore (>12 nm), the quality increases with the distance to the coast, showing higher NEAT values in the open sea than in the coast (Table S11). The exception is the Baltic Sea, in which the lowest NEAT values were found in intermediate and offshore areas (due to the high concentrations of cadmium and lead) (Table S11).
When undertaking the calculations by habitat, instead of by ecosystem components, it can be seen (Table S11) that demersal/benthic habitats are in much worst status (25 out of 26 SAUs are in poor or moderate status) than pelagic habitats (14 out of 50 SAUs are in moderate status, being the remainder in good or high status). This is mainly due to the demersal and benthic species in D3, which have worst status than pelagic ones.
When comparing the integrated NEAT values, weighting or not by the SAU area, it can be seen (Table S11) that weighting generally seems to lead to lower NEAT values in our dataset, with 18 out of the 50 SAUs in moderate status, with only 11 out of 50 when no weight was applied.
Some of these results have been represented in Figure 2 and detailed in Table 3 for the whole Europe, each regional sea and some subregions and subdivisions. For the indicators and descriptors selected, the whole Europe has a moderate status (NEAT value: 0.586), when weighting by SAU area, being in good status (NEAT value: 0.612) when no weighting is applied. The confidence in the result is 99.9 and 100%, respectively. Regarding regional seas, the Baltic, Mediterranean and Black Seas are also in moderate status (confidence values ranging between 99.3 and 100%), whilst the Atlantic Ocean is in good status (confidence 85.1%), when weighting (Table 3). When no weight is applied, the status of all regional seas but Black Sea is good (confidence 100%). In the Atlantic Ocean, the subregions not included in the MSFD show lower NEAT values than those within the MSFD, but in both cases the status is good when weighting (confidence 100 and 68.4%, respectively), decreasing to moderate in no-MSFD areas when no weighting is applied (confidence 80.6%). This is a good example of the influence of weighting in the result, when using NEAT: 3 out of the 5 SAUs (Faroes, Greenland and Iceland Sea) within the no-MSFD seas are in moderate status, but they have the smallest surfaces, representing only 31% of the total surface of no-MSFD seas (Table 3). Hence, when weighting, these SAUs do not “compensate” the 69% of the area (Barents and Norwegian Seas) in good status, and the no-MSFD sea results in a good global status. However, when no weighting is applied (the SAU weight is 0.017 for each no-MSFD SAU), the mean value of NEAT from those three SAUs in moderate status and those in good status, results in a moderate status.
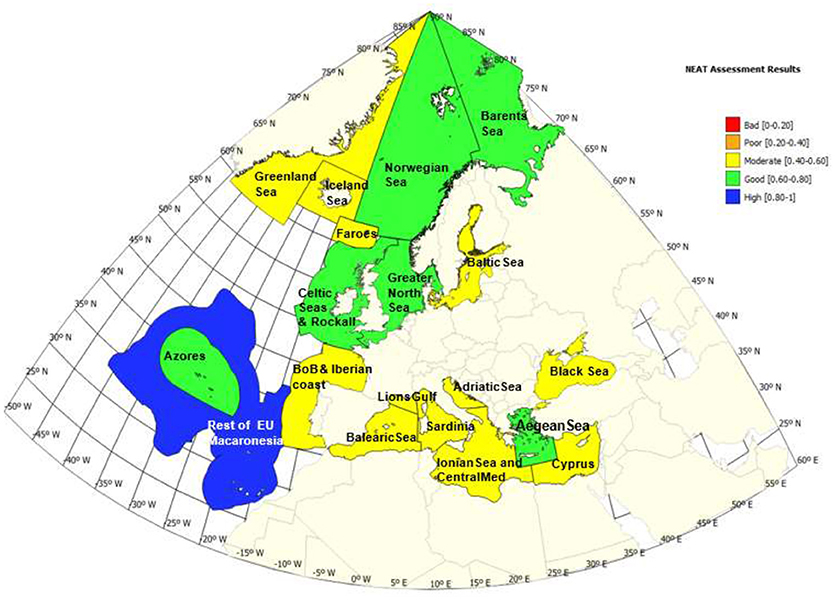
Figure 2. Environmental status, for the European subregional seas, based on NEAT assessment. BoB, Bay of Biscay; EU, European Union.
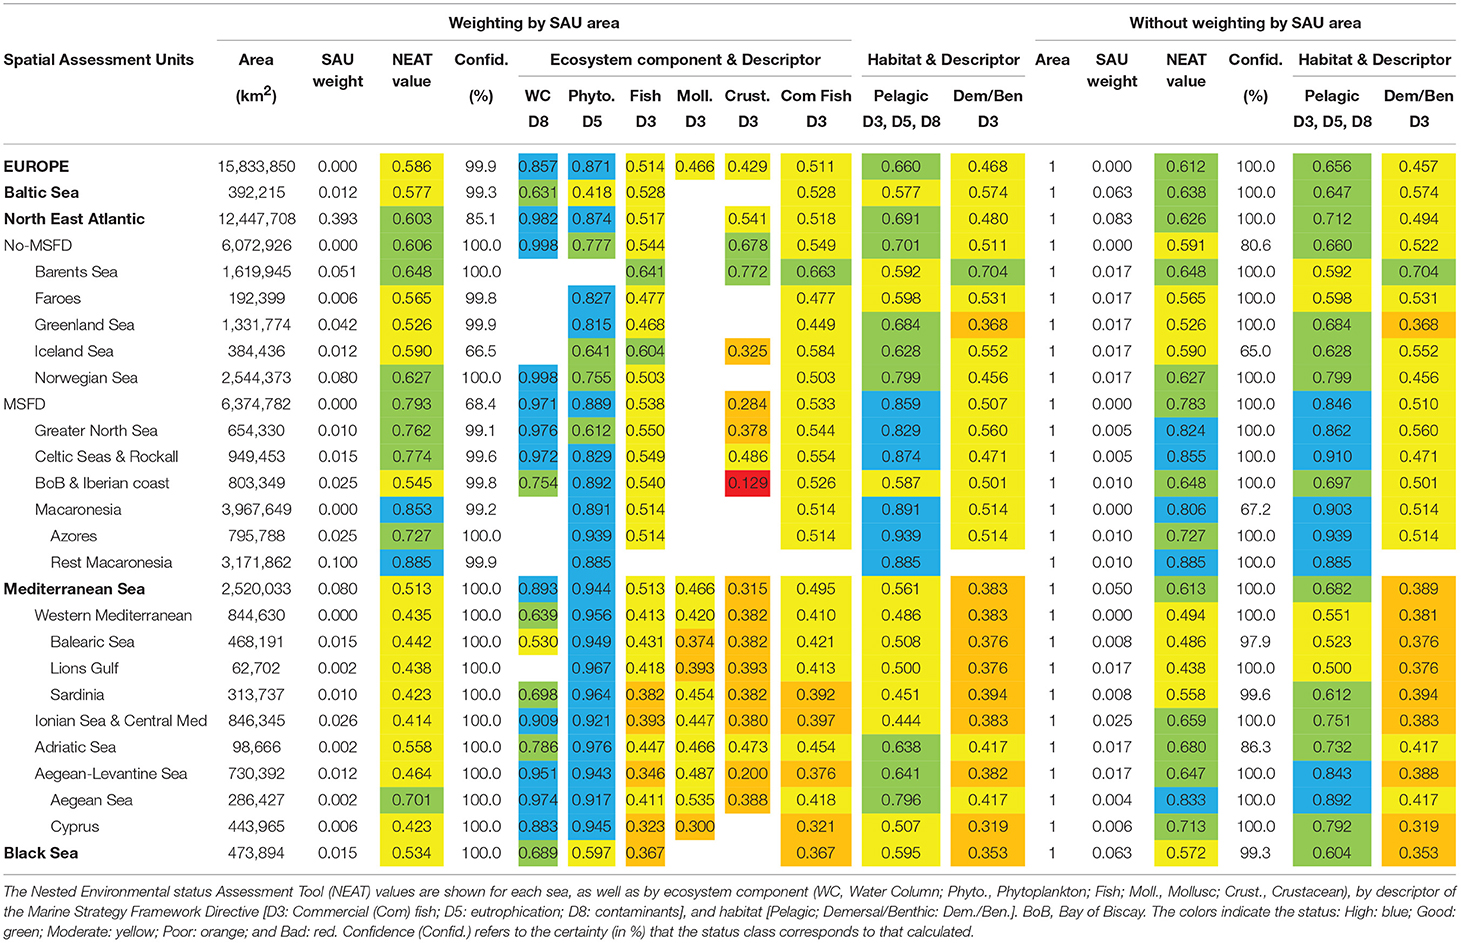
Table 3. Summary of the assessment values, for the whole Europe, for the four regional seas (in bold), for the subregional seas (centered), and several subunits (aligned to the right), weighting by Spatial Assessment Unit (SAU) area and non-weighting.
Within the MSFD Atlantic Ocean subregions, only the Bay of Biscay and Iberian coast is in moderate status, the remaining subregions being in good or high status (Table 3). In the Mediterranean Sea, when weighting, all subregions and subdivisions are in moderate status, except the Aegean Sea, which is in good status (all of them with 100% of confidence). If no weighting is applied, the Western Mediterranean remains in moderate status, but the other subregions are in good or high status, resulting in a good status for the whole Mediterranean Sea (Table 3).
At the global European level, the moderate classification comes mainly from Descriptor 3, with the three ecosystem components fished (crustaceans, molluscs and fishes) in the same status, whilst Descriptors 5 and 8 are in high status (Table 3). This low quality is reflected also in the habitats at the whole European level, since demersal/benthic habitats (in moderate status), most affected by fishing, are in worse status than the pelagic habitats (in good status). When looking at the regional seas level, the pattern is similar in the Atlantic Ocean and the Mediterranean (D3 in moderate status, D5 and D8 in high status), whilst in the Baltic and Black Seas Descriptor 5 (Eutrophication) is in moderate status and Descriptor 8 (Contaminants) is in good status, with D3 (Fishing) in moderate and poor status, respectively, showing a more degraded situation (Table 3). In addition, the demersal and pelagic habitats of the Mediterranean and Black Seas are in poor status, indicating more pressures in them than in the remaining regional seas.
When comparing the results obtained using NEAT (no-weighting and weighting) with the “One-out, all-out” principle (OOAO principle) at the level of descriptors, ecosystem components and indicators, a clear pattern is observed, with a gradient of improvement from the more conservative method (OOAO at the level of indicators) to NEAT method without weighting by area (Table 4). Hence, when more indicators are included in the OOAO approach, most of the subunits and subregions, as well as all regional seas and the whole Europe, the assessment shows bad status. The only exceptions are those areas in which either fish stock data or contaminants do not exist (e.g., rest of Macaronesia) or with little number of fish indicators (e.g., Norwegian Sea) (Table 4). When applying the OOAO at the level of the five ecosystem components, still the whole Europe is in bad status, as well as the Atlantic, but the Mediterranean and Black Seas are in poor status and the Baltic Sea in moderate status (Table 4). Again, those subunits and subregions with less components have higher possibilities of showing better status. Applying the OOAO at the three descriptors used here, the status is the same in the Baltic, the Mediterranean and the Black Seas, but there is an improvement in the Atlantic and the whole Europe (Table 4). Using NEAT, the status is moderate in most of the cases when weighting by the surface area, and good if no-weighting is applied (Table 4).
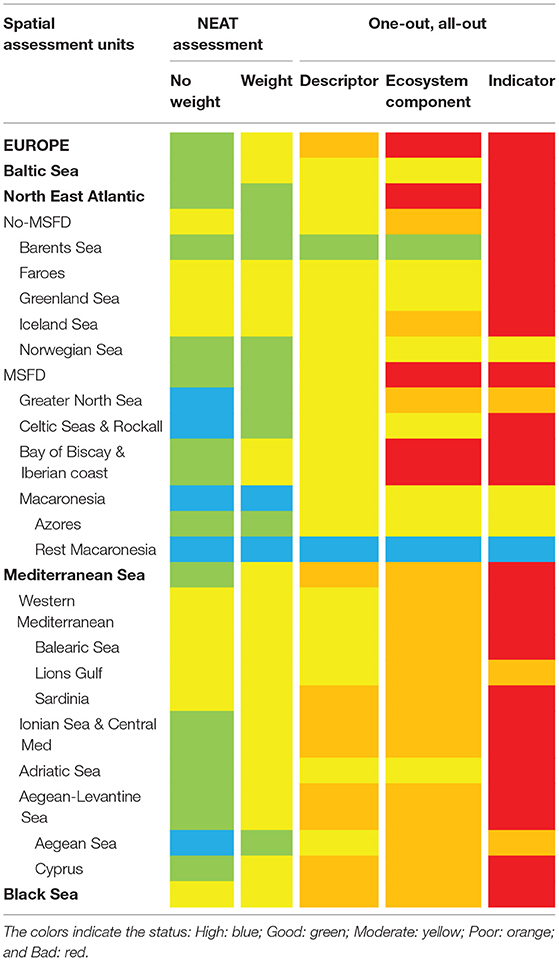
Table 4. Summary of the environmental status, for the whole Europe, for the four regional seas (in bold), for the subregional seas (centered), and several subunits (aligned to the right), assessed following different methods: (i) NEAT calculated weighting and non-weighting by Spatial Assessment Unit (SAU); and (ii) using the “One-out, all-out” principle at different levels: the worst of the values of the three descriptors, the worst of the ecosystem components and the worst of the indicators studied, at the subunits or subregion level and then integrating the worst of them at regional and European levels.
Regarding the sensitivity analysis, the raw results can be consulted in Table S10. Using many indicators, the status as shown in Table 3 is maintained during the process of removing indicators randomly, until the result becomes unstable (i.e., permanent change in the status, changes to different statuses when removing additional indicators). Hence, from the 24 subunits, subregions and regional seas studied: (i) four (Black Sea, Mediterranean Sea, Adriatic Sea, and Barents Sea) needed at least 10–15 indicators of the initial bulk of indicators to achieve the same final environmental status obtained when using all of them; (ii) four (North East Atlantic Ocean, Macaronesia, Aegean Sea and Cyprus) needed between 65 and 235 indicators; and (iii) the remainder sixteen needed between 20 and 40 indicators (Table 5).
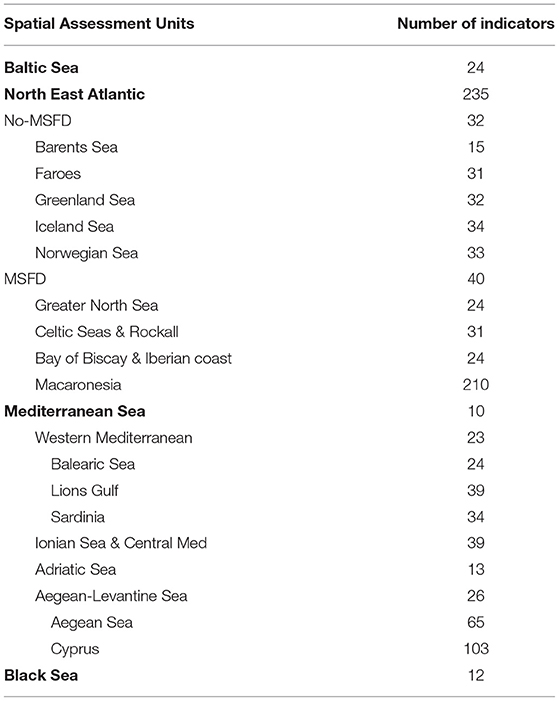
Table 5. Sensitivity analysis of the NEAT assessment, showing the minimum number of indicators needed to achieve the same final assessment when using all the indicators, for each subunit (aligned to the right), subregion (centered), and regional sea (aligned to the left, in bold).
Discussion
Despite the substantial progress made in assessing marine health in an integrative way (Borja et al., 2016; Inniss et al., 2016), we have identified at least six barriers that managers and policy-makers confront when undertaking such assessments. In the discussion below, we show how these barriers can be removed, after the results obtained in our analyses.
Lack of Tested and Validated Indicators
There is a contradiction in the fact that whilst managers claim there is a lack of suitable indicators to assess the environmental status of marine systems, to apply the criteria from the European Commission (2017), we have plenty of indicators available to be used (HELCOM, 2010; Pereira et al., 2013; UNEP, 2014; Hummel et al., 2015; Teixeira et al., 2016; Miloslavich et al., 2018). However, it is true that in some cases there is a lack of rigorous testing and validation (Moriarty et al., 2018), which have been mitigated in recent times in Europe with the intercalibration of some of them within the WFD (European Commission, 2018). At the same time, there are plenty of indicators (e.g., contaminants, those related with fish stocks management) for which a long history of application and development allows us to use them with more confidence (Froese et al., 2018). However, it is true that still suitable indicators are needed for descriptors such as D1 (biodiversity) and D4 (food-webs) (Rombouts et al., 2013; Azzellino et al., 2014), despite the efforts done to integrate them in NEAT (Haraldsson et al., 2017).
In this research we have used well-known indicators, available in different open access sources, which can be increased relatively easy, e.g., we have used only contaminants in waters, but contaminants in sediments and biota also exist in European databases5. Also, information from other MSFD descriptors could be available in coming months, such as litter, biodiversity (from Habitats Directive and MSFD reporting), nutrients from WFD reporting, etc., in databases such EMODNET6. This would allow to select a number of new indicators, corresponding to several MSFD descriptors, common across different Member States. For the moment, with the indicators used in our research, we have demonstrated that it is possible to use current open access datasets to assess the environmental status of European marine waters in an integrative way. These databases can be completed in coming months with new indicators suitable for MSFD assessment.
Absence of Suitable Reference Conditions and Targets
There are some discussions at European level on the need to use reference conditions and targets or not, when assessing the environmental status in the context of the MSFD; however, Borja et al. (2012) highlighted the importance of having such values when a quantitative assessment is going to be undertaken. In absence of suitable reference conditions (best and worst values, as defined in NEAT) and, at least, target, or thresholds values, i.e., the boundary between good and not good status, it is not possible to undertake quantitative environmental assessments (in fact, some so-called global integrated marine assessments, have a clear lack of targets and they are more a qualitative description of the actual marine environmental situation ( Reker et al., 2015; Inniss et al., 2016), rather than an assessment of the status. Setting these target values is crucial, since the failure to achieve a good status will require some management measures to improve the situation and achieve the required good status (Elliott et al., 2017).
Although most of the hundreds of available indicators have not targets and reference conditions (Teixeira et al., 2016), for some of them targets have been set, after intercalibration at European level (Birk et al., 2012; European Commission, 2018). In other cases, methodologies to set quantitative targets have been proposed and they are available to be used immediately (Rossberg et al., 2017). Hence, to undertake global and regional environmental status assessments, we have already at least eight options to set targets, which we have summarized below (in decreasing order of preference, slightly modified from Borja et al., 2012).
(i) Using binding legal targets/thresholds. For contaminants, there are European and national legislation were these targets are set, and we have used them here; e.g., for contaminants in seawater and in biota, those within the European Commission (2013); for contaminants in sediments, those derived by Italian Government (Sediment Quality Guidelines, Decreto 56/2009); for contaminants in seafood, those derived by Commission Regulation No 1881/2006 (Maximum levels for fish and mollusc); and for biological elements, such as phytoplankton, macroalgae, macroinvertebrates or fish, those intercalibrated within the WFD (European Commission, 2018). This is the option used here for D5 and D8.
(ii) Using agreed boundaries, accepted by the scientific community or managers, e.g., for different fish and shellfish stocks there are targets proposed by the International Council for the Exploration of the Sea (ICES; Froese et al., 2018), which is the option used here for D3; also there are boundaries for different eutrophication status (eutrophic, mesotrophic, oligotrophic), which can be used in other descriptors and indicators (Ferreira et al., 2011).
(iii) Using information from pristine areas, which can be considered as reference, although this is difficult to find in areas subjected to high human pressures, such as Europe. This method is considered the most adequate by some environmental agencies, after those legally binding (Gibson et al., 2000).
(iv) Using information from gradients of pressure, which can be used to set the targets.
(v) Using targets from existing literature, for indicators used in similar habitats, e.g., Sediment Quality Guidelines at regional level (Bakke et al., 2010; Menchaca et al., 2012, 2014).
(vi) Model a target, such the proposal in Rossberg et al. (2017), although there are numerous issues in developing and applying such models (see a discussion on the topic in Borja et al., 2012).
(vii) Using information from the past (e.g., before any human pressure), although under the current global change this could be very problematic, due to shifting baselines which can prevent their use (Elliott et al., 2015).
(viii) The last option could be the use of expert judgment, achieving a consensus in a target value, if possible, working together with managers and stakeholders. We have used this option here for D8, to set boundaries of Moderate/Poor and Poor/Bad status, since in NEAT it is important to avoid large ranges between those classes, since this can tend to classify the SAUs in moderate status. This option is ranked much better by some authors (Borja et al., 2012). However, managers are afraid that those targets could be not politically expedient and even legally permissible (sensu Elliott, 2013).
With the current scientific knowledge in Europe we consider that it could be feasible setting targets, using any of these methods, for the indicators to be used in the MSFD assessment. In the meantime, we have demonstrated that with the current targets [options “(i)” and “(ii)”], it is possible to assess the status for several MSFD descriptors.
Difficulty of Aggregating Indicators From Different Sources
The difficulty of aggregating indicators coming from different monitoring networks, covering different spatial and temporal frameworks, and including different ecosystem components (biotic and abiotic) as well as different habitats, has been largely debated (Borja et al., 2014; Langhans et al., 2014; Link and Browman, 2014; Probst and Lynam, 2016; Gan et al., 2017). Although here we have used same temporal frameworks for the descriptors in the assessment, recently Pavlidou et al. (2019), explored the use of NEAT in different time periods, demonstrating its applicability and the response to changes in human pressures. Despite the reluctancy of managers to aggregate information coming from different sources, it is more and more accepted that any ecosystem-based approach to marine management requires a certain aggregation of indicators (Levin et al., 2009; Tett et al., 2013).
It has been demonstrated that, depending on the aggregation method, the results can be totally different (Langhans et al., 2014; Probst and Lynam, 2016), as we have seen in our research (Table 4). However, the aggregation/integration requires a flexible and adaptive approach (Dickey-Collas, 2014), since each case and study area could require different approaches, depending on different factors, such as the differences in the number of indicators, the coverage of them, both spatial and temporal, etc. In addition, the decision of weighting or not spatially should be discussed at regional seas level. In this way, NEAT has demonstrated such flexibility and the possibility to customize the assessment (Berg et al., 2017), not only in our study, but also as shown in previous applications (Uusitalo et al., 2016; Nemati et al., 2017; Pavlidou et al., 2019). These demonstrations can be useful for managers, when undertaking global assessments.
Criteria on the Number of Indicators to Be Used
Little work has been undertaken in setting the minimum number of indicators to be used when assessing the environmental status of a regional sea or at European scale. When the scale is very small very few indicators can be enough to assess the status, with the same accuracy as using many different, as demonstrated by Nemati et al. (2018) using NEAT. However, at large scale in most cases a number of indicators between 20 and 40 could be enough in NEAT, as shown in Uusitalo et al. (2016). Of course, this will depend on the surveys dedicated to obtain values to calculate those indicators, which would be time consuming and costly, probably with insufficient spatial-temporal coverage (Baudrier et al., 2018). Currently each Member State designs their own surveys and decided on the indicators to be used, although some of them are suggested across all countries as a sort of primary or common indicators (European Commission, 2017), which can make the MSFD assessment more or less comparable across regional seas and countries. In our investigation, 16 out of the 24 SAUs studied needed between 20 and 40 indicators to achieve the final environmental status, with few needing less or more than that amount, with results similar to those obtained by Uusitalo et al. (2016). This probably means that, in most cases, using 40 indicators could be robust enough to assess the environmental status at regional and subregional scales. This is on line with the current recommendation of the European Commission (2017), which includes 27 primary criteria (assimilable to indicators) and 15 secondary criteria when assessing the MSFD status. While primary criteria should be used to ensure consistency across the European Union, flexibility is granted regarding secondary criteria, which is decided by Member States when to use them to complement a primary criterion (European Commission, 2017).
The OOAO Principle
The use of the OOAO principle has been repeatedly criticized (Moss et al., 2003; Moss, 2008; Caroni et al., 2013; Langhans et al., 2014), because it tends to downgrade the quality assessed locations unjustifiably, depending on the number of indicators included in the assessment, as demonstrated in our study and elsewhere (Borja and Rodríguez, 2010). Although this principle is consistent with the precautionary principle, at the same time, tends to inflate Type I errors (concluding that the assessed area is below good status, even if the real status is good). In fact, it has been demonstrated that integrative assessments show better the improvement of estuarine and coastal areas after taking management measures, whilst using the OOAO there is no trend in the improvement because of the probabilities of having individual indicators below the good status (Borja and Rodríguez, 2010). This means that there is a risk of implementing additional management measures to revert the situation where they are not strictly needed (Borja and Rodríguez, 2010). Hence, the OOAO principle increases the likelihood of scoring a lower status class by sheer randomness, whereas the risk of misclassifying to a higher status (than the actual status) becomes less likely (Hering et al., 2010). In our study we have seen that, increasing the number of indicators, ecosystem components or descriptors, the possibility of downgrading the quality status in the assessment increases exponentially. However, this is not a real situation (are the whole European regional seas in bad status, without nuances?), and using NEAT weighting by the surface area of the subunit, subregion or regional sea allows to identify different status in different regional seas. Although most of them need still management measures to achieve good environmental status, those measures can be driven more adequately than looking at OOAO assessment.
Lack of Traceability When Integrating
This barrier links directly with the previous one, since the management measures to be developed need an identification of the problems to be addressed, causing the impairment of the system. Recently, it has been demonstrated that the use of NEAT, spatially and temporally, allows linking the assessment with the human pressures and the measures taken to revert a degraded situation (Pavlidou et al., 2019). Our study shows that the ecosystem components, descriptors or habitats, affected at each SAU level, can easily be tracked in the tables with NEAT results, to determine which of them is causing an impairment in the environmental status. Thus, it is readily possible to identify specific needs for management measures leading to achieve the good environmental status. When necessary, it is possible even going to each individual indicator, just in case a management measure should be taken at that level. This is especially important in the case of specific fish stocks, which are in less than good status in a SAU or regional sea, as can be seen in our results but also in Froese et al. (2018), in which many stocks are in bad or poor status.
Conclusions
We have demonstrated that using NEAT in assessing the environmental status of large marine areas, under the ecosystem-based approach, by aggregating indicators, ecosystem components and descriptors, at different spatial scales, can contribute to remove at least four out of the six barriers that managers and policy-makers confront when undertaking such assessments, since: (i) we have already indicators, from open-access databases, which are ready to use, although more effort is needed in some descriptors; (ii) we have already suitable reference conditions and targets, for them (and tools to develop them if they are still not available), but agreed targets across regional seas are still needed; (iii) we can aggregate indicators, even if they are of very different origin (biotic and abiotic); (iv) different results show that the use of around 40 indicators could be enough to obtain robust assessments; (v) it is better to integrate under the ecosystem-based approach, rather than using the OOAO principle, which mask the actual status; and (vi) using NEAT, managers can track where are the problems needing management measures.
Data Availability Statement
All raw data and results are available in the Supplementary Material.
Author Contributions
AB developed the idea of the study. YS obtained and calculated data related to Chlorophyll a. JG, AU, and AB obtained and calculated data related to commercial fish. IM obtained and calculated data related to contaminants. All authors defined the SAUs and included data from indicators in NEAT. AB wrote the first draft of the article and all authors contributed equally to the interpretation of the results and in writing the final manuscript.
Funding
This study has been partially funded by a convention between AZTI and the Basque Water Agency (URA) and the project MEDCIS: Support Mediterranean MSs toward Coherent and Coordinated Implementation of the second phase of the MSFD, funded by the European Commission, DG Environment, Grant agreement 11.0661/2016/748067/SUB/ENV.C2.
Conflict of Interest Statement
The authors declare that the research was conducted in the absence of any commercial or financial relationships that could be construed as a potential conflict of interest.
The reviewer TB declared a past co-authorship with one of the authors AB, to the handling editor.
Acknowledgments
We thank the comments from three reviewers, which have contributed to improve the first version of the manuscript. This is contribution number 898 from AZTI (Marine Research Division).
Supplementary Material
The Supplementary Material for this article can be found online at: https://www.frontiersin.org/articles/10.3389/fmars.2019.00019/full#supplementary-material
Footnotes
1. ^Available online at: http://www.devotes-project.eu/neat
2. ^FAO Major Fishing Areas. CWP Data Collection. In: FAO Fisheries and Aquaculture Department. Rome. Updated 1 October 2004: http://www.fao.org/fishery/area/search/en
3. ^Available at: http://chlo4msfd.azti.es/CHLO4MSFD_V1.0/
4. ^Available at: https://www.eea.europa.eu/data-and-maps/data/waterbase-transitional-coastal-and-marine-waters-11
5. ^Available at: https://www.eea.europa.eu/data-and-maps/data/waterbase-transitional-coastal-and-marine-waters-11
6. ^Available at: http://www.emodnet.eu
References
Azzellino, A., Fossi, M. C., Gaspari, S., Lanfredi, C., Lauriano, G., Podestà, M., et al. (2014). An index based on the biodiversity of cetacean species to assess the environmental status of marine ecosystems. Mar. Environ. Res. 100, 94–111. doi: 10.1016/j.marenvres.2014.06.003
Bakke, T., Källqvist, T., Ruus, A., Breedveld, G., and Hylland, K. (2010). Development of sediment quality criteria in Norway. J. Soils Sediments 10, 172–178. doi: 10.1007/s11368-009-0173-y
Baudrier, J., Lefebvre, A., Galgani, F., Saraux, C., and Doray, M. (2018). Optimising french fisheries surveys for marine strategy framework directive integrated ecosystem monitoring. Mar. Pol. 94, 10–19. doi: 10.1016/j.marpol.2018.04.024
Berg, T., Murray, C., Carstensen, J., and Andersen, J. H. (2017). NEAT - Nested Environmental Status Assessment Tool - Manual Version 1.3. DEVOTES project.
Birk, S., Bonne, W., Borja, Á., Brucet, S., Courrat, A., Poikane, S., et al. (2012). Three hundred ways to assess Europe's surface waters: an almost complete overview of biological methods to implement the water framework directive. Ecol. Indicat. 18, 31–41. doi: 10.1016/j.ecolind.2011.10.009
Borja, Á., Bricker, S. B., Dauer, D. M., Demetriades, N. T., Ferreira, J. G., Zhu, C., et al. (2008). Overview of integrative tools and methods in assessing ecological integrity in estuarine and coastal systems worldwide. Mar. Pollut. Bull. 56, 1519–1537. doi: 10.1016/j.marpolbul.2008.07.005
Borja, Á., Dauer, D. M., and Grémare, A. (2012). The importance of setting targets and reference conditions in assessing marine ecosystem quality. Ecol. Indicat. 12, 1–7. doi: 10.1016/j.ecolind.2011.06.018
Borja, Á., Elliott, M., Andersen, J. H., Berg, T., Carstensen, J., Rodríguez-Ezpeleta, N., et al. (2016). Overview of integrative assessment of marine systems: the ecosystem approach in practice. Front. Mar. Sci. 3:20. doi: 10.3389/fmars.2016.00020
Borja, Á., Prins, T., Simboura, N., Andersen, J. H., Berg, T., Uusitalo, L., et al. (2014). Tales from a thousand and one ways to integrate marine ecosystem components when assessing the environmental status. Front. Mar. Sci. 1:72. doi: 10.3389/fmars.2014.00072
Borja, Á., and Rodríguez, J. G. (2010). Problems associated with the 'one-out, all-out' principle, when using multiple ecosystem components in assessing the ecological status of marine waters. Mar. Pollut. Bull. 60, 1143–1146. doi: 10.1016/j.marpolbul.2010.06.026
Caroni, R., van de Bund, W., Clarke, R. T., and Johnson, R. K. (2013). Combination of multiple biological quality elements into waterbody assessment of surface waters. Hydrobiologia 704, 437–451. doi: 10.1007/s10750-012-1274-y
D'Alimonte, D., and Zibordi, G. (2003). Phytoplankton determination in an optically complex coastal region using a multilayer perceptron neural network. IEEE Trans. Geosci. Remote Sens. 41, 2861–2868. doi: 10.1109/TGRS.2003.817682
Dickey-Collas, M. (2014). Why the complex nature of integrated ecosystem assessments requires a flexible and adaptive approach. ICES J. Mar. Sci. 71, 1174–1182. doi: 10.1093/icesjms/fsu027
Duarte, C. M., Poiner, I., and Gunn, J. (2018). Perspectives on a global observing system to assess ocean health. Front. Mar. Sci. 5:265. doi: 10.3389/fmars.2018.00265
Elliott, M. (2013). The 10-tenets for integrated, successful and sustainable marine management. Mar. Pollut. Bull. 74, 1–5. doi: 10.1016/j.marpolbul.2013.08.001
Elliott, M., Borja, Á. A., McQuatters-Gollop Mazik, K., Birchenough, S., Andersen, J., Peck, M., et al. (2015). Force majeure: will climate change affect our ability to attain good environmental status for marine biodiversity? Mar. Pollut. Bull. 95, 7–27. doi: 10.1016/j.marpolbul.2015.03.015
Elliott, M., Burdon, D., Atkins, J. P., Borja, Á., Cormier, R., Turner, R. K., et al. (2017). “And DPSIR begat DAPSI(W)R(M)!” - a unifying framework for marine environmental management. Mar. Pollut. Bull. 118, 27–40. doi: 10.1016/j.marpolbul.2017.03.049
European Commission (2008). Directive 2008/56/EC of the European Parliament and of the Council establishing a framework for community action in the field of marine environmental policy (Marine Strategy Framework Directive). Off. J. Eur. Union. L164, 19–40.
European Commission (2013). Directive 2013/39/EU of the European Parliament and of the Council of 12 August 2013 amending Directives 2000/60/EC and 2008/105/EC as regards priority substances in the field of water policy. Off. J. Eur. Union L226, 1–17.
European Commission (2017). Commission Decision (EU) 2017/848 of 17 May 2017 laying down criteria and methodological standards on good environmental status of marine waters and specifications and standardised methods for monitoring and assessment, and repealing Decision 2010/477/EU. Off. J. Eur. Commun. L125, 43–74.
European Commission (2018). Commission Decision (EU) 2018/229 of 12 February 2018 establishing, pursuant to Directive 2000/60/EC of the European Parliament and of the Council, the values of the Member State monitoring system classifications as a result of the intercalibration exercise and repealing Commission Decision 2013/480/EU. Off. J. Eur. Commun. L47, 1–91.
Ferreira, J. G., Andersen, J. H., Borja, Á., Bricker, S. B., Camp, J. M., Claussen, U., et al. (2011). Overview of eutrophication indicators to assess environmental status within the european marine strategy framework directive. Estuarine Coastal Shelf Sci. 93, 117–131. doi: 10.1016/j.ecss.2011.03.014
Froese, R., Winker, H., Coro, G., Demirel, N., Tsikliras, A. C., Matz-Lück, N., et al. (2018). Status and rebuilding of European fisheries. Mar. Pol. 93, 159–170. doi: 10.1016/j.marpol.2018.04.018
Gan, X., Fernandez, I. C., Guo, J., Wilson, M., Zhao, Y., Wu, J., et al. (2017). When to use what: methods for weighting and aggregating sustainability indicators. Ecol. Indicat. 81, 491–502. doi: 10.1016/j.ecolind.2017.05.068
Gibson, G. R., Bowman, M. L., Gerritsen, J., and Snyder, B. D. (2000). Estuarine and Coastal Marine Waters: Bioassessment and Biocriteria Technical Guidance. Washington, DC: US Environmental Protection Agency, Office of Water.
Gohin, F., Saulquin, B., Oger-Jeanneret, H., Lozac'h, L., Lampert, L., Lefebvre, A., et al. (2008). Towards a better assessment of the ecological status of coastal waters using satellite-derived chlorophyll-a concentrations. Remote Sens. Environ. 112, 3329–3340. doi: 10.1016/j.rse.2008.02.014
Halpern, B. S., Longo, C., Hardy, D., McLeod, K. L., Samhouri, J. F., Zeller, D., et al. (2012). An index to assess the health and benefits of the global ocean. Nature 488, 615–620. doi: 10.1038/nature11397
Haraldsson, M., Larrissa Arroyo, N., Capuzzo, E., Claquin, P., Kromkamp, J., Niquil, N., et al. (2017). Report on the integration of OSPAR food Webs Indicators Into the NEAT tool EcApRHA Deliverable WP 3.5. EcApRHA project.
HELCOM (2010). Ecosystem health of the baltic sea 2003–2007: HELCOM Initial Holistic Assessment. Baltic Sea Environ. Proc. 122, 1–68.
Hering, D., Borja, Á., Carstensen, J., Carvalho, L., Elliott, M., Feld, C., et al. (2010). The european water framework directive at the age of 10: a critical review of the achievements with recommendations for the future. Sci. Total Environ. 408, 4007–4019. doi: 10.1016/j.scitotenv.2010.05.031
Hu, C., Lee, Z., and Franz, B. A. (2012). Chlorophyll-a algorithms for oligotrophic oceans: a novel approach based on three-band reflectance difference. J. Geophys. Res. 117:C01011. doi: 10.1029/2011JC007395
Hummel, H., Frost, M., Juanes, J. A., Kochmann, J. C. F., Castellanos Perez Bolde Aneiros, F., de Matos, V. K. F., et al. (2015). A comparison of the degree of implementation of marine biodiversity indicators by European countries in relation to the marine strategy framework directive (MSFD). J. Mar. Biol. Associat. United Kingdom 95, 1519–1531. doi: 10.1017/S0025315415000235
Inniss, L., Simcock, A., Ajawin, A. Y., Alcala, A. C., Bernal, P., Wławski, J. M., et al. (2016). The First Global Integrated Marine Assessment World Ocean Assessment I. New York, NY: United Nations General Assembly.
Jensen, H. M., Panagiotidis, P., and Reker, J. (2017). Delineation of the MSFD Article 4 Marine Regions and Subregions. Version 1.0. European Environment Agency. Avilable online at: https://data.europa.eu/euodp/data/dataset/data_msfd-regions-and-subregions
Kopelevich, O. V., Sheberstov, S.V., Sahling, I.V., Vazyulya, S.V, and Burenkov, V. I. (2013). “Bio-optical characteristics of the russian seas from satellite ocean color data of 1998–2012,” in Proceedings of the VII International Conference “Current Problems in Optics of Natural Waters (ONW 2013) (St. Petersburg).
Korpinen, S., and Andersen, J. (2016). A global review of cumulative pressure and impact assessments in marine environment. Front. Mar. Sci. 3:153. doi: 10.3389/fmars.2016.00153
Langhans, S. D., Reichert, P., and Schuwirth, N. (2014). The method matters: a guide for indicator aggregation in ecological assessments. Ecol. Indicat. 45, 494–507. doi: 10.1016/j.ecolind.2014.05.014
Levin, P. S., Fogarty, M. J., Murawski, S. A., and Fluharty, D. (2009). Integrated ecosystem assessments: developing the scientific basis for ecosystem-based management of the ocean. PLoS Biology 7:e1000014. doi: 10.1371/journal.pbio.1000014
Link, J. S., and Browman, H. I. (2014). Integrating what? levels of marine ecosystem-based assessment and management. ICES J. Mar. Sci. 71, 1170–1173. doi: 10.1093/icesjms/fsu026
Lotze, H. K., Guest, H., O'Leary, J., Tuda, A., and Wallace, D. (2018). Public perceptions of marine threats and protection from around the world. Ocean Coast. Manage. 152, 14–22. doi: 10.1016/j.ocecoaman.2017.11.004
Menchaca, I., Borja, Á., Belzunce-Segarra, M. J., Franco, J., Garmendia, J. M., Rodríguez, J. G., et al. (2012). An empirical approach to the determination of metal regional sediment quality guidelines, in marine waters, within the european water framework directive. Chem. Ecol. 28, 205–220. doi: 10.1080/02757540.2011.651129
Menchaca, I., Rodríguez, J. G., Borja, Á. Belzunce-Segarra, M. J., Franco, J., Larreta, J., et al. (2014). Determination of polychlorinated biphenyl and polycyclic aromatic hydrocarbon marine regional sediment quality guidelines within the european water framework directive. Chem. Ecol. 30, 693–700. doi: 10.1080/02757540.2014.917175
Miloslavich, P., Bax, N. J., Simmons, S. E., Klein, E., Appeltans, W., Shin, J., et al. (2018). Essential ocean variables for global sustained observations of biodiversity and ecosystem changes. Global Change Biol. 24, 2416–2433. doi: 10.1111/gcb.14108
Moriarty, P. E., Hodgson, E. E., Froehlich, H. E., Hennessey, S. M., Marshall, K. N., Stawitz, C. C., et al. (2018). The need for validation of ecological indices. Ecol. Indicat. 84, 546–552. doi: 10.1016/j.ecolind.2017.09.028
Moss, B. (2008). The water framework directive: total environment or political compromise? Sci. Total Environ. 400, 32–41. doi: 10.1016/j.scitotenv.2008.04.029
Moss, B., Alvarez, C., Becares, E., Van De Bund, W., Collings, S.E., Van Donk, E., Wilson, D., et al. (2003). The determination of ecological status in shallow lakes – a tested system (ECOFRAME) for implementation of the european water framework directive. Aqua. Conser. Mar. Freshwater Ecosyst. 13, 507–549. doi: 10.1002/aqc.592
Muller-Karger, F. E., Hestir, E., Ade, C., Turpie, K., Roberts, D. A., Jetz, W., et al. (2018). Satellite sensor requirements for monitoring essential biodiversity variables of coastal ecosystems. Ecol. Appl. 28, 749–760. doi: 10.1002/eap.1682
Nemati, H., Shokri, M. R., Ramezanpour, Z., Ebrahimi Pour, G. H., Muxika, I., and Borja, Á. (2017). Using multiple indicators to assess the environmental status in impacted and non-impacted bathing waters in the iranian caspian sea. Ecol. Indicat. 82, 175–182. doi: 10.1016/j.ecolind.2017.06.054
Nemati, H., Shokri, M. R., Ramezanpour, Z., Ebrahimi Pour, G. H., Muxika, I., and Borja, Á. (2018). Sensitivity of indicators matters when using aggregation methods to assess marine environmental status. Mar. Pollut. Bull. 128, 234–239. doi: 10.1016/j.marpolbul.2018.01.031
Pavlidou, A., Simboura, N., Pagou Assimakopoulou, G., Gerakaris, V., Hatzianestis, I., Borja, Á., et al. (2019). Using a holistic ecosystem-integrated approach to assess the environmental status of saronikos gulf, eastern mediterranean. Ecol. Indicat. 96, 336–350. doi: 10.1016/j.ecolind.2018.09.007
Pereira, H. M., Ferrier, S., Walters, M., Geller, G. N., Jongman, R. H. G., Wegmann, M., et al. (2013). Essential biodiversity variables. Science 339, 277–278. doi: 10.1126/science.1229931
Pitarch, J., Volpe, G., Colella, S., Krasemann, H., and Santoleri, R. (2016). Remote sensing of chlorophyll in the Baltic Sea at basin scale from 1997 to 2012 using merged multi-sensor data, Ocean. Science 12, 379–389. doi: 10.5194/os-12-379-2016
Probst, W. N., and Lynam, C. P. (2016). Integrated assessment results depend on aggregation method and framework structure – a case study within the european marine strategy framework directive. Ecol. Indicat. 61, 871–881. doi: 10.1016/j.ecolind.2015.10.040
Reker, J. C., and de Carvalho Belchior, Royo Gelabert, E. (2015). State of Europe's Seas. EEA Report, European Environment Agency, Copenhagen.
Rombouts, I., Beaugrand, G., Fizzala, X., Gaill, F., Greenstreet, S. P. R., Féral, J. P., et al. (2013). Food web indicators under the marine strategy framework directive: from complexity to simplicity? Ecol. Indicat. 29, 246–254. doi: 10.1016/j.ecolind.2012.12.021
Rossberg, A. G., Uusitalo, L., Berg, T., Zaiko, A., Chenuil, A., Uyarra, M., Lynam, C. P., et al. (2017). Quantitative criteria for choosing targets and indicators for sustainable use of ecosystems. Ecol. Indicat. 72, 215–224. doi: 10.1016/j.ecolind.2016.08.005
Teixeira, H., Berg, T., Uusitalo, L., Fürhaupter, K. A.-,Heiskanen, S., Borja, Á., et al. (2016). A catalogue of marine biodiversity indicators. Front. Mar. Sci. 3:207. doi: 10.3389/fmars.2016.00207
Tett, P., Gowen, R. J., Painting, S. J., Elliott, M., Forster, R., Wilkinson, M., et al. (2013). Framework for understanding marine ecosystem health. Mar. Ecol. Progress Series 494, 1–27. doi: 10.3354/meps10539
UNEP (2014). Measuring Success: Indicators for the Regional Seas Conventions and Action Plans. UNEP Regional Seas Report and Studies No. 194.
Uusitalo, L., Blanchet, H., Andersen, J., Beauchard, O., Berg, T., Bianchelli, S., et al. (2016). Indicator-based assessment of marine biological diversity – lessons from 10 case studies across the European Seas. Front. Mar. Sci. 3:159. doi: 10.3389/fmars.2016.00159
Volpe, G., Santoleri, R., Vellucci, V. M., Ribera d'AlcalaMarullo, S., and D'Ortenzio, F. (2007). The colour of the mediterranean sea: global versus regional bio-optical algorithms evaluation and im plication for satellite chlorophyll estimates, Remote Sens. Environ. 107, 625–638. doi: 10.1016/j.rse.2006.10.017
Keywords: ecosystem-based approach, Marine Strategy Framework Directive, NEAT, aggregation methods, one-out, all-out, large scale assessment
Citation: Borja A, Garmendia JM, Menchaca I, Uriarte A and Sagarmínaga Y (2019) Yes, We Can! Large-Scale Integrative Assessment of European Regional Seas, Using Open Access Databases. Front. Mar. Sci. 6:19. doi: 10.3389/fmars.2019.00019
Received: 16 November 2018; Accepted: 15 January 2019;
Published: 04 February 2019.
Edited by:
Christos Dimitrios Arvanitidis, Hellenic Centre for Marine Research (HCMR), GreeceReviewed by:
Laura Uusitalo, Finnish Environment Institute (SYKE), FinlandRicardo Serrão Santos, Universidade dos Açores, Portugal
Torsten Berg, MariLim Aquatic Research GmbH, Germany
Copyright © 2019 Borja, Garmendia, Menchaca, Uriarte and Sagarmínaga. This is an open-access article distributed under the terms of the Creative Commons Attribution License (CC BY). The use, distribution or reproduction in other forums is permitted, provided the original author(s) and the copyright owner(s) are credited and that the original publication in this journal is cited, in accordance with accepted academic practice. No use, distribution or reproduction is permitted which does not comply with these terms.
*Correspondence: Angel Borja, YWJvcmphQGF6dGkuZXM=