- National Institute of Water and Atmospheric Research, Auckland, New Zealand
Mapping ecosystem services in marine systems is difficult due to a lack of underpinning ecological data. The Ecological Principles Approach (EPA) was developed to link simple summary statements on how ecosystems function to ecosystem services and was further advanced into a mapping technique by aligning and weighting commonly available spatial datasets to generate maps of specific services. The objective of the present investigation was to validate a predicted map of biogenic habitat provision with empirical ground-truthed data. A survey was undertaken to assess the biogenic habitat structure at 56 sites in the Hauraki Gulf, New Zealand. Information on benthic biogenic structure was ranked from 1 to 5 relating to a combination of height and complexity. Rank groups were assessed for differences in predicted levels of service and the accuracy of supporting data. We found high agreement between the empirical observations and the model predictions: in areas predicted by the approach to have the highest levels of biogenic habitat complexity the habitat was typified by complex rocky reef communities and macroalgal forests. We showed that ecosystem services can be accurately mapped in marine systems at low cost and with modest data requirements, which further enhances the utility of this approach.
Introduction
Describing the goods and services that ecosystems provide can facilitate environmental stewardship if it allows the general public to understand the links between the underlying functions of natural systems and human well-being (de Groot, 1992; Daily, 1997; Daily et al., 2000; Millenium Ecosystem Assessment [MEA], 2005). Focus on ecosystem services in coastal marine systems is particularly important given that they are affected by multiple and cumulative stressors (Breitburg and Riedel, 2005; Crain et al., 2008) and since supporting and regulating services are commonly overlooked relative to services related to food production or recreation. There are strong links between ecosystem functioning and ecosystem services at the habitat level (De Jonge et al., 2012), however, the mapping of ecosystem services is difficult in marine systems due to a dearth of underpinning ecological data and up-scaling methodologies (Drakou et al., 2017; Townsend et al., 2018). Spatial information on services is urgently needed to facilitate an understanding of the benefits, costs and trade-offs associated with different decisions in marine management (White et al., 2012; Böhnke-Henrichs et al., 2013; Lester et al., 2013). Furthermore, many countries have national and international statutory commitments to protect elements of the natural environment from which ecosystem services flow, e.g., the United Nations’ Convention on Biological Diversity (CBD) Aichi Target 111 and require knowledge on service provision and coverage. In shallow coastal systems, ecosystem service provision is often driven by predominantly benthic processes. For example, benthic primary production can exceed that of the water-column and the seabed can be both a source and sink of inorganic nutrients (MacIntyre et al., 1996; Sundbäck et al., 2003). Many of the marine species that are harvested as food are reliant on benthic habitats during their life cycle. Emergent structures that extend from the benthos into the water column provide complexity and vertical relief that can be utilized as refuge habitat for juvenile fish and invertebrates (Kamenos et al., 2004; Beaumont et al., 2007; Lohrer et al., 2018). This is thought to support lucrative fisheries by enhancing juvenile survivorship and the abundance of spawning stocks and harvestable size classes (Heck and Crowder, 1991; Perkins-Visser et al., 1996; Turner et al., 1999).
Mapping ecosystem services in the absence of habitat information remains a significant challenge and requires novel approaches. The Ecological Principles Approach (EPA) was developed to link simple summary statements on how ecosystems function to ecosystem services (Townsend et al., 2011). This was further advanced into a mapping technique by aligning commonly available spatial datasets (e.g., bathymetry, sediment charts, tidal, and wave data) to specific principles outlined by Townsend et al. (2011). The resultant spatial layers for the contributing principles were scored, weighted relative to one another, and combined to generate maps of specific ecosystem services (Townsend et al., 2014). Townsend et al. (2014) produced maps of ecosystem service potential for productivity, nutrient recycling and biogenic habitat provision. The maps were not fully quantitative, but were instead based on ranks indicating where levels of ecosystem services were expected to be relatively higher and lower.
The objective of the present investigation was to validate the biogenic habitat provision map produced by Townsend et al. (2014), and to shed light on the vulnerabilities of the ecosystem service mapping technique itself, by challenging the map outputs with empirical ground-truthing data. Details on how different levels of biogenic habitat structure were predicted are described in Townsend et al. (2014), but briefly: biogenic habitat structure refers to the array of features created by plants and animals that provides complex niche space in which other species live and shelter. Iconic habitats with high provision of biogenic structure include coral reefs, kelp forests and sponge gardens (Roberts et al., 2002; Byrnes et al., 2006; Miller et al., 2012), where many species, including fish and invertebrates, are found at different heights within the vertical biogenic relief. The EPA links specific attributes that support or hinder the provision of biogenic habitat including: (i) sediment type; as most biogenic structure formers, including large sponges and kelp, require stable substrates to attach to and are therefore predicted to be more common in rocky vs. gravel vs. muddy substrates, (ii) depth; as structure forming kelps are restricted to the photic zone and tend to be more common in shallower vs. deeper areas, (iii) currents; as key structure forming animals including sponges, pinnid bivalves and gorgonians are suspension feeders and are therefore predicted to be more common in areas of higher flow and water motion is also important for structure forming kelps, as it delivers nutrients and prevents sediment accumulation on blades, (iv) turbidity; as this negatively impacts primary production by structure forming kelps and can smother or clog the filter-feeding apparatus of structure forming animals.
In the original Townsend et al. (2014) study, a preliminary validation was attempted using empirical information from two inshore areas of the Hauraki Gulf. These initial results were promising but limited. Limitations arose because the data were only partially suited to the task, being collected for a different purpose and at a different spatial resolution to the service maps. A significant caveat was that the inshore areas where data were available had a limited range in map scores and were known to be impacted by high catchment sediment inputs. Thus, a more suitable and effective validation process was required to examine the map over a full range of scores, including clearer offshore waters, and where fit-for-purpose data could be collected to assess the maps at an appropriate resolution.
The purpose of this study was to: (i) collect empirical data to further examine and validate map output from the EPA and evaluate the model used to construct the maps in the outer Hauraki Gulf and across a wider range of biogenic habitat complexity, (ii) assess the accuracy of the underlying biophysical data used in the model by collecting empirical information on depth and sediment type, and (iii) examine the appropriateness of the model’s spatial resolution by looking at variation in habitat complexity within each 200 m × 200 m grid cell. The coastal waters of Great Barrier Island were selected to test the biogenic habitat model (Figure 1). Great Barrier is New Zealand’s 6th largest island and the largest in the Hauraki Gulf. Its marine area encompasses shallow and deep complex rocky reef communities, soft sediment plains and gravel beds (Roberts et al., 1986; Shears and Usmar, 2006). It is comprised of protected embayments and exposed areas; the south-western coast being subjected to some of the strongest tidal currents in New Zealand (Manighetti and Carter, 1999). The coastal marine area also covers relatively pristine sections and other places that are have been impacted by human activities e.g., benthic trawling.
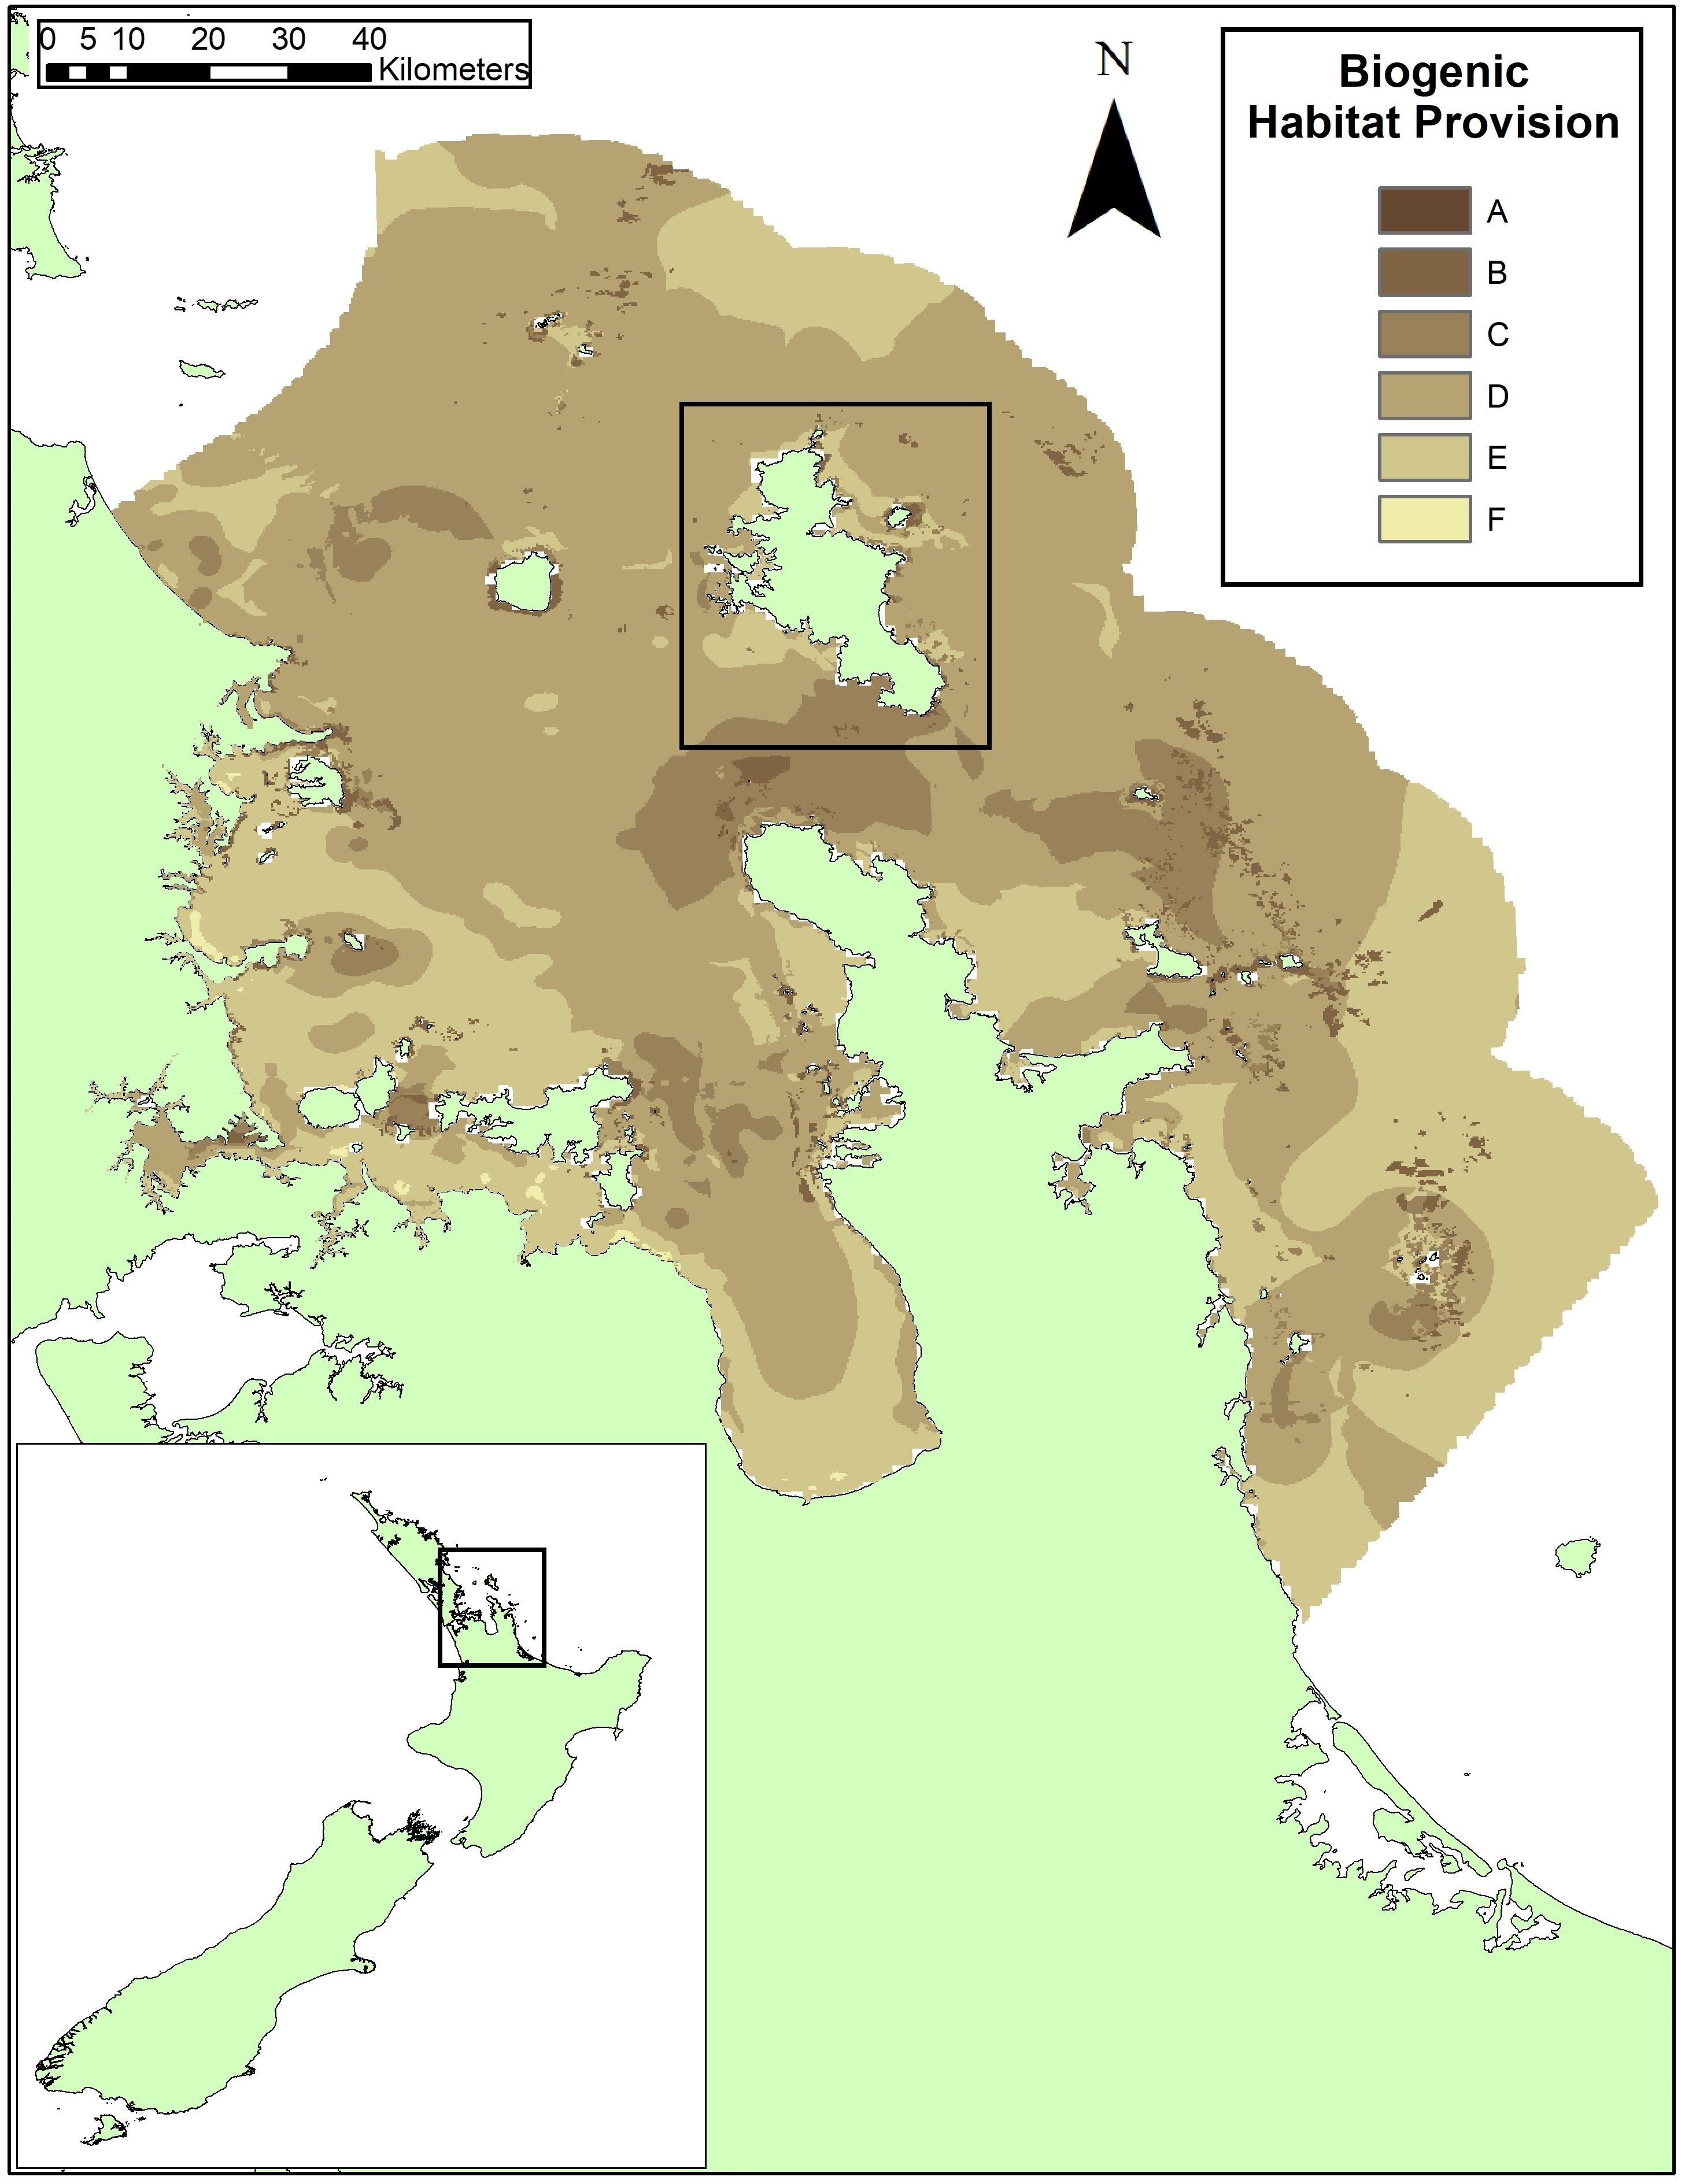
Figure 1. The map of biogenic habitat provision service produced using the EP Approach for the Hauraki Gulf, New Zealand, from Townsend et al. (2014). Great Barrier Island is shown in the black box in the center of the figure. Model scores ranged from a 1.1 to 12.3 across the Hauraki Gulf and were converted to alphabetized classes for relative importance to service provision from high (A, darkest shading) to low (F, lightest shading). The class ranges in Townsend et al. (2014) were modified by combining the original Class A and B (A = model scores >12; B = model scores 12–10) since these represented <0.04% of the 34,000 cells. The range adjustment categorized class A as model scores >10 and then divided classes evenly below: Class B, model scores 10–8; Class C, model scores 8–6; Class D, model scores 6–4; Class E, model scores 4–2; and Class F model scores below 2.
Materials and Methods
Fifty-six sites were selected around Great Barrier Island for assessment of biogenic habitat structure in <50 m depth with varying sediment types (Figure 2). Sites collectively covered a range in model scores from 9.3 to 2.6 where higher maps scores (darker colors) corresponded to cells predicted to have higher levels of biogenic structure. Rank scores were divided into evenly sized classes and alphabetized: scores above 10 were in Class A, 9.99–8.00 were Class B, 7.99–6.00 were Class C, 5.99–4.00 were Class D, 3.99–2.00 were Class E and below 2 in Class F. The 56 sites selected were found within groups B–E, with none coming from the A group as locations where these occurred exceeded the depth capability of surveying equipment (16 sites in class ‘B’; 11 in class ‘C’; 13 in class ‘D’ and 16 in the class ‘E’). Classes B to E covered 99.8% of the model data, with only 0.05% of model cells classed as group A, and 0.15% in group F.
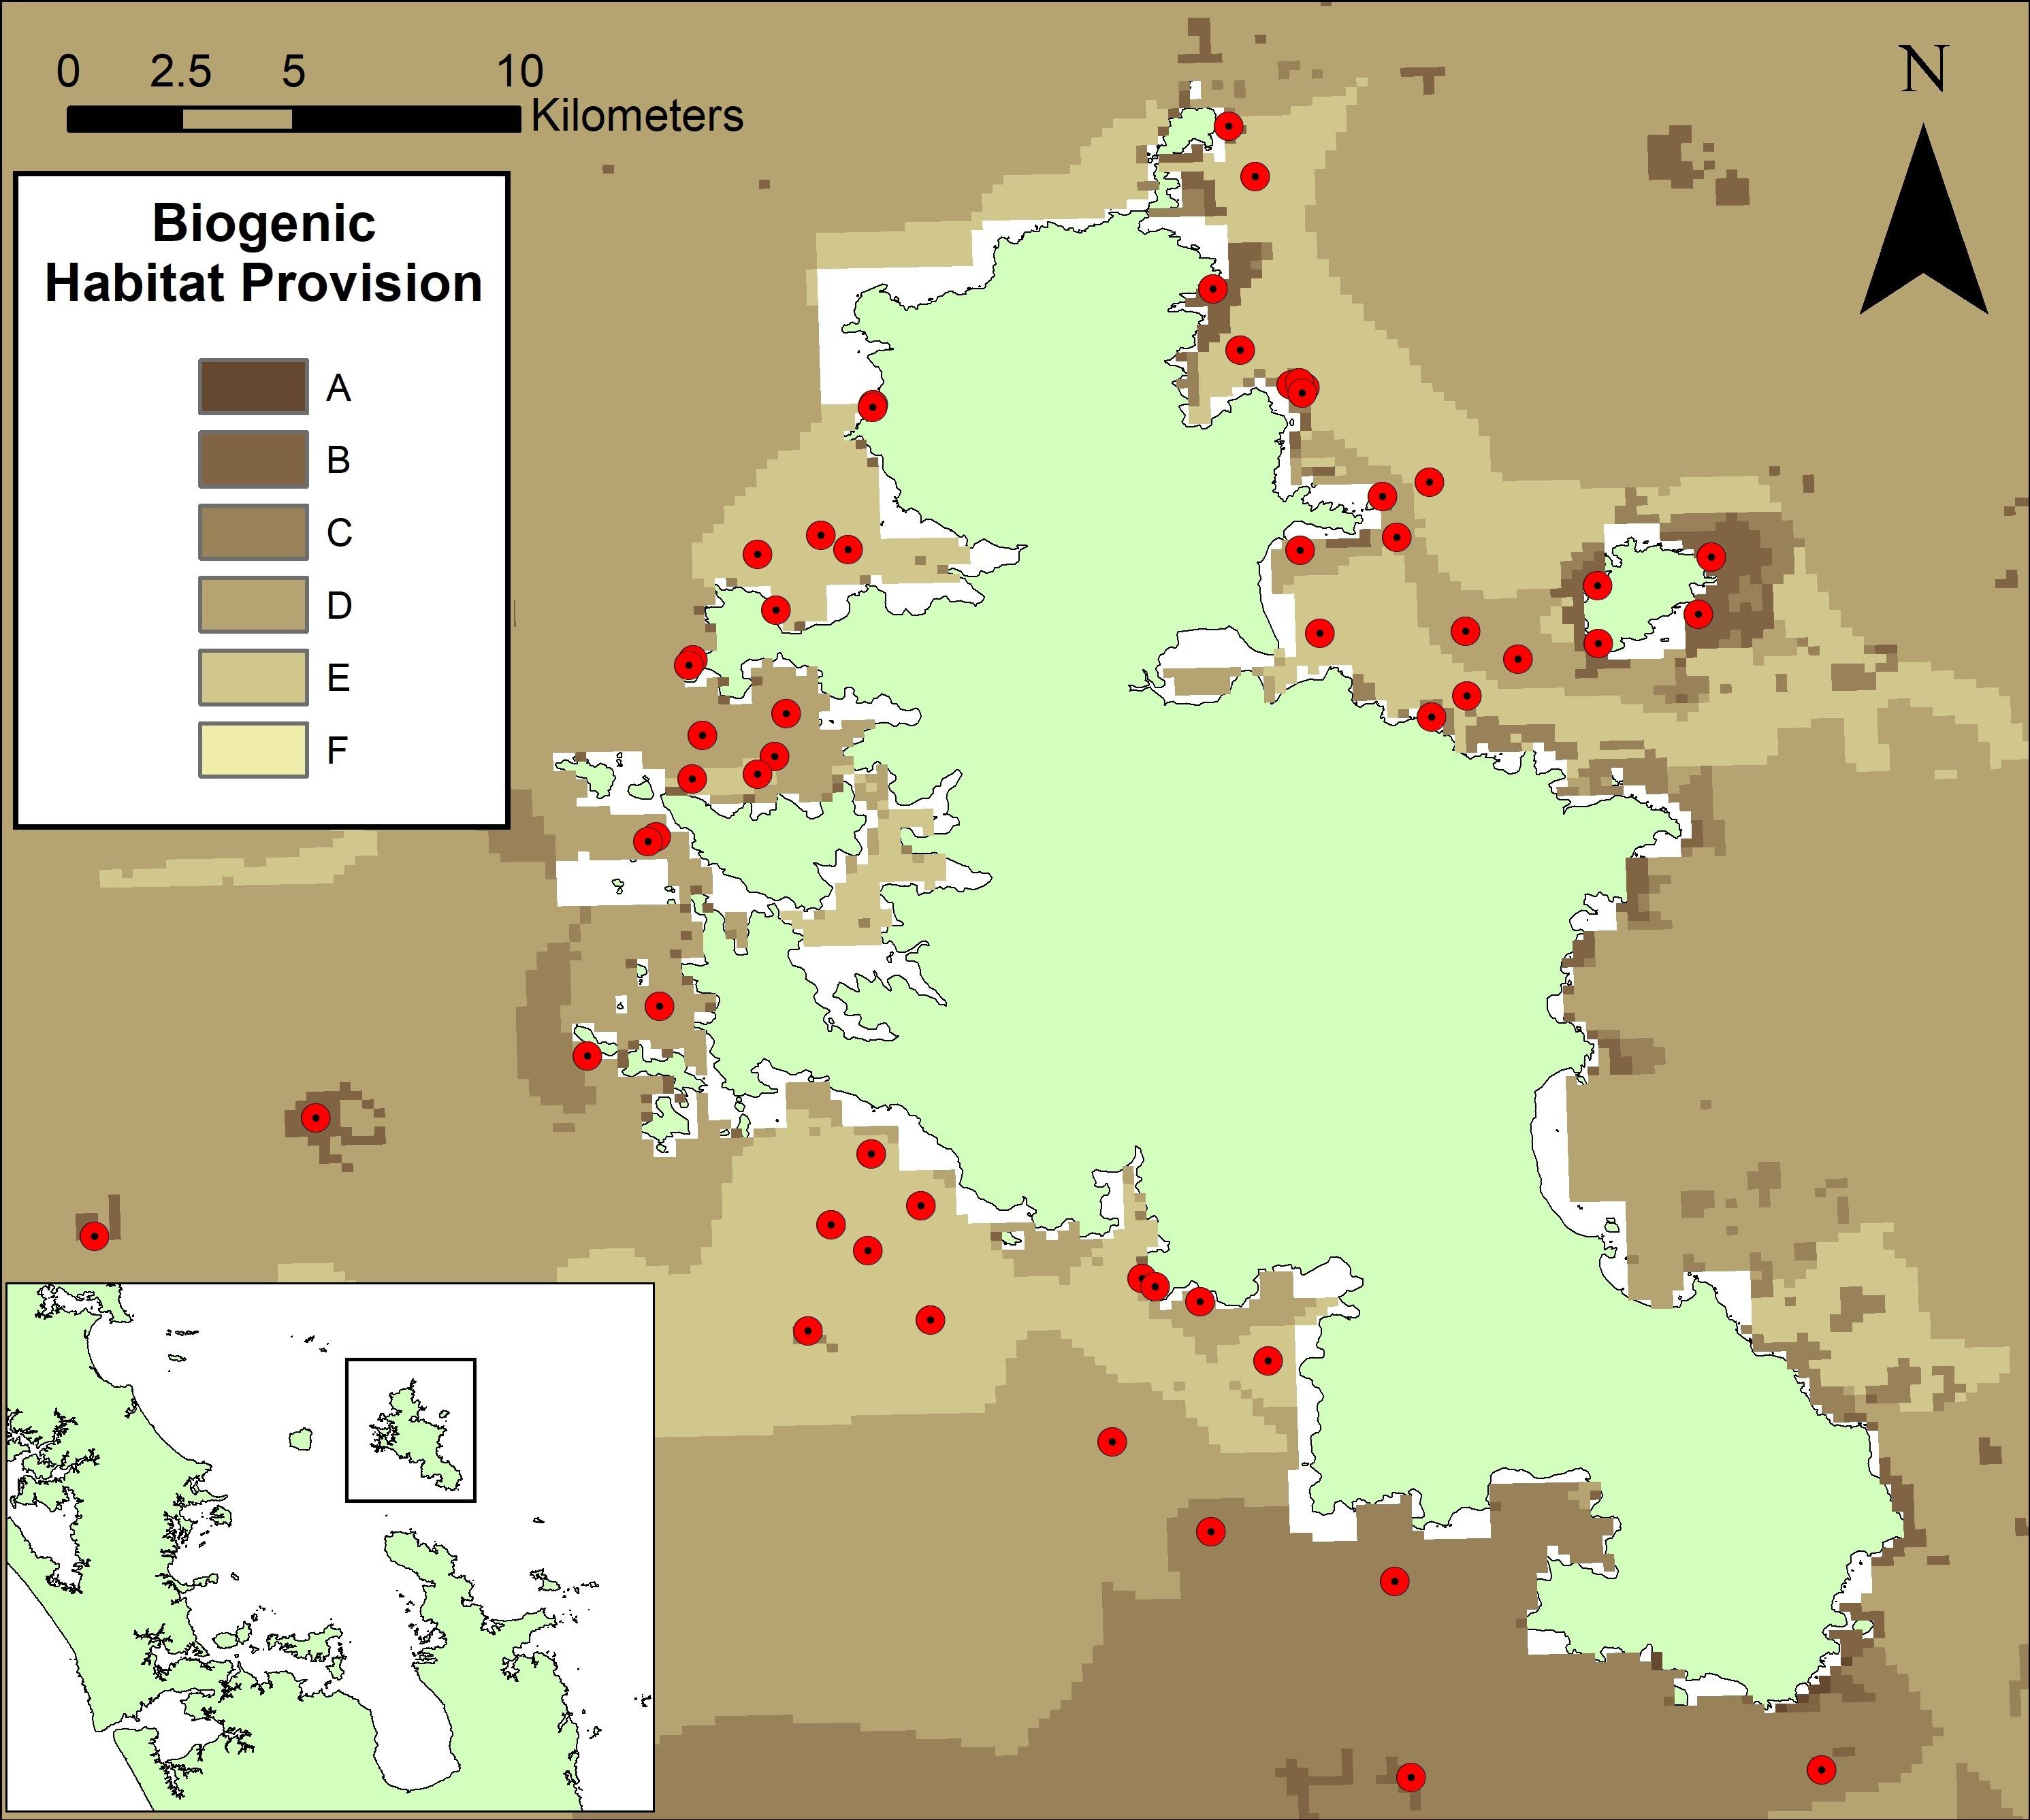
Figure 2. Sites selected for empirical assessment (red dots) around Great Barrier Island, New Zealand, superimposed on the ecosystem service map of biogenic habitat. Sites cover a range of map scores and sediment types and are situated around the island. White spaces close to the shore indicate where biogenic habitat scores could not be calculated. This is due to an absence of data from one or more principle layers in the near shore environment.
The areas targeted for sampling were at the center of specifically selected 200 × 200 m model cells. To collect information on benthic biogenic structure, a drop-cam (Delta Vision Industrial HD) recording 1080/25FPS video was positioned ∼0.7 m above the seafloor as the boat drifted a distance ≥100 m at all sites. The drop camera was mounted with lights (Big Blue VL1800 LED), green scaling lasers (20 cm apart), and, at 0.7 m above the seabed, the field of view during the drift was ∼1 m wide. The drop-cam system was mounted with additional front-facing and side-facing GoPro cameras to enhance our data collection and habitat assessment capabilities. A sounder (Furuno FCV BBDS1) was used to record depth at the start and end of each transect and at regular intervals, and field notes were collected in real time while watching the live video display. Video footage was recorded using Blackmagic Design Media Express software and Blackmagic Design UltraStudio SDI. Transect speed was typically ∼1 km/h resulting in video durations of approximately 6 min for each site. All field sampling was undertaken in October-November 2015.
Once the video data had been secured, videos were reviewed more thoroughly. Biogenic structure was ranked according to (i) vertical height from the seabed and (ii) complexity. Vertical height was ranked on a scale from 1 to 5. Sites where biogenic structures extended ≥0.75 m into the water-column were ranked as 1, whilst sites where biological features were virtually absent were ranked as a 5. Similarly, a complexity ranking was applied based on the prevalence, shape and arrangement of biogenic features (e.g., kelp, sponge and/or complex mixed floral/assemblages scoring highly, especially when there were multiple biogenic layers beneath a tall canopy). Both height and complexity rankings were highly correlated (R2 = 0.80) and, therefore, combined into a single biogenic rank score (1–5) prior to use in subsequent analyses. In all cases, videos were reviewed ‘blind’ such that the model scores were unknown to the video assessor, to avoid biasing the assessments.
Video from each site was also assessed in terms of the degree of uniformity along the transect and categorized as either: Consistent where biogenic features were largely of the same type and size across the majority of the transect; Split where transects were divided into two distinct sections differing in biogenic height/complexity; or heterogeneous where biogenic features varied at multiple junctures along the transect length. For ‘split’ sites, habitat height and complexity were ranked on the habitat type that constituted a greater proportion of the transect, rather than averaging across high and low biogenic complexity. The predominant sediment type observed (rock, gravel, sand, or mud) and the minimum and maximum depths were recorded across each transect. Where empirical sediment and depth data were found to be different from that used in the model calculations (i.e., where a site was observed to be of a different sediment type or where a site was significantly deeper or shallower than the depth used in the model), model scores were recalculated. Analyses were performed on both ‘raw’ and ‘adjusted’ model scores.
Differences in biogenic model scores among the five biogenic structure categories were assessed using non-parametric Kruskal-Wallis tests (SAS 9.4). Multiple comparisons were analyzed using the Dwass, Steel, Critchlow-Fligner Method (Critchlow and Fligner, 1991). The direction of the relationship was assessed using Pearson’s correlation coefficients of median model scores and biogenic ranks.
Results
Descriptions of the Habitats (Empirical Observations)
Biogenic habitats of rank 1 were dominated by high density kelp forest (80–100% of Ecklonia radiata) extending >1 m into the water-column (Figure 3). The kelp was typically attached to large boulders and rocks which provided additional relief and complexity upon which crustose coraline and mixed red algal turfs and large sponges (Ancorina, Raspalia, and Tethya) were observed. Fish were observed in different parts of the kelp canopy (pigfish Bodianus unimaculatus, spotties Notolabrus celidotus, occasional red moki Cheilodactylus spectabilis, snapper Pagrus auratus) and in the gaps between boulders. Deep sites (∼40 m) were dominated by sponges (Stelletta maori, Axinella australiensis, Pararhaphoxya sinclairi, and Iophon minor). These were highly complex in terms of shape and structure and typically extended 75 cm or greater into the water column.
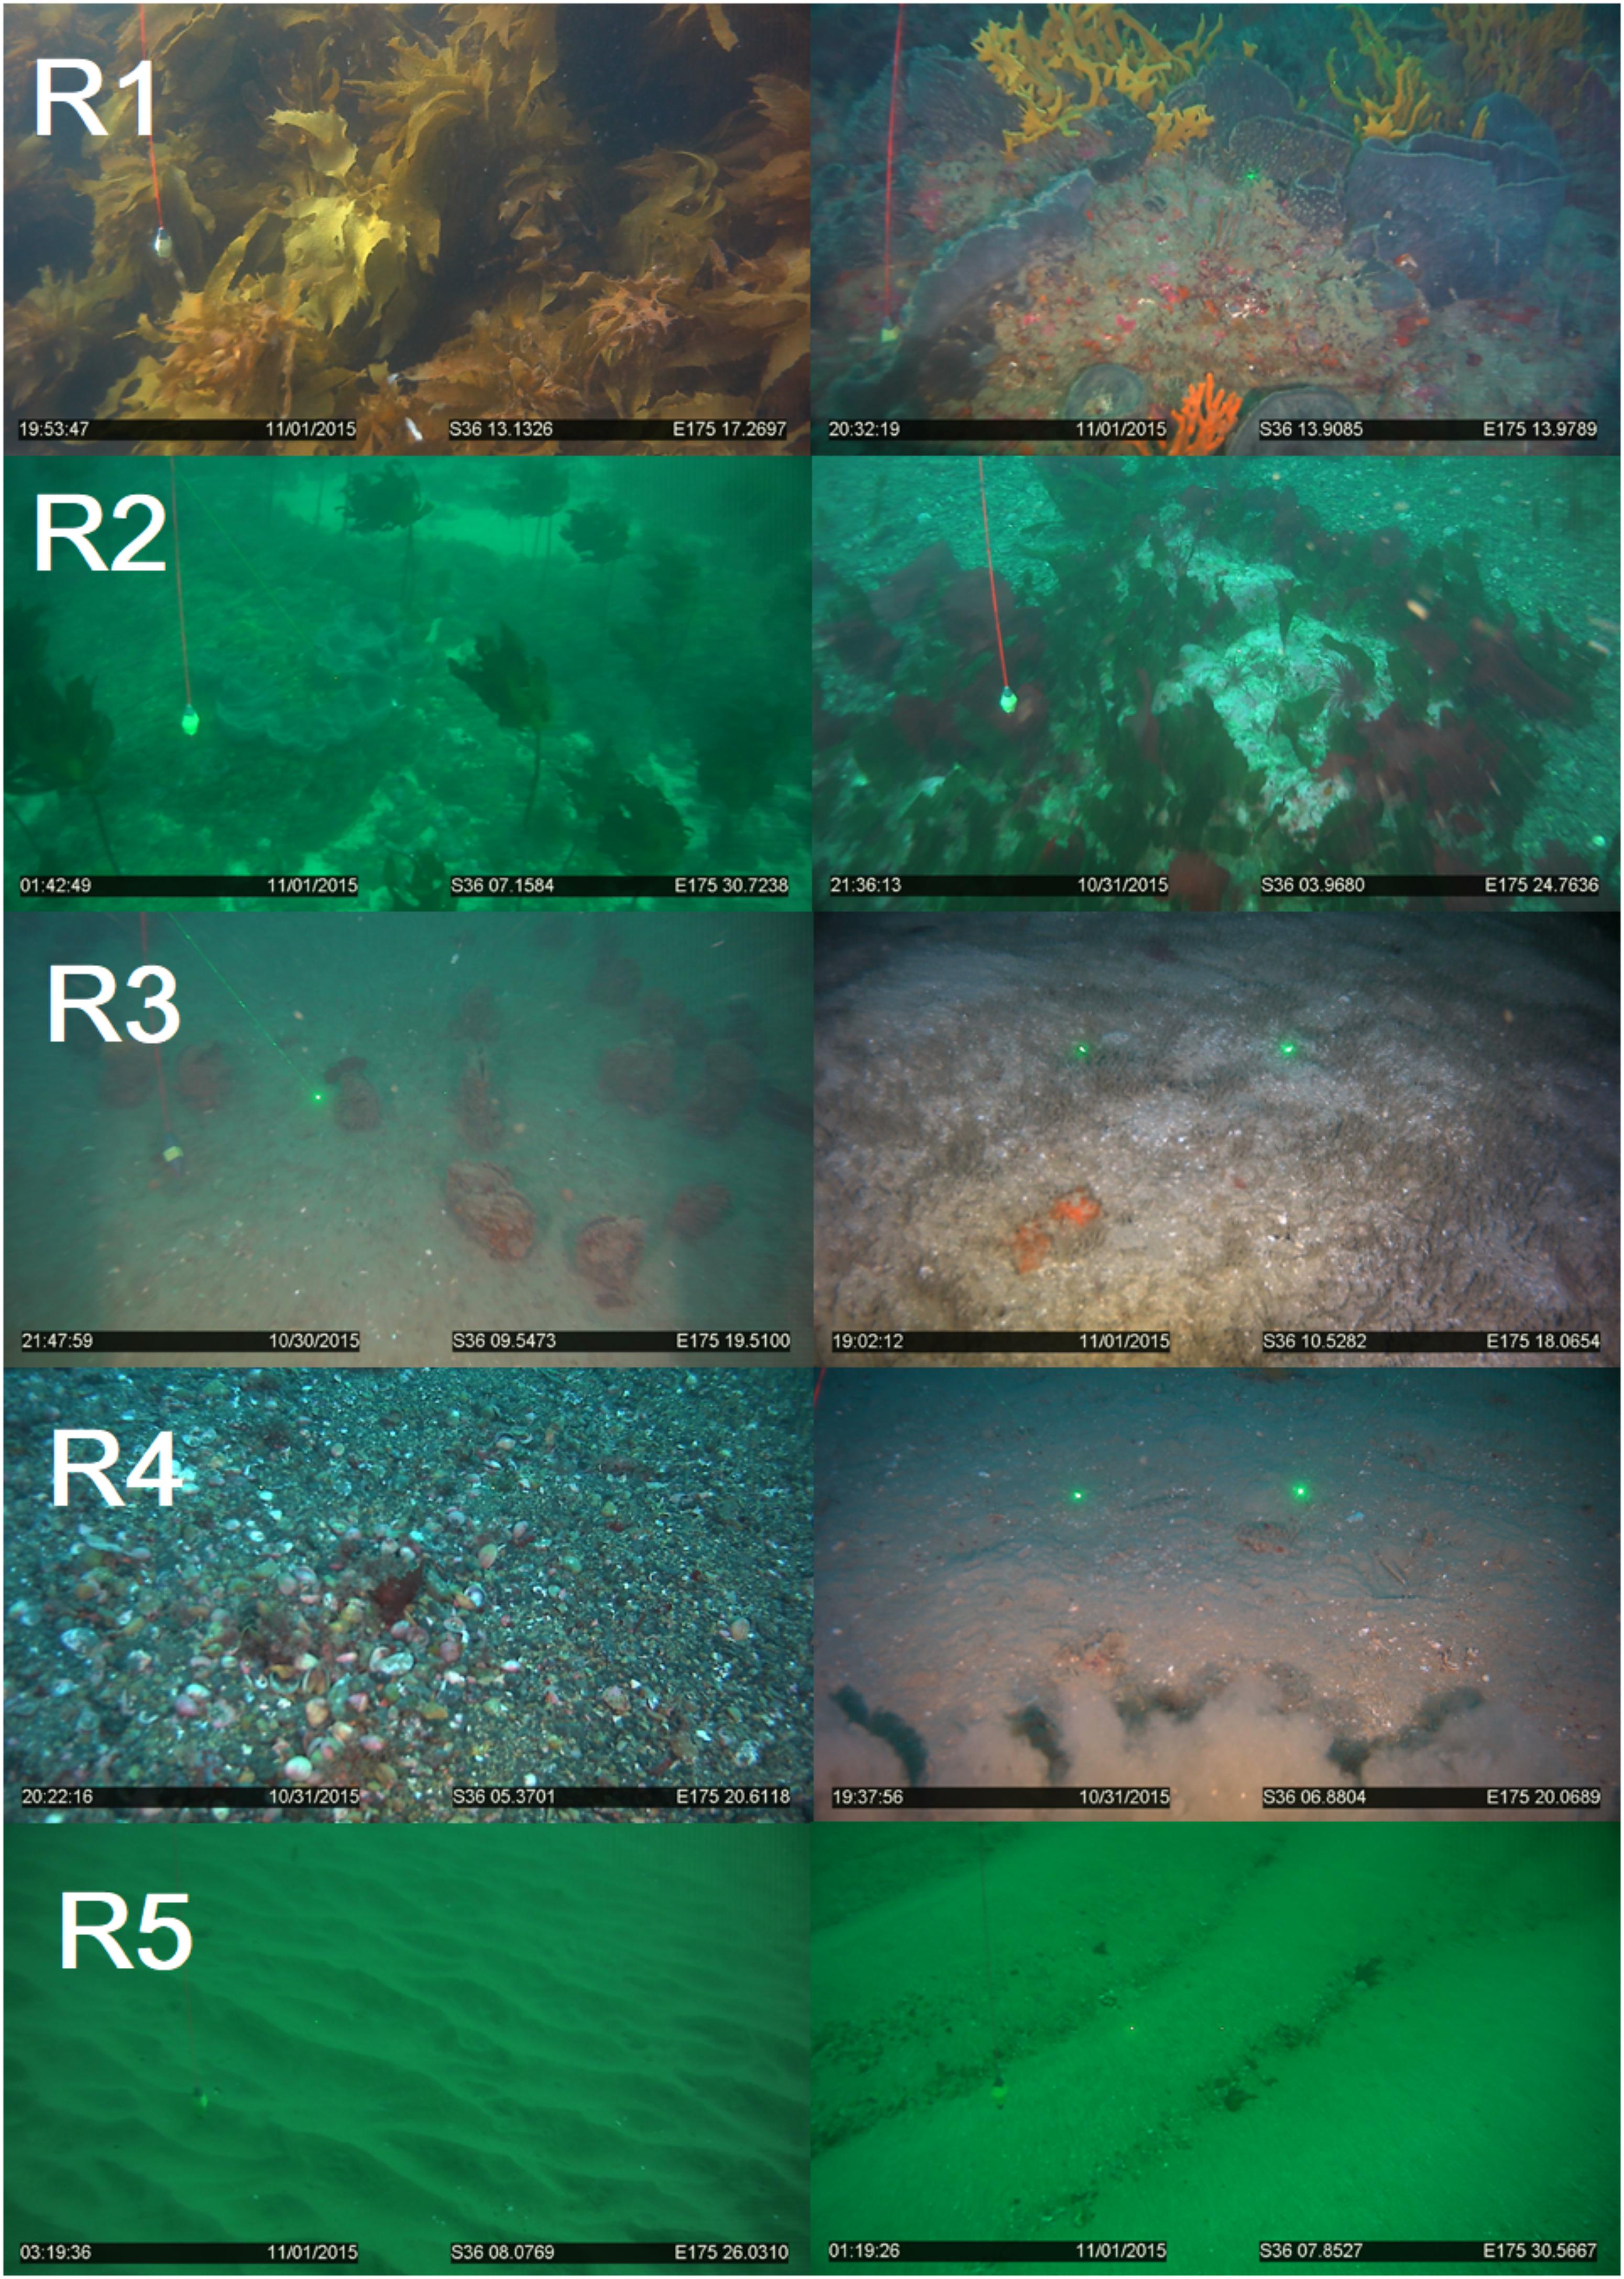
Figure 3. Examples of Biogenic habitat observed from video transect and the assigned ranking (R1–5).
Biogenic habitats of rank 2 were typically comprised of kelp forest, although the kelp plants were sparser and with lower canopy coverage relative to the rank 1, reducing the overall biogenic complexity (Figure 3). Some individual Ecklonia plants were still >1 m tall, but most were generally shorter. Several sites were dominated by other shorter macroalgal species (Caulerpa, Porphyra, Codium, and Carpophyllum) or sponges with vertical relief of 30 to 50 cm. Rank 2 sites were often deeper (mean transect starting depth of 28 m, relative to 12 m for rank 1).
Biogenic habitats of rank 3 were typified by a mixture of low-density sponges and soft sediment with a heterogenous topography from a mosaic of bioturbating species (Figure 3). Larger species extending from the sediment into the overlying water were present and included scallops (Pecten novaezelandiae), horse mussels (Atrina zelandica) with associated commensal epifaunal species (e.g., the solitary ascidian Styela clava). Other surface features included tubeworms (native fan worms; mixed species mats), shrimp mounds (Axiidae and Gebiidea), and bryozoan thickets (Galeopsis porcellanicus, Hippomenella vellicata c.f. Dennis Gordon) with vertical relief of ∼10 to 20 cm. Sites were typically heterogenous with a combination of hard and soft sediment habitats, ranging from small rocks, gravel, sands, and mud.
Biogenic habitats of rank 4 were almost exclusively fine soft sediment communities, with biogenic topography created from bioturbation and shell-hash. Biogenic features included the infrequent occurrence of ascidians or whelks on the sediment surface (Figure 3). Sponges were rarely observed, and when they occurred were small and sparse. Vertical relief from biogenic structures and sediment topography was estimated to be 4–10 cm, although typically at the lower end of this scale.
Biogenic habitats of rank 5 were generally lacking in biogenic features, and the sediment surface was instead largely uniform, lacking in complexity and characterized by shallow wave ripples (Figure 3). Biogenic structures were typically absent or <2 cm in height.
Raw Data
Sites that were assigned a rank of 1 (i.e., the highest structural complexity ranking based on the video data) generally came from areas with high map scores (i.e., high predicted biogenic habitat complexity), indicating a good match between empirical observations and mapped predictions. However, there was considerable variation in map scores within each of the five rank categories (Figure 4). Rank 1 had a maximum score of 8.7 and minimum of 3.6 (map classes B to E); rank 2 had a maximum score of 8.4 and minimum of 4.1 (map classes C to D); the rank 3 group had the overall largest variation in map scores, ranging from 9.5 to 3.3 (map classes B to E). Video transects that were ranked 4 or 5 consistently came from areas with the lowest map scores (averaging 2.5 and 3.1, respectively), although there were exceptions (as high as 8.2 and 8.1, respectively). Despite this variation, there were significant differences in the map scores across ranks (Kruskal Wallis, p < 0.0001) (Figure 4). From the multiple comparisons procedure, rank 2 could not be distinguished from rank 1, 3, or 5 and rank 5 from either rank 4 or 3 (Table 1). Rank 1 was the most distinguishable and was separated from all other ranks except for rank 2.
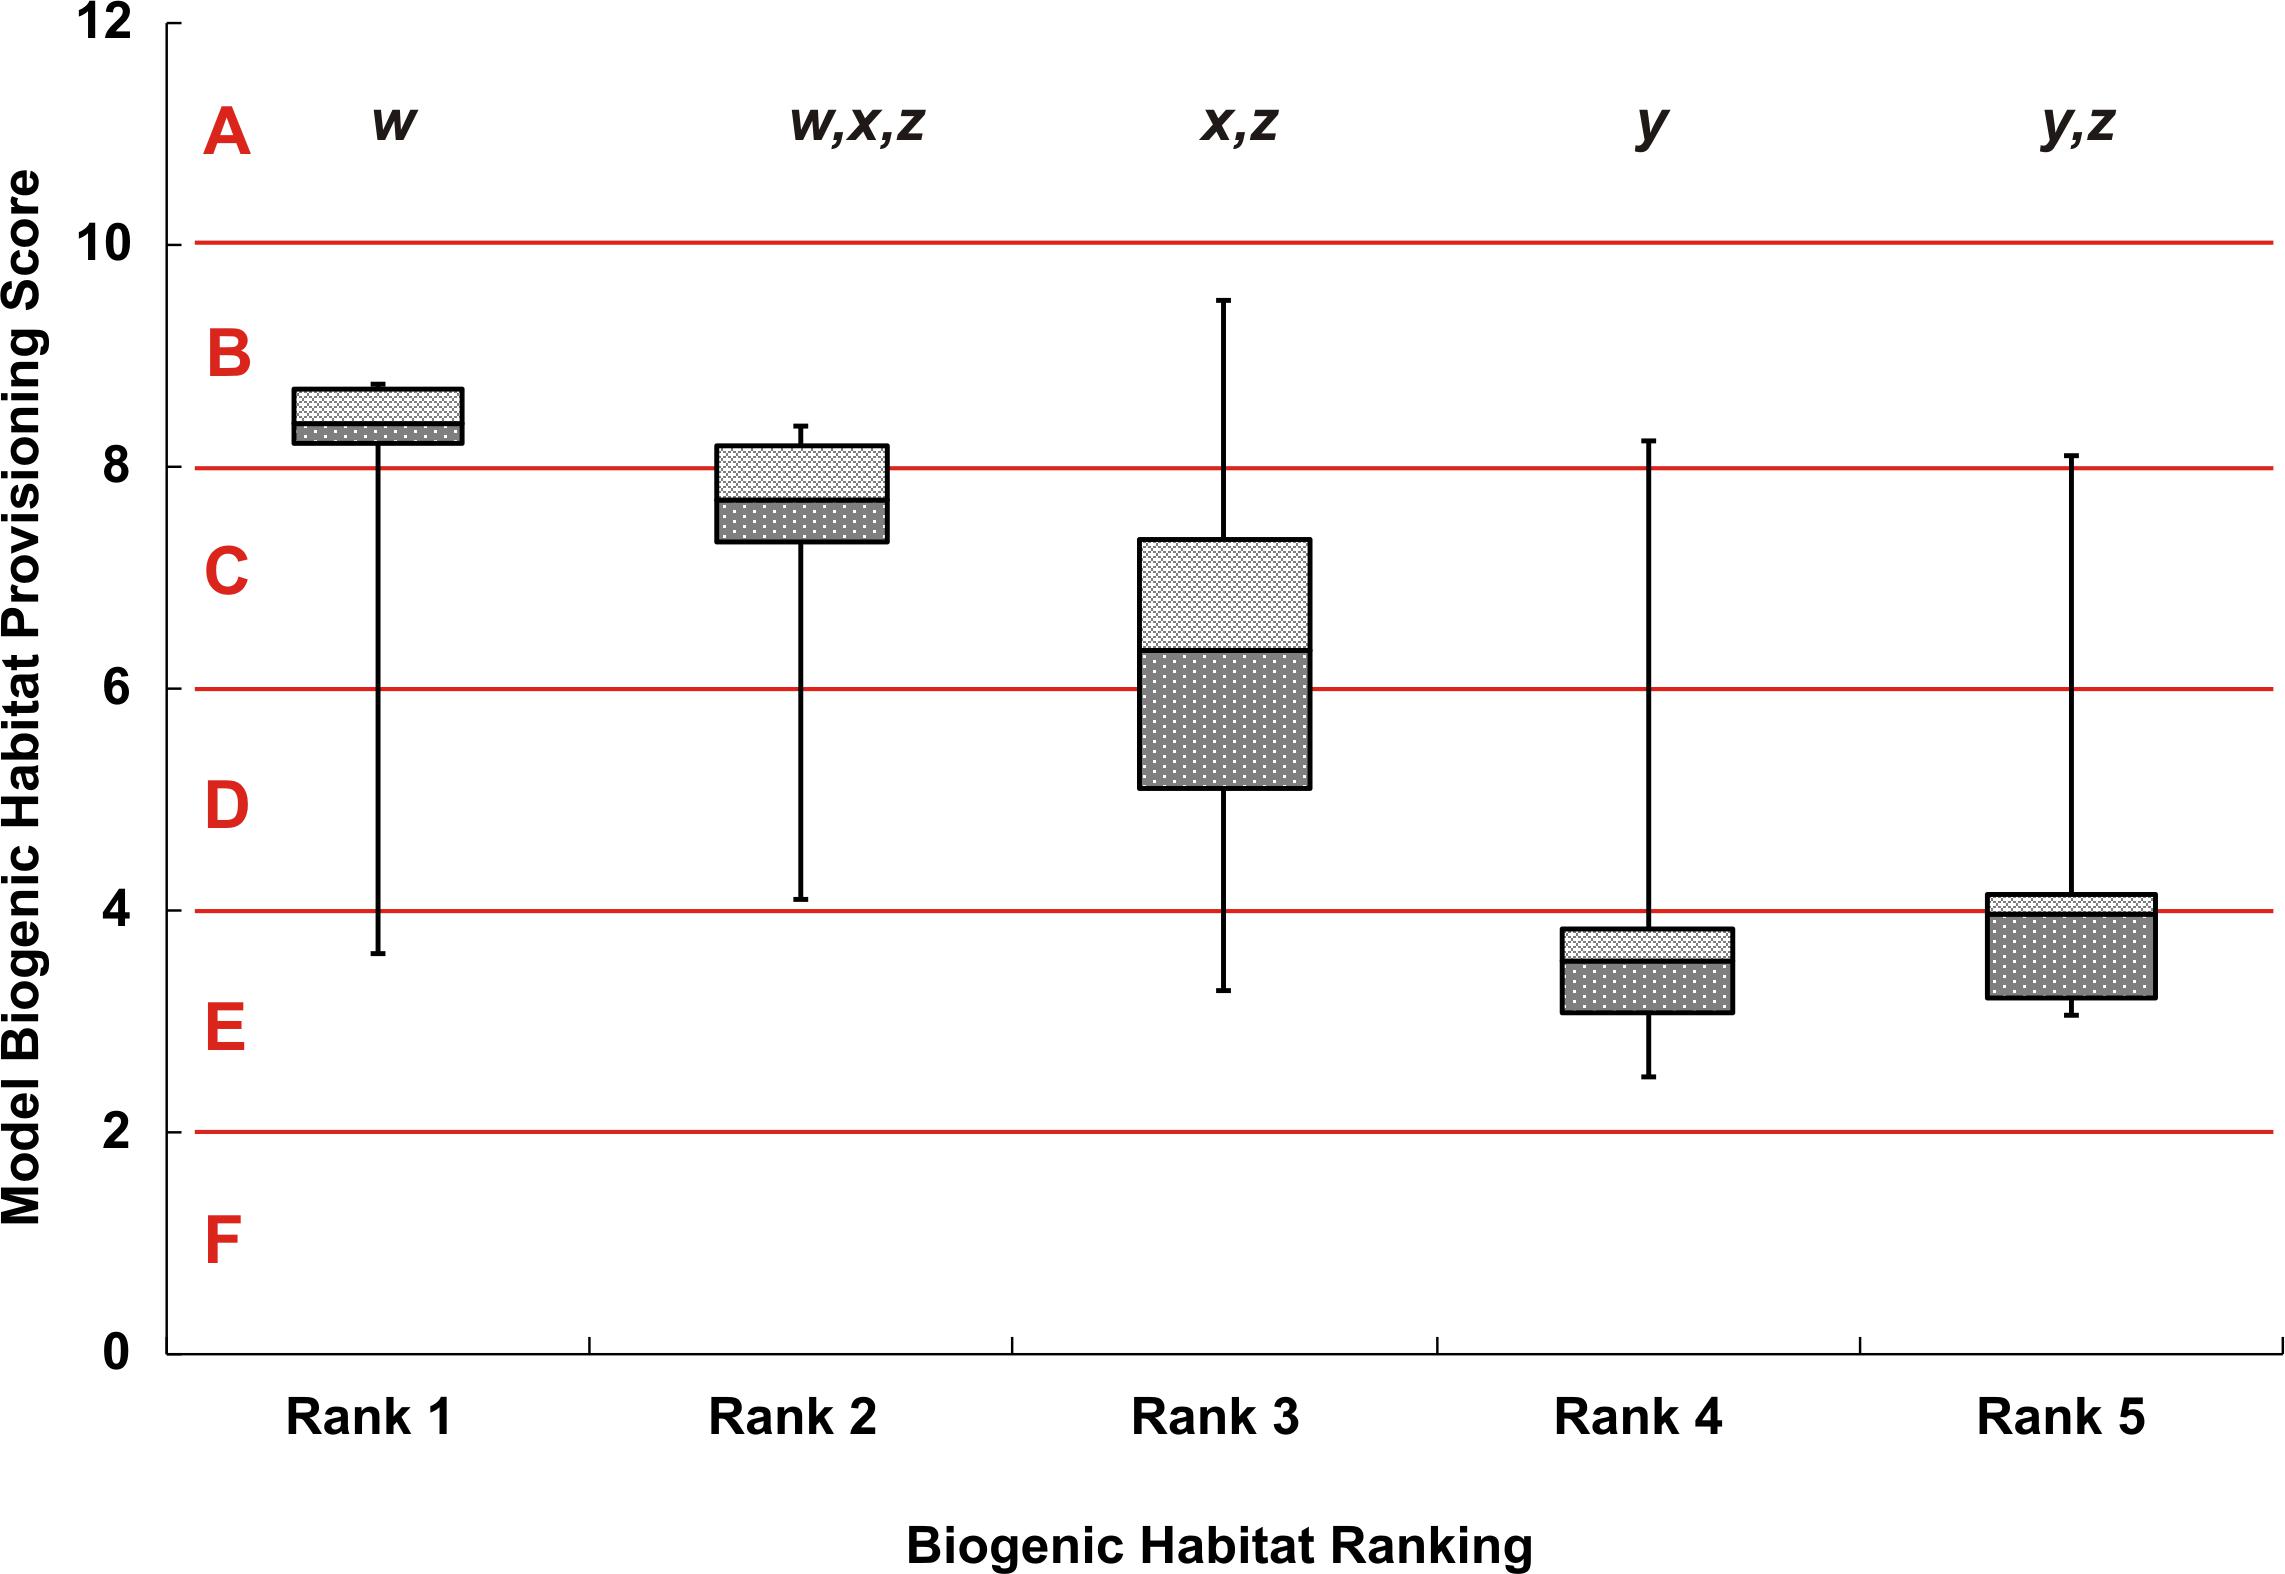
Figure 4. Box whisker plot of modeled biogenic habitat provisioning scores, separated by the 5 ranks from video observations. The y-axis shows the numeric model scores with the alphabetized classes A–F. Error bars show the maximum and minimum biogenic habitat provisioning score for each video rank, dark-gray and light-gray boxes show the 25% and 75% quartiles respectively, away from the median line. Lowercase lettering at the top of the figure, w–z, indicates significant differences between rank classes based on the Dwass, Steel, and Critchlow—Fligner Method.
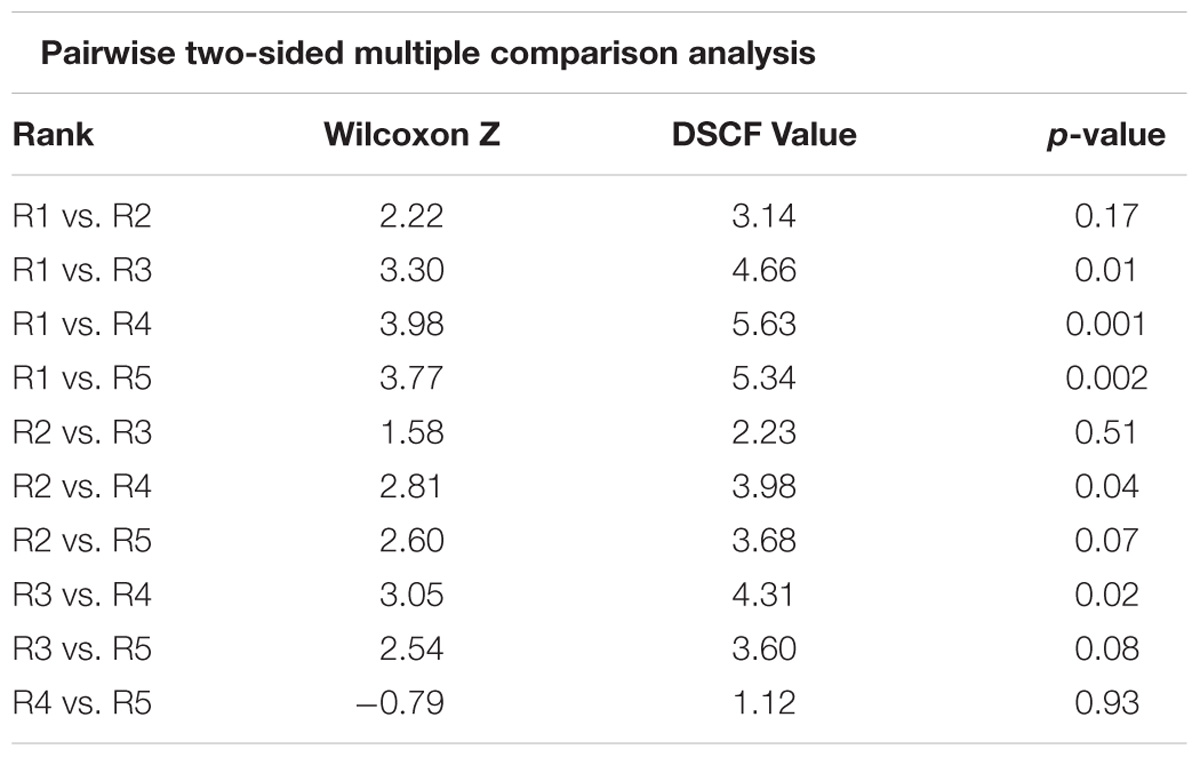
Table 1. Dwass, Steel, Critchlow-Fligner multiple comparison for model scores between biogenic habitat ranks (two-sided comparison) for raw data.
Differences Between Underpinning Environmental Data and Empirical Data
At 11 of the 56 sites (i.e., 20% of those sampled), observations of general habitat characteristics were different than expected, given the underpinning environmental data used in the map predictions. This occurred when, for example, a ‘rock’ substrate type was used to make a map prediction, but the site was observed on video to be sand, gravel or mud substrate instead. Specifically, at eight sites, the sediment type of the underpinning environmental data did not reflect that observed in the video: two sites were observed to be rock but map scores had been calculated from sand, three sites were observed to either be gravel or sand but calculated as rock, and at three sites map scores were calculated from mud when they were observed to be either sand, gravel or rock. At three sites, the depths recorded during the videoed transect were different to those of the bathymetry layer from which map scores were calculated; even after conservatively accounting for variation in tidal state (+/−3.5 m): at one site the map score calculation used a depth of 5–20 m but was observed to be 33 to 45 m deep, at two sites the map scores were based on a depth of 20–35 m but were observed to be 40 and 15 m deep, respectively. The 11 sites with differences between underpinning environmental data and observed site characteristics were spread across the biogenic ranks: two each from ranks 1 and 2, three from rank 3, two from rank 4 and one from rank 5.
Adjusted Data
Following correction of the baseline data, the rank groups became more distinct from each other with respect to map scores (Figure 5). There was little change in mean map scores within each rank group, however, there was a reduction in outliers and a contraction of the 25/75% quartiles for rank 3 (Table 2 and Figures 4, 5). Again, significant differences in the biogenic habitat map scores were detected among ranks (Kruskal Wallis, P < 0.0001). Multiple comparisons differentiated all ranks from each other except for 4 and 5 (Table 3). The Pearson’s correlation between map scores (predicted) and biogenic habitat complexity rank (observed) was strong (R2 = −0.88, P = 0.049).
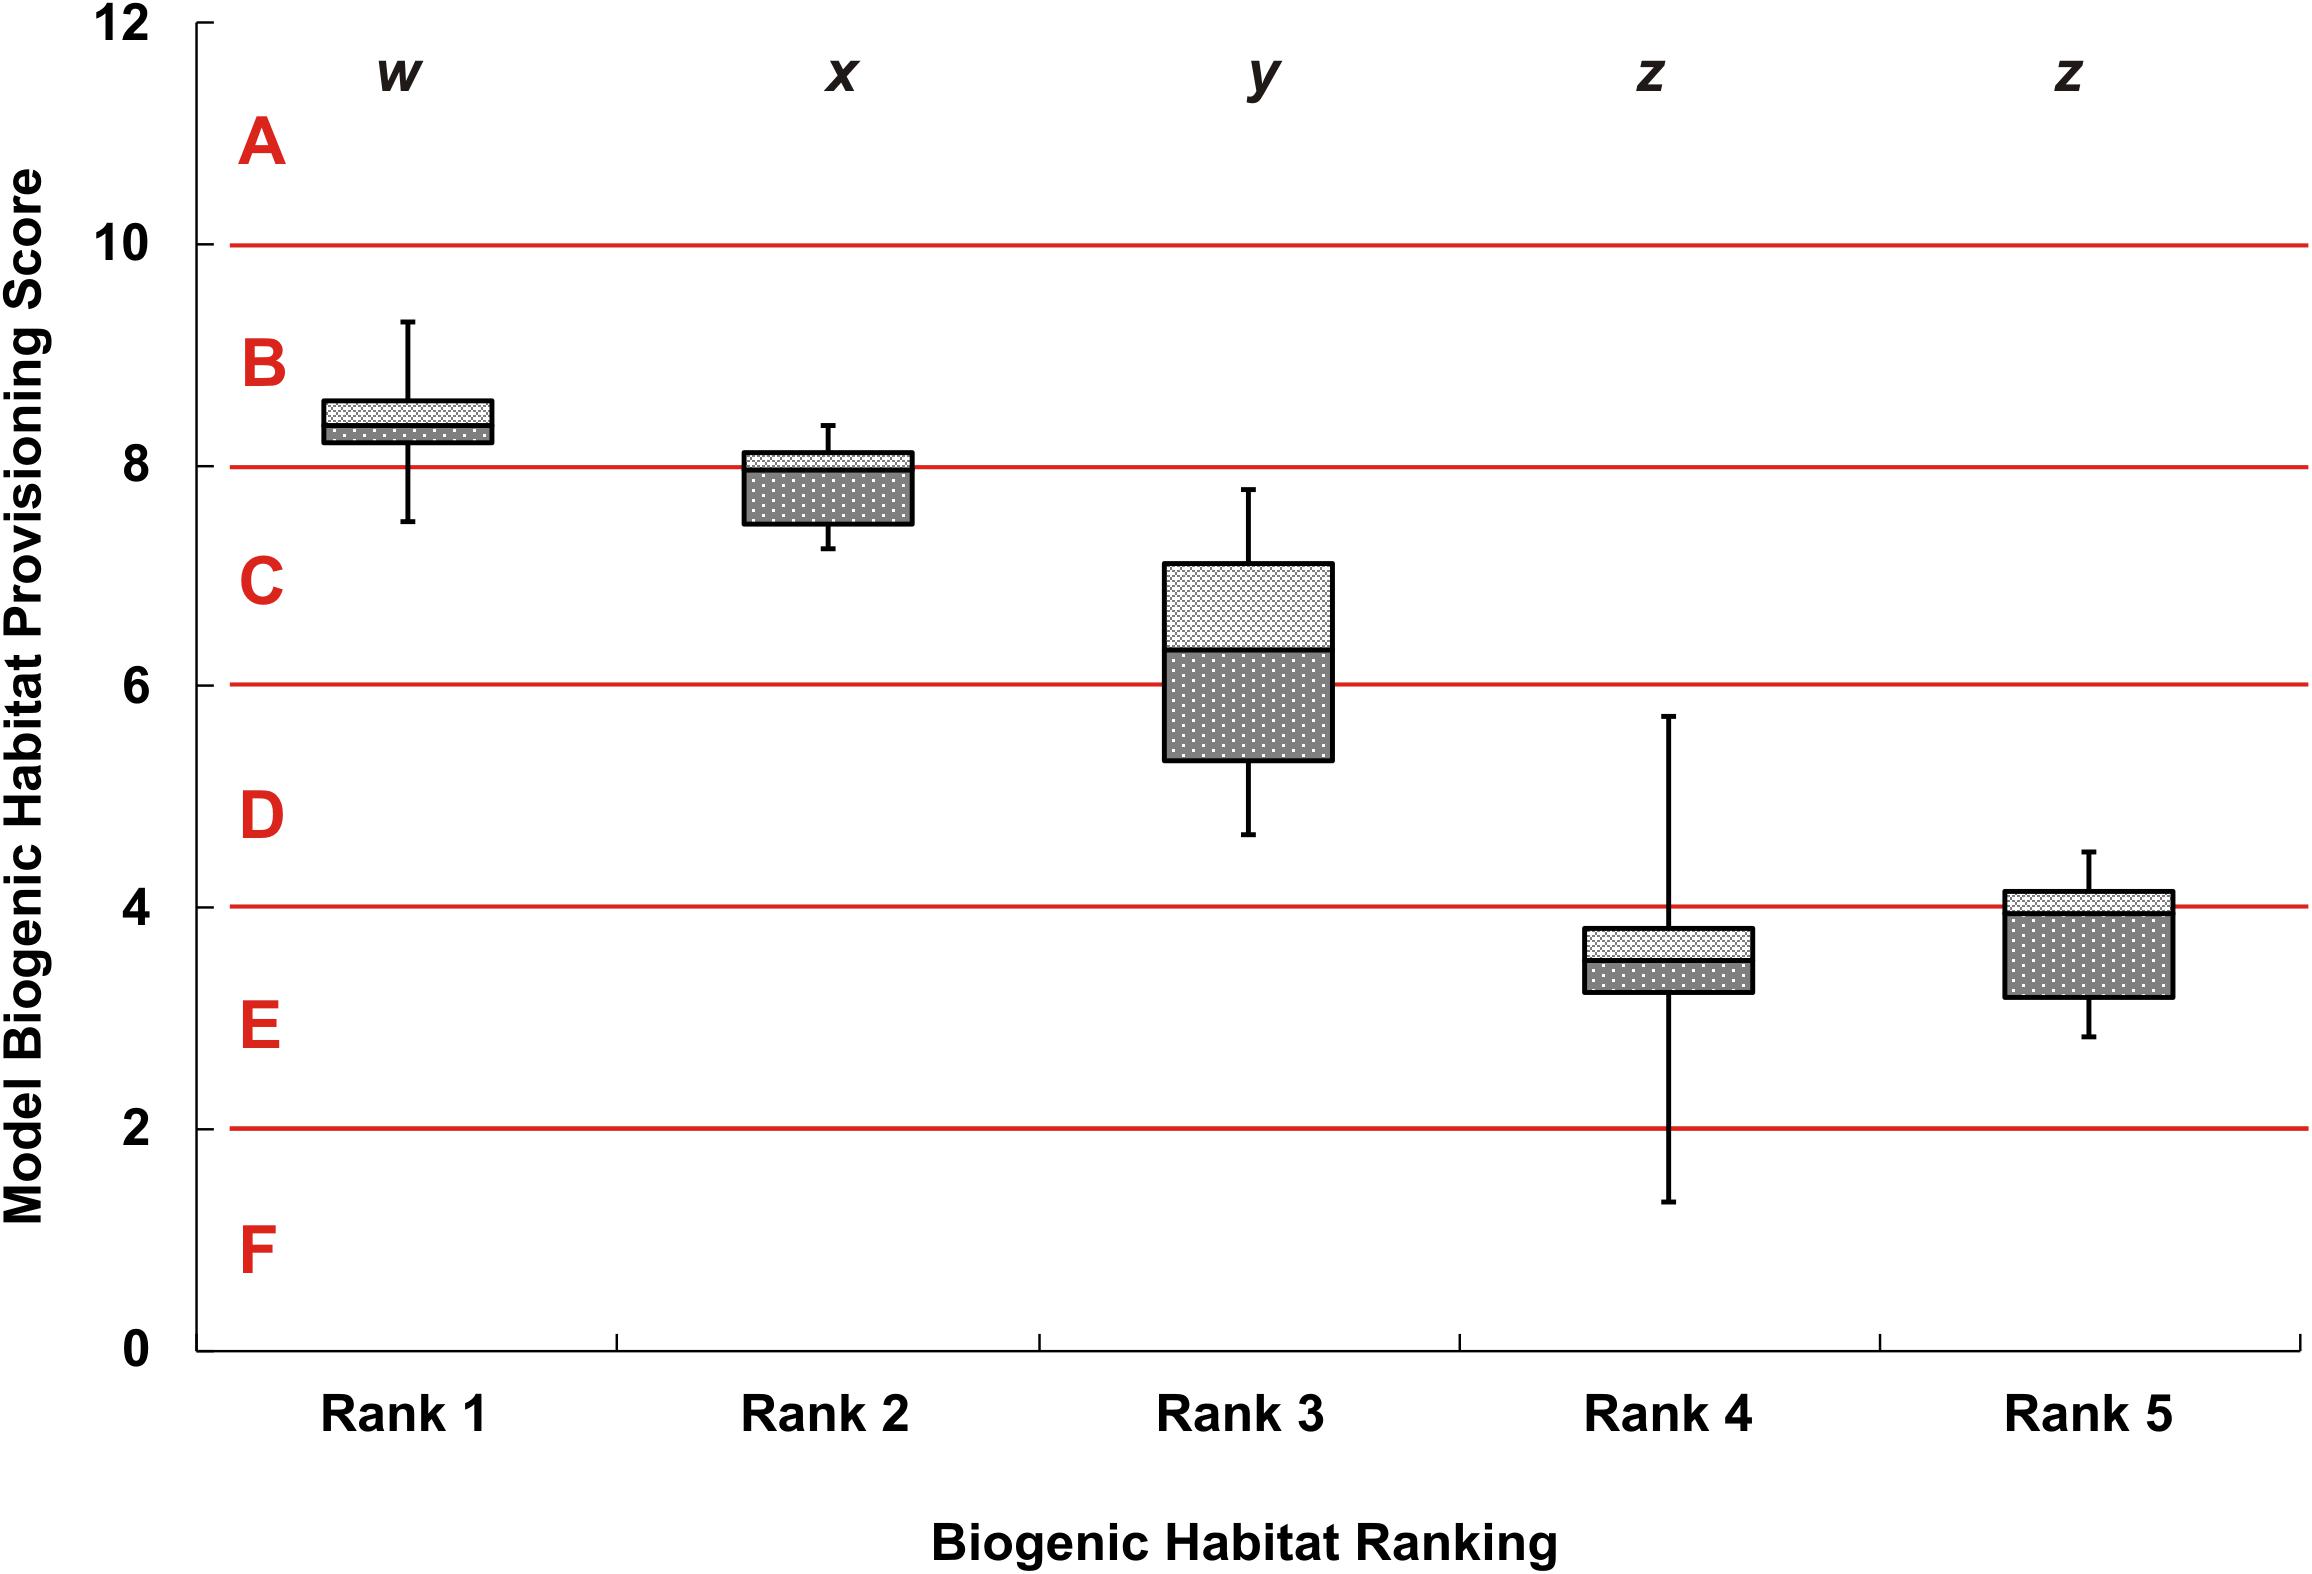
Figure 5. Box whisker plot of adjusted modeled biogenic habitat provisioning scores, separated by 5 ranks from video observations. The y-axis shows the numeric model scores with the alphabetized classes A–F. Error bars show the maximum and minimum biogenic habitat provisioning score for each video rank, dark-gray and light-gray boxes show the 25% and 75% quartiles respectively, away from the median line. Lowercase lettering at the top of the figure, w–z, indicates significant differences between rank classes based on the Dwass, Steel, and Critchlow—Fligner Method.
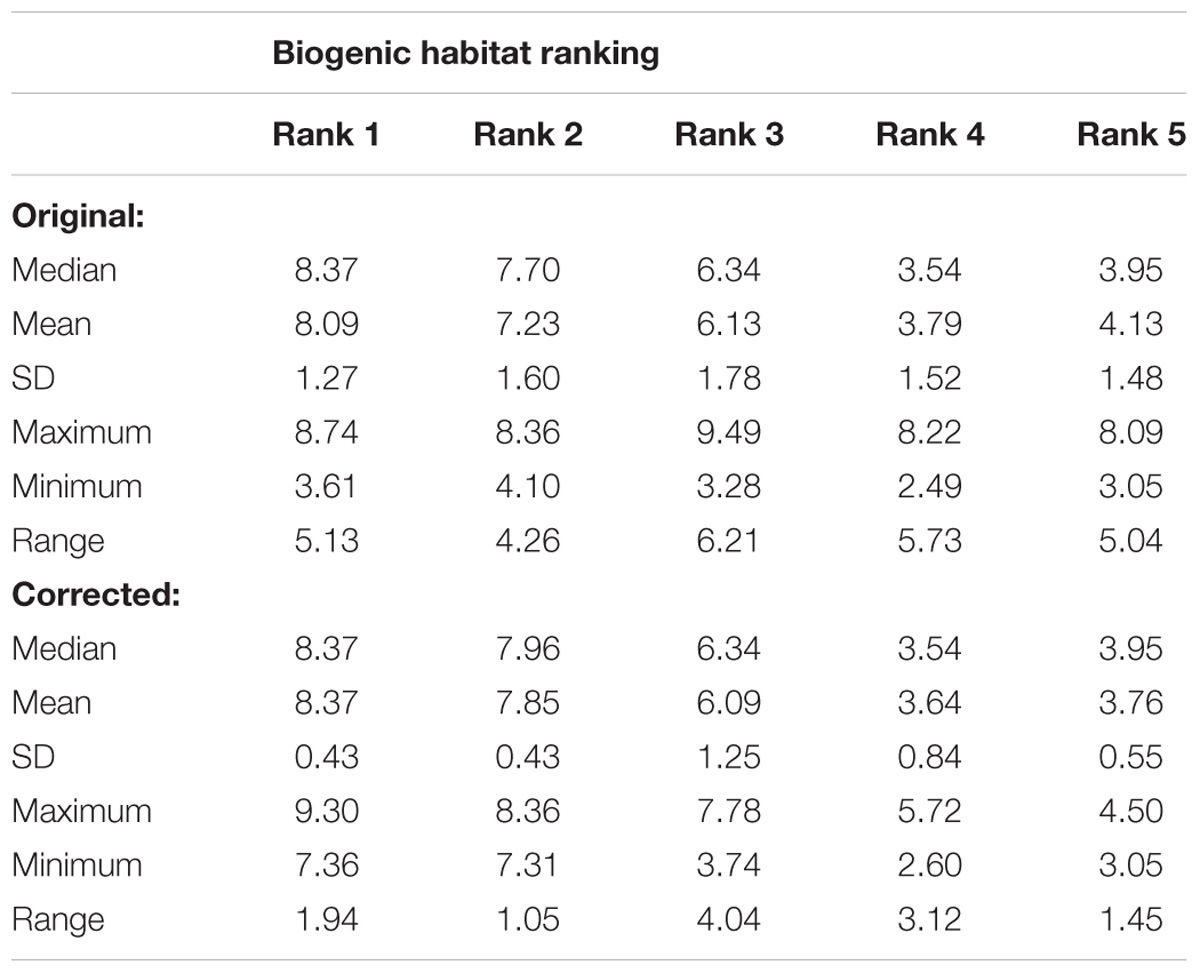
Table 2. Comparison of the variation in modeled biogenic habitat scores by rank group for original and corrected data.
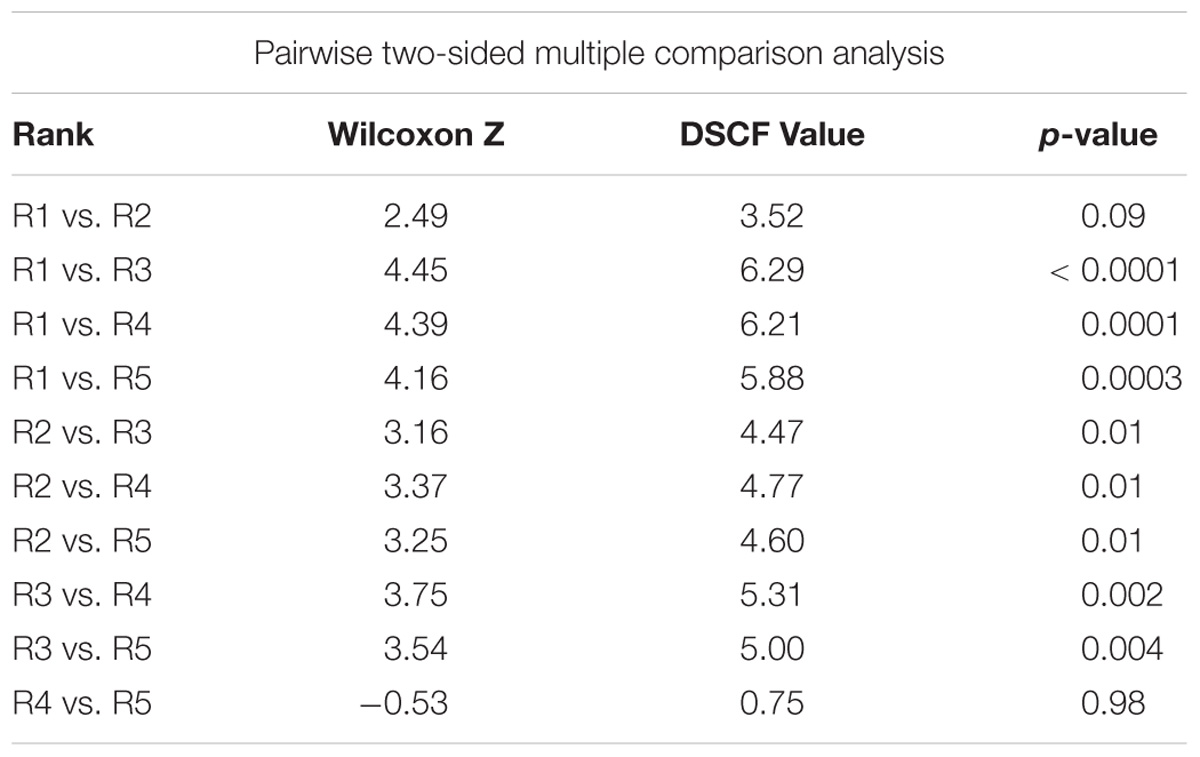
Table 3. Dwass, Steel, Critchlow-Fligner multiple comparison for model scores between biogenic habitat ranks (two-sided comparison) for corrected data.
Within Site Variability
At 47 of 56 sites, depth was recorded at both the start and end of the video transect. The median range in depth was 2.0 m, and 64% of sites had a depth range of 3.0 m or less. Eleven sites had a depth range greater than 10 m and five sites had a range >15 m in depth (11%) (Figure 6). Model scores were not adjusted at these sites, as the depth used in the calculation were within the range of depths measured.
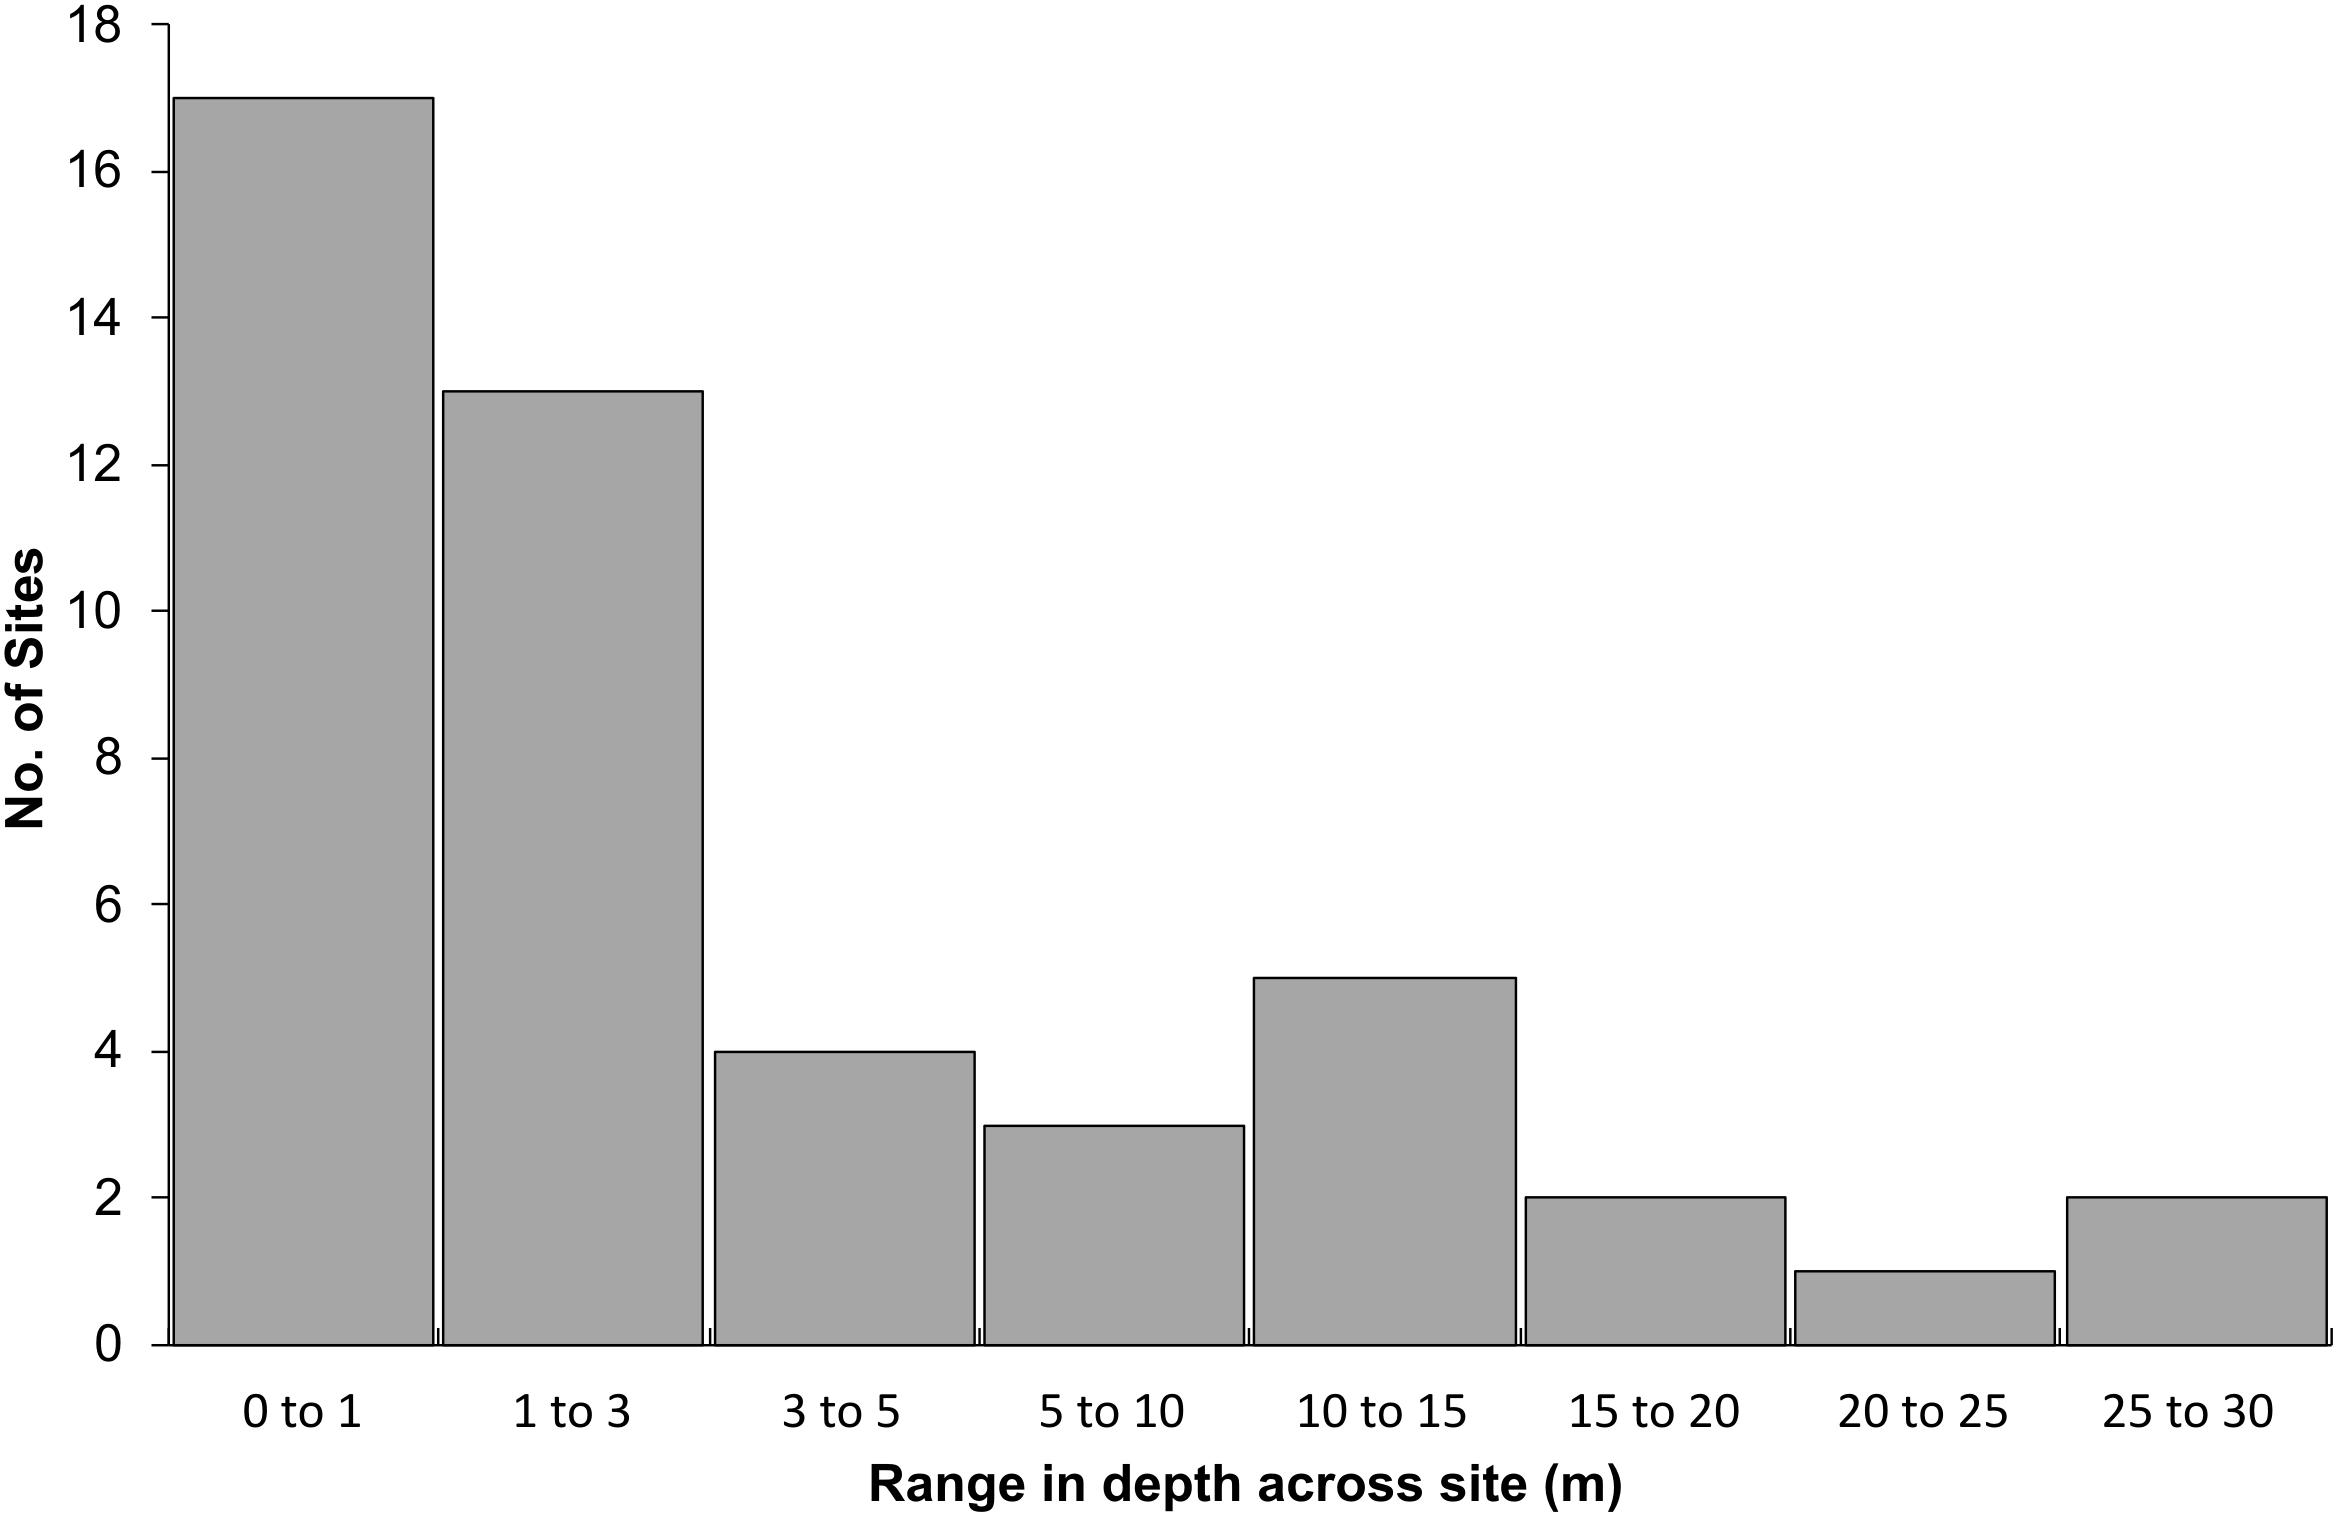
Figure 6. Range in depth from the start to the end of the 100 m transect for 47 of the 56 sites. For 9 of the 56 sites, only a single depth measurement was recorded.
Sites with large variation in depth typically started in shallow water, i.e., 5–10 m, transitioning into deeper water, i.e., 20–35 m. Rank 1 sites were shallow with a mean depth of 12 m and rank 2 sites deeper at 28 m. The lower ranked sites had mean depths between 35 and 38 m. Thirty-six sites (64%) were consistent in terms of habitat height complexity along the transects. Seven sites were heterogenous and 13 sites were classed as ‘split’; with a sharp transition between two distinct habitat types. Of these 13 sites, 10 occurred in the rank 1 group, which was the predominant transect type for this rank (67%). These sites consisted of rocky macroalgal habitats that dominated the majority of the transect but with sharp transitions into areas of sands or gravel. Rank 2 sites were dominated by heterogeneous transects (67%) and included multiple patches of rocky reef that were intermittently interrupted by sands and gravels. The Rank 4 and 5 sites were almost exclusively consistent in habitat height and complexity along their lengths (21 of 22 sites).
Discussion
The ability to map ecosystem services and to identify areas of high or low service potential is necessary for this concept to be of practical use in marine management. If this can be done at low cost and with modest data requirements the utility can be further enhanced and widely applied. Nevertheless, it is important that such methods maintain acceptable degrees of accuracy and that the context and limits of use are identified and communicated (Rykiel, 1996). Here we tested the performance of the Ecosystem Principles Approach for mapping an ecosystem service, assessing whether the score predictions of the model reflected differences in observed biogenic habitat structure. Sites with a ranking of 1 corresponded with areas predicted by the EPA to have the highest levels of biogenic habitat complexity (Figure 5) and these were typified by complex rocky reef communities and macroalgal forests dominated by Ecklonia radiata. This habitat generated vertical relief in the water-column, typically 1m or greater, and had the highest average model score (median of 8.37). Ecklonia radiata is a well-known foundation species that supports invertebrates, other algae and fish (Dayton, 1975; Irving et al., 2004; Coleman et al., 2007, 2013; Morrison et al., 2014; Lohrer et al., 2018). Sponge gardens that generated large and complex three-dimensional structure off the seabed also occurred at rank 1 sites. A study by Shears and Usmar (2006) on the west coast of Great Barrier Island recorded many of the sponges observed in the present study. These authors recorded 20 fish species in this habitat type, including the commercially important blue cod (Parapercis colias), tarakihi (Nemadactylus macropterus), and snapper (Pagrus auratus). In contrast, sites with a ranking of 5 corresponded with the areas predicted by the EPA to have the lowest levels of biogenic habitat complexity (median of 3.95) and these were generally represented by flat homogenous sediments (Figure 3). While subtidal sands and muds can contain moderate to high levels of infaunal diversity, there was minimal vertical relief and few taxa visible in the video collected. This type of habitat may be important feeding grounds for some species of demersal fish and invertebrates (Langlois et al., 2006), but it does not provide high relief refugia or habitat for juvenile life stages. Across all groups there was a strong correlation between empirical rankings and average model scores (R2 = 0.8). This demonstrated that simple approaches to mapping ecosystem services, that divide areas in to lower and higher service potential, can be built on foundations of ecological understanding.
While the approach was satisfactory overall, there were discrepancies between map predictions and empirical observations that are worthy of discussion. Most of the discrepancies were linked to errors in the underpinning environmental data. Even when the best available environmental data layers are used, there will invariably be areas where interpolation is necessary, resulting in differences between predicted and actual environmental characteristics. As with all models, the predictions of map scores are dependent on accurate environmental data inputs. Importantly, however, our analyses suggest that the methods we used to map this service, specifically the scoring and weighting of ecosystem principles and the linking of them to spatial biophysical data, were appropriate. Model performance was improved further after correcting erroneous input data (Table 3 and Figure 5). The bathymetry and sediment information used were the best available data, but there is scope to increase the quality of both these layers in the future. The collection of high-resolution sea-floor images and advanced bathymetric data analysis are leading to the production of fine detailed maps of the seafloor. For example, combining quantitative sediment sampling with Multibeam echo-sounding (MBES) surveys can be a cost-effective way of updating both bathymetry and mapping sediments. Lamarche et al. (2011) demonstrated how fully processed backscatter data from MBES surveys were used to characterize the sediment environment over 8500 km2 in the Cook Strait, New Zealand. MacDiarmid et al. (2013) noted that 855,000 km2 of seafloor habitat had already been swath-mapped, although this was still only a small proportion of New Zealand’s EEZ (∼15%). Hauraki Gulf sediment information is being iteratively improved over time as new point source information is collected and integrated. Improved computing power means that spatial interpolation procedures are more sophisticated and nuanced relative to historical methods used in earlier sediment charts (e.g., Gregory et al., 1994).
The number of different habitat types within each rank group gives insight into how the biogenic habitat service can be generated. There were only a few ways in which to generate either high or low levels of the biogenic habitat service. High map scores were underpinned by a combination of conditions favorable for sedentary, habitat forming flora and fauna. These included strong currents (Crisp, 1960; Richardson et al., 1980; Frechette and Bourget, 1985; Frechette et al., 1989) which supply food/nutrients and remove waste products (Gili and Coma, 1998; Wildish and Kristmanson, 2005), shallow waters that provide higher production (Cahoon, 1999), and hard substrates on which organisms can attach and extend up into the water column (Townsend et al., 2014); these were the conditions that favored macroalgal forests around Great Barrier Island. Similarly, low model scores had to be generated through specific conditions: soft sediments where a higher proportion of organisms are found living within the sediment matrix rather than emerging into the water column, weak currents that are less favorable for sedentary suspension feeding organisms, and intermediate depths (i.e., deep enough to limit production, but not deep enough to avoid disturbance driven down from surface wind and waves; Grace, 1983; Gage, 2001), Thus, the majority of low scoring sites were 35–38 m deep, wave-rippled sands (Figure 3). In contrast, areas with intermediate levels of biogenic structure (rank 3) contained a variety of different assemblages (bryozoan thickets, Atrina beds, tube worm habitats and mixed algal meadows) and had a broad depth range of 3.5–51 m. Thus, there was a range of permutations in which intermediate model scores could be obtained. The low number of habitats with high levels of biogenic habitat provisioning suggests complex spatial and scaling relationships in need of further investigation. Habitat diversity can be a driver of regional biodiversity and functional composition (Hewitt et al., 2008), suggesting that the absolute magnitudes of service provision may be less relevant at a regional scale.
An important caveat of the biogenic habitat map was the variability in habitat structure within the 200 m × 200 m model cells. Although 64% of sites demonstrated steady height and complexity in habitat characteristics along the video transects, this still meant that 36% of the sites visited were not consistent; instead displaying sharp transitions or heterogeneity across different habitat types. This large proportion is likely influenced by the inclusion of cells with high model scores, and thus the sampling of multiple shallow rocky reef sites. Great Barrier Island has an intricate rocky coastline (McLintock, 1966; Hayward, 1973) and these shallow rocky areas are rarely uniform at this scale. This highlights that the sediment type and depths used in the 200 m × 200 m cells are the predominant characteristics, respectively, but that they do not necessarily express the range of conditions found. This also suggests that if accurate baseline data could be collected a finer resolution it would be possible to improve the resolution of the ecosystem service maps. A second caveat is that the prediction of ecosystem services based on ecological principles will not include the impacts of specific anthropogenic activities on service provision unless they can be built into the model. This may be the cause of some of the discrepancies between the predicted service scores and the habitats observed during the survey. The use of destructive fishing practices causes broad-scale change to benthic communities, killing large species and damaging or removing emergent biogenic structures (Thrush et al., 1998; Turner et al., 1999; Thrush and Dayton, 2002; Handley et al., 2014; Paul, 2014). This could contribute to some of the variation in model scores for lower ranked sites, i.e., sites that have been given a low rank because they lack biogenic features that have been destroyed, yet are still predicted to provide higher levels of service.
Resource managers in New Zealand and abroad are increasingly interested in incorporating ecosystem services into decision making and marine spatial planning (White et al., 2012). Maps that indicate areas of high and low service delivery are an important tool that can be combined with other spatial information (e.g., maps of biodiversity, locations of vulnerable species, migratory routes, areas of high seafloor disturbance, proposed reserve sites) and fed into prioritization software to facilitate decision making. The development of tools such as the Ecosystem Principles Approach of Townsend et al. (2011, 2014) is enabling the construction of ecosystem service maps in data poor areas at scales not previously possible; increasing the likelihood of this information being considered in decision making. While simple tools have limitations and can be improved upon, they may still benefit environmental stewardship if decisions would otherwise occur in an absence of information. New Zealand has national and international obligations associated with biodiversity and ecosystem services such as the CBD strategic goals and Aichi biodiversity targets, but currently little means of measuring progress. Similarly, the biodiversity strategy of the European commission requires Member States to map and assess the state of ecosystems services in their national territories2 and stop biodiversity loss. New approaches that expand knowledge on the provision and distribution of ecosystem services across marine environment may help in these processes (e.g., Geange et al., 2016). Our methodology is not limited to the study area or the provision of biogenic habitat and can be utilized elsewhere and for other ecosystem services. Nevertheless, for any location and for any service to which this may be applied, it is imperative that maps are validated and that their limitations identified prior to use. The work undertaken here improves confidence in the biogenic structure maps developed by Townsend et al. (2014) and indicates the promise of the underlying methodology of combining ecologically oriented Ecosystem Principles with spatial data on physical habitat characteristics for other services also. The more services that can be mapped, the greater the chance that we can spatially manage our marine areas to maximize ecosystem service delivery potential to the benefit of the general public.
Author Contributions
MT contributed to the experimental design, data analysis, and write up. AL contributed to experimental design, data analysis, and write up and led the fieldwork.
Funding
This research was supported by NIWA (Coasts and Oceans Research Programme 5, SCI 2017/18) and Sustainable Seas National Science Challenge Project 2.1.3 (Measuring Ecosystem Services and Assessing Impacts).
Conflict of Interest Statement
The authors declare that the research was conducted in the absence of any commercial or financial relationships that could be construed as a potential conflict of interest.
Acknowledgments
We thank Rod Budd, Sam Knowlson, and Scott Edhouse for assistance with the field surveying and Hazel Needham for comments on the draft manuscript. We also thank Ngāti Rehua Ngāti wai ki Aotea Trust for their support during our work.
Footnotes
References
Beaumont, N. J., Austen, M. C., Atkins, J. P., Burdon, D., Degraer, S., Dentinho, T. P., et al. (2007). Identification, definition and quantification of goods and services provided by marine biodiversity: implications for the ecosystem approach. Mar. Pollut. Bull. 54, 253–265. doi: 10.1016/j.marpolbul.2006.12.003
Böhnke-Henrichs, A., Baulcomb, C., Koss, R., Hussain, S. S., and de Groot, R. S. (2013). Typology and indicators of ecosystem services for marine spatial planning and management. J. Environ. Manage. 130, 135–145. doi: 10.1016/j.jenvman.2013.08.027
Breitburg, D. L., and Riedel, G. F. (2005). “Multiple stressors in marine systems,” in Marine Conservation Biology, eds E. A. Norse and L. B. Crowder (Washington, DC: Island Press), 416–431.
Byrnes, J., Stachowicz, J. J., Hultgren, K. M., Hughes, A. R., Olyarnik, S. V., and Thornber, C. S. (2006). Predator diversity strengthens trophic cascades in kelp forests by modifying herbivore behaviour. Ecol. Lett. 9, 61–71.
Cahoon, L. B. (1999). The role of benthic microalgae in neritic ecosystems. Oceanogr. Mar. Biol. Annu. Rev. 37, 47–86.
Coleman, M. A., Feng, M., Roughan, M., Cetina-Heredia, P., and Connell, S. D. (2013). Temperate shelf water dispersal by Australian boundary currents: Implications for population connectivity. Limnol. Ocean Fluid Environ. 3, 295–309. doi: 10.1215/21573689-2409306
Coleman, M. A., Vytopil, E., Goodsell, P. J., Gillanders, B. M., and Connell, S. D. (2007). Diversity and depth-related patterns of mobile invertebrates associated with kelp forests. Mar. Freshw. Res. 58, 589–595. doi: 10.1071/MF06216
Crain, C. M., Kroeker, K., and Halpern, B. S. (2008). Interactive and cumulative effects of multiple human stressors in marine systems. Ecol. Lett. 11, 1304–1315. doi: 10.1111/j.1461-0248.2008.01253.x
Crisp, D. J. (1960). Factors influencing growth-rate in Balanus balanoides. J. Anim. Ecol. 29, 95–116. doi: 10.2307/2273
Critchlow, D. E., and Fligner, M. A. (1991). On distribution-free multiple comparisons in the one-way analysis of variance. Commun. Stat. Theory Methods 20, 127–139. doi: 10.1080/03610929108830487
Daily, G. C. (ed.) (1997). Nature’s Services: Societal Dependence on Natural Ecosystems. Washington, DC: Island Press.
Daily, G. C., Soderqvist, T., Aniyar, S., and Arrow, K. (2000). The value of nature and the nature of value. Science 289, 395–396. doi: 10.1126/science.289.5478.395
Dayton, P. K. (1975). Experimental evaluation of ecological dominance in a rocky intertidal algal community. Ecol. Monogr. 45, 137–159. doi: 10.2307/1942404
de Groot, R. S. (1992). Functions of Nature, Evaluation in Environmental Planning, Management and Decision Making. Groningen: Wolters-Noordhoff.
De Jonge, N., Pinto, R., and Turner, R. K. (2012). Integrating ecological, economic, and social aspects to generate useful management information under the EU Directives’ ‘ecosystem approach’. Ocean Coast Manage. 68, 169–188. doi: 10.1016/j.ocecoaman.2012.05.017
Drakou, E. G., Pendleton, L., Effron, M., Ingram, J. C., and Teneva, L. (2017). When ecosystems and their services are not co-located: oceans and coasts. ICES J. Mar. Sci. 74, 1531–1539. doi: 10.1093/icesjms/fsx026
Frechette, M., and Bourget, E. (1985). Energy flow between the pelagic and benthic zones: factors controlling particulate organic matter available to an intertidal mussel bed. Can. J. Fish Aquat. Sci. 42, 1158–1165. doi: 10.1139/f85-143
Frechette, M., Butman, C. A., and Geyer, W. R. (1989). The importance of boundary-layer flows in supplying phytoplankton to the benthic suspension feeder. Mytilus edulis. L. Liminol. Oceanogr. 34, 19–36. doi: 10.4319/lo.1989.34.1.0019
Gage, J. D. (2001). Deep-sea benthic community and environmental impact assessment at the Atlantic Frontier. Cont. Shelf Res. 21, 957–986. doi: 10.1016/S0278-4343(00)00120-5
Geange, S., Townsend, M., Clark, D., Ellis, J. I., and Lohrer, A. M. (2016). Communicating the value of marine conservation using an ecosystem service matrix approach. Ecosyst. Serv. 35, 150–163. doi: 10.1016/j.ecoser.2018.12.004
Gili, J. M., and Coma, R. (1998). Benthic suspension feeders: their paramount role in littoral marine food webs. Trends Ecol. Evol. 13, 316–321. doi: 10.1016/S0169-5347(98)01365-2
Grace, R. V. (1983). B Zonation of sublittoral rocky bottom marine life and its changes from the outer to the inner Hauraki Gulf, North-Eastern New Zealand. Tane 29, 97–108.
Gregory, M. R., Blackmore, N. A., Glasby, G. P., and Burrows, N. W. (1994). Manukau and Waitemata harbour sediments, New Zealand Oceanography Institute chart. Miscellaneous Ser. 70:75000.
Handley, S. J., Willis, T. J., Cole, R. G., Bradley, A., Cairney, D. J., Brown, S. N., et al. (2014). The importance of benchmarking habitat structure and composition for understanding the extent of fishing impacts in soft sediment ecosystems. J. Sea Res. 86, 58–68. doi: 10.1016/j.seares.2013.11.005
Hayward, B. W. (1973). A note on the geology of the coastline west of Whangaparapara. Great Barrier Island. Tane 19, 175–179.
Heck, K. L., and Crowder, L. B. (1991). “Habitat structure and predator ± prey interactions in vegetated aquatic systems,” in Habitat Structure ± the Physical Arrangement of Objects in Space, eds S. S. Bell, E. D. McCoy, and H. R. Mushinsky (London: Chapman & Hall), 281–299.
Hewitt, J. E., Thrush, S. F., and Dayton, P. D. (2008). Habitat variation, species diversity and ecological functioning in a marine system. J. Exp. Mar. Biol. Ecol. 366, 116–122. doi: 10.1016/j.jembe.2008.07.016
Irving, A. D., Connell, S. D., and Gillanders, B. M. (2004). Local complexity in patterns of canopy-benthos associations produce regional patterns across temperate Australasia. Mar. Biol. 144, 361–368. doi: 10.1007/s00227-003-1202-9
Kamenos, N. A., Moore, P. G., and Hall-Spencer, J. M. (2004). Maerl grounds provide both refuge and high growth potential for juvenile queen scallops (Aequipecten opercularis L.). J. Exp. Mar. Biol. Ecol. 313, 241–254. doi: 10.1016/j.jembe.2004.08.007
Lamarche, G., Lurton, X., Verdier, A. L., and Jean-Marie Augustin, J. M. (2011). Quantitative characterisation of seafloor substrate and Bedforms using advanced processing of multibeam backscatter—application to cook strait, New Zealand. Cont. Shelf Res. 31, S93–S109. doi: 10.1016/j.csr.2010.06.001
Langlois, T. J., Anderson, M. J., Babcock, R. C., and Kato, S. (2006). Marine reserves demonstrate trophic interactions across habitats. Oecologia 147, 134–140. doi: 10.1007/s00442-005-0148-7
Lester, S. E., Costello, C., Halpern, B. S., Gaines, S. D., White, C., and Barth, J. A. (2013). Evaluating tradeoffs among ecosystem services to inform marine spatial planning. Mar. Policy 38, 80–89. doi: 10.1016/j.marpol.2012.05.022
Lohrer, A. M., McCartain, L., Buckthought, D., MacDonald, I., and Parsons, D. (2018). Benthic structure and pelagic food sources determine post–settlement snapper (Chrysophrys auratus) abundance. Front. Mar. Sci. 5:427. doi: 10.3389/fmars.2018.00427
MacDiarmid, A. B., Law, C. S., Pinkerton, M., and Zeldis, J. (2013). “New Zealand marine ecosystem services,” in Ecosystem services in New Zealand: Conditions and Trends, ed. J. R. Dymond (Lincoln: Manaaki Whenua Press).
MacIntyre, H. L., Geider, R. J., and Miller, D. C. (1996). Microphytobenthos: the ecological role of the “secret garden” of unvegetated, shallow-water marine habitats. I. Distribution, abundance and primary production. Estuaries 19, 186–201. doi: 10.2307/1352224
Manighetti, B., and Carter, L. (1999). Across-shelf sediment dispersal, Hauraki Gulf, New Zealand. Mar. Geol. 160, 271–300. doi: 10.1016/S0025-3227(99)00024-9
Millenium Ecosystem Assessment [MEA] (2005). Ecosystems and Human Well-Being: Synthesis. Washington, DC: Island Press.
Miller, R. J., Hocevar, J., Stone, R. P., and Fedorov, D. V. (2012). Structure-forming corals and sponges and their use as fish habitat in bering sea submarine canyons. PLoS One 7:e33885. doi: 10.1371/journal.pone.0033885
Morrison, M. A., Jones, E., Consalvey, M., and Berkenbusch, K. (2014). Linking marine fisheries species to biogenic habitats in New Zealand: a review and synthesis of knowledge. N. Z. Aquat. Environ. Biodivers. Rep. 130:156.
Paul, L. J. (2014). “History of, and trends in, the commercial landings of finfish from the Hauraki Gulf, 1850-2006,” in New Zealand Aquatic Environment and Biodiversity Report No. 124, Wellington: Ministry for Primary Industries.
Perkins-Visser, E., Wolcott, T. G., and Wolcott, D. L. (1996). Nursery role of seagrass beds: enhanced growth of juvenile blue crabs (Callinectes sapidus Rathbun). J. Exp. Mar. Biol. Ecol. 198, 155–173. doi: 10.1016/0022-0981(96)00014-7
Richardson, C. A., Crisp, D. J., and Runham, N. W. (1980). Factors influencing shell growth in Cerastoderma edule. Proc. R. Soc. Lond. B Biol. Sci. 210, 513–531. doi: 10.1007/s00436-009-1545-3
Roberts, C. M., McClean, C. J., Veron, J. E. N., Hawkins, J. P., Allen, G. R., and McAllister, D. E. (2002). Marine biodiversity hotspots and conservation priorities for tropical reefs. Science 295, 1280–1284. doi: 10.1126/science.1067728
Roberts, L. I. N., Ward, C., and Francis, M. P. (1986). Fishes of northeastern great barrier Island. N. Z. J. R. Soc. N. Z. 16, 357–362. doi: 10.1080/03036758.1986.10416814
Rykiel, E. J. (1996). Testing ecological models: the meaning of validation. Ecol. Model. 90, 229–244. doi: 10.1016/0304-3800(95)00152-2
Shears, N. T., and Usmar, N. R. (2006). The Role of the Hauraki Gulf Cable Protection Zone in Protecting Exploited Fish Species: de Facto Marine Reserve? DOC Research & Development Series 253. Wellington: Department of Conservation.
Sundbäck, K., Miles, A., Hulth, S., Pihl, L., Engström, P., Selander, E., et al. (2003). Importance of benthic nutrient regeneration during initiation of macroalgal blooms in shallow bays. Mar. Ecol. Prog. Ser. 246, 115–126. doi: 10.3354/meps246115
Thrush, S. F., and Dayton, P. K. (2002). Disturbance to marine benthic habitats by trawling and dredging: implications for marine biodiversity. Annu. Rev. Ecol. Syst. 33, 449–473. doi: 10.1146/annurev.ecolsys.33.010802.150515
Thrush, S. F., Hewitt, J. E., Cummings, V. J., Dayton, P. K., Cryer, M., Turner, S. J., et al. (1998). Disturbance of the marine benthic habitat by commercial fishing: impacts at the scale of the fishery. Ecol. App. 8, 866–879. doi: 10.1890/1051-0761(1998)008[0866:DOTMBH]2.0.CO;2
Townsend, M., Davies, K., Hanley, N., Hewitt, J. E., Lundquist, C. J., and Lohrer, A. M. (2018). The challenge of implementing the marine ecosystem service concept. Front. Mar. Sci. 5:359. doi: 10.3389/fmars.2018.00359
Townsend, M., Thrush, S. F., and Carbines, M. J. (2011). Simplifying the complex: an ‘Ecosystem Principles Approach’ to goods and services management in marine coastal ecosystems. Mar. Ecol. Prog. Ser. 434, 291–301. doi: 10.3354/meps09118
Townsend, M., Thrush, S. F., Lohrer, A. M., Hewitt, J. E., Lundquist, C. J., Carbines, M., et al. (2014). Overcoming the challenges of data scarcity in mapping marine ecosystem service potential. Ecosyst. Serv. 8, 44–55. doi: 10.1016/j.ecoser.2014.02.002
Turner, S. J., Thrush, S. F., Hewitt, J. E., Cummings, V. J., and Funnell, G. (1999). Fishing impacts and the degradation or loss of habitat structure. Fish Manage. Ecol. 6, 401–420. doi: 10.1046/j.1365-2400.1999.00167.x
White, C., Halpern, B. S., and Kappel, C. V. (2012). Ecosystem service tradeoff analysis reveals the value of marine spatial planning for multiple ocean users. Proc. Natl. Acad. Sci. U.S.A. 109, 4696–4701. doi: 10.1073/pnas.1114215109
Keywords: mapping, biogenic habitat, fisheries, refugia, nursery grounds, model validation
Citation: Townsend M and Lohrer AM (2019) Empirical Validation of an Ecosystem Service Map Developed From Ecological Principles and Biophysical Parameters. Front. Mar. Sci. 6:21. doi: 10.3389/fmars.2019.00021
Received: 26 September 2018; Accepted: 15 January 2019;
Published: 07 February 2019.
Edited by:
Lyne Morissette, M – Expertise Marine, CanadaReviewed by:
Christian T. K. -H. Stadtlander, Independent Researcher, Saint Paul, MN, United StatesAndrew M. Fischer, University of Tasmania, Australia
Copyright © 2019 Townsend and Lohrer. This is an open-access article distributed under the terms of the Creative Commons Attribution License (CC BY). The use, distribution or reproduction in other forums is permitted, provided the original author(s) and the copyright owner(s) are credited and that the original publication in this journal is cited, in accordance with accepted academic practice. No use, distribution or reproduction is permitted which does not comply with these terms.
*Correspondence: Michael Townsend, TWljaGFlbC5Ub3duc2VuZEB3YWlrYXRvcmVnaW9uLmdvdnQubno= orcid.org/0000-0003-4365-2810
†Present address: Michael Townsend, Waikato Regional Council, Hamilton, New Zealand
 Michael Townsend
 Andrew M. Lohrer