 Hanna Heidemann
 Joachim Ribbe
- 1Centre for Applied Climate Sciences, University of Southern Queensland, Toowoomba, QLD, Australia
- 2Faculty of Health, Engineering and Sciences, School of Agricultural, Computational and Environmental Sciences, University of Southern Queensland, Toowoomba, QLD, Australia
In this paper, we investigate the occurrence and spatial variability of marine heat waves (MHWs) off the southeast coast of Queensland, Australia. The focus is on identifying sea surface temperature (SST) variability in two key ecological hotspots located south of the Australian Great Barrier Reef. This coastal region is bordered in the east by the intensification zone of the East Australian Current (EAC). It includes Hervey Bay, which is part of a UNESCO declared marine biosphere and the Southeast Fraser Island Upwelling System. The analysis of remotely sensed SST for the period 1993 to 2016 identifies the largest number of MHW days for Hervey Bay with a mean length of 12 days. The maximum length of 64 days occurred during the austral summer 2005/2006. The years with the largest number of MHW days was found to occur following the El Niño events in 1998, 2010, and 2016. A cross-correlation and Empirical Orthogonal Function analysis identified a significant correlation with a time lag of 7 months between SST anomalies in the Niño 3.4 region and the southeast Queensland coast. 78% of variance in SST anomalies is explained by the first mode of variability. The strength of the relationship with El Niño was spatially variable and the weakest in Hervey Bay. Due to its sheltered location and shallowness, it is argued that local weather patterns and air-sea fluxes influence this area more than the other two regions, where remotely forced changes in oceanic heat advection may have a stronger impact on generating MHWs. Biodiverse coastal shelf ecosystems are already under tremendous pressure due to human activities. This is likely to be compounded by continued climatic change and an increasing number of MHWs. Thus, similar studies are encouraged for other regional shelfs and smaller scale coastal systems.
Introduction
Climatic extreme events such as marine heat waves (MHWs), cold spells, floods, and storms can strongly effect marine ecosystems (Hobday et al., 2016). These events alter species distributions as well as ecosystem structures and functioning (Wernberg et al., 2013). Due to a changing climate, terrestrial heat waves and severe rainfall events are likely to increase in intensity and frequency in the future (Coumou and Rahmstorf, 2012). The same has been found for MHWs (Frölicher et al., 2018). Marine ecological impacts of extreme events are much less well understood than on land, but MHWs have shown to significantly affect marine communities (Frölicher and Laufkötter, 2018) and can have severe economic consequences for fisheries (Mills et al., 2017). The El Niño Southern Oscillation (ENSO), which is the most significant global climate anomaly on an inter-annual time scale (Timmermann et al., 2018), is one of the drivers of sea surface temperature (SST) extremes such as MHWs (Oliver et al., 2018a) and cold spells (Salinger et al., 2016). SST variability due to ENSO has been shown to globally impact on ecosystem structures on various spatial scales. This includes the oceans surrounding Australia (Pearce and Feng, 2013; Sprogis et al., 2017; Arias-Ortiz et al., 2018; Benthuysen et al., 2018; Stuart-Smith et al., 2018), the Peruvian Upwelling Ecosystem (Quispe-Ccalluari et al., 2018), the Gulf of California (García-Morales et al., 2017) and the northeastern Arabian Sea (Vidya and Kurian, 2018).
Large scale anomalous warming of the Australian coastal ocean has been observed as a consequence of ENSO influenced SST variability for the World Heritage Great Barrier Reef (GBR, Redondo-Rodriguez et al., 2012; Hughes et al., 2017; McGowan and Theobald, 2017; Benthuysen et al., 2018; Stuart-Smith et al., 2018), the Leeuwin Current (Holbrook et al., 2009; Feng et al., 2013), the East Australian Current (EAC) (Holbrook et al., 2009), and the Tasman Sea (Oliver et al., 2017). In regards to the GBR, the relation between El Niño/La Niña and summer SST anomalies is spatially variable and the strongest in the south of the reef over a 60 years study period (Redondo-Rodriguez et al., 2012). It appears that ENSO generally has a larger impact on SST variability along the west than the east coast of Australia, however, this impact increases toward the Coral Sea in the northeast (Holbrook et al., 2009). In the GBR region, coral bleaching was enhanced by specific local El Niño associated weather patterns. These were dominated by reduced cloud coverage during most previously reported bleaching events in 1983, 1987, 1992, 1993, 1998, 2010, and 2016 (McGowan and Theobald, 2017). The 1997/1998 El Niño caused global coral bleaching (Hoegh-Guldberg, 1999). This was followed by GBR mass coral bleaching events during 2002 and again in 2016 due to a MHW influenced by the 2015/2016 El Niño. The bleaching event had the largest spatial extent (Hughes et al., 2017), leading to severe ecosystem disturbances (Stuart-Smith et al., 2018). The last event occurred in 2017 (Great Barrier Reef Marine Park Authority, 2016). In this study, we refer to ENSO as detected in SST variability through advective processes, but discuss the role of changes in local air-sea heat fluxes as potential MHW drivers too, with both processes being the drivers of MHWs (Oliver et al., 2017).
Extreme SST anomalies (SSTa) occurred off Western Australia in 2011 and were found to be driven by a moderate to strong 2010–2011 La Niña event. This was associated with a strengthening of the Leeuwin Current transporting anomalous warm waters southwards (Feng et al., 2013). Local atmospheric heating enhanced the current driven warming resulting in maximum SSTa of more than 3°C (Rose et al., 2012). The event had severe ecological impacts by increasing fish and invertebrate mortality, triggering a southward shift of tropical species (Pearce and Feng, 2013) and coral bleaching (Feng et al., 2013). Kelp forests north of 29°S, which have a temperature threshold of 2.5°C above the summer climatology, have not recovered from this event and have instead been replaced by turf forming seaweeds (Wernberg et al., 2016).
Along Tasmania’s coast, the strongest MHW occurred in 2015/2016. It lasted for 251 days and reached 2.9°C above average, taking place during the strongest El Niño on record (Oliver et al., 2017). Its cause was mainly oceanic heat advection through the anomalous intense poleward flow of the EAC (Oliver et al., 2018b), on which ENSO had a weak impact and which very likely was only possible due to climate change driven ocean warming (Oliver et al., 2017). The EAC is the western boundary current of the South Pacific subtropical gyre. MHWs linked to ENSO are superimposed on the documented long-term warming trend, which for the EAC region is estimated by Shears and Bowen (2017) to be in the order of 0.1–0.2°C per decade. Anomalous ocean currents and anomalous warm air temperatures are the main triggers of MHWs (Schlegel et al., 2017).
Recent studies identify and examine MHWs in different parts of Australia. However, no study focuses on the area just south of the GBR, where two key ecological hotspots are located. Hervey Bay is one of the most biodiverse marine environments in Australia and a UNESCO world heritage designated biosphere (Ribbe, 2014). Further south, the Southeast Queensland Marine Coastal Zone (SEQMCZ) is a key area for biodiversity as well as for fisheries which is driven by the Southeast Fraser Upwelling System (Ward et al., 2003; Brieva et al., 2015). Therefore, we aim to identify the occurrence and timing of MHWs in these small scale ecological hotspots and discuss potential physical drivers and their ecological impacts. To do so, we analyze remotely sensed SST and the relationship with El Niño events in our study area off southeast Queensland, Australia (Figure 1), between 1993 and 2016. The region is located between about 24° and 28° S, and the eastern border is located at 155° E. It comprises Hervey Bay (Ribbe, 2014), the SEQMCZ (Brieva et al., 2015), and the intensification zone of the EAC (Ridgway and Dunn, 2003). We contrast MHW occurrences and ENSO influences in Hervey Bay to those in the other two key regions. The study expands on Gräwe et al. (2010), who focused on the link between ENSO and local rainfall and flooding events in Hervey Bay. We identify MHWs from SSTa, calculate their metrics and statistics according to Hobday et al. (2016) and apply the Hobday et al. (2018) categorization to identify and discuss key events for each of the regions. In addition, we conduct an Empirical Orthogonal Function analysis and cross-correlation analysis to investigate the influence of ENSO on MHWs.
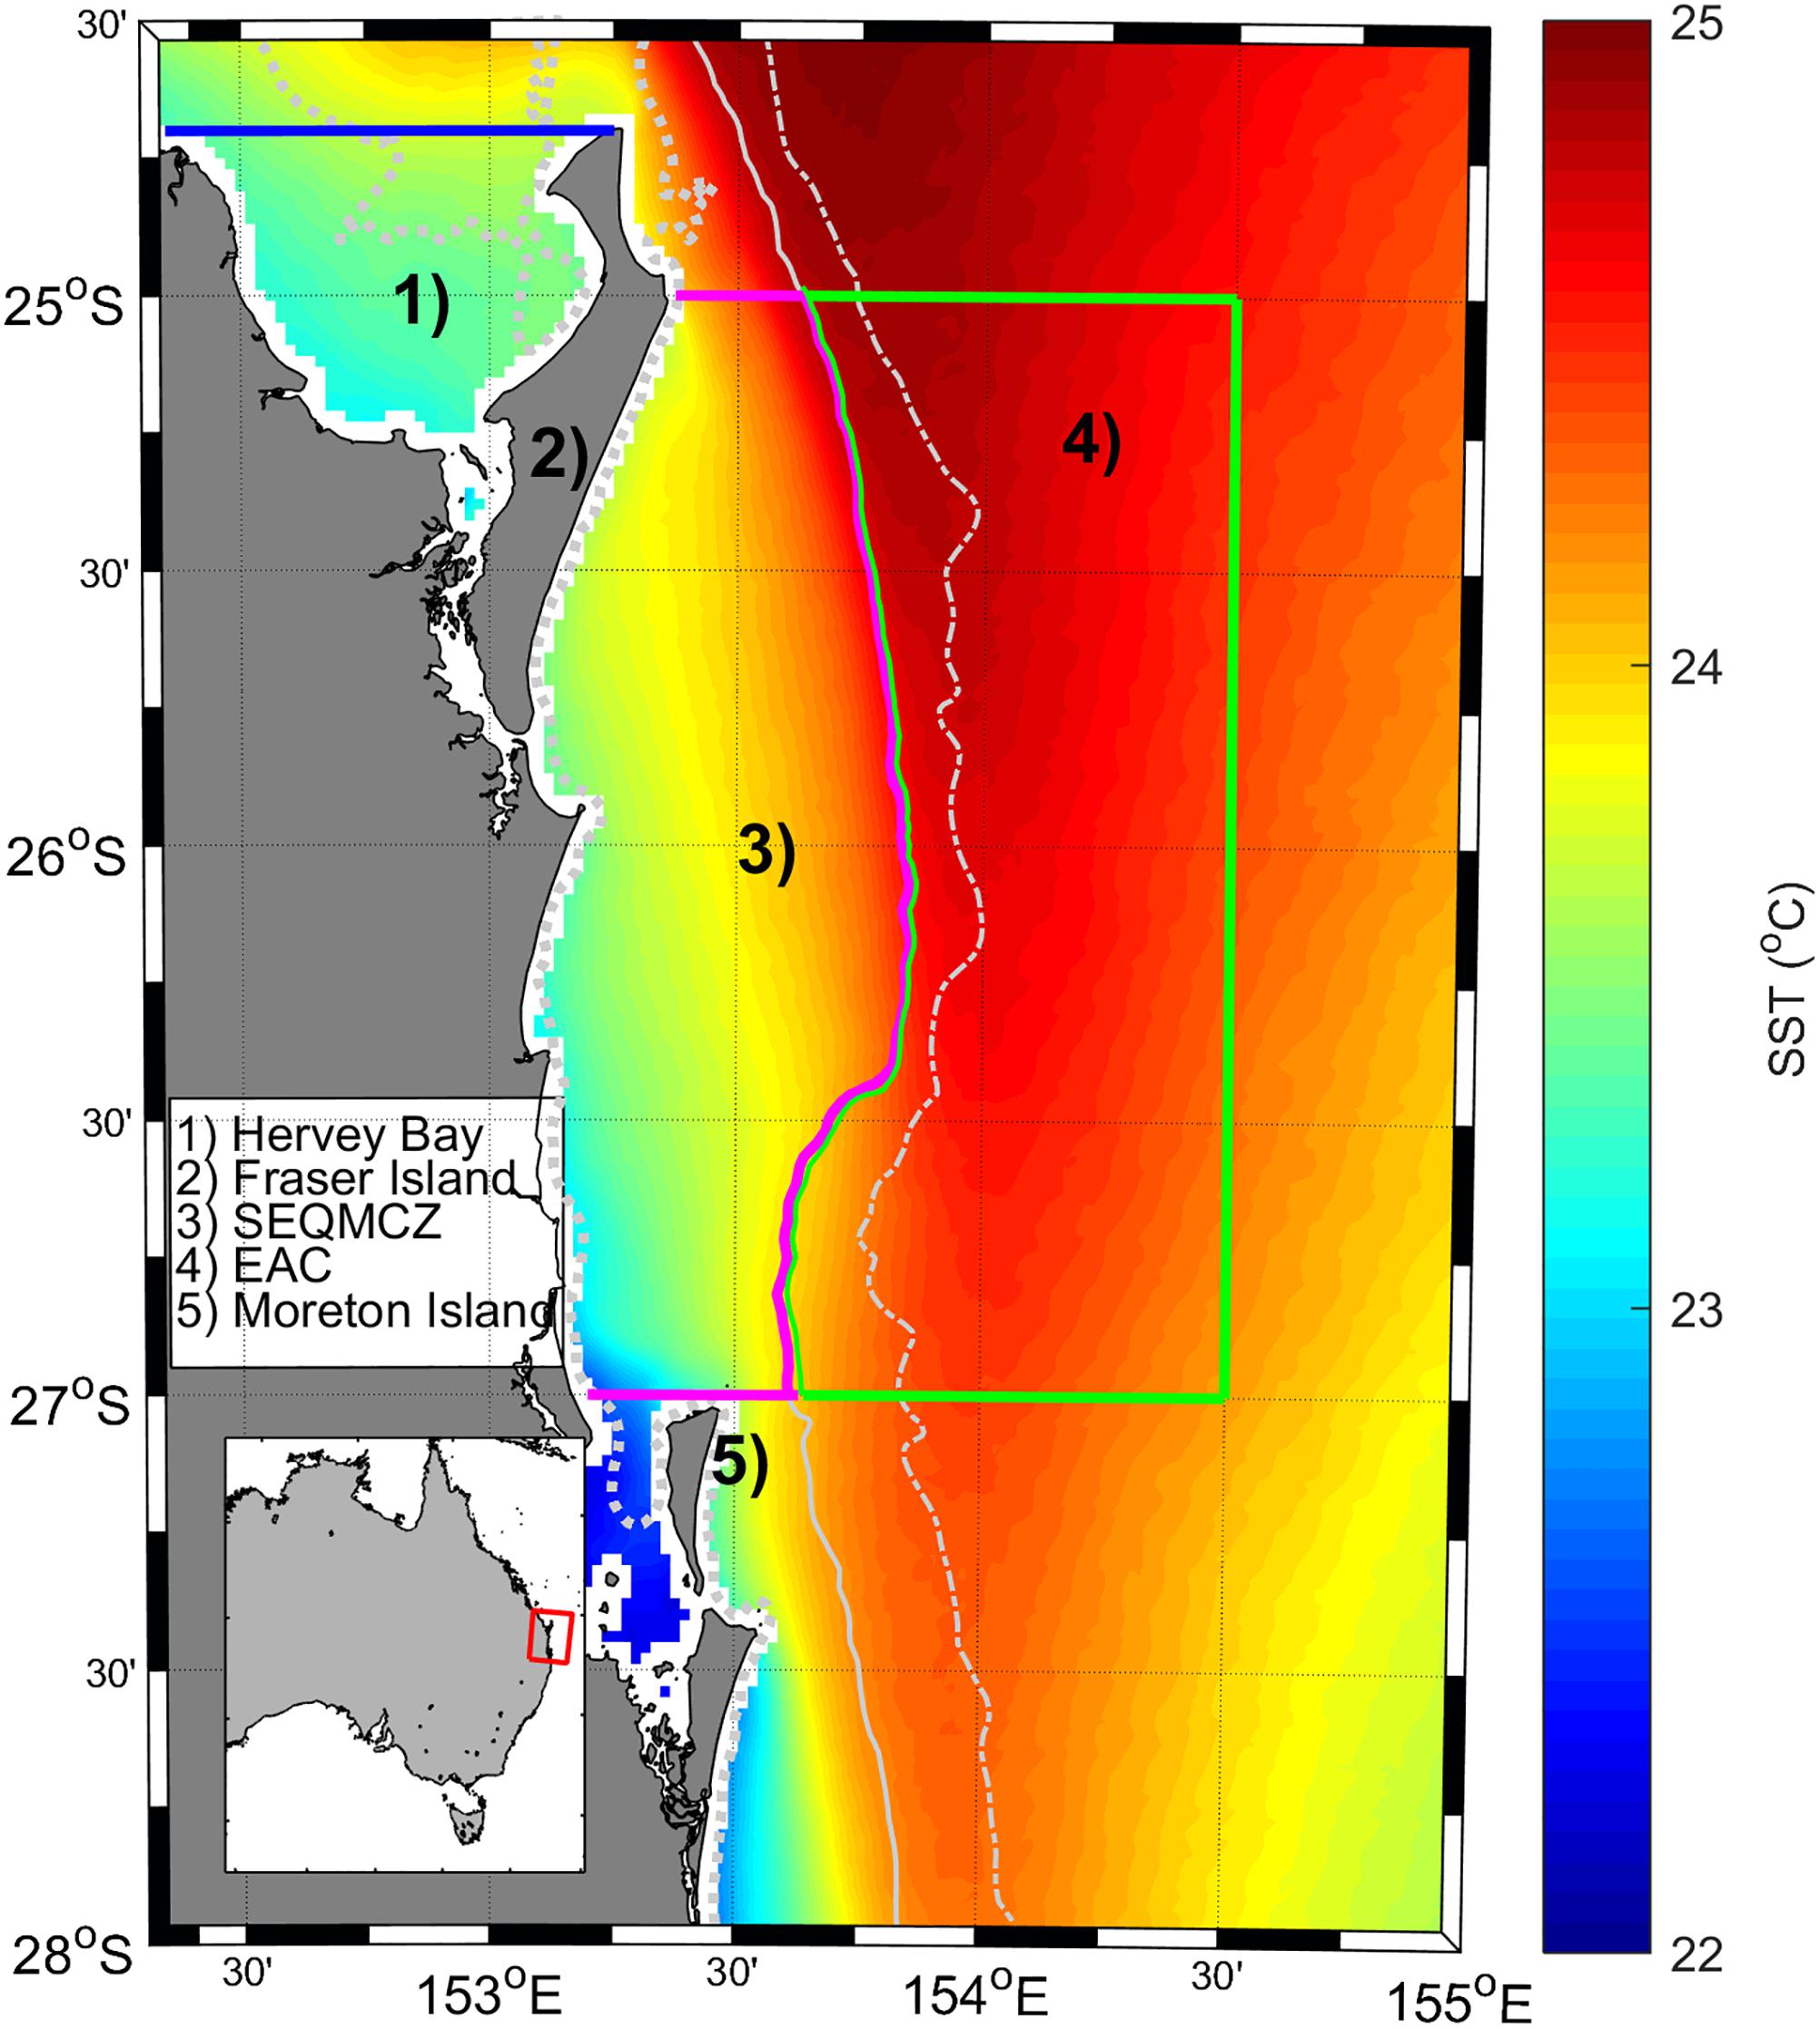
Figure 1. Map of the study site off southeast Queensland, Australia, with 20 m (dotted), 150 m (dashed), and 1,000 m (solid) isobaths indicated. Shading represents the mean SST for the years 1993 to 2016. The blue line restrains the area representing Hervey Bay at 24.7° S (1). The area marked in pink represents the SEQMCZ (3). Green lines show the boundaries of the area used to represent the EAC influenced off shelf region (4).
Hervey Bay covers an area of about 4000 km2 and is located south of the GBR (Figure 1). The climate of the region is subtropical with a mean near surface air temperature between about 17 and 26°C, high evaporation and low rainfall (Ribbe, 2014). Terrestrial runoff is generally low (Ribbe, 2014) but large inflow can occur due to local weather extremes and as result of strong ENSO (La Niña) driven floods (e.g., Gräwe et al., 2010). Hervey Bay is recognized for its marine biodiversity and is part of a UNESCO listed biosphere. The largest sea grass meadows at the east Australian coast are found here (Sheppard et al., 2007), which are home to significant populations of dugongs and marine turtles (e.g., Brodie and Pearson, 2016). The dominant seagrass is Halodule uninvervis, which covers 81% of the seagrass pasture (Sheppard et al., 2007). Hervey Bay is also a resting place for thousands of humpback whales that annually migrate between the tropical Pacific Ocean and the Southern Ocean (Forestell et al., 2011; Franklin et al., 2018).
The SEQMCZ covers the continental shelf south off Fraser Island (Figure 1). It is one of eight key ecological hotspots along the east Australian coast and known for its marine biodiversity. It is important to fisheries and as spawning area for many temperate fish species and has a high diversity of pelagic fish (Ward et al., 2003; Young et al., 2011; Dambacher et al., 2012). Important physical oceanographic processes that drive the marine biodiversity of the region include the SEQMCZ spanning wind-driven Fraser Gyre (Azis Ismail et al., 2017), the Southeast Fraser Island Upwelling System (Brieva et al., 2015), and cyclonig frontal eddies (Ribbe et al., 2018). The SEQMCZ’s eastern boundary is the intensification zone of the EAC (Ridgway and Dunn, 2003), which is the region of the EAC we identified and examined in this study (Figure 1). The EAC transports warm Coral Sea water southward along Australia’s east coast (Suthers et al., 2011) and approaches the continental shelf just to the south of Fraser Island. The shape of the continental shelf influences its flow direction. In the area off southeast Queensland, the EAC intensifies (Suthers et al., 2011) and shows maxima in surface current velocities and water volume transported (Ridgway and Dunn, 2003). The interaction of the EAC with the shelf-break drives seasonal upwelling onto the shelf (Brieva et al., 2015) and constitutes the eastern branch of the shelf-occupying Fraser Gyre (Azis Ismail et al., 2017).
In this study, we document that the largest number of MHW days occurred following medium to strong El Niño events. In addition, we identify a significant, time-lagged relationship between ENSO, as detected in ocean temperature variability, and inter-annual SST variability, which is the strongest in the SEQMCZ and the weakest in Hervey Bay. In Hervey Bay, the total number of MHW days between 1993 and 2016 was the largest. MHWs lasted up to 64 days and reached the highest mean (1.3°C) and maximum intensities (4.2°C) in comparison to the other two areas.
Data and Methods
Sea Surface Temperature (SST)
Daily sea surface temperatures (SST) were obtained from the Advanced Very High Resolution Radiometer (AVHRR) on a spatial resolution of 0.02° × 0.02° for the period January 1993 to December 2016. The data are day and night composites that show a 24 h average SST for every grid cell (IMOS, 2017) and were used previously in studies of the Southeast Fraser Upwelling System (Brieva et al., 2015) and the Fraser Gyre (Azis Ismail et al., 2017).
The climatology and the threshold values (90th percentile) were calculated for each day of the year, using an 11-day window centered on each specific date. A 30-day moving average was then applied to generate a smooth climatology and threshold time series, following the methodology of Hobday et al. (2016) to detect MHWs.
Daily SSTa were computed by subtracting the climatology from the corresponding daily SST. This was performed for the whole region as well as each individual region of interest, which are displayed in Figure 1. Daily SSTa were averaged to monthly SSTa as well. The data were spatially averaged over each single region (Hervey Bay, SEQMCZ, EAC, shown in Figure 1) to generate a time series of monthly SST for each separate region. A 3-months moving average of monthly SSTa was computed for the study region to remove short-term variability. This data are used to examine interannual SSTa variability between 1993 and 2016 (Figure 2).
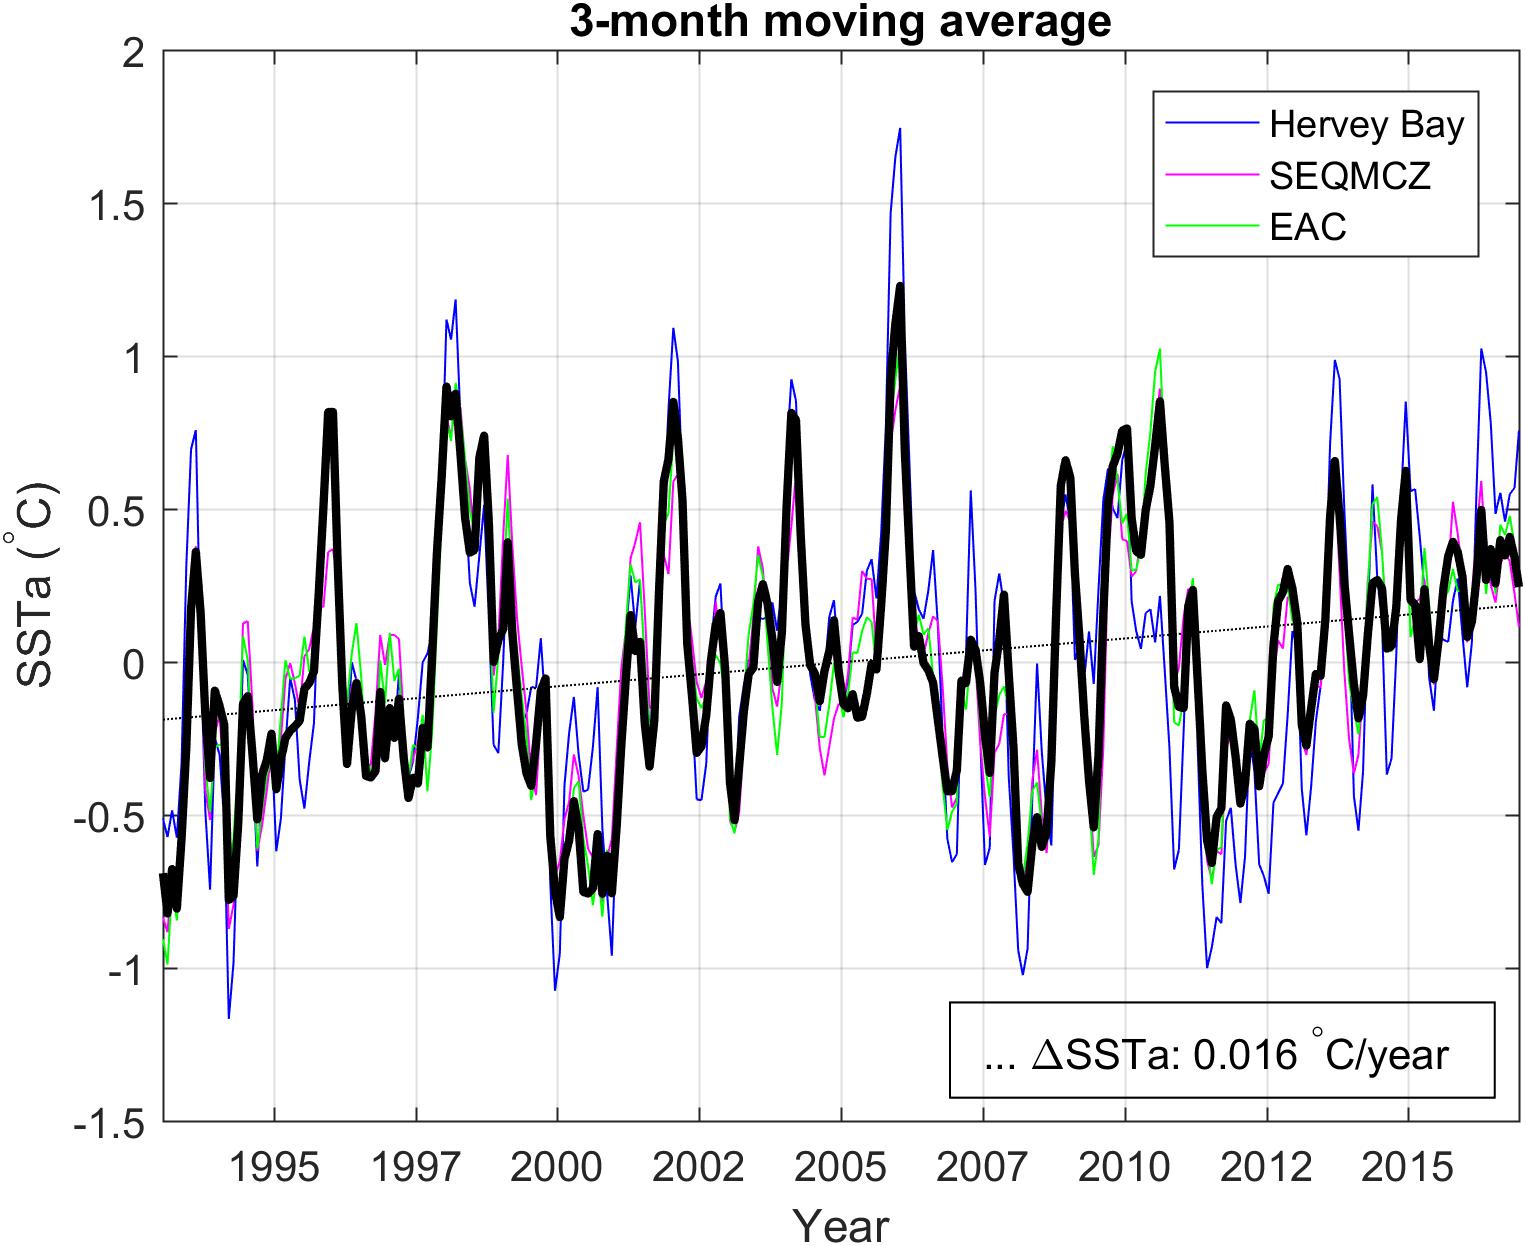
Figure 2. Monthly SSTa (°C) using a 3-month moving average. The solid black line represents an average over the whole geographical area shown in Figure 1. Blue, pink, and green lines represent SSTa for Hervey Bay, SEQMCZ, and EAC, respectively. The dotted line indicates the linear trend of regional warming.
A linear regression was applied to monthly SSTa of the entire area using a least-squares fit to determine the SST warming trend over the entire period.
Marine Heat Waves (MHW)
Marine Heat Waves (MHWs) were defined as prolonged, discrete and anomalous warm water events, following the approach by Hobday et al. (2016). The metrics to characterize each event were calculated from daily SST data, using the criteria and methodology introduced by Hobday et al. (2016). The climatology was calculated as an 11-day centered average for each day of the year for 24 years of remotely sensed data (1993–2016). For a smooth climatology, a 30-day moving average was applied, as recommended by Hobday et al. (2016). Leap years in the climatology were accounted for by interpolating the climatological value for the 29th February when calculating SST anomalies during a leap year. Using the same methods, the seasonally varying 90th percentiles were computed. These were the threshold values that defined MHWs. Subtracting the climatology from the daily SST an anomaly time series was obtained. Following Hobday et al. (2016), a MHW event had a specific start and end time and took place, when the seasonally varying threshold was exceeded for at least 5 consecutive days. Two events, which had a gap of less than 3 days were counted as one MHW event. To examine the properties of each MHW, the duration, maximum, mean and cumulative intensity for each event were calculated. In addition, yearly statistics were calculated including number of MHW, mean intensity, mean duration and total number of MHW days per year. The metrics were obtained for all three regions of interest (Hervey Bay, SEQMCZ, and EAC region) separately to compare spatial differences. Trends in frequency, MHW intensity, MHW days per year and average MHW duration from 1993 to 2016 were calculated as well, however, have to be interpreted with moderation due to the short time series. The MHW analysis was implemented in Matlab.
Empirical Orthogonal Function Analysis
Using detrended and deseasoned SSTa, Empirical Orthogonal Function (EOF) Analysis was conducted. This gives an indication of the spatial and temporal SSTa variability (Redondo-Rodriguez et al., 2012). To examine temporal patterns, principal components were computed, while the maps of EOFs provided information about spatial patterns (Oliver et al., 2018b). The amount of variance, which could be explained by each mode of variability, was determined. The three first modes of variability and its principal components (pc1, pc2, and pc3) were considered.
Oceanic Niño Index (ONI) and ENSO Classification
The Oceanic Niño Index (ONI)1 is used as a measure for ENSO variability (NOAA, 2017). The ONI is a 3-month running mean of the monthly Extended Reconstructed Sea Surface Temperature (ERSSTv4) anomalies for the Niño 3.4 region located at the equatorial Pacific Ocean (5° N to 5° S and 120° to 170°W) with a base period of 1986–2015 (NOAA, 2017). Monthly SSTa for Hervey Bay, the SEQMCZ and the EAC were used for a comparison to the ONI.
The ONI indicates periods of El Niño and La Niña events and their strength with SSTa above or below a threshold of +0.8 or -0.8°C. The equatorial SSTa is compared with SSTa along the Australian east coast to examine the influence of ENSO events in our regions of interest. In this study, we use the Australian Bureau of Meteorology’s El Niño and La Niña categorization (BOM, 2017a,b). The strongest El Niño events according to the BOM criteria occurred in 1997 to 1998, 2009 to 2010 and 2015 to 2016, while the strongest La Niña events were recorded during the periods 1998 to 2001, 2007 to 2008, and 2010 to 2012.
Monthly ERSSTv5 anomalies2 for the Niño 3 region (5° N to 5° S and 90° to 150°W), located east of and overlapping with the Niño 3.4 region and for the Niño 4 region (5° N to 5° S and 150°E to 150°W), which overlaps with the Niño 3.4 region toward the west (NOAA, 2018), were considered as well. Their base period was 1981–2010 (NOAA, 2018) and a 3-months running mean was taken to make them comparable to the ONI. These data aid our discussion of the spatial relationship of SSTa in the study region to El Niño.
Air Temperature
Daily maximum air temperature data from the Maryborough weather station were provided by the Australian Bureau of Meteorology from 1993 to 2016 (BOM, 2018; station number: 040126). Monthly averages and temperature anomalies were calculated as a deviation from the monthly mean air temperature. Data are not shown but inform the discussion of local processes contributing to SST variations.
Correlations
Pearson’s correlation coefficients (R) between SSTa and the ONI, as well as 3 months running averaged SSTa from the Niño 3 and the Niño 4 region, were determined. Cross-correlating monthly SSTa and these Indices determined the maximum lag between the variables. The maximum lag was used to align both datasets before performing the lag correlation. The resulting correlation coefficient represents a time-lagged correlation of both variables. P-values were applied as a measure of statistical significance to the results and a correlation defined as significant when p < 0.05. In addition, cross -correlation has been conducted for the first principal component, determined by EOF analysis, and the most widely used Index (ONI).
Results
SST at the Southeast Queensland Coast
The climatological SST averaged for the period 1993–2016 shows spatial differences off the southeast Queensland coast (Figure 1) which characterizes the three distinct regions considered further in this analysis. The off shelf region of the EAC intensification zone is warmer than the on shelf regions of the SEQMCZ and Hervey Bay, since the EAC advects warm subtropical Coral Sea surface water southward. Highest SST are found in the north with about 25°C. Further south, surface water is cooler and the maximum SST distribution appears to align with the 150 m isobaths reflecting the shelf-hugging intensification zone of the EAC. On-shelf SST within Hervey Bay and the SEQMCZ is much lower than within the EAC, which is consistent with findings by Wijffels et al. (2018), and lowest (∼22.18°C) in the southern region of the SEQMCZ. The climatology was used to compute all anomalies discussed further.
The time series of the 3-months running spatially averaged SSTa shows distinct interannual variability for all three regions as well as the underlying warming trend computed across the whole domain (Figure 2). This underlying warming trend is 0.016°C per year, which agrees with the warming trend for the EAC region, as previously found by Shears and Bowen (2017). Anomalous SST, negative as well as positive, were the strongest in Hervey Bay (Figure 2).
MHWs Characteristics
Hervey Bay was the region impacted the most by MHWs. A total of 746 MHW days were identified during the 24 years period (Table 1). This compares to 673 and 655 days in the SEQMCZ and EAC region, respectively. On average, a MHW lasted longer in Hervey Bay than in the other areas, and had a mean duration of 12 days, in contrast to 10 days in the SEQMCZ and the EAC. As a consequence, Hervey Bay had the smallest number of MHW (61 MHWs), however, the largest number of MHW days. The mean intensity of a MHW was with 1.3°C the largest in Hervey Bay as well. In the SEQMCZ, 65 MHWs and in the EAC 63 MHWs were detected and a mean MHW intensity of 1.1°C. The maximum intensities during a MHW reached SSTa of 4.15°C in Hervey Bay on the 26.10.2001, 2.88°C in the SEQMCZ (3.10.1999) and 3.87°C in the EAC (26.10.2001).
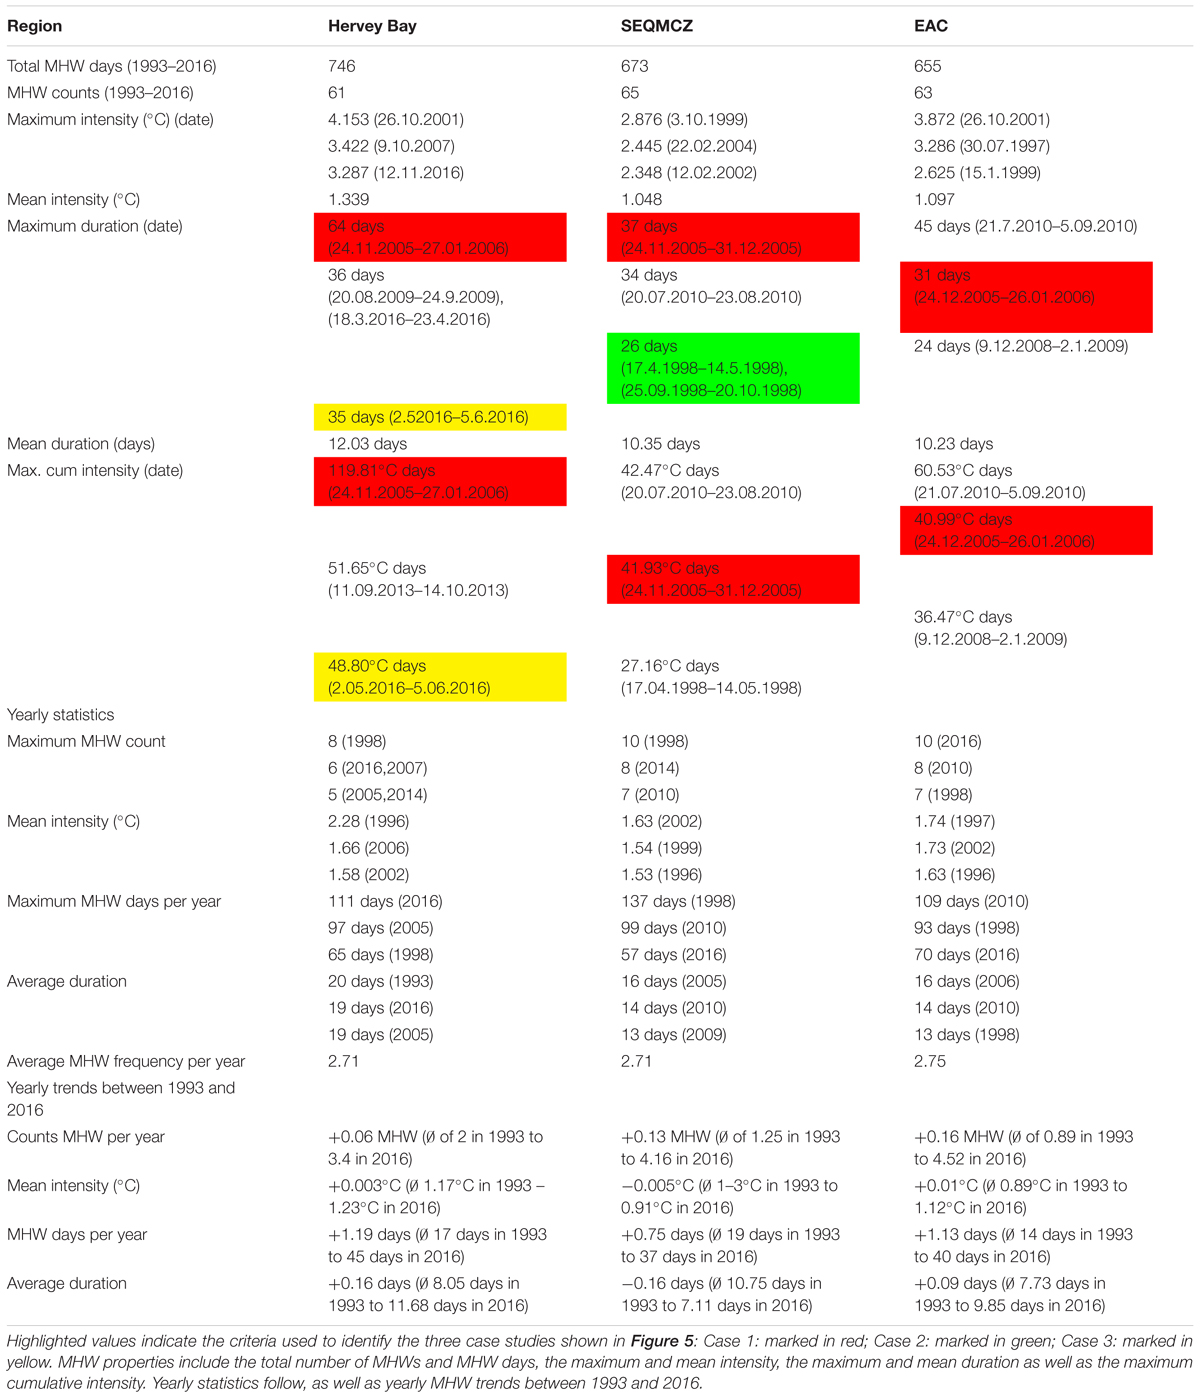
Table 1. Summary of MHW event properties and metrics, divided into Hervey Bay, SEQMCZ and EAC.
The longest MHW lasted for 64 days (24.11.2005–27.01.2006) in Hervey Bay, 37 days (24.11.2005–31.12.2005) in the SEQMCZ and 45 days (21.7.2010–5.09.2010) in the EAC. The maximum cumulative intensity occurred in Hervey Bay as well and was with 120°C days (24.11.2005–27.1.2006) at least double as high as in the other areas. In comparison, the maximum was 43°C days (20.07.2010–23.08.2010) in the SEQMCZ and 61°C days (21.07.2010–5.09.2010) in the EAC.
Yearly statistics, as displayed in Figure 3 and Table 1, show that in Hervey Bay, the largest number of MHWs per year occurred in 1998 with 8 MHWs, followed by 2007 and 2016 (6 MHWs) and 5 MHWs in 2005 and 2014. In the SEQMCZ the maximum amount took place in 1998 (10 MHWs), 2014 (8 MHWs) and 2010 (7 MHWs). In the EAC there were 10 MHWs in 2016, followed by 8 MHWs in 2010 and 7 in 1998. In Hervey Bay, the maximum number of MHW days per year were 111 days in 2016, 97 days in 2005 and 65 days in 1998. In the SEQMCZ, the largest number of MHW days per year were 137 days in 1998, 99 days in 2010 and 57 days in 2016. In the EAC, the maximum was 109 days in 2010, 93 days in 1998 and 70 days in 2016. The years, in which on average MHWs lasted the longest in Hervey Bay were 1993 (20 days), 2005 and 2016 (19 days). In the SEQMCZ, the year with the longest average duration was 2005 (16 days), followed by 2010 (14 days). In the EAC, the maximum average duration occurred in 2006 (16 days) and 2010 (14 days). Between 1993 and 2016, the average frequency of MHWs was 3 MHW per year in all three regions (Table 1 and Figure 3). In Hervey Bay, there were 3 years, in which no MHWs occurred. These years were 1994, 2000, and 2012. In the SEQMCZ, no MHWs occurred in 2 years, 2000 and 2012 In the EAC region, there were no MHWs in 1993, 1994, 2000, and 2007 (Figure 3).
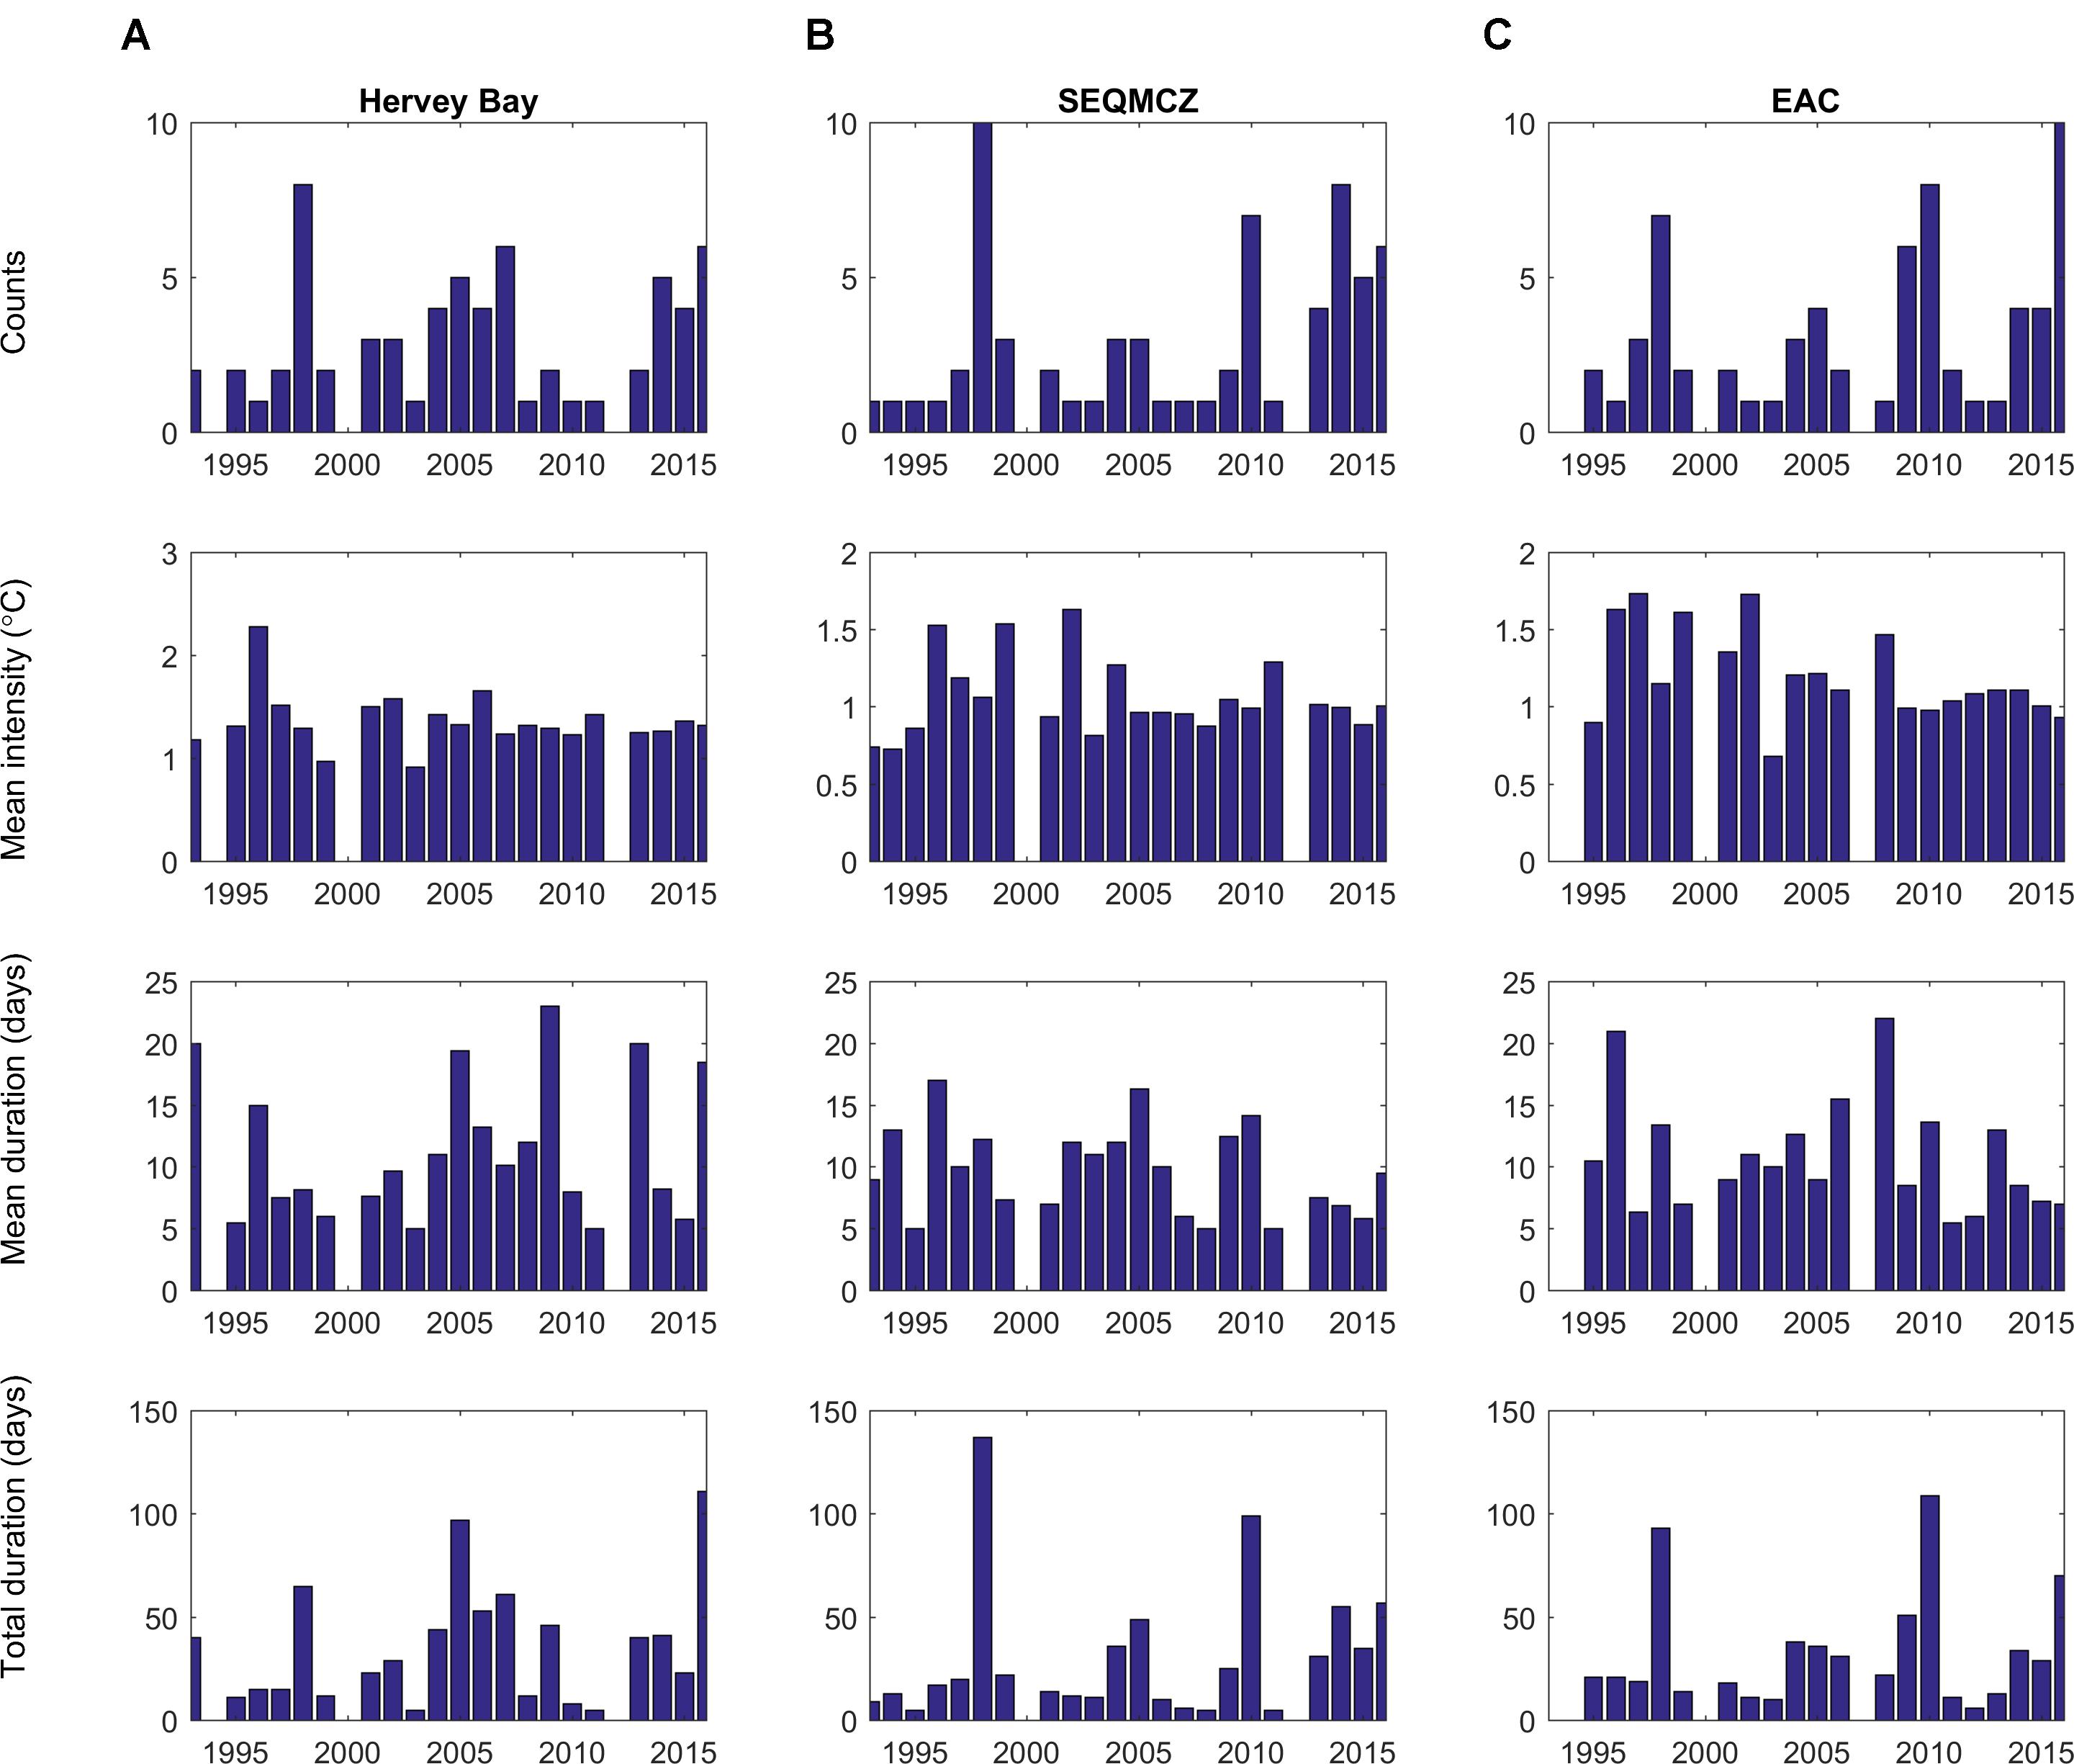
Figure 3. Yearly MHW statistics for (A) Hervey Bay, (B) the SEQMCZ, and (C) the EAC. Top row: number of MHWs per year; second row: mean MHW intensity (°C); third row: mean MHW duration (days) and bottom row: total number of MHW days per year.
To summarize, Hervey Bay was the region with the largest amount of MHW days, the maximum SST anomalies, longest duration of MHWs and maximum cumulative intensity. Therefore, MHWs were the most intense, persisted the longest and occurred the most frequently in Hervey Bay and consequently, we expect the largest impact of MHWs on ecosystems in this area. For that reason we focused further analysis on Hervey Bay.
We identified the 3 years with the largest amount of MHW days for Hervey Bay. The year with the maximum MHW days, which were 111 days, was 2016. In spring, the maximum intensity during a MHW occurred, which was a +3.3°C SST anomaly on the 12.11.2016. During 2016, 6 MHWs occurred in total, with an average duration of 19 days per MHW. The longest MHW during this year lasted for 5 weeks (36 days) and took place in autumn (18.3.2016–23.4.2016). The mean MHW intensity was 1.13°C. The second most MHW days occurred in 2005, which were 97 days in total and 5 MHWs. In summer 2005/2006, the longest MHW from 1993 to 2016 occurred, which lasted for 9 weeks (64 days) from 24.11.2005 to 27.01.2006. It had the maximum cumulative intensity of the study period, which were 120°C days. Therefore, this particular MHW has possibly caused the largest negative ecological impact and its intensity was more than twice as large as the maximum cumulative intensity in the SEQMCZ and the EAC. The year with the third most MHW days (65), and 8 MHWs in total, was 1998. The mean MHW intensity was 1.29°C and the average duration was 8 days.
ENSO Influence
The magnitude of the ONI is used to classify persisting equatorial SSTa as El Niño and La Niña events (NOAA, 2017). To explore the influence of El Niño influenced advective oceanic processes on the study area at the east Australian coast, this index is compared with SSTa for Hervey Bay, SEQMCZ, and the EAC in Figure 4 for the period 1993–2016. To explore the spatial relationship to El Niño, two additional indices from the Niño 3 and Niño 4 region are considered as well. During the study period, the largest ENSO warm events occurred in 1997/98, 2009/2010, and 2015/16 with equatorial warming exceeding the +0.8°C El Niño threshold.
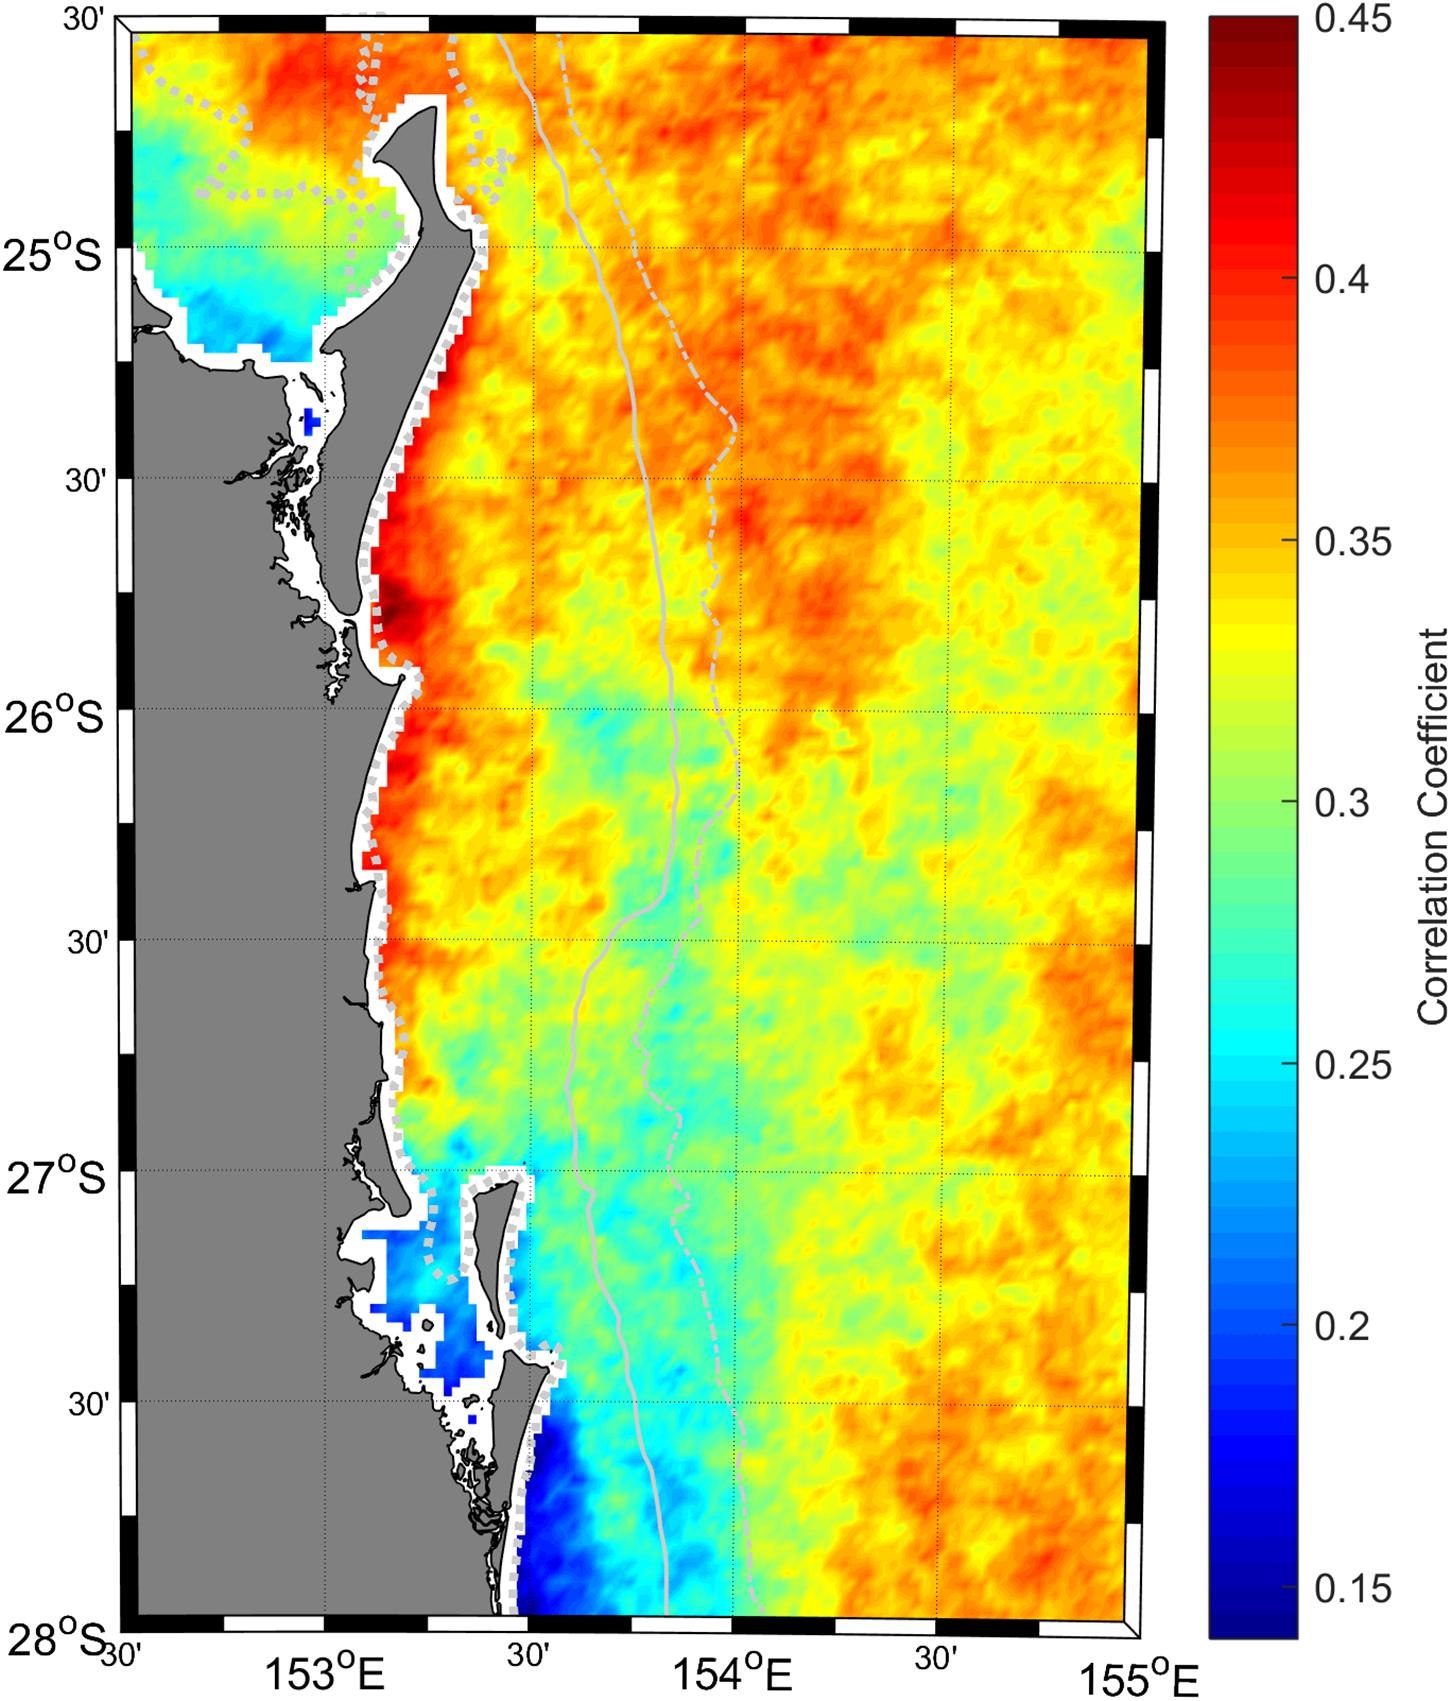
Figure 4. Map of Correlation Coefficients between ONI and SSTa.
At the southeast QLD coast, the largest number of MHW days occurred during El Niño years. In Hervey Bay, 2 out of 3 years with the maximum amount of MHW days in total occurred during El Niño influenced years, which were 1998 and 2016. 111 MHW days occurred in 2016, followed by 97 days in 2005, which was ENSO neutral, and 65 days in 1998. In the remaining two areas, the SEQMCZ and the EAC, all 3 years with the maximum number of MHW days took place during El Niño years, which were 1998, 2010, and 2016. Therefore, El Niño events seem to be a key driver for MHWs.
To validate this assumption, we conducted a cross-correlation between the ONI and monthly SSTa along the southeast Queensland coast. Results show a time lagged response of approximately 7 months. Aligned correlation coefficients were positive and the relationship between ONI and regional SSTa was significant. Therefore, positive ONI (El Niño) appeared to have an influence on time-lagged positive SSTa and negative ONI (La Niña) on negative SSTa in the region of interest. The spatial differences in cross correlation coefficients can be seen in Figure 4. The lowest correlation was found for Hervey Bay. The highest cross correlation coefficient appeared in the SEQMCZ and eastward. The regionally averaged correlations were significant (p < 0.05) and coefficients R = 0.30 for Hervey Bay, R = 0.36 for the EAC and R = 0.37 for the SEQMCZ. The same process was conducted using the Niño 3 and Niño 4 indices. These reveal very similar relationship with the lowest correlation for Hervey Bay, followed by the EAC and the strongest one for the SEQMCZ. Correlations are the lowest in the most westerly located Niño 4 region, followed by the Niño 3.4 region, represented as the ONI, and were the strongest in the most easterly located Niño 3 region. Correlations are significant and the coefficients for the Niño 4 region were R = 0.28 for Hervey Bay, R = 0.34 for the EAC and R = 0.35 for the SEQMCZ. For the Niño 3 region coefficients were R = 0.31 for Hervey Bay, R = 0.38 for the EAC and R = 0.40 for the SEQMCZ. As the differences in correlations were very small, we focus on the widely used Niño 3.4 region (ONI) in the following discussion.
The first mode of variability of the EOF analysis explained 78.2% of the variance in SSTa, and cross-correlating its eigenvectors with the ONI resulted in a maximum lag of 7 months as well. Consequently, this first principal component showed the ONI influence on SST anomalies at the southeast Queensland coast. The second and third EOF mode explained 7.6 and 6.7% of variance, respectively. Therefore, equatorial SSTa were the most important influence on interannual variability of SST at the southeast Queensland coast and ENSO events contributed to triggering MHWs.
MHW Trends
The MHW frequency was on average three events per year. However, between 1993 and 2016 the MHW frequency increased with a trend of +0.06 events per year in Hervey Bay, +0.13 events in SEQMCZ and +0.16 events in the EAC, which exceeded the global average of +0.045 events per year (Oliver et al., 2018a). In Hervey Bay, the trend of the mean intensity, MHW days per year and average MHW duration was increasing as well (Table 1). The number of MHW days per year increased in all regions. The largest rise occurred in Hervey Bay (+1.19 days per year), where the average number of MHW days increased from 17 days in 1993 to 45 days in 2016. In the SEQMCZ, MHWs increased by +0.75 days per year and in the EAC, by +1.13 days per year (Table 1).
Discussion and Conclusion
This study provides insight into the occurrence of MHWs along the southeast coast of Queensland and the influence of ENSO warm events. In this area, ENSO appears to be the primary driver for inter-annual SST variability possibly through heat advection (78% of variance explained using EOFs) between 1993 and 2016. Hervey Bay is the region with the lowest cross correlation to the ONI (R = 0.30) and the SEQMCZ the region with the highest cross correlation (R = 0.37). The strongest response of SSTa to ENSO occurred with a time lag of 7 months. The spatial relationship between equatorial SSTa and SSTa in the study region became slightly stronger toward the eastern Pacific (Niño 3 region). In addition, the largest number of MHW days per year occurred during the 3 years following strong El Niño events in all regions with one exception found for Hervey Bay in the ENSO neutral summer 2005 to 2006. The largest number of total MHW days, the largest maximum as well as mean intensity, duration and cumulative intensity were found in Hervey Bay, which is the most shallow environment and possibly stronger influenced by air-sea fluxes. Therefore, this region may see large ecological impacts due to MHWs in the future as well. A relation between strong and moderate El Niño events and MHW frequency and intensity was evident on a global scale. In a previous analysis, it was found to be the strongest in the eastern tropical Pacific by Oliver et al. (2018a). Possible explanations for these spatial differences and different drivers for MHWs in the study area will be discussed in the following.
MHWs and ENSO
Redondo-Rodriguez et al. (2012) found that inter-annual SSTa were partially associated with ENSO in the GBR region located to the north of our study site. Redondo-Rodriguez et al. (2012) also identified spatial differences in the correlation between the ONI and SSTa. Both these previous results are consistent with findings presented in this study. El Niño events were identified to affect SSTa and contributed in triggering MHWs. However, it appears that atmospheric drivers impact on MHW occurrence in particular in Hervey Bay as well, as it is the region with the lowest correlation to the ONI. These atmospheric processes may be caused by El Niño events and induce positive air-sea heat fluxes due to changes in, for example, cloud coverage. ENSO driven advective ocean processes have a larger influence on the more exposed coastlines south of Hervey Bay. Furthermore, Redondo-Rodriguez et al. (2012) showed a time lag between the ONI and SSTa for the GBR and a significant correlation between the ONI in spring and summer as well as SSTa during the subsequent winter. This is in good agreement with the identified time lagged response to the ONI of about 7 months at the southeast Queensland coast to the south of the GBR. It is unclear, if atmospheric or oceanic patterns cause the longest and most extreme MHWs (Schlegel et al., 2017).
A very strong El Niño took place from 1997 to 1998. It coincided with, in 1998, the third highest number of MHW days per year in Hervey Bay (64 days), the highest amount of MHW days per year in the SEQMCZ (137 days) and the second highest number of MHW days per year in the EAC (93 days). Air temperatures in the area, near Hervey Bay (Maryborough) were above average in summer 1997/1998 as well and reached anomalies of +2.1°C in December 1997. In February 1998, SSTa were the largest with +1.9°C higher than usual. This occurred at the same time as on southern and central parts of the GBR, where a MHW was up to 2°C larger than average, and was followed by a mass coral bleaching event in January and February 1998 (Salinger et al., 2016).
At the southeast Queensland coast, many years with a particularly low number of MHW days per year coincide with moderate and strong La Niña events (2000, 2011, and 2012). La Niña events, as the 2011 event, can be associated with strong rainfall in southeast Queensland (Cai and Van Rensch, 2012). While El Niño events drive warm water anomalies at Australia’s north and east coast, La Niña events can induce these at the coast of Western Australia. The 2011 La Niña event had extreme consequences at the coast of Western Australia, where it drove a MHW with significant ecological impacts on a variety of different marine species (Feng et al., 2013; Pearce and Feng, 2013; Wernberg et al., 2013), damaging more than a third of the seagrass meadows in a key site for seagrass ecosystems and carbon stocks in Western Australia (Arias-Ortiz et al., 2018). In addition, the same MHW event caused an extreme loss of kelp forests by 43% on the Great Southern Reef and its complete dieback north of 29°S. Temperate species replaced subtropical and tropical species along the west coast (Wernberg et al., 2016).
In 2016, the largest number of MHW days occurred in Hervey Bay. These events occurred during and followed the strong 2015/2016 El Niño, which caused a large number of strong MHWs in northern Australian waters, lead to mass coral bleaching events (Benthuysen et al., 2018) and total structural ecosystem changes (Stuart-Smith et al., 2018). The maximum warming during MHWs in 2016 in Hervey Bay (3.29°C) was even larger than the maximum intensity reached in the areas further north, e.g., around the Torres Strait, the northern GBR and the western Coral Sea (2.05°C) (Benthuysen et al., 2018), possibly due to its shallow environment. There were more MHW days in this tropical and much larger area (200 MHW days in 2016 in contrast to 111 MHW days in Hervey Bay). Starting in the austral summer 2015/2016, large areas of tropical Australia were exposed to MHWs for 3–4 months in a row (Benthuysen et al., 2018). During February, March, and April 2016, SSTs were the highest on record on the GBR and this heat stress did not only induce mass coral bleaching, but also caused complete irreversible mortality of corals especially in the northern parts of the reef, where the threshold of 3–4°C weeks were exceeded (Hughes et al., 2017). It is assumed that these MHWs caused ecological disturbances in Hervey Bay as well, which may have been less extreme than those for the GBR. MHWs did not persist as long as they did in tropical Australian waters (maximum duration was 36 days). MHWs started occurring in March and lasted for a maximum of 5°C weeks. The south of Hervey Bay is habituated by corals (Zann et al., 2012), which may have been disturbed by this event. It is possible that the extensive seaweed meadows have not been damaged as the dominant species (H. uninervis) is adapted to tropical temperatures. In a recent study, which exposed the same species to temperatures of up to 33°C, Collier et al. (2012) found that its’ growth and biomass even increased with rising temperatures. During the same year, at the southeast coast of Australia, a strong MHW, which lasted for 251 days, occurred due to an anomalous southward extension of the EAC, and had dramatic impacts on biodiversity, fisheries and aquaculture. In this case, the maximum intensity reached off coastal Tasmania was 2.9°C above the climatology (Oliver et al., 2017). Due to the very long duration of this MHW, ecological impacts are expected to be much larger than at the southeast Queensland coast, where the peak intensity was higher, however, the duration of the MHWs in 2016 lower.
Case Studies
To further discuss specific MHW events, their spatial SSTa signatures and their potential physical drivers, three case studies were identified based on their duration (see Table 1) and intensity (see Figure 2) and were classified according to Hobday et al. (2018). These include Case 1 for the whole region, Case 2 for the SEQMCZ, and Case 3 for Hervey Bay. The two main drivers of MHWs are advective ocean processes and air-sea fluxes, and we discuss the most likely in causing these MHWs. For each case, a sequence of averaged SSTa distributions covering periods of onset, maximum intensity and termination as well as a time series of daily mean SSTa averaged for each region are shown in Figures 5A–C. Maps show an average over the time period indicated above each panel, which are weekly in all cases but the last panel (end of the MHW, 4th panel from the left), which shows an average over the remaining period of the MHW. These are 9 days in Case 1 (Figure 5A, 4th panel from the left), 5 days in Case 2 (Figure 5B, 4th panel from the left) and 7 days in Case 3 (Figure 5C, 4th panel from the left).
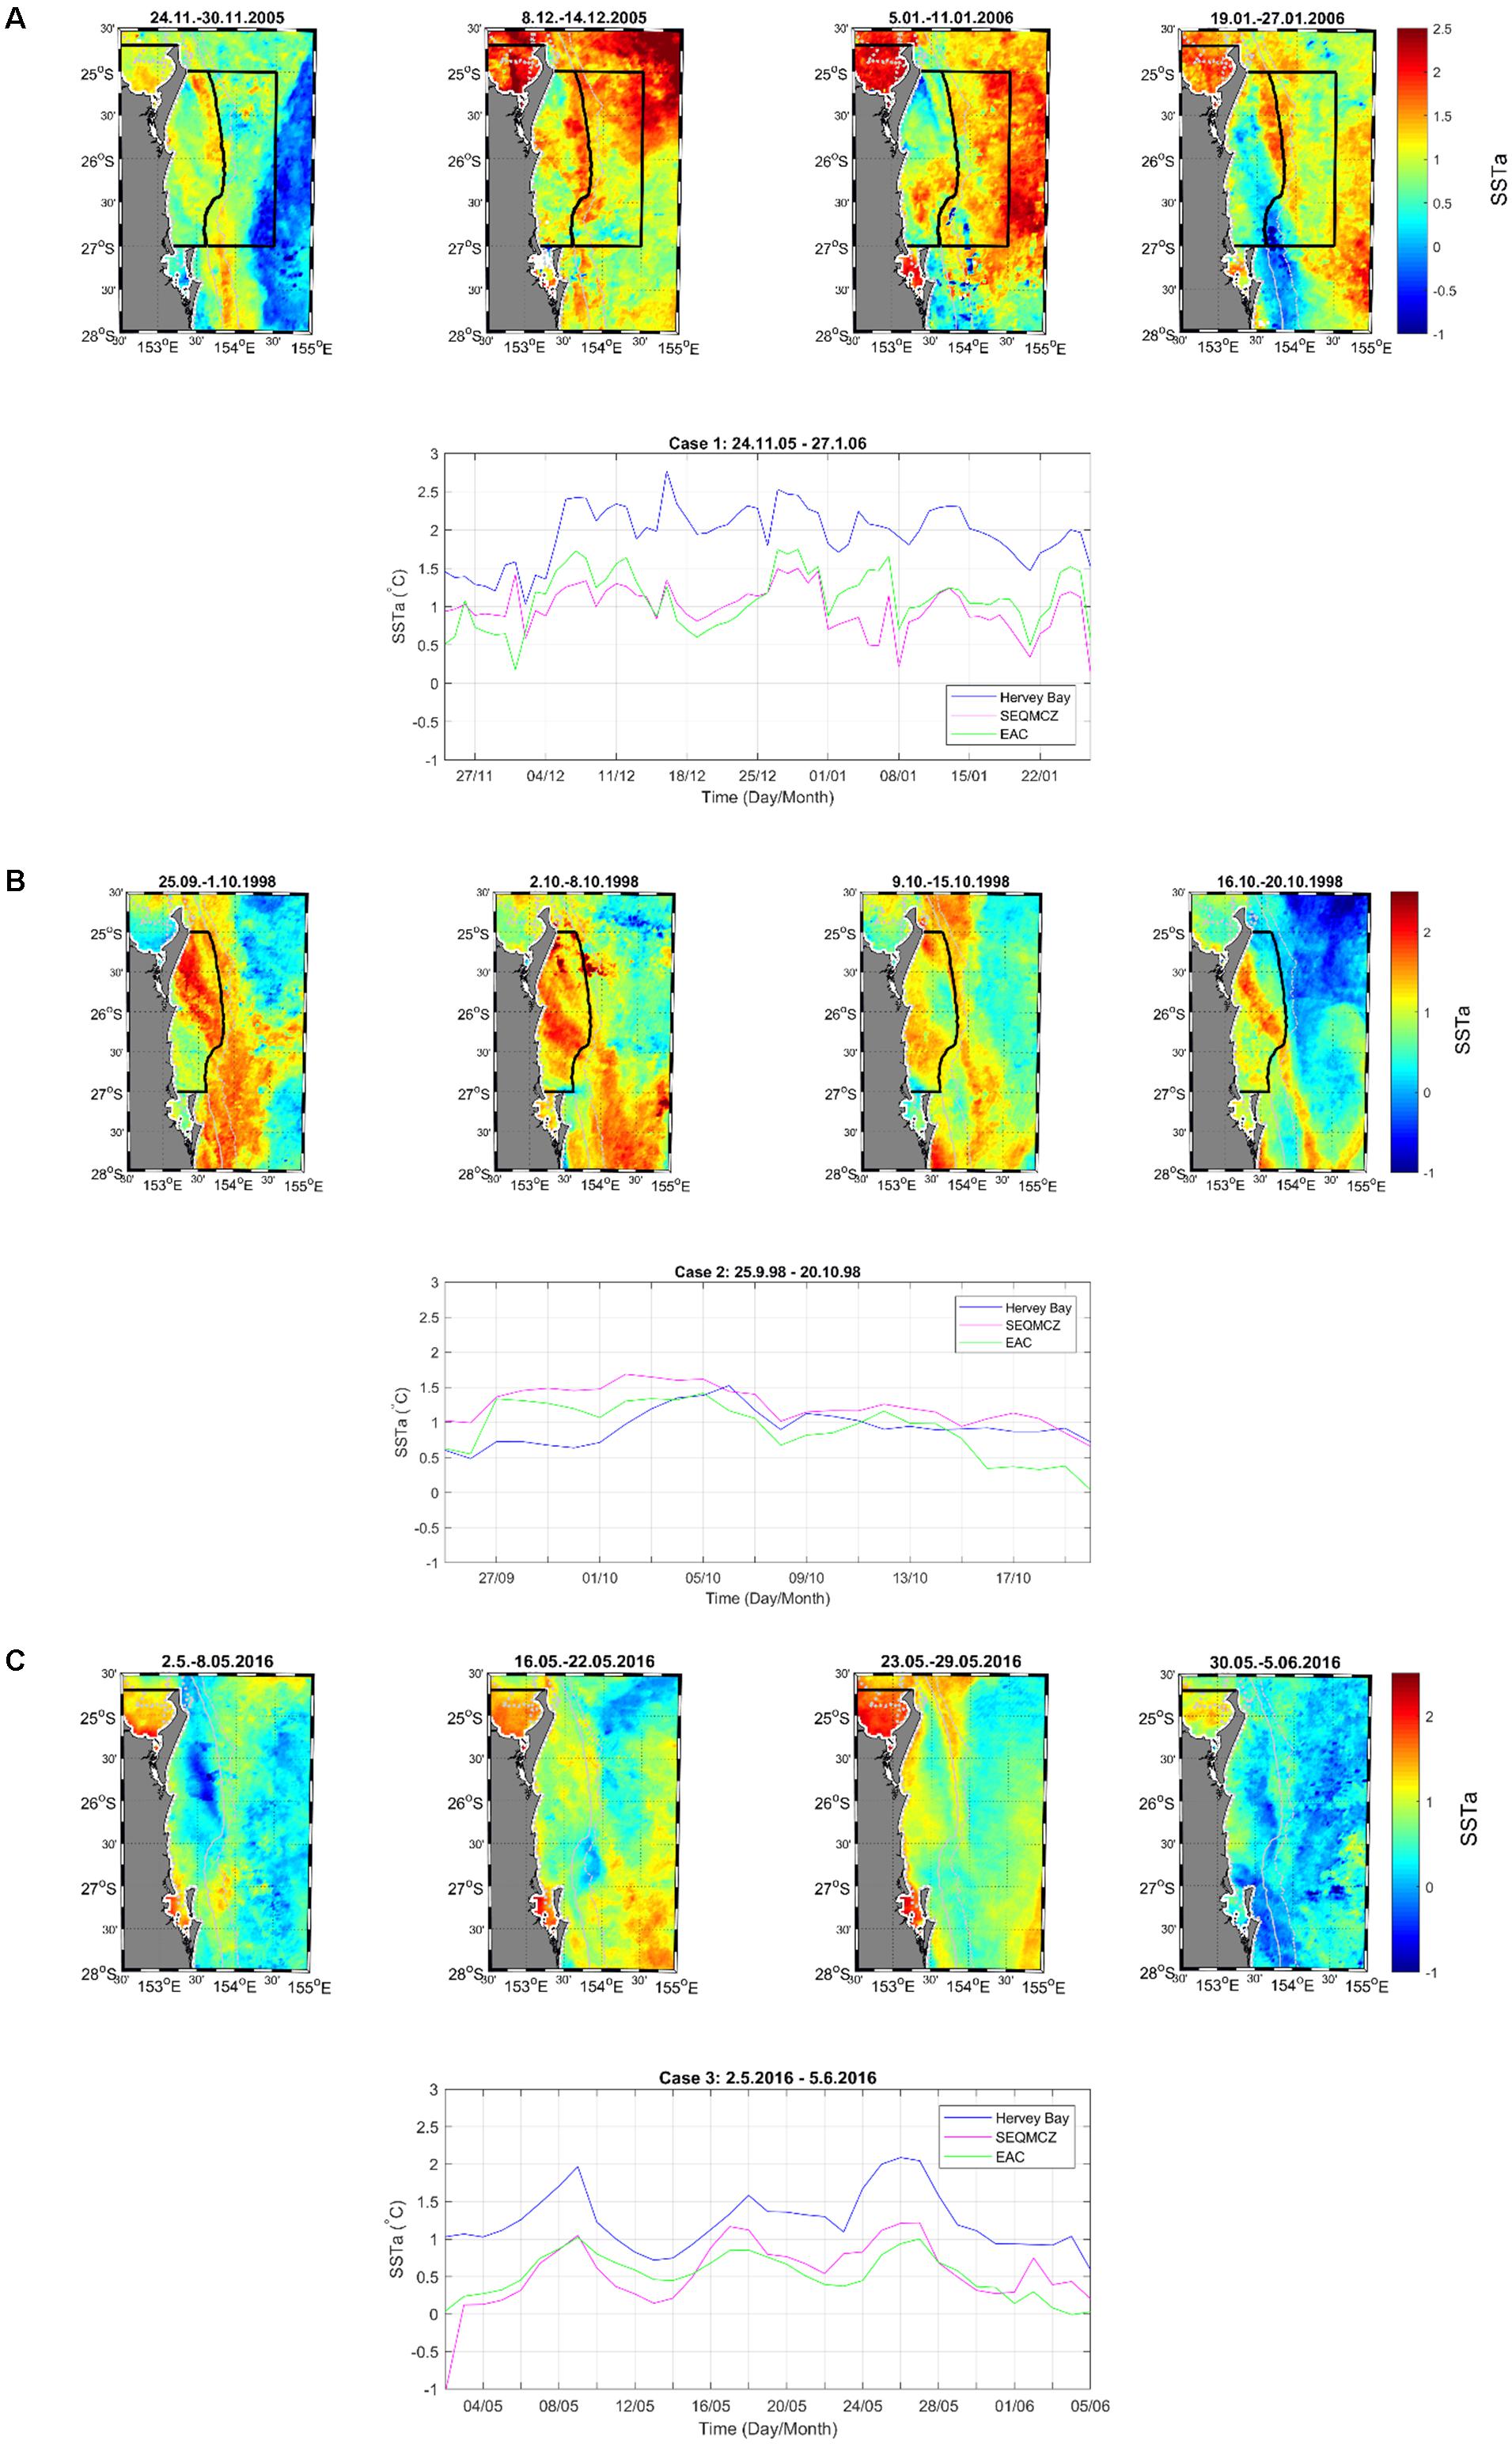
Figure 5. Summary of three Case Studies. (A) Case 1 (24.11.2005–27.1.2006). Top row: weekly averaged SSTa maps in all cases but the last panel (end of the MHW, 4th panel from the left), which shows an average over the remaining period of the MHW. The time period averaged for each map is indicated above each panel. Maps include the most relevant weeks during this MHW. Black lines indicate the location of three study regions Hervey Bay, SEQMCZ and the EAC region. Bottom row: time series of daily SSTa for the examined time period, divided into three study regions. (B) Case 2 (25.09.1998–20.10.1998). Top row: weekly averaged SSTa maps in all cases but the last panel (end of the MHW, 4th panel from the left), which shows an average over the remaining period of the MHW. Maps include all weeks during this MHW. The time period averaged for each map is indicated above each panel. Black lines indicate the location of the SEQMCZ. Bottom row: time series of daily SSTa for the examined time period, divided into three study regions. (C) Case 3 (2.05.2016–5.05.2016). Top row: weekly averaged SSTa maps including the most relevant weeks during this MHW. The time period averaged for each map is indicated above each panel. Black lines indicate the location of Hervey Bay. Bottom row: time series of daily SSTa for the examined time period, divided into three study regions.
Case 1: Broader Region (Figure 5A)
Using the Hobday et al. (2018) heat wave classification scheme, we find that the most significant MHW over the broader region occurred during the austral summer 2005–2006. It was characterized by the highest SSTa (Figure 2) during this ENSO neutral summer. It also conincided with longest and most intense MHW found in Hervey Bay (see below) and lasted for 9 weeks (65 days) from the 24.11.2005 to 27.02.2006. It peaked as a Strong MHW (Category II) for 26% of that period and reached a maximum SSTa of 2.77°C (Figure 5A, bottom row). For the reminder of that period (74%), it was a categorized as a Moderate MHW (Category I). In the SEQMCZ and the EAC region, MHWs developed as well (see Table 1, marked in red). The 38 days lasting MHW in the SEQMCZ (24.11.2005–31.12.2005) was classified as Moderate (Category I) for 92% and Strong (Category II) for 5% of the time. It peaked with a maximum intensity of 1.5°C (Figure 5A, bottom panel). In the EAC region, the 31 days MHW (24.12.2005–26.1.2006) peaked with 1.7°C (Figure 5A, bottom panel) and remained a Moderate MHW (Category I) throughout this time.
Figure 5A shows the spatial distribution of SSTa during this prolonged MHW. These maps represent the onset period of the MHW (24.11.2005–30.11.2005), followed by the period with maximum SSTa in Hervey Bay (8.12.2005–14.12.2005), a period with high SSTa (5.01.2006–11.01.2006) and the termination period (19.01.2006–27.01.2006). The event started to develop at the end of November 2005 (Figure 5A, left panel) and intensified early December. During 8–14th December (Figure 5A, 2nd panel from the left), strong SSTa had developed in Hervey Bay, the EAC and eastern parts of the SEQMCZ along the shelf break. From 15th–29th, a narrow band of cooler water appeared along the shelf break and the eastern border of the SEQMCZ most likely due to upwelling of cooler subsurface waters, keeping parts of the SEQMCZ comparably cooler than Hervey Bay and the EAC by separating the shelf from the EAC waters.
For the majority of the heat wave (1.12.2005–27.01.2006), SSTa stayed constantly high in Hervey Bay, while more variations in SSTa were observed in the remaining study area and especially in the by upwelling influenced SEQMCZ (Figure 5A, 2nd–4th panel from the left). Analysis of ERA-Interim ECMWF wind data3 shows that the wind direction was northeasterly during the 1st week of the MHW (24.11.2005–30.11.2005) and veered to northerly during the 2nd week (1.12.2005–7.12.2005) of the MHW. Winds stayed northerly and with a small easterly component from the 1.12.2005–11.01.2006. Winds veered to easterly from the 12.01.2006–27.01.2006, when the MHW ends. An analysis of local air temperatures (data not shown, BOM, 2018; station number: 040126) in Maryborough shows positive anomalies as well, with a monthly average of 1.89°C above average in December 2005.
This broad scale event is possibly driven by oceanic heat advection due to an anomalous warm southwest Pacific Ocean. It likely lead to an increased heat transport by the EAC. The northerly winds from the beginning of December 2005 to the beginning of January 2006 may have contributed to the enhanced transport of warm water from the Great Barrier Reef region into our study region (Figure 5A, 2nd panel from the left). Due to continuous north and northeasterly winds, warm surface water is advected into and retained in Hervey Bay, which possibly lead to intense and more persistent warming in Hervey Bay. In addition, air temperatures near Hervey Bay were anomalous high. This may have enhanced the MHW due to Hervey Bay’s shallowness and protected environment. The SEQMCZ and the EAC region, in contrast, are strongly influenced by current driven transport, dispersing the anomalous warm water masses over a large area and leading to more variable SSTa in this region. Easterly winds toward the end of the MHW possibly contributed to dissipate the MHW by inducing a transport of cool water masses from the east into the study region.
Case 2: SEQMCZ (Figure 5B)
Case 2 is one of the longest lasting MHWs in the SEQMCZ. It occurred following the very strong 1997/1998 El Niño event. The MHW lasted for 26 days, from 25.09.1998 to 20.10.1998 (Table 1, marked in green; Figures 2, 5B bottom panel shows daily SSTa during this period) and peaked with a SSTa of 1.7°C. It was classified as a Strong MHW (Category II) for 42% of its duration and as Moderate (Category I) for 48% of days.
The spatial SSTa signature during this MHW is shown in Figure 5B. The event is characterized by a rapid onset and evolved to an intense MHW within the 1st week (25.09.1998–1.10.1998). It continued to weaken for the remainder of the event (Figure 5B). A wide region with above average SSTa covered the SEQMCZ during the 1st week, which was also the period of maximum intensity (25.09.1998–1.10.1998), extending south eastward and across the southern half of the EAC region. The maximum SSTa was found to the southeast of Fraser Island. In Hervey Bay, SST were average in the south and SSTa increased toward the north (Figure 5B, left panel). During the following week (2.10.1998–8.10.1998) the band of warm SST shifted slightly southward. Small regions with high SSTa occurred off the Fraser Island Coast. A small area of warm SSTa extended through the southern end of the EAC region (Figure 5B, 2nd panel from the left) as the area of warm waters moved further south. In the 3rd week of this MHW (9.10.1998–15.10.1998) a narrow strip of warm SSTa followed the shelf break south (Figure 5B, 3rd panel from the left), as warm waters were transported southwards. The warm patch in the SEQMCZ had slightly weakened and moved further south. During the termination of the MWH, from the 16.10.1998–20.10.1998, anomalous cool waters appear in the north of the EAC and therefore anomalies in the EAC region were mostly negative (Figure 5B, 4th panel from the left; bottom row). A region of warm SSTa remained on the shelf in the SEQMCZ, which extended southwards.
During the whole time period, SSTa were low in Hervey Bay. The wind direction was south-easterly during the onset (25.09.1998–1.10.1998), veering to northerly winds in from the 2.10.1998–15.10.1998, and north-easterly winds in from the 16.10.1998–20.10.1998 (ECMWF wind data, see above for source, not shown). The air temperatures for Maryborough (BOM weather data, see above for source, not shown) during September (-1.01°C) and October 1998 (-0.48°C) were colder than usual.
This event is likely driven by large scale heat advection due to the 1998 El Niño event. The lowest warming occurred in the region with the lowest correlation to the ONI (Hervey Bay), where also air temperatures were below average. The largest warming occurred in the region with the highest correlation to the ONI, the SEQMCZ. The lag correlation of 7 months shows the shelfs’ connection with the Pacific Ocean through the advective pathway. These observed above average SSTa occurred during spring 1998 and were time lagged following the El Niño event, which peaked in summer 1997/1998. There is no indication that the Indian Ocean Dipole has influence on atmospheric conditions through an atmospheric bridge in the study region (Risbey et al., 2009).
Case 3: Hervey Bay (Figure 5C)
Case 3 shows the third longest and intense MHW in Hervey Bay. This is one of the MHWs, which occurred following the 2016 El Niño event and lasted for 5 weeks from 2.05.2016 to 5.6.2016 (Table 1, marked in yellow; Figure 5C, bottom row). It is characterized by a slow onset, peaking in the 4th week and terminating afterwards.
The MHW peaked briefly for 3 days (9% of days) as a Severe MHW (Category III) with a maximum intensity of 2.09°C and stayed a Strong MHW (Category II) for 29% of days. During the onset (2.05.2016–8.05.2016), SSTa were the highest in the south of Hervey Bay, where it is the shallowest, and were above average in the whole bay. In contrast, average to below average conditions were found in most of the SEQMCZ and the EAC region (Figure 5C, left panel). The pathway of the EAC shows a slight positive anomaly, which is low compared to Hervey Bay.
In the east of the SEQMCZ toward the shelf break, an area of cool below average SSTa occurred due to upwelling of cool subsurface waters. This upwelling is visible in the following week as well, however, has weakened. The positive anomaly in Hervey Bay remained. In the 3rd week of the MHW (16.05.2016–22.05.2016), SSTa rose in Hervey Bay, showing a constant positive SSTa of up to 2°C extending beyond the 20 m Isobath (Figure 5C, second panel). SSTa in the EAC region and in the SEQMCZ were low. No upwelling was apparent during this time. The 4th week (23.05.2016–29.05.2016) was the period of maximum intensity, which showed on average, the highest SSTa in Hervey Bay. In the northern part of the study area, positive SSTa hugged the 150 m Isobath. SSTa of the same strength were observed off Fraser Island. The remaining areas of the SEQMCZ and the EAC region showed small positive SSTa (Figure 5C, 3rd panel from the left). During the termination (30.05.2016–5.06.2016) week, the anomaly weakened in the entire study area. Hervey Bay remained warmer than usual, while average to below average SSTa occurred in the other regions (Figure 5C, 4th panel from the left). Winds were south-easterly during the first 3 weeks (2.05.2016–22.05.2016), veered to westerly winds in week of maximum SSTa (23.05.2016–29.05.2016) and to easterlies in the termination period (30.05.2016–5.06.2016; ECMWF wind data, not shown). During May, air temperature form Maryborough (BOM weather station air temperature, data not shown) reached an average anomaly of 3.2°C. This was the largest monthly average air temperature anomaly recorded between 1993 and 2016.
This regional MHW event in Hervey Bay is most likely not driven by oceanic heat convection, but by air-sea heat fluxes into the ocean. El Niño related atmospheric conditions potentially reduce cloud coverage, thus leading to increase heat flux into the ocean. As previously documented by Benthuysen et al. (2018), these weather patterns induced a long lasting MHW on the Northern Great Barrier Reef starting in mid-May 2016, which overlaps with the time of this analyzed MHW in Hervey Bay. This is consistent with our findings that Hervey Bay showed the weakest correlation with SSTa in the tropical Pacific (ONI) and thus is likely to be more influenced changes in air-sea fluxes.
MHW Trends
Marine heat waves have often a more extreme negative impact on ecosystems than the gradual ocean warming trend (Oliver et al., 2018a) and many ecosystems may not be resilient to these abrupt disturbances (Wernberg et al., 2016). In a world of 2°C warmer than at present time, MHWs as in 2016 in north eastern Australia would, with high confidence, happen double as often. This would have severe effects on the GBR (King et al., 2017). Due to warming temperatures the probability of heat waves, in the ocean and on land, is increasing. However, knowledge of MHWs and their evolution is limited as is the ability to predict the severity of future events (Frölicher and Laufkötter, 2018), which is why more small scale studies will be a valuable tool in understanding future challenges. Adopting a consistent methodology such as that proposed by Hobday et al. (2016) and used in this study will make studies more comparable. Currently, there is only a small number of studies using the same definition and metrics (Frölicher and Laufkötter, 2018), which is increasing. It is known that the MHW frequency has risen globally (Oliver et al., 2018a) and may become more frequent as global warming continues (Frölicher et al., 2018). The rate of change along the southeast Queensland coast (+0.06 MHW events per year in Hervey Bay, +0.13 MHW events per year in the SEQMCZ and +0.16 MHW events per year in the EAC) is exceeding the global average of 0.045 events per year (Oliver et al., 2018a). However, these trends need to be considered with caution due to our relatively short length (1993–2016) of the dataset.
Limitations
Potential limitations of this study include the length of the time series in regards to the discussion of trends. In addition, the choice of data (Day/Night composite SST) may introduce a bias in the shallow areas due to diurnal heating and cooling. This may have a small to insignificant impact in the deeper regions of the shelf and the EAC region. In future research, this analysis is to be revisited using additional data and the time frame expanded. Why the sensitivity of the correlation coefficient to the chosen equatorial SST regions shifts and the correlation becomes slightly stronger toward the eastern Pacific, requires further analysis as well.
In summary, this study finds that ENSO driven heat advection is likely to influence interannual variability of SSTa along the southeast Queensland coast and drives MHWs. This influence is the strongest at the exposed coastline and the weakest in the enclosed region of Hervey Bay. The analysis of SSTa variability finds the strongest signal to the ONI with a time lag of 7 months. Furthermore, SSTa in Hervey Bay are the most extreme, revealing the strongest MHWs within the study area. Large anomalies occur much more frequently in this than in the other areas, possibly due to the bay’s shallowness and enclosed location leading to more rapid heating. North to northeasterly winds may enhance this by retaining warm water masses in this environment. Therefore, we suggest that ENSO in terms of heat advection, but also strongly through air-sea fluxes and local atmospheric and site specific conditions impact on generating these large MHWs. As Hervey Bay and the SEQMCZ are key ecological and biodiverse marine sites along the east Australian coast, investigating and understanding drivers for MHWs and examining ecological impacts of them through field studies is an important task for further investigations. MHWs, and their rising probability with continuously warming oceans, will continue to cause thermal stress and have already shown severe consequences on the GBR, just north of the study area, and all over Australia. This study stands in contrast to many other studies that investigate MHWs for larger scale systems such as the Tasman Sea, the GBR and the Great Southern Reef. It is one of very few studies, that investigate ENSO-driven MHWs in small scale biodiverse coastal and shelf systems. Similar studies for other shelf and coastal regions globally should be inspired. Coastal shelf regions are already under increasing pressure and highly impacted by processes detrimental to biodiversity, which will compound in the future with proceeding climatic change and increasing numbers of MHWs.
Data Availability Statement
The datasets analyzed for this study are publically available through IMOS (2017), as referenced in the methods section.
Author Contributions
HH and JR designed the study. HH processed and analyzed the datasets and worked on interpretations of the results with JR. HH wrote the draft. JR contributed to the text by reviewing and writing.
Conflict of Interest Statement
The authors declare that the research was conducted in the absence of any commercial or financial relationships that could be construed as a potential conflict of interest.
Acknowledgments
HH is very thankful for the support provided through the German Academic Exchange Service (DAAD). In addition, NOAA and IMOS are thanked for providing data used in this study.
Footnotes
- ^http://www.cpc.ncep.noaa.gov/data/indices/
- ^http://www.cpc.ncep.noaa.gov/data/indices/
- ^https://www.ecmwf.int/en/forecasts/datasets/archive-datasets/browse-reanalysis-datasets
References
Arias-Ortiz, A., Serrano, O., Masqué, P., Lavery, P. S., Mueller, U., Kendrick, G. A., et al. (2018). A marine heatwave drives massive losses from the world’s largest seagrass carbon stocks. Nat. Clim. Chang. 8, 338–344. doi: 10.1038/s41558-018-0096-y
Azis Ismail, M. F., Ribbe, J., Karstensen, J., Lemckert, C., Lee, S., and Gustafson, J. (2017). The Fraser gyre: a cyclonic eddy off the coast of eastern Australia. Estuar. Coast. Shelf Sci. 192, 72–85. doi: 10.1016/j.ecss.2017.04.031
Benthuysen, J. A., Oliver, E. C. J., Feng, M., and Marshall, A. G. (2018). Extreme Marine Warming Across tropical Australia during austral summer 2015–2016. J. Geophys. Res. Ocean 123, 1301–1326. doi: 10.1002/2017JC013326
BOM (2017a). Australian Climate Influences Timeline. El Nino and La Nina events. El Nino - Detailed Australian Analysis. Available at: http://poama.bom.gov.au/climate/enso/enlist/ (accessed October 11, 2017).
BOM (2017b). Australian Climate Influences Timeline. El Nino and La Nina events. La Nina -Detailed Australian Analysis. Available at: http://poama.bom.gov.au/climate/enso/lnlist/index.shtml (accessed October 11, 2017).
BOM (2018). Climate Data Online. Daily Maximum Temperature. Available at: http://www.bom.gov.au/climate/data/ (accessed March 7, 2018).
Brieva, D., Ribbe, J., and Lemckert, C. (2015). Is the East Australian current causing a marine ecological hot-spot and an important fisheries near Fraser Island, Australia? Estuar. Coast. Shelf Sci. 153, 121–134. doi: 10.1016/j.ecss.2014.12.012
Brodie, J., and Pearson, R. G. (2016). Ecosystem health of the great barrier reef: time for effective management action based on evidence. Estuar. Coast. Shelf Sci. 183, 438–451. doi: 10.1016/j.ecss.2016.05.008
Cai, W., and Van Rensch, P. (2012). The 2011 southeast Queensland extreme summer rainfall: a confirmation of a negative Pacific Decadal oscillation phase? Geophys. Res. Lett. 39, 1–6. doi: 10.1029/2011GL050820
Collier, C. J., Waycott, M., and McKenzie, L. J. (2012). Light thresholds derived from seagrass loss in the coastal zone of the northern great barrier reef, Australia. Ecol. Indic. 23, 211–219. doi: 10.1016/j.ecolind.2012.04.005
Coumou, D., and Rahmstorf, S. (2012). A decade of weather extremes. Nat. Clim. Chang. 2, 491–496. doi: 10.1038/nclimate1452
Dambacher, J. M., Hosack, G. R., and Rochester, W. A. (2012). Ecological Indicators for the Exclusive Economic Zone of Australia’s East Marine Region. Clayton, ACT: CSIRO. doi: 10.4225/08/584c44e1a4389
Feng, M., McPhaden, M. J., Xie, S. P., and Hafner, J. (2013). La Niña forces unprecedented leeuwin current warming in 2011. Sci. Rep. 3, 1–9. doi: 10.1038/srep01277
Forestell, P. H., Kaufman, G. D., and Chaloupka, M. (2011). Long term trends in abundance of humpback whales in Hervey. J. Cetacean Res. Manag. 3, 237–241.
Franklin, T., Franklin, W., Brooks, L., and Harrison, P. (2018). Site-specific female-biased sex ratio of humpback whales during a stopover early in the southern migration. Can. J. Zool. 96, 533–544.
Frölicher, T. L., Fischer, E. M., and Gruber, N. (2018). Marine heatwaves under global warming. Nature 560, 360–364. doi: 10.1038/s41586-018-0383-9
Frölicher, T. L., and Laufkötter, C. (2018). Emerging risks from marine heat waves. Nat. Commun. 9, 2015–2018. doi: 10.1038/s41467-018-03163-6
García-Morales, R., López-Martínez, J., Valdez-Holguin, J. E., Herrera-Cervantes, H., and Espinosa-Chaurand, L. D. (2017). Environmental variability and oceanographic dynamics of the central and southern coastal zone of sonora in the Gulf of California. Remote Sens. 9:925. doi: 10.3390/rs9090925
Gräwe, U., Wolff, J. O., and Ribbe, J. (2010). Impact of climate variability on an east Australian bay. Estuar. Coast. Shelf Sci. 86, 247–257. doi: 10.1016/j.ecss.2009.11.020
Great Barrier Reef Marine Park Authority (2016). Final Report: 2016 Coral Bleaching Event on the Great Barrier Reef. Townsville: GBRMPA.
Hobday, A. J., Alexander, L. V., Perkins, S. E., Smale, D. A., Straub, S. C., Oliver, E. C. J., et al. (2016). A hierarchical approach to defining marine heatwaves. Prog. Oceanogr. 141, 227–238. doi: 10.1016/j.pocean.2015.12.014
Hoegh-Guldberg, O. (1999). Climate change, coral bleaching and the future of the world’s coral reefs. Mar. Freshw. Res. 50:839. doi: 10.1071/MF99078
Hobday, A. J., Oliver, E. C. J., Gupta, A. S., Benthuysen, J. A., Burrows, M. T., Donat, M. G., et al. (2018). Categorizing and naming marine heatwaves. Oceanography 31, 162–173. doi: 10.5670/oceanog.2018.205
Holbrook, N. J., Davidson, J., Feng, M., Hobday, A. J., Lough, J. M., McGregor, S., et al. (2009). El Niño – Southern Oscillation. Available at: https://www.researchgate.net/profile/Alistair_Hobday/publication/235980067_El_Nino-Southern_Oscillation/links/0fcfd50fe1d453940e000000/El-Nino-Southern-Oscillation.pdf?origin=publication_detail
Hughes, T. P., Kerry, J. T., Álvarez-Noriega, M., Álvarez-Romero, J. G., Anderson, K. D., Baird, A. H., et al. (2017). Global warming and recurrent mass bleaching of corals. Nature 543, 373–377. doi: 10.1038/nature21707
IMOS (2017). SRS Satellite SST L3S, day and Night Time Composite. Available at: https://portal.aodn.org.au/search (accessed September 14, 2017).
King, A. D., Karoly, D. J., and Henley, B. J. (2017). Australian climate extremes at 1.5 °c and 2 °c of global warming. Nat. Clim. Chang. 7, 412–416. doi: 10.1038/nclimate3296
McGowan, H., and Theobald, A. (2017). ENSO weather and coral bleaching on the great barrier reef, Australia. Geophys. Res. Lett. 44, 10601–10607. doi: 10.1002/2017GL074877
Mills, K. E., Pershing, A. J., and Hernández, C. M. (2017). Forecasting the seasonal timing of maine’s lobster fishery. Front. Mar. Sci. 4:337. doi: 10.3389/fmars.2017.00337
NOAA (2017). ERSSTv4 (Centered Base Periods) “Oceanic Niño Index.”. Available at: http://www.cpc.ncep.noaa.gov/data/indices/ (accessed September 12, 2017).
NOAA (2018). ERSSTv5 (1981-2010 Base Period) Niño 3 (5°North-5°South)(150°West-90°West) Niño 4 (5°North-5°South) (160°East-150°West). Available at: http://www.cpc.ncep.noaa.gov/data/indices/ (accessed January 15, 2018).
Oliver, E. C. J., Benthuysen, J. A., Bindoff, N. L., Hobday, A. J., Holbrook, N. J., Mundy, C. N., et al. (2017). The unprecedented 2015/16 Tasman Sea marine heatwave. Nat. Commun. 8, 1–12. doi: 10.1038/ncomms16101
Oliver, E. C. J., Donat, M. G., Burrows, M. T., Moore, P. J., Smale, D. A., Alexander, L. V., et al. (2018a). Longer and more frequent marine heatwaves over the past century. Nat. Commun. 9, 1–12. doi: 10.1038/s41467-018-03732-9
Oliver, E. C. J., Lago, V., Hobday, A. J., Holbrook, N. J., Ling, S. D., and Mundy, C. N. (2018b). Marine heatwaves off eastern Tasmania: trends, interannual variability, and predictability. Prog. Oceanogr. 161, 116–130. doi: 10.1016/j.pocean.2018.02.007
Pearce, A. F., and Feng, M. (2013). The rise and fall of the “marine heat wave” off Western Australia during the summer of 2010/2011. J. Mar. Syst. 11, 139–156. doi: 10.1016/j.jmarsys.2012.10.009
Quispe-Ccalluari, C., Tam, J., Demarcq, H., Chamorro, A., Espinoza-Morriberón, D., Romero, C., et al. (2018). An index of coastal thermal effects of El niño southern oscillation on the Peruvian upwelling ecosystem. Int. J. Climatol. 38, 3191–3201. doi: 10.1002/joc.5493
Redondo-Rodriguez, A., Weeks, S. J., Berkelmans, R., Hoegh-Guldberg, O., and Lough, J. M. (2012). Climate variability of the Great Barrier Reef in relation to the tropical Pacific and El nino-southern oscillation. Mar. Freshw. Res. 63, 34–47. doi: 10.1071/MF11151
Ribbe, J., Toaspern, L., Wol, J., Furqon, M., and Ismail, A. (2018). Frontal eddies along a western boundary current. Cont. Shelf Res. 165, 51–59. doi: 10.1016/j.csr.2018.06.007
Ridgway, K. R., and Dunn, J. R. (2003). Mesoscale structure of the mean East Australian current system and its relationship with topography. Prog. Oceanogr. 56, 189–222. doi: 10.1016/S0079-6611(03)00004-1
Risbey, J. S., Pook, M. J., McIntosh, P. C., Wheeler, M. C., and Hendon, H. H. (2009). On the remote drivers of rainfall variability in Australia. Mon. Weather Rev. 137, 3233–3253. doi: 10.1175/2009MWR2861.1
Rose, T. H., Smale, D. A., and Botting, G. (2012). The 2011 marine heat wave in cockburn sound, southwest Australia. Ocean Sci. 8, 545–550. doi: 10.5194/os-8-545-2012
Salinger, J., Hobday, A. J., Matear, R. J., O’Kane, T. J., Risbey, J. S., Dunstan, P., et al. (2016). Decadal-scale forecasting of climate drivers for marine applications. Adv. Mar. Biol. 74, 1–68. doi: 10.1016/bs.amb.2016.04.002
Schlegel, R. W., Oliver, E. C. J., Perkins-Kirkpatrick, S., Kruger, A., and Smit, A. J. (2017). Predominant atmospheric and oceanic patterns during Coastal Marine Heatwaves. Front. Mar. Sci. 4:323. doi: 10.3389/fmars.2017.00323
Shears, N. T., and Bowen, M. M. (2017). Half a century of coastal temperature records reveal complex warming trends in western boundary currents. Sci. Rep. 7, 1–9. doi: 10.1038/s41598-017-14944-2
Sheppard, J. K., Lawler, I. R., and Marsh, H. (2007). Seagrass as pasture for seacows: landscape-level dugong habitat evaluation. Estuar. Coast. Shelf Sci. 71, 117–132. doi: 10.1016/j.ecss.2006.07.006
Sprogis, K. R., Christiansen, F., Wandres, M., and Bejder, L. (2017). El Niño Southern Oscillation influences the abundance and movements of a marine top predator in coastal waters. Glob. Chang. Biol. 24, 1085–1096. doi: 10.1111/gcb.13892
Stuart-Smith, R. D., Brown, C. J., Ceccarelli, D. M., and Edgar, G. J. (2018). Ecosystem restructuring along the Great Barrier Reef following mass coral bleaching. Nature 560, 92–96. doi: 10.1038/s41586-018-0359-9
Suthers, I. M., Young, J. W., Baird, M. E., Roughan, M., Everett, J. D., Brassington, G. B., et al. (2011). The strengthening East Australian Current, its eddies and biological effects - an introduction and overview. Deep. Res. Part II Top. Stud. Oceanogr. 58, 538–546. doi: 10.1016/j.dsr2.2010.09.029
Timmermann, A., An, S.-I., Kug, J.-S., Jin, F.-F., Cai, W., Capotondi, A., et al. (2018). El Niño–southern oscillation complexity. Nature 559, 535–545. doi: 10.1038/s41586-018-0252-6
Vidya, P. J., and Kurian, S. (2018). Impact of 2015–2016 ENSO on the winter bloom and associated phytoplankton community shift in the northeastern Arabian Sea. J. Mar. Syst. 186, 96–104. doi: 10.1016/j.jmarsys.2018.06.005
Ward, T. M., Staunton-Smith, J., Hoyle, S., and Halliday, I. A. (2003). Spawning patterns of four species of predominantly temperate pelagic fishes in the sub-tropical waters of southern Queensland. Estuar. Coast. Shelf Sci. 56, 1125–1140. doi: 10.1016/S0272-7714(02)00318-9
Wernberg, T., Bennett, S., Babcock, R. C., De Bettignies, T., Cure, K., Depczynski, M., et al. (2016). Climate-driven regime shift of a temperate marine ecosystem. Science 353, 169–172. doi: 10.1126/science.aad8745
Wernberg, T., Smale, D. A., Tuya, F., Thomsen, M. S., Langlois, T. J., De Bettignies, T., et al. (2013). An extreme climatic event alters marine ecosystem structure in a global biodiversity hotspot. Nat. Clim. Chang. 3, 78–82. doi: 10.1038/nclimate1627
Wijffels, S. E., Beggs, H., Griffin, C., Middleton, J. F., Cahill, M., King, E., et al. (2018). A fine spatial-scale sea surface temperature atlas of the Australian regional seas (SSTAARS): seasonal variability and trends around Australasia and New Zealand revisited. J. Mar. Syst. 187, 156–196. doi: 10.1016/j.jmarsys.2018.07.005
Young, J. W., Hobday, A. J., Campbell, R. A., Kloser, R. J., Bonham, P. I., Clementson, L. A., et al. (2011). The biological oceanography of the East Australian current and surrounding waters in relation to tuna and billfish catches off eastern Australia. Deep. Res. Part II Top. Stud. Oceanogr. 58, 720–733. doi: 10.1016/j.dsr2.2010.10.005
Keywords: marine heat wave, El Niño Southern Oscillation, sea surface temperature, Hervey Bay, climate variability
Citation: Heidemann H and Ribbe J (2019) Marine Heat Waves and the Influence of El Niño off Southeast Queensland, Australia. Front. Mar. Sci. 6:56. doi: 10.3389/fmars.2019.00056
Received: 23 August 2018; Accepted: 01 February 2019;
Published: 20 February 2019.
Edited by:
Eric C. J. Oliver, Dalhousie University, CanadaReviewed by:
Yasha Hetzel, The University of Western Australia, AustraliaAndrew G. Marshall, Bureau of Meteorology, Australia
Copyright © 2019 Heidemann and Ribbe. This is an open-access article distributed under the terms of the Creative Commons Attribution License (CC BY). The use, distribution or reproduction in other forums is permitted, provided the original author(s) and the copyright owner(s) are credited and that the original publication in this journal is cited, in accordance with accepted academic practice. No use, distribution or reproduction is permitted which does not comply with these terms.
*Correspondence: Hanna Heidemann, aGFubmEuaGVpZGVtYW5uQHVzcS5lZHUuYXU=