 Kathrin Kopke
 Jeffrey Black
 Amy Dozier
- Centre for Marine and Renewable Energy (MaREI), Environmental Research Institute, University College Cork, Cork, Ireland
The Ocean Literacy movement is predominantly driven forward by scientists and educators working in subject areas associated with ocean science. While some in the scientific community have heeded the responsibility to communicate with the general public to increase scientific literacy, reaching and engaging with diverse audiences remains a challenge. Many academic institutions, research centers, and individual scientists use social network sites (SNS) like Twitter to not only promote conferences, journal publications, and scientific reports, but to disseminate resources and information that have the potential to increase the scientific literacy of diverse audiences. As more people turn to social media for news and information, SNSs like Twitter have a great potential to increase ocean literacy, so long as disseminators understand the best practices and limitations of SNS communication. This study analyzed the Twitter account of MaREI – Ireland’s Centre for Marine and Renewable Energy – coordinated by University College Cork Ireland, as a case study. We looked specifically at posts related to ocean literacy to determine what types of audiences are being engaged and what factors need to be considered to increase engagement with intended audiences. Two main findings are presented in this paper. First, we present overall user retweet frequency as a function of post characteristics, highlighting features significant in influencing users’ retweet behavior. Second, we separate users into two types – INREACH and OUTREACH – and identify post characteristics that are statistically relevant in increasing the probability of engaging with an OUTREACH user. The results of this study provide novel insight into the ways in which science-based Twitter users can better use the platform as a vector for science communication and outreach.
Introduction
Education is a fundamental pillar of environmental stewardship and a motivator of behavioral change (Steel et al., 2005; Potts et al., 2016). An understanding of marine processes and issues is necessary to effectively engage in discussions of marine policy and encourage adoption of pro-environmental behaviors (Steel et al., 2005; McKinley and Fletcher, 2010; Chen and Tsai, 2016; Easman et al., 2018). It is widely recognized that human activities are threatening the integrity of the marine environment (Jefferson et al., 2015; Chen and Tsai, 2016; Easman et al., 2018; Lotze et al., 2018). However, the most pressing threats to marine ecosystems are not always well understood by the general public (Jefferson et al., 2014; Lotze et al., 2018). This lack of understanding presents a significant barrier to transforming scientific research into positive social change, and demonstrates a need to work toward improving the general public’s familiarity with ocean-related issues.
Between 2002 and 2010, a group of educators and scientists established a definition and framework for ocean literacy (OL) (Schoedinger et al., 2010). The framework identifies an ocean literate person as (1) knowledgeable about the ocean, (2) able to communicate about the ocean in a meaningful way, and (3) able to make informed and responsible decisions regarding the ocean and its resources (Cava et al., 2005; Santoro et al., 2017). The goal of improving the public’s OL is to create societies that understand their interconnected relationship with the ocean, enhancing their ability to make informed and responsible decisions about marine resources (Santoro et al., 2017). Therefore, it is imperative that OL topics are communicated in a fashion that enables citizens to both understand the information and apply it to make environmentally friendly decisions (Figure 1).
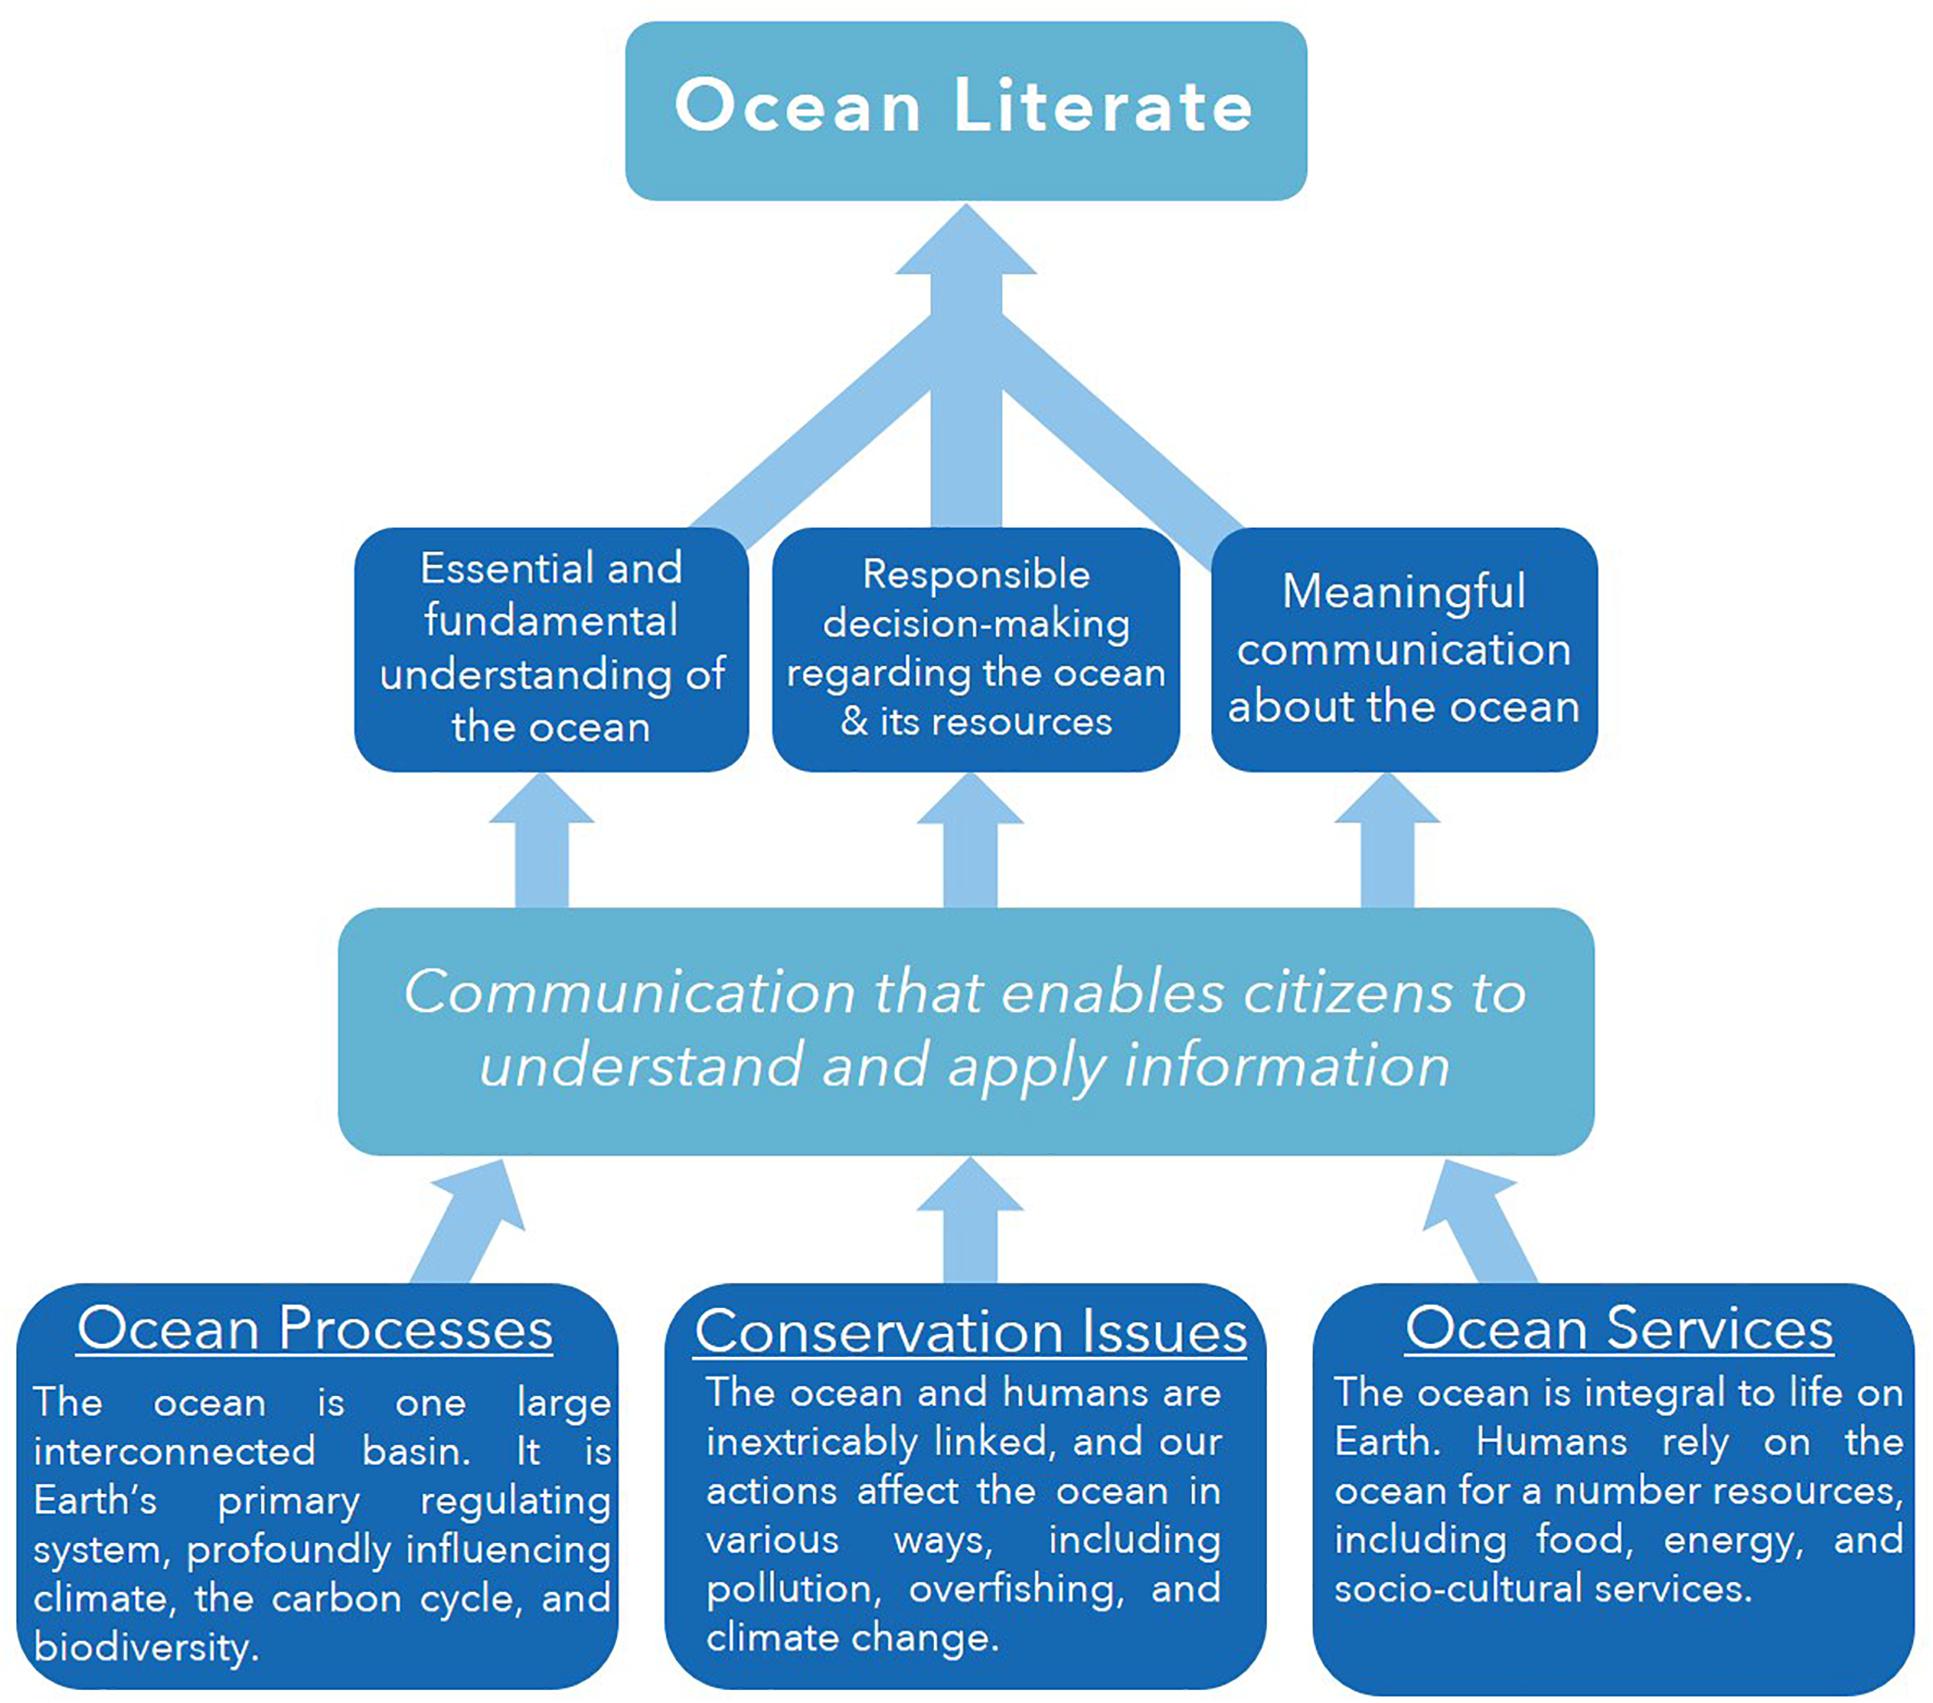
Figure 1. Ocean Literacy Development Framework. The schematic demonstrates the three themes used to identify an ocean literacy post – Ocean Processes, Conservation Issues, and Ocean Services – and highlights the three key principles that define an ocean literate person. Altogether, Figure 1 represents a conceptual framework by which marine science communication results in an ocean literate person (Schoedinger et al., 2010).
Today’s educators have a wide variety of contemporary media platforms to disseminate knowledge and increase public OL. Social networking sites (SNSs) have become an increasingly relied-upon source of information and news (Kwak et al., 2010; Stieglitz and Dang-Xuan, 2013; López-Goñi and Sánchez-Angulo, 2017). A 2017 PEW Research Center survey of United States adults reported that 67% of Americans get at least some of their news from SNSs like Twitter, Facebook, and YouTube (Kane et al., 2012; Gottfried and Shearer, 2017). In light of this, SNSs like Twitter can be powerful platforms for communicating science, including OL topics. Using the appropriate techniques, ocean scientists and research centers should be able to harness the potential of SNSs to engage with wider audiences (Fauville et al., 2015; López-Goñi and Sánchez-Angulo, 2017).
In response to the increase in SNS popularity, individual scientists, research centers, and academic institutions are now frequently turning to Twitter to publicize scientific events and journal publications (Eysenbach, 2011; Peoples et al., 2016), and to communicate with their peers about science and research (López-Goñi and Sánchez-Angulo, 2017; Didegah et al., 2018). Twitter is also perceived by many scientists and research centers as a platform that can support science communication efforts with non-scientific audiences (López-Goñi and Sánchez-Angulo, 2017; Côté and Darling, 2018b; Didegah et al., 2018). As a result, scientists from diverse disciplines have analyzed Twitter to better understand how users interact and exchange information (Kwak et al., 2010; Stieglitz and Dang-Xuan, 2013; Didegah et al., 2018). Twitter’s information-sharing process of ‘retweeting,’ in addition to its ‘like,’ ‘tag’ and ‘hashtag’ features and the ‘comment’ function, provide quantifiable metrics for investigating information diffusion on Twitter, which is constantly and continuously collated. This information is readily accessible via Twitter’s Application Programming Interface (API) (Kwak et al., 2010; Stieglitz and Dang-Xuan, 2013; López-Goñi and Sánchez-Angulo, 2017).
Twitter users can freely follow others and interact with their posts. However, interpersonal networks on Twitter are subject to homophily, a social phenomenon in which users limit their associations to individuals with similar sociodemographics, behaviors, and perspectives (McPherson et al., 2001; Aiello et al., 2012; Fauville et al., 2015). Several studies have highlighted that Twitter users preferentially follow those that are perceived to have similar interests and shared views (Yardi and Boyd, 2010; Conover et al., 2011; Faralli et al., 2015; Šćepanović et al., 2017; Côté and Darling, 2018b) – a tendency referred to as “in-group favoritism” (Everett et al., 2015). Côté and Darling (2018b) analyzed the Twitter networks of 110 scientists and found that scientists with fewer followers were mainly followed by other scientists. However, their results showed that the heterogeneity of user types following a scientist – e.g., politicians, non-profits, and journalists – drastically increased for scientists with over 1000 followers. The study concluded that tweeting scientists can indeed reach different and new audiences, so long as they work to develop a large-enough network (Côté and Darling, 2018b).
Twitter’s ‘retweet’ feature has been used in several studies as a metric to gauge the extent of a post’s reach, particularly in relation to post characteristics such as ‘hashtags,’ ‘mentions,’ photos, or online links that could potentially increase retweet frequency (Nagarajan et al., 2010; Suh et al., 2010; Yang and Counts, 2010; Macskassy and Michelson, 2011; Garimella and Weber, 2017). Conover et al. (2011) demonstrated that Twitter users predominantly retweet users with similar views, reiterating the prevalence of homophily and in-group favoritism in Twitter interactions. In addition, many studies have investigated the degree to which language influences a tweet’s engagement. For example, Stieglitz and Dang-Xuan (2013) highlighted the relevance of sentiment in Twitter posts and found that the use of emotional rather than neutral language within tweets influenced the rate of retweets.
Previous research substantiates the notion that Twitter has great potential for science communication in support of ocean literacy, while highlighting that tweeting itself may not be enough to reach intended audiences. There exists a gap in the literature concerning how often tweets from scientists are engaged by different types of users (Côté and Darling, 2018b). A better understanding of how different Twitter users interact with science-based tweets could increase scientists’ capacity to disseminate their work on Twitter and proliferate scientific literacy. Here, we explore the association between the characteristics of an OL-based tweet and users’ engagement, measured in retweets, by analyzing the Twitter account of Ireland’s Centre for Marine and Renewable Energy (MaREI). The objectives of this study are twofold:
(1) Determine if MaREI’s OL posts reach audiences that may not already be familiar with the subject matter and,
(2) Identify how MaREI’s OL posts could be adapted to increase their reach and engagement with wider and more diverse audiences.
Materials and Methods
Case Study: MaREI Centre
MaREI is a research center focusing on the marine environment, renewable energy, and climate action. The center combines the expertise of a wide range of research groups and industry partners with the shared mission of addressing the main scientific, technical and socio-economic challenges in the marine and renewable energy sectors. MaREI is a Science Foundation Ireland research center coordinated by the Environmental Research Institute (ERI) at University College Cork, Ireland, and has over 200 researchers working across 6 academic institutions collaborating with more than 45 industry partners.
MaREI is well represented on Twitter (@MaREIcentre), with just over 4,000 organically grown followers and almost 9,000 tweets to date, including 700 photos and videos (as of December 2018). MaREI regularly uses social media to promote research and to disseminate information, particularly to support societal engagement on grand challenges relating to energy, climate action and sustainable marine development. The institute’s OL Twitter posts have the ultimate goal of increasing awareness of the value of the world’s oceans and the need to safeguard them for future generations through the provision of accessible information. The center’s commitment to scientific communication and the proliferation of OL, especially on Twitter, makes it an ideal case study for the purposes of this paper.
Twitter Analytics Data and User Classification
To obtain a sufficient sample size, tweets were collated over a 21-month period, January 05, 2017–September 13, 2018, using administrative access to MaREI’s Twitter account. Our analysis focused on original tweets that expressed educational themes and analytical information associated with ocean processes, functions, and urgent conservation issues – relating to the definition of an individual that is ocean literate. Posts about other topics, e.g., promoting conferences, talks, or job opportunities, were manually filtered and omitted from final analyses. Filtering irrelevant tweets ensured results reflected user behavior associated with OL posts only. From the initial 1080 tweets collected over the defined study period, 257 demonstrated OL themes. Relevant posts were considered direct attempts from MaREI to promote OL via Twitter.
A number of previous studies have demonstrated the influence of post characteristics on retweet behavior (Stieglitz and Dang-Xuan, 2013; Hales et al., 2014; Diug et al., 2016; Brady et al., 2017; Wadhwa et al., 2017). Researchers have explored unique vectors of impact variables, resulting in a diverse range of variables being used across studies. Drawing from the literature (Suh et al., 2010; Stieglitz and Dang-Xuan, 2013; Wadhwa et al., 2017), this study selected five variables to explain users’ retweet behavior:
• Number of Photos
• Number of Mentions
• Number of Hashtags
• Number of URL links
• Semantic Orientation
In addition to demonstrating the relationship between post characteristics and overall retweet frequency, this study looked to understand how post characteristics influenced the likelihood a tweet was retweeted by users dissimilar to MaREI. Representing this relationship highlights variables important in reaching users outside of MaREI’s immediate network. To test this, a binary dependent variable, REACH, was defined by classifying users as one of two types:
• INREACH (0)
• OUTREACH (1)
MaREI’s INREACH group was defined as users whose profiles expressed similar interests (Weng et al., 2010; Hanusch and Nölleke, 2018), and therefore most likely already have some understanding of ocean-related issues, i.e., maintain a degree of ocean literacy. Based on the identity of MaREI, we identified three types of like-minded users, and then combined them into one group to make up MaREI’s INREACH faction: marine scientists, academics, and marine enthusiasts. Marine scientists were identified as users that stated they were involved in marine-related research, such as offshore wind energy, or marine ecology. We identified academics as users – either individuals or institutions of higher learning – that were associated with some kind of science, tertiary education, or possessed advanced degrees. Including academics in this way ensured our INREACH group captured the tendency of scientists and academics to operate within an “echo-chamber,” preferentially interacting with others in the same discipline or within the realms of advanced education (e.g., universities and research centers). Lastly, we identified marine enthusiasts as users that operate outside the confines of science and research, yet undoubtedly possess some level of understanding of marine-related issues given their careers, interests, and values. For example, a user whose profile bio expresses a love for sailing catamarans may not be involved in marine research or academia, yet their interest in marine activities provides an indication that they are familiar with ocean-related issues (Li et al., 2014). All users that did not fit into our INREACH group were subsequently classified as part of MaREI’s OUTREACH group (Figure 2). The binary classification scheme captures the inherent tendencies of in-group favoritism and homophily, where users implicitly favor others with similar interests and predominantly interact with others within the same network. However, it is important to note that in-group favoritism and homophily were not directly quantified in this study- such measures are beyond the scope of this paper’s objectives.
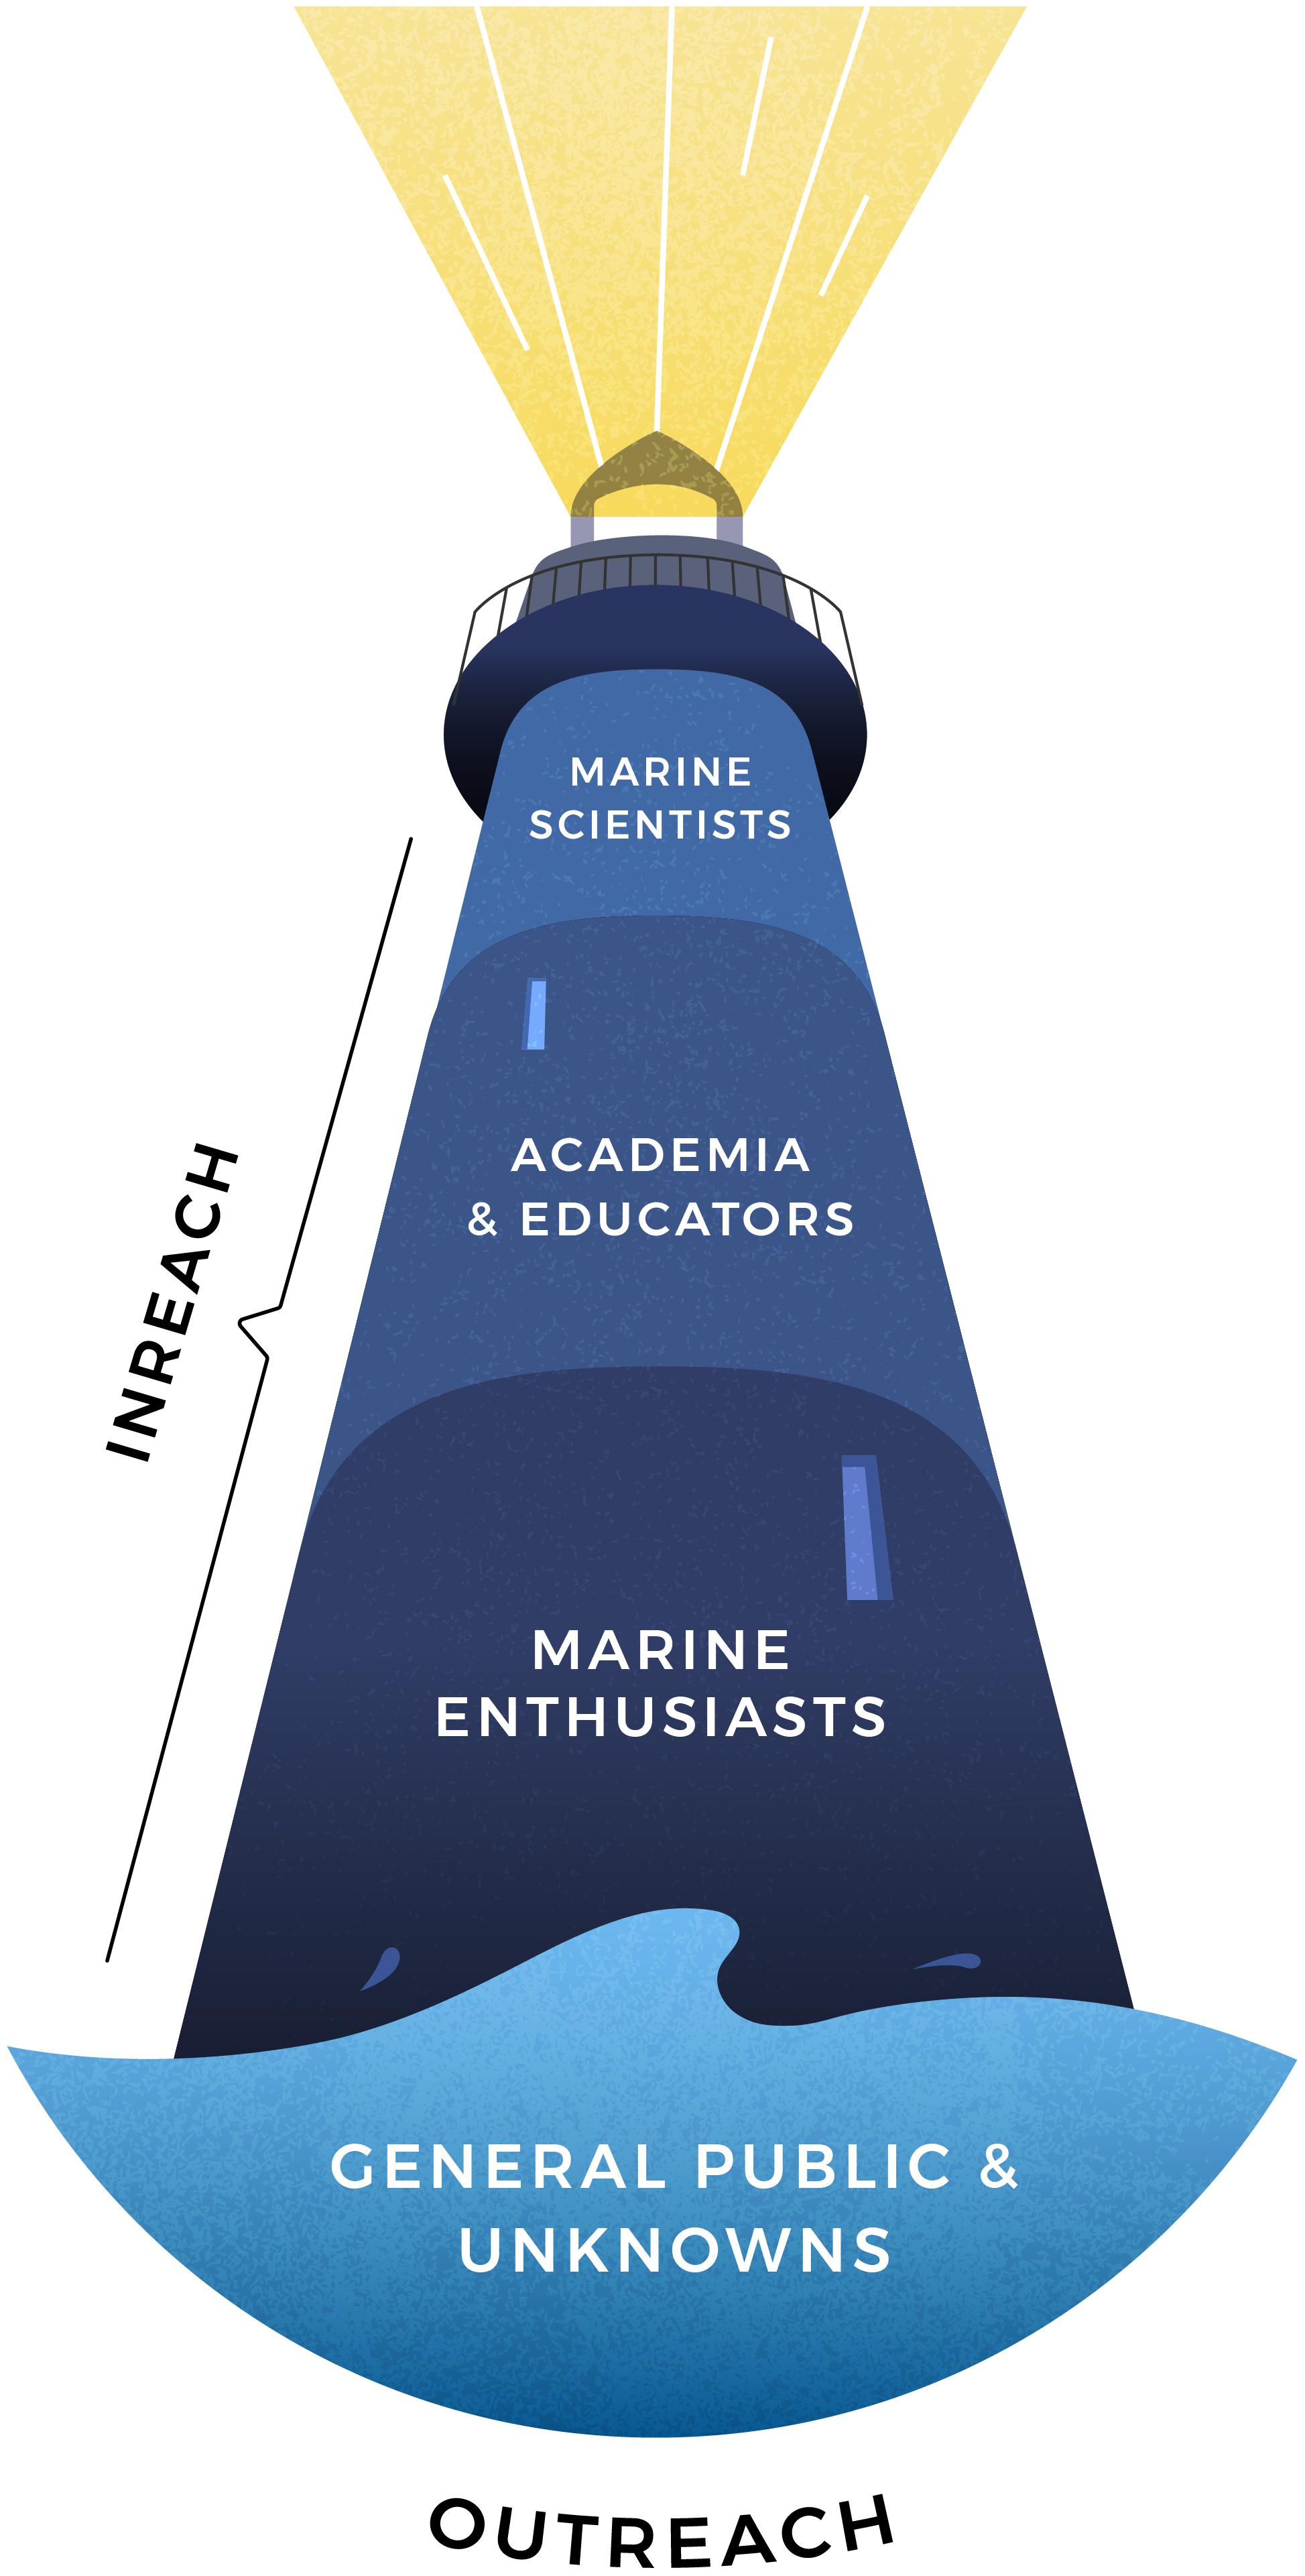
Figure 2. User classification scheme. An artistic visualization of the INREACH–OUTREACH classification, emulating the tendency of marine science communication to circulate within a defined, like-minded network (represented by the lighthouse).
To separate MaREI’s INREACH-OUTREACH groups, we obtained the biographical information publically available in the Twitter bios, usernames, and handles of each user that retweeted an OL themed post. Biographical user-related data provides one of the most accurate depictions of a user’s true identity (Wagner et al., 2012), and was therefore the primary basis for our classification scheme. Rooted in previous methodologies (Barthel et al., 2015; Priante et al., 2016; Côté and Darling, 2018a,b), we built a pre-defined keyword and expression string list using words that related to our INREACH classification group, and were therefore likely to be mentioned in a user’s biographical data (Table 1). The “stringr” package (Wickham, 2017) in R was used to filter user profiles that contained relevant keywords and expressions. The most notable additions made to Côté and Darling’s (2018a) search string were context-relevant words to improve classification accuracy. For example, in addition to including words such as ‘university’ and ‘college,’ the acronyms of prevalent universities in Ireland were also included, such as ‘UCC,’ ‘CIT,’ and ‘NUIG.’
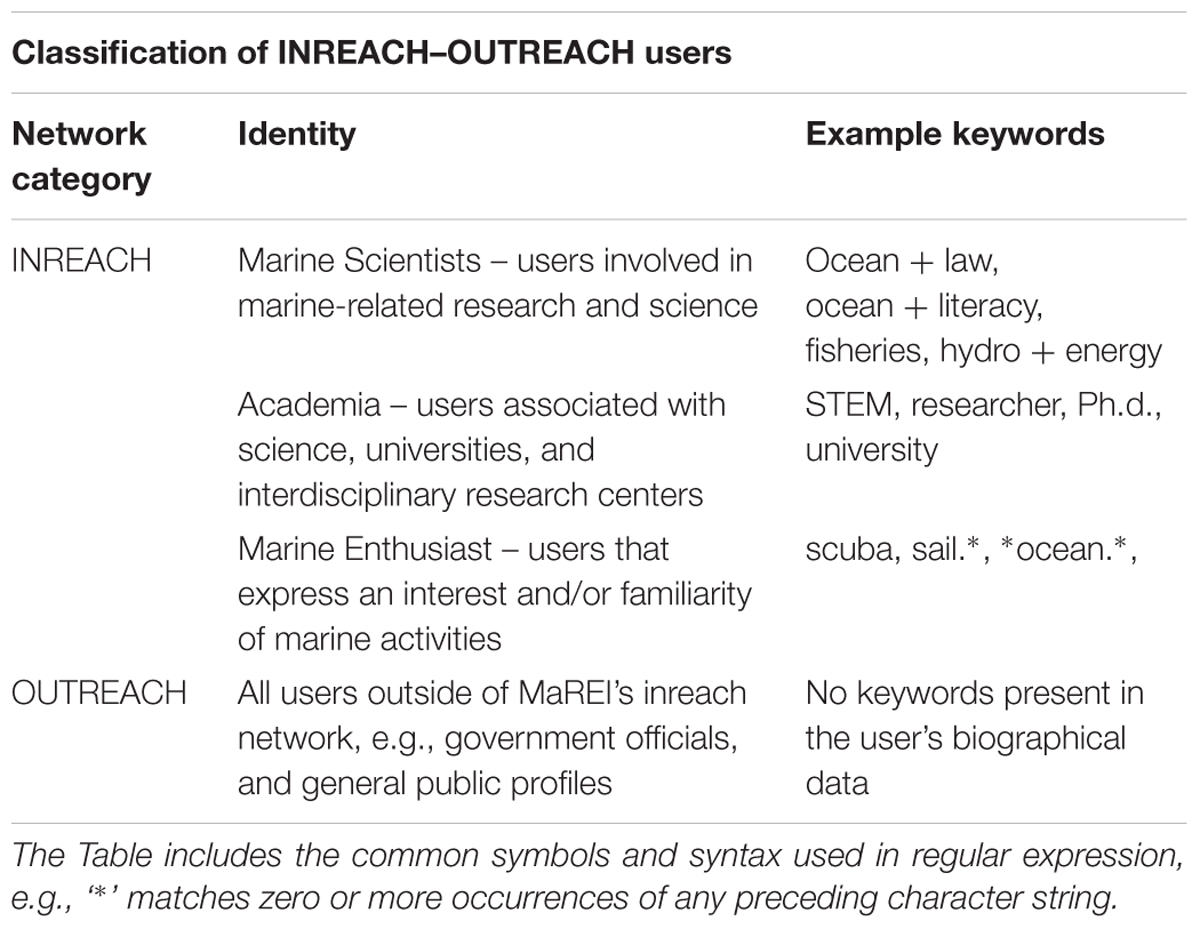
Table 1. Categorization of MaREI’s INREACH–OUTREACH groups using regular expression searches.
The accuracy of our keyword-based user classification scheme was determined by manually checking the profiles of a random subsample (∼10%) of users, from which the assigned classification was either verified or not. In our subsample, the classification scheme returned a precision rate of 85% – a success rate in line or better than similar studies that conducted user classification analysis on Twitter (Wagner et al., 2012; Barthel et al., 2015; Priante et al., 2016; Côté and Darling, 2018b; Haustein, 2018). The simple dichotomous categorization scheme greatly reduces the risk of misclassification, however, the algorithm is not without limitations. Our consortium does not account for profiles in languages other than English, nor does it detect emoticons. The greatest challenge using the keyword approach was identifying INREACH users that either did not identify themselves as such in their bios, or whose bios were left blank. We addressed this by further analyzing users’ usernames and handles, which provided a means to apply the keyword search to classify profiles with blank bios. While this method enabled the accurate classification of a number of profiles (e.g., @tonyoceanork, @irelandocean, and @newtrients_ucc) it is possible that certain OUTREACH users belonged with the INREACH group. Without directly approaching and asking users who they are, we have no means to calculate this error. That being said, previous studies have shown that Twitter users, particularly scholars, typically reveal their professional personas in their user-related data (Chretien et al., 2011; Haustein, 2018). For example, Bowman (2015) found that 87% of surveyed university professors mentioned both their place of work and their professional title in their Twitter profiles. This shows that, while imperfect, the methodology used was the most appropriate for this study’s purposes, and capitalizes on the limited information available on users’ profiles.
Sentiment Analysis
The emotional orientation of the text in each tweet was analyzed using computer-based sentiment analysis (SA). SA – also known as opinion mining – provides insight to the semantic expression of a string of words, and can be used to define the polarity of a tweet, i.e., how positive or negative a tweet is given its word choice (Medhat et al., 2014). The popularization of SNSs as platforms for information diffusion has made Twitter a common medium for the application of SA (Agarwal et al., 2011; Bollen et al., 2011; Saif et al., 2012; Ferrara and Yang, 2015a,b; Nakov et al., 2016).
There are two prominent automatic classification techniques used to extract semantic expression in short text sequences: lexicon-based analysis and machine learning analysis. Each enables a respective degree of granularity, and varies in performance given the context to which it is applied. Therefore, it is important to account for circumstance and objective when selecting the appropriate SA approach. This study used a Lexicon-based classification technique, which extracts semantic orientation using a pre-defined word list. Several word list functions exist, including AFINN, SentiStrength, and OpinionFinder (Bravo-Marquez et al., 2013). The words included in each lexicon vary, most notably regarding strong obscene words and common informal online slang, such as ‘lmao’ and ‘wtf.’ For the purposes of our analysis, AFINN was deemed the most appropriate word list function.
The AFINN sentiment lexicon was developed by Finn Årup Nielsen between 2009 and 2011, and is a manually constructed list of English words that rate valence on an integer scale between -5 (negative) and ++5 (positive). Nielsen (2011) built the initial AFINN lexicon using topical tweets about the United Nations Climate Conference (COP15) in 2009. The latest version of the lexicon contains 2477 unique words and 15 phrases, including informal Internet slang, and is currently one of the most comprehensive lexicons for Twitter-based SA (Koto and Adriani, 2015).
The polarity of a tweet was measured by summing the valence of its linguistic structure, demonstrated by:
where Pt is the overall polarity of a tweet as a function of the summation of the degree of valence of each word in a tweet. The result demonstrates the emotional orientation of a tweet, i.e., positive or negative, as well as the relative strength. Table 2 shows examples of the AFINN lexicon as applied to OL tweets collected from MaREI.
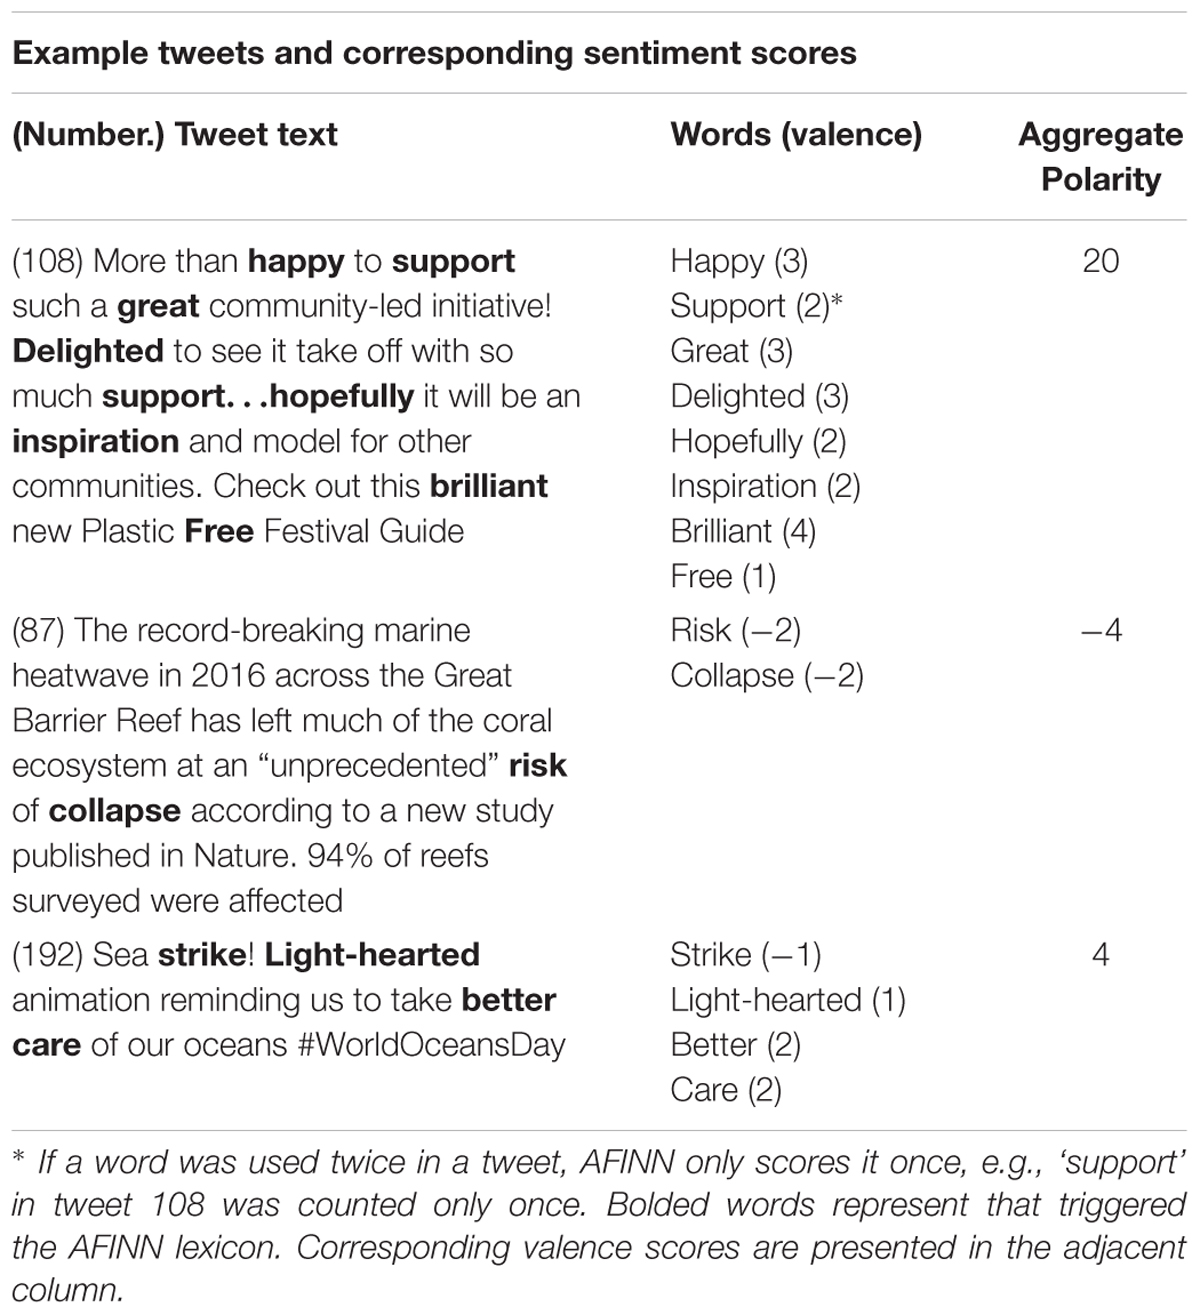
Table 2. Sample tweets demonstrating the AFINN sentiment score methodology.
Regression Analysis
Regression analysis is the primary technique for identifying variables associated with a tweet’s level of user engagement (Suh et al., 2010; Hong et al., 2011; Wadhwa et al., 2017). Regression models derive the degree of correlation between a set of covariates and a dependent variable, highlighting instances of variable dependency. To improve the accuracy of predictions, models must appropriately account for the types of variables used and any sampling bias (McCullagh, 1980). In this study, the RETWEET and REACH vectors differ in their dependent variable structure, necessitating the application of a negative binomial regression and a multivariate logistic regression, respectively. The variables used in the regression analyses are explained in Table 3.
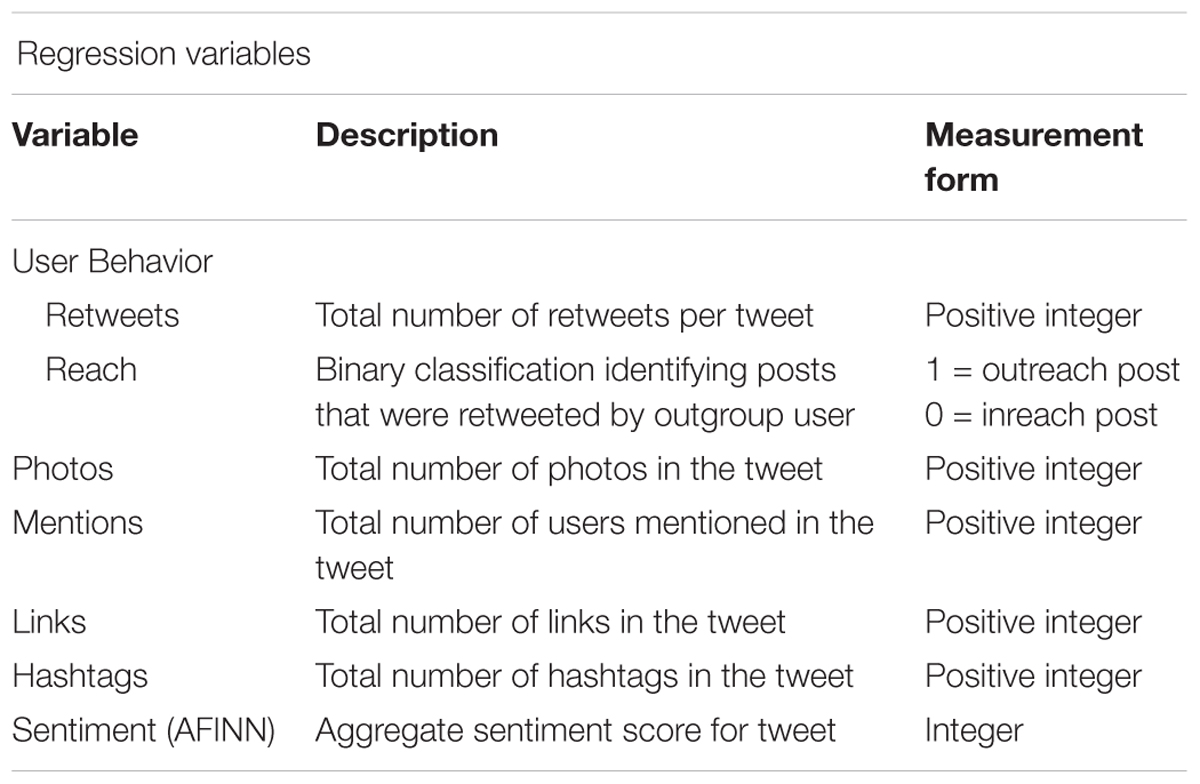
Table 3. Variables included in each regression model.
Negative Binomial
Retweet frequency for OL posts, demonstrated by the dependent variable RETWEET, represents true-event count data, where an event is expressed only as a non-negative integer value. For example, a post could not be retweeted half a number of counts, nor could it be retweeted less than zero counts. As typical with true-event count data, the RETWEET variable’s conditional variance is greater than its mean, and therefore requires an adjustment in analysis to account for over-dispersion (Gardner et al., 1995; Ver Hoef and Boveng, 2007). For these reasons, a negative binomial (NB) model was used to represent the data’s distribution. Retweet behavior was defined by the following regression:
where E(Rn) is the expected number of retweets for the study’s vector of explanatory variables as defined by a set of explanatory variables, βi.
Multivariate Logistic Regression
Multivariate logistic regression (MLR) is a robust technique for understanding the relational strength of a set of explanatory variables with a binary response (Pregibon, 1981). In this case, our binary response variable, REACH, classified collated OL themed posts based on whether or not at least one OUTREACH user retweeted that post. After consulting our user classification algorithm, which was run for every unique user that retweeted, we assigned a “1” for posts that were retweeted by at least one OUTREACH user, or a “0” for posts that were retweeted by INREACH users only (Table 3). The resulting model estimates the probability of an OL themed post being retweeted by an OUTREACH user as a function of a set of specified post characteristics.
Estimating a function’s coefficients, βj, is most commonly done using the maximum likelihood method, which derives parameter values by maximizing the probability of reproducing the values of the observed data set given a selected model (Peng et al., 2002). The following regression was used to define variables associated with a tweet’s REACH:
where E(On) is the estimated probability of reaching a user outside of MaREI’s classified INREACH group.
Results
User Classification
A total of 444 unique users retweeted OL posts from MaREI over the defined study period. Using our pre-defined keyword list, we identified 289 (65%) users as part of MaREI’s inreach group, and 154 (35%) users as part of the outreach group. Table 4 provides examples of classified users, highlighting the words in each profile that triggered the algorithm’s demarcation of INREACH (TRUE). Profiles that did not contain a keyword were labeled as OUTREACH (FALSE).
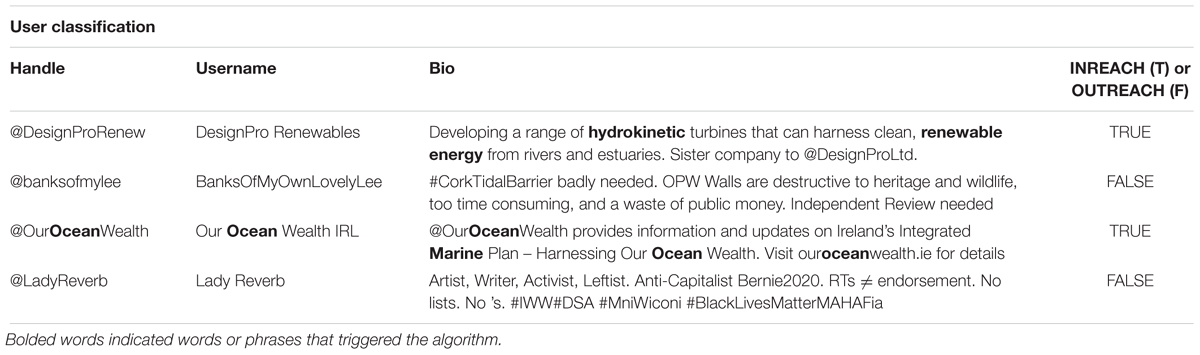
Table 4. Examples of the users and the classification scheme.
Descriptive Statistics
Table 5 shows the descriptive statistics for the variables used in the regression analyses. MaREI’s mean retweet frequency per OL post from January 2017 to September 2018 was 3.71. Outgroup members engaged with less than half (40%) of the analyzed tweets, demonstrating that a majority of MaREI’s Twitter engagement with OL themed posts came from like-minded users. The typical OL tweet was comprised of 1.03 hashtags, 2.06 mentions, and used predominantly positive language demonstrated by a mean sentiment score of 1.58. A mean number of 0.37 photos and 0.49 links were posted across all 257 tweets analyzed.
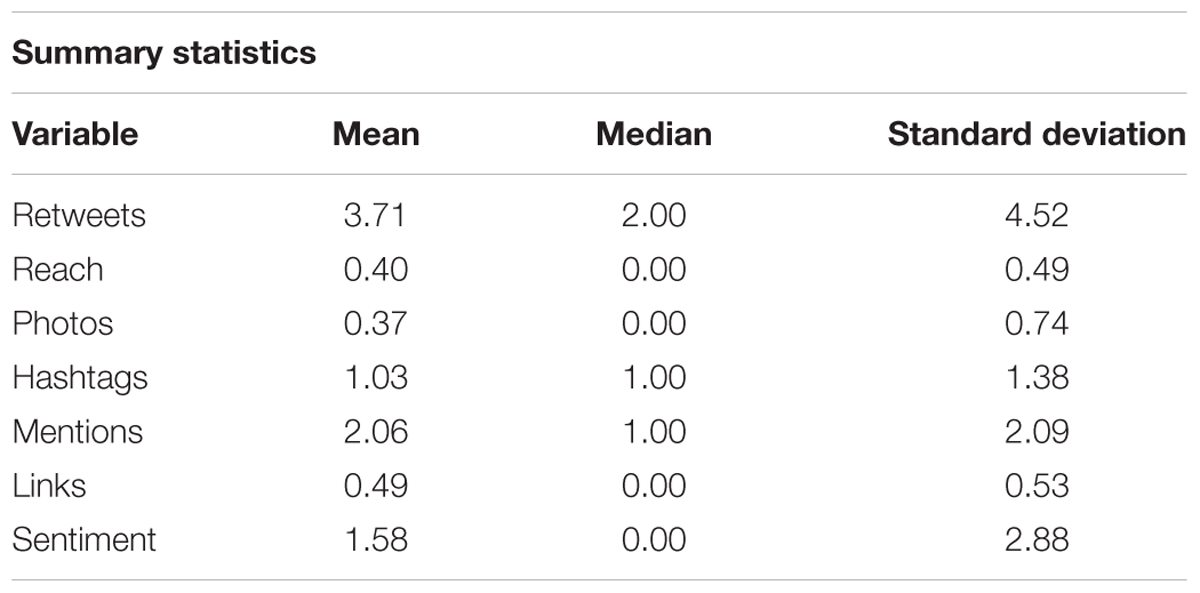
Table 5. Summary statistics of variables used in the regression analyses.
Table 6 presents the summary statistics for OL tweets as related to the dependent variable REACH. The results show substantial variation in post characteristics for tweets that were retweeted by outreach users, versus tweets that were not. Overall, OL posts that were retweeted by outreach users were retweeted on average 6.76 times, while posts retweeted by only inreach users were retweeted 1.76 times. We found the average numbers of photos, mentions, links, and sentiment to be higher for posts that were retweeted by outgroup users. Hashtags were the only characteristic that did not exhibit this relationship; posts with more hashtags were, on average, retweeted less frequently by outreach users.
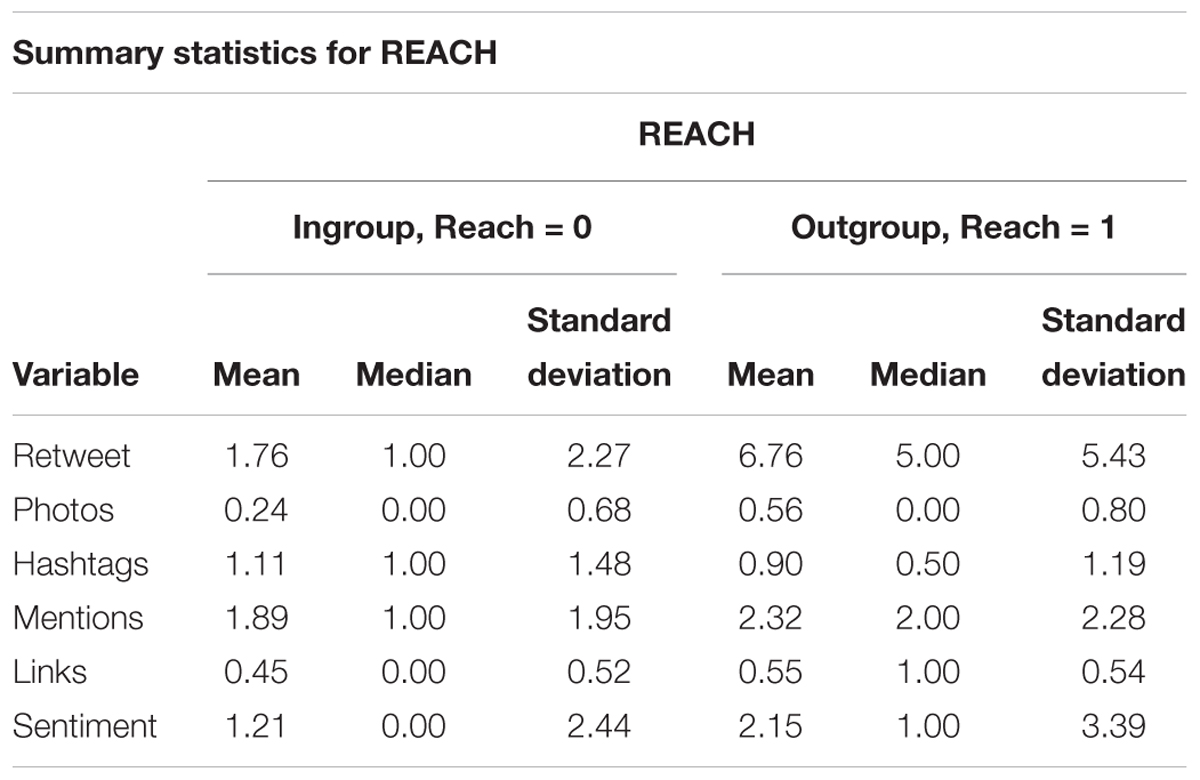
Table 6. Summary statistics based on the dichotomous dependent variable REACH used to understand tweet engagement by MaREI’s outgroup users.
Regressions Results
Tables 7, 8 present the results of the regression analyses. Table 7 displays the results of the NB regression for RETWEETS, while Table 8 displays the results of the MLR for REACH. The estimated coefficients for variables, βj, are presented alongside their z-value. Z-values were used to calculate corresponding p-values, highlighting the relational significance of a predictor variable to the outcome variable within statistically appropriate confidence intervals. The validity of each model is presented under Diagnostics.
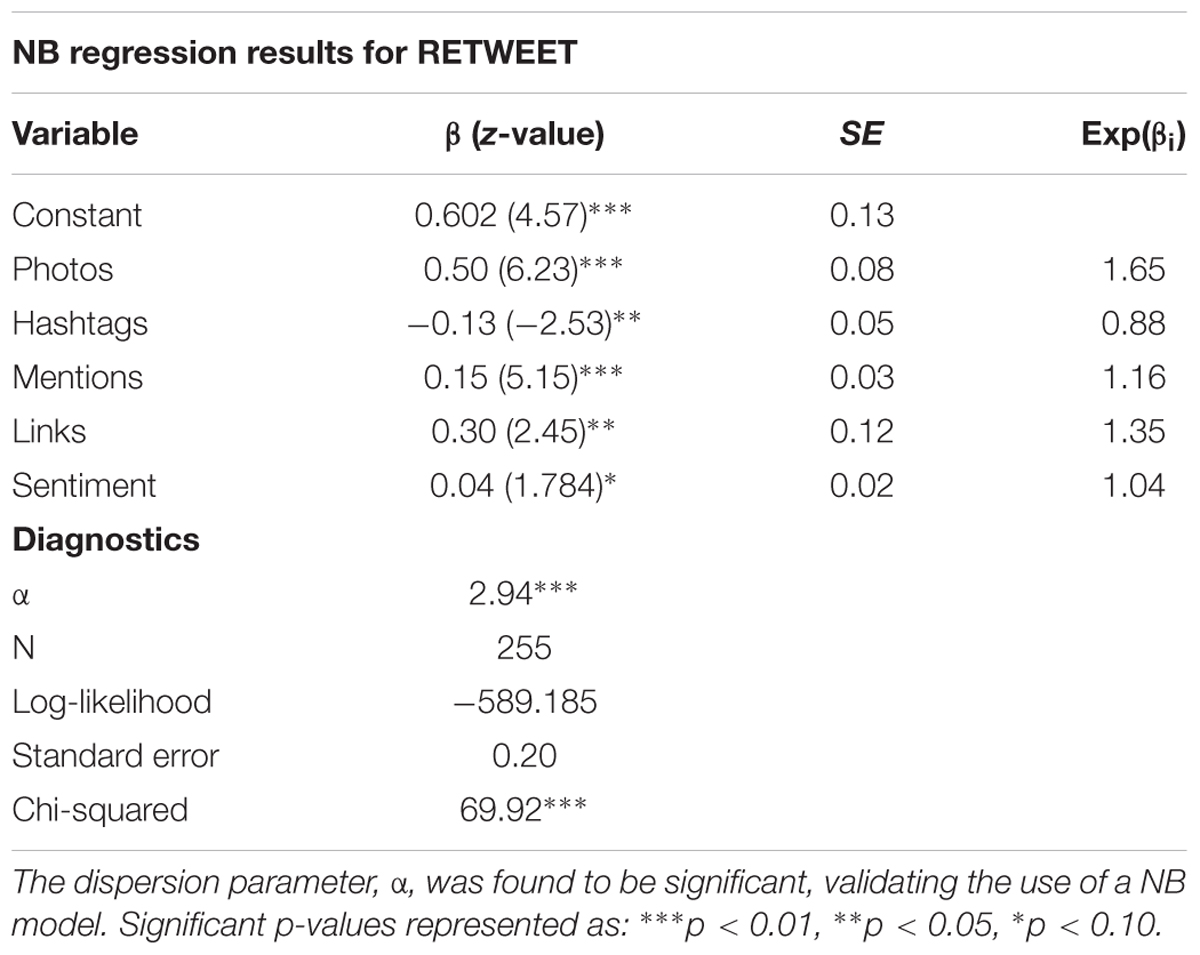
Table 7. Predictor variables presented alongside their z-values and standard errors (SE).
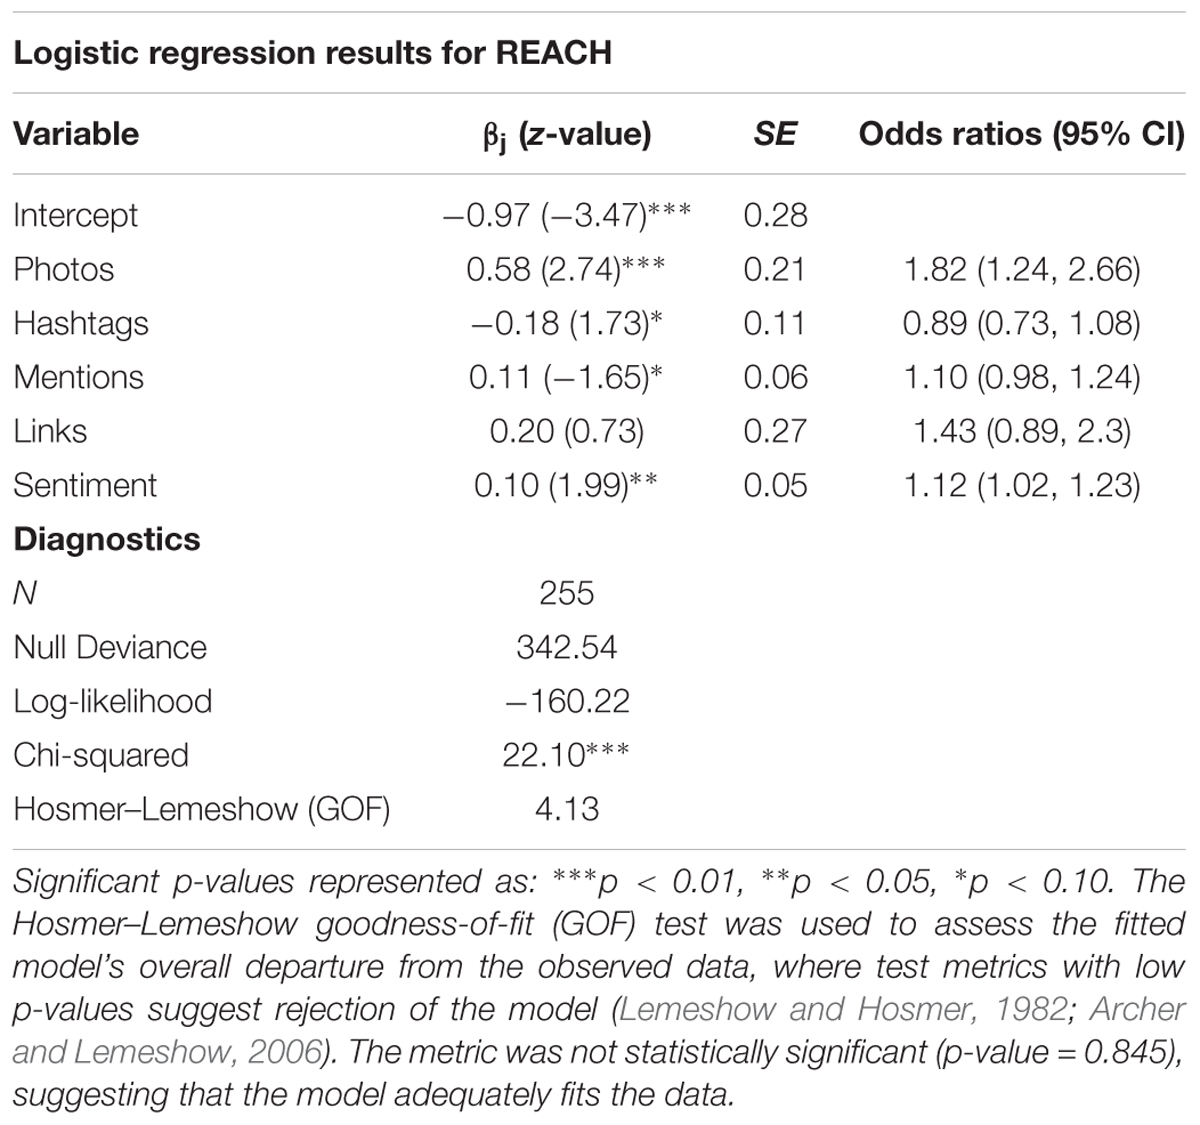
Table 8. Logistic regression results for the dichotomous outcome variable REACH.
Negative Binomial
All variables used to estimate E(Rn) were significant at or above the 10% level. Coefficients for Photos (β = 0.50) and Mentions (β = 0.15) were positive and statistically significant at p < 0.01. Links (β = 0.30) and Sentiment (β = 0.04) also demonstrated a positive relationship with RETWEET frequency, with significance levels of p < 0.05 and p < 0.1, respectively. The only negative coefficient estimated by the model was for Hashtags (β = -0.13, p < 0.05).
The estimated coefficients allude to the magnitude of each independent variable’s effect on the model’s outcome variable. Interpreting this relationship first requires an exponential transformation of the coefficients, exp(βi), given the log link function used in the negative binomial model (Eq. 2). The exp(βi) value demonstrates the relative percent increase in RETWEETS for every incremental increase in the corresponding variable, holding all other variables constant. For example, a one-unit increase in the number of photos included in a tweet is expected to increase RETWEETS by 65%. We found that a one-unit increase for each predictor variable is expected to increase RETWEETS, except, for Hashtags.
Multivariate Logistic Regression
The results of the logistic regression identify predictor variables that significantly influenced the likelihood of a tweet being retweeted by an outreach user. Photos (β = 0.58, p < 0.01), Sentiment (β = 0.10, p < 0.05) and Mentions (β = 0.11, p < 0.1) were found to positively influence the likelihood of a post being retweeted by an outreach user. Our model estimated no statistical influence from the number of Links present in a post (β = 0.20, p > 0.1). We found that an increase in the number of Hashtags (β = -0.18, p > 0.1) decreased the likelihood of an outreach user retweeting an OL post.
Table 8 also displays the odds ratios for each predictor, and were calculated by exponentiation estimates of βj. In this instance, odds ratios represent how the odds of a post being retweeted by an outreach user change for every incremental increase in a given variable, holding all other variables constant. Odds ratios greater than 1 describe positive relationships, while odds ratios less than 1 demonstrate negative relationships. Meaningful interpretations of odds ratios require corresponding 95% confidence intervals to be fully above or below one (Peng et al., 2002; O’Brien and Dunson, 2004). Therefore, only variables found significant at p < 0.05 – Photos and Sentiment – can be used to confidently explain changes in the odds of a post being retweeted by an outreach user.
The odds ratios calculated by the logistic regression model show that for every incremental increase in the number of photos added to a post, the probability of an outgroup user retweeting a post from MaREI increased by approximately 82%. The Sentiment predictor mirrored this positive relationship. For every incremental increase in the positivity polarity of sentiment added to a post, the probability of an outgroup user retweeting a post from MaREI increased by 12%.
Discussion
Online social media platforms like Twitter have redefined communicative infrastructure. Over 500 million tweets are sent every day (Newman, 2017), resulting in a prodigious exchange of data between users at any given time. Twitter is now a primary communication tool for businesses, news outlets, celebrities, and heads of state. Despite Twitter’s growing societal influence, academia has been slow to integrate this novel communication technology. Initial reluctance stems from many scientists’ views that Twitter is ‘a waste of time,’ provides no professional benefits, and may in fact harm one’s scholarly reputation (Collins et al., 2016). However, recent surveys show that more and more academics are joining Twitter to engage with diverse audiences (Collins et al., 2016). It is therefore necessary for those in academia to understand how to utilize the features of Twitter to communicate science to non-scientific audiences, thereby harnessing Twitter’s capacity as a tool for science outreach.
Our analysis of MaREI’s Twitter audience, or the users that engagement with MaREI’s tweets, found that 65% of MaREI’s OL post retweeters were INREACH users, while the remaining 35% of retweeters were OUTREACH users. These findings reflect those of Côté and Darling (2018a), who found that, on average, 60% of scientists’ followers on Twitter were other scientists, while the remaining 40% were non-academic scientists. Our results indicate that MaREI’s Twitter account has the capacity to reach beyond the ‘ivory tower,’ but the center’s OL posts may be subject to a degree of network homophily, where posts predominantly reach audiences that may already be highly ocean literate. For OL posts, retweet frequency with the outreach audience was indeed less than half (40%) of overall retweets. This reiterates the finding that a majority of MaREI OL posts predominantly reached the center’s peers, and thereby remained in the ‘ivory tower’ with audiences that were considered to be already familiar with the subject matter.
RETWEETs
The literature substantiates that the characteristics of retweeted posts are significantly different than posts that are not retweeted (Suh et al., 2010). Our RETWEET results support these studies, revealing similar trends in the relative influence of post characteristics on users’ retweet behavior, while also highlighting an irregular negative influence from Hashtags on retweet frequency. By applying a zero-truncated NB model, we found Photos [exp(β) = 1.65, p < 0.01], Mentions [exp(β) = 1.16, p < 0.01], Links [exp(β) = 1.35 p < 0.05], and Sentiment [exp(β) = 1.04, p < 0.10] to be significantly and positively correlated with the number of times a post was retweeted. A similar study by Wadhwa et al. (2017) analyzed the Twitter account of the American Journal of Neuroradiology (@TheAJNR) and found that the use of a photo was the most influence tweet characteristic in increasing user engagement (58.02% higher engagement rate than posts without photos). Interestingly, very few studies have examined the correlation between the number of photos in a tweet and the frequency it is retweeted. To our knowledge, this study is the first to demonstrate that an incremental increase in the number of photos used in a post increases the probability of that post being retweeted. As Twitter permits a maximum number of four photos per post, the results strongly suggest that using this feature to the allowed maximum number for a post is worthwhile. The authors, however, would admit that if there were no limit, we would not expect this relationship to continue, and that the quality and type of images posted most likely influences retweet behavior, as demonstrated on other social media platforms like Instagram (Hu et al., 2014).
A number of studies have focused on how the use of Mentions, Links (sometimes measured as URLs), and Sentiment affect retweets. For example, Suh et al. (2010) conducted an extensive exploratory analysis of 10,000 random tweets to understand features associated with posts’ “retweetability.” Using logistic regression analysis, the study found higher retweet probabilities for tweets containing URLs (β = 0.73, p < 0.01) and Hashtags (β = 1.33, p < 0.01), yet a marginally lower retweet probability for tweets containing Mentions (β = -0.29, p < 0.10). Our results show a similar positive relationship with URLs (Links), however, we identified the opposite relationship between retweets, and Hashtags and Mentions. This may be a result of our non-random collation of tweets, having focused on a single Twitter account (@MaREIcentre), as well as a specific type of tweet (OL themed posts). However, Suh et al. (2010) note that, “not all popular hashtags in tweets are popular in retweets,” suggesting that the type of hashtag used matters for a tweet’s retweetability. This provides interesting context regarding the negative correlation for Hashtags found in our study. Hashtags are used to facilitate the categorization of posts and effectively group tweets with similar content. Therefore, posts with certain hashtags may be subject to in-group favoritism, causing certain users disengage if too many hashtags are included that are perceived as unfamiliar. Science based accounts need to be aware of the hashtags they are using, making sure not to alienate large populations with technical jargon.
Our results also demonstrate that positive sentiment, or positive emotional valence, has a significant positive influence on retweet probability. The integer scale of the SA used in this study allowed us to not only test the influence of overall sentiment, but the polarity of a tweet as well, i.e., the positivity or negativity of a tweet’s language. We found a moderately significant positive relationship (β = 0.04, p < 0.10) between a post’s sentiment score and its retweet frequency, indicating that users were more likely to retweet OL posts if they used positive language as opposed to negative language. Stieglitz and Dang-Xuan (2013) found similar relationships concerning emotions and political information diffusion on Twitter. The study analyzed a set of tweets regarding German state parliament elections in 2011, and found a positive correlation between the amount of sentiment (positive or negative) in political Twitter messages and the frequency and speed at which a post was retweeted. Interestingly, the study found no support for the notion of negativity bias (Baumeister et al., 2001; Rozin and Royzman, 2001), regarding retweet quantity and retweet speed, stating that posts with negative content were not retweeted more frequently or more quickly than posts with positive content. Negativity bias has been shown to be particularly strong in the domain of news. Yet, outside of that domain, findings from other studies show that the opposite may hold true (Hansen et al., 2011). The integer scale of the SA used in this study allowed us to not only test the influence of overall sentiment, but the polarity of a tweet as well, i.e., positivity or negativity of its language. This allows us to extend similar claims refuting the notion of negativity bias, specifically for science based tweets. We extend our discussion of sentiment and science communication in the following section, specifically as to how it relates to our REACH variable.
REACH
In addition to analyzing users’ overall retweet behavior, we analyzed the degree to which retweet behavior differed between users inside and outside of MaREI’s immediate network. This provided a means to investigate how post characteristics influenced MaREI’s ability to use Twitter as a medium for ocean literacy outreach. We found post characteristics differed substantially for retweets by outreach audiences versus those retweeted by the inreach group. The average number of photos, mentions, links, and positive sentiment was higher for retweets by the outreach audience. In addition, the OL posts retweeted by outreach audience members gained more momentum within the wider Twitter network, with an average retweet rate of 6.76 times; the average retweet rate resulting from inreach interaction was only 1.76 times. This suggests not only that the center can indeed tweet with purpose to reach outreach audiences by adjusting future OL post characteristics accordingly, but that if OL posts initially reach the intended audiences, the posts have a greater chance to spread to wider audiences. The analyses revealed that the inclusion of photos and positive sentiment significantly increased the probability that outreach audiences would retweet a post.
Using logistic regression analysis, we found Photos and Sentiment significantly increased the probability of an OL themed post being retweeted by an OUTREACH user. Photos increased the probability of a retweet from an outreach user by 82% (p < 0.01) for every additional photo added to a post, holding all other variables constant. This finding supports the current literature on the positive relationship between the presence of a photo and retweet frequency (Wadhwa et al., 2017, 2018), however, sheds new light on the ability of photos to increase Twitter engagement with outreach users.
A similar positive relationship was found for the inclusion of positive sentiment, independently increasing the probability of a retweet by 12% (p < 0.05) for every incremental unit increase. As discussed above, our results support the findings of a number of previous studies (Bravo-Marquez et al., 2013; Stieglitz and Dang-Xuan, 2013; Hales et al., 2014; Ferrara and Yang, 2015a,b; Brady et al., 2017; Garimella and Weber, 2017), demonstrating that emotions play a key role in retweet behavior. In addition, this study presents novel insight into how positive language can increase the probability of a tweet being retweeted by outreach users, extending the knowledge base related to the use of SNSs as a tool for science communication, public engagement, and outreach.
Given the increasing influence of social media as a vector for information diffusion, our analyses have far reaching implications for improving the public’s engagement with environmental issues, such as marine pollution and climate change. Most notably, our results demonstrate that Twitter posts using positive language are more likely to be retweeted, as well as more likely to be retweeted by outreach users. Our findings support multiple studies concerning pro-environmental behavior, indicating that people are more likely to respond to positive language than negative language. Media representations of environmental issues like climate change are overwhelmingly discussed using fear appeals and alarmism (O’Neill and Nicholson-Cole, 2009), often communicated in the context of punctuated dramatic events. As discussed above, several studies have found that using negative sentiment, such as fear appeals and apocalyptic dialog, is unlikely to influence environmental behavior long-term (Lowe et al., 2006). Rather, individuals are more likely to respond with increasing dissonance, rationalizing such issues as impersonal and distant in both time and space (O’Neill and Nicholson-Cole, 2009). Furthermore, Hastings et al. (2004) found that excessive fear appeals may be suspect to a law of diminishing returns, sometimes referred to as apocalypse fatigue (Nordhaus and Shellenberger, 2009), where individuals become desensitized to the severity of an issue.
Conclusion
The integration of Twitter in academia is beneficial for scientists’ careers (Eysenbach, 2011), and provides a unique platform for two-way interactions between researchers and the general public (Smith, 2015; Ke et al., 2017). Scientists that harness the networking power of Twitter have the potential to proliferate science literacy with a unique degree of accessibility. However, to our knowledge, no studies have looked to understand how the attributes of science-based tweets influence scientists’ ability to engage with diverse audiences. This study provides a foundation for understanding how to facilitate effective communication between academia and the general public on Twitter. By looking only at posts related to Ocean Literacy, our results capture the general public’s behavioral responses on social media to science-based tweets. Using the MaREI Twitter account as a case study, we demonstrate that the inclusion of photos and positive sentiment independently increase the likelihood of engaging with an outreach user by 82 and 12%, respectively. These results imply that simply tweeting scientific information does not necessarily constitute effective communication, and that the attributes of a post significantly impact scientists’ ability to engage with individuals outside of their immediate network.
As discussed, our results have several implications concerning the use of Twitter for ocean literacy, science communication, and academia’s overall engagement with different user types on social media. Previous studies have looked to classifying types of users on twitter, and have looked to identifying what types of posts users interact with. However, no studies, to our knowledge, have combined these approaches to understand how different Twitter user types respond to different types of posts on twitter, particularly concerning posts with science based content. This is especially important for academic users on twitter that want to engage with wider audiences.
Furthermore, the authors cannot overstate the significance of this study’s results relating to the importance of using photos and positive sentiment in communicating science with the intention of engaging outreach users. Scientific literacy is a necessary component of a just, functional, and democratic society (Lehr, 2007), yet, historically, science communication avenues have been relatively inaccessible – often confined to the upper echelons of academia. For these reasons, the importance of studies that focus on improving science communication, such as ours, transcends disciplines, maintaining the notion that informed citizens ‘make democracy work (Milner, 2002).’ The mass communicative integration of SNSs like Twitter provides a fast, easy, and widely accessible platform for academics to engage with members of the public. Many researchers advocate for the use of Twitter in academic environments, especially as a means for science communication (Kassens-Noor, 2012; Shiffman, 2012; Mckay et al., 2014; López-Goñi and Sánchez-Angulo, 2017), yet there are few examples of its use in the literature, and little to no peer-reviewed information on how to improve science outreach on Twitter. Here, we present novel information regarding the ways science outreach on Twitter can be improved through the use of photos and positive language.
As environmental issues continue to move to the forefront of societal discourse, scientists, now more than ever, must communicate their research in ways that produce palpable change. This study provides the first analysis of scientists’ ability to communicate ocean literacy themes to different user types on Twitter. Further research is needed to better understand how, or if, interactions on Twitter correspond to behavioral changes in real life. For example, what evidence is there to suggest that interactions on Twitter concerning environmental issues, such as marine litter, actually increase pro-environmental behaviors in real life? This should be further supplemented by examining the effectiveness of different SNSs, e.g., Twitter vs. Facebook, in disseminating scientific information to different audiences. Lastly, our results concerning hashtags and outreach user engagement do not support previous findings, and merit further investigation, specifically regarding the ways in which the use of Hashtags may facilitate in-group favoritism and homophily.
Limitations
While the authors attempted to optimize this study’s methodology, there are nevertheless limitations worth recognizing. Firstly, the study’s focus on a single user’s profile (@MaREIcentre), along with a single topic (ocean literacy) may limit the generalizability of our results. We highly recommend further research be done to improve the overall understanding of how science-based Twitter accounts engage with members of the wider public.
Secondly, our binary INREACH–OUTREACH classification system relied solely on information available in users’ bio, handle, and username. While we addressed these issues as best we could, misclassification remained an issue. Therefore, we highly recommend future research employ machine learning techniques to more accurately identify scientists on twitter. Such methods incorporate latent user attributes – including post behavior – that would likely improve the accuracy of user classification, and provide further insight into how certain user groups interact with one another on Twitter.
Data Availability Statement
The raw data supporting the conclusions of this manuscript will be made available by the authors, without undue reservation, to any qualified researcher.
Author Contributions
KK, JB, and AD conceived and explored the idea together. KK led work on literature review and discussion and conclusion. JB led work on methods and results, and contributed significantly to discussion and conclusions. AD contributed to all aspects of the paper and designed both figures.
Funding
This research was funded through the MaREI Centre, who also provide the funds for the open access publication fees.
Conflict of Interest Statement
The authors declare that the research was conducted in the absence of any commercial or financial relationships that could be construed as a potential conflict of interest.
Acknowledgments
We would like to thank MaREI’s communications team for their tremendous help with collecting posts from MaREI’s Twitter account. We especially thank Ms. Dee O’ Connor, MaREI marketing and communications Manager, and Ms. Aoife Deane, MaREI Public Engagement & Communications Manager, for the information they provided regarding the operational scope of MaREI.
References
Agarwal, A., Xie, B., Vovsha, I., Rambow, O., and Passonneau, R. (2011). “Sentiment analysis of Twitter data,” in Proceedings of the Workshop on Languages in Social Media (Stroudsburg, PA: Association for Computational Linguistics), 30–38.
Aiello, L. M., Barrat, A., Schifanella, R., Cattuto, C., Markines, B., and Menczer, F. (2012). Friendship prediction and homophily in social media. TWEB 6, 9:1–9:33. doi: 10.1145/2180861.2180866
Archer, K. J., and Lemeshow, S. (2006). Goodness-of-fit test for a logistic regression model fitted using survey sample data. STATA J. 6, 97–105. doi: 10.1177/1536867X0600600106
Barthel, S., Tönnies, S., Köhncke, B., Seihndel, P., and Balke, W. T. (2015). “What does Twitter measure?: influence of diverse user groups in altmetrics,” in Proceedings of the 15th ACM/IEE-CS Joint Conference on Digital Libraries (New York, NY: ACM), 119–128. doi: 10.1145/2756406.2756913
Baumeister, R. F., Bratslavsky, E., Finkenauer, C., and Vohs, K. D. (2001). Bad is stronger than good. Rev. Gen. Psychol. 5, 323–370. doi: 10.1037/1089-2680.5.4.323
Bollen, J., Mao, H., and Pepe, A. (2011). Modeling public mood and emotion: twitter sentiment and socio-economic phenomena. ICWSM 11, 450–453.
Bowman, T. (2015). Investigating the Use of Affordances and Framing by Scholars to Manage Personal and Professional Impression on Twitter. Bloomington, IN: Indiana University.
Brady, W. J., Wills, J. A., Jost, J. T., Tucker, J. A., and Van Bavel, J. J. (2017). Emotion shapes the diffusion of moralized content in social networks. Proc. Natl. Acad. Sci. U.S.A. 114, 7313–7318. doi: 10.1073/pnas.1618923114
Bravo-Marquez, F., Mendoza, M., and Poblete, B. (2013). “Combining strengths, emotions and polarities for boosting Twitter sentiment analysis,” in Proceedings of the Second International Workshop on Issues of Sentiment Discovery and Opinion Mining (New York, NY: ACM), 2. doi: 10.1145/2502069.2502071
Cava, F., Schoedinger, S., Strang, C., and Tuddenham, P. (2005). “Science content and standards for ocean literacy: a report on ocean literacy,” in Proceedings of the National Geographic Society’s Oceans for Life Initiative and the NOAA Ocean Literacy Workshop. Available at: http://www.coexploration.org/oceanliteracy/documents/OLit2004-05_Final_Report.pdf
Chen, C.-L., and Tsai, C.-H. (2016). Marine environmental awareness among university students in Taiwan: a potential signal for sustainability of the oceans. Environ. Educ. Res. 22, 958–977. doi: 10.1080/13504622.2015.1054266
Chretien, K., Azar, J., and Kind, T. (2011). Physicians on Twitter. JAMA 305, 566–568. doi: 10.1001/jama.2011.68
Collins, K., Shiffman, D., and Rock, J. (2016). How are scientists using social media in the workplace? PLoS One 11:e0162680. doi: 10.1371/journal.pone.0162680
Conover, M., Ratkiewicz, J., Francisco, M. R., Gonçalves, B., Menczer, F., and Flammini, A. (2011). Political polarization on Twitter. ICWSM 133, 89–96.
Côté, I. M., and Darling, E. S. (2018a). Data from; supplementary information - scientits on Twitter: preaching to the choir or singing from the rooftops? FACETS 3, 682–694. doi: 10.1139/facets-2018-0002
Côté, I. M., and Darling, E. S. (2018b). Scientists on Twitter: preaching to the choir or singing from the rooftops? FACETS 3, 682–694. doi: 10.1139/facets-2018-0002
Didegah, F., Mejlgaard, N., and Sørensen, M. P. (2018). Investigating the quality of interactions and public engagement around scientific papers on Twitter. J. Informetr. 12, 960–971. doi: 10.1016/j.joi.2018.08.002
Diug, B., Kendal, Y., and Ilic, D. (2016). Evaluating the use of Twitter as a tool to increase engagement in medical education. Educ. Health 29, 223–230. doi: 10.4103/1357-6283.204216
Easman, E. S., Abernethy, K. E., and Godley, B. J. (2018). Assessing public awareness of marine environmental threats and conservation efforts. Mar. Policy 87, 234–240. doi: 10.1016/j.marpol.2017.10.030
Everett, J. A., Faber, N. S., and Crockett, M. (2015). Preferences and beliefs in ingroup favoritism. Front. Behav. Neurosci. 9:15. doi: 10.3389/fnbeh.2015.00015
Eysenbach, G. (2011). Can tweets predict citations? Metrics of social impact based on Twitter and correlation with traditional metrics of scientific impact. J. Med. Internet Res. 13:e123. doi: 10.2196/jmir.2012
Faralli, S., Stilo, G., and Velardi, P. (2015). “Large scale homophily analysis in Twitter using a twixonomy,” in Proceedings of the 24th International Conference on Artificial Intelligence, 2015 IEEE International Congress on (IJCAI) (Buenos Aires: AAAI Press), 2334–2340.
Fauville, G., Dupont, S., Von Thun, S., and Lundin, J. (2015). Can Facebook be used to increase scientific literacy? A case study of the Monterey bay aquarium research institute Facebook page and ocean literacy. Comput. Educ. 82, 60–73.
Ferrara, E., and Yang, Z. (2015a). Measuring emotional contagion in social media. PLoS One 10:e0142390. doi: 10.1371/journal.pone.0142390
Ferrara, E., and Yang, Z. (2015b). Quantifying the effect of sentiment on information diffusion in social media. PeerJ Comput. Sci. 1:e26. doi: 10.1371/journal.pone.0142390
Gardner, W., Mulvey, E. P., and Shaw, E. C. (1995). Regression analyses of counts and rates: Poisson, overdispersed Poisson, and negative binomial models. Psychol. Bull. 118, 392–404. doi: 10.1037/0033-2909.118.3.392
Garimella, K., and Weber, I. (2017). “A long-term analysis of polarization on Twitter,” in Proceedings of the 11th International Conference on Web and Social Media, ICWSM 2017 (Buenos Aires: AAAI PRESS), 528–531.
Gottfried, J., and Shearer, E. (2017). Americans’ Online News Use is Closing in on TV News Use. Available at: http://www.pewresearch.org/fact-tank/2017/09/07/americans-online-news-use-vs-tv-news-use/
Hales, S. B., Davidson, C., and Turner-Mcgrievy, G. M. (2014). Varying social media post types differentially impacts engagement in a behavioral weight loss intervention. Transl. Behav. Med. 4, 355–362. doi: 10.1007/s13142-014-0274-z
Hansen, L. K., Arvidsson, A., Nielsen, F. A., Colleoni, E., and Etter, M. (2011). “Good friends, bad news – affect and virality in Twitter,” in Future Information Technology, eds J. J. Park, L. T. Yang, and C. Lee (Berlin: Springer),34–43.
Hanusch, F., and Nölleke, D. (2018). Journalistic homophily on social media. Digit. J. 6, 1–23. doi: 10.1080/21670811.2018.1436977
Hastings, G., Stead, M., and Webb, J. (2004). Fear appeals in social marketing: strategic and ethical reasons for concern. Psychol. Mark. 21, 961–986. doi: 10.1002/mar.20043
Haustein, S. (2018). “Scholarly Twitter metrics,” in Handbook of Quantitative Science and Technology Research, eds W. Glänzel, H. Moed, U. Schmoch, and M. Thelwall (Berlin: Springer), 1–40.
Hong, L., Dan, O., and Davison, B. D. (2011). “Predicting popular messages in Twitter,” in Proceedings of the 20th International Conference Companion on World Wide Web (New York, NY: ACM), 57–58. doi: 10.1145/1963192.1963222
Hu, Y., Manikonda, L., and Kambhampati, S. (2014). “What we instagram: a first analysis of instagram photo content and user types,” in Proceedings of the Eighth International AAAI Conference on Webblogs and Social Media (Palo Alto, CA: AAAI Press), 595–598.
Jefferson, R., Bailey, I., Richards, J., and Attrill, M. (2014). Public perceptions of the UK marine environment. Mar. Policy 43, 327–337. doi: 10.1016/j.marpol.2013.07.004
Jefferson, R., Mckinley, E., Capstick, S., Fletcher, S., Griffin, H., and Milanese, M. (2015). Understanding audiences: making public perceptions research matter to marine conservation. Ocean Coast. Manag. 115, 61–70. doi: 10.1016/j.ocecoaman.2015.06.014
Kane, G., Alavi, M., Labianca, G., and Borgatti, S. (2012). What’s different about social media networks? A framework and research agenda. MIC Q. 38, 274–304.
Kassens-Noor, E. (2012). Twitter as a teaching practice to enhance active and informal learning in higher education: the case of sustainable tweets. Active Learn. in High. Educ. 13, 9–21. doi: 10.1177/1469787411429190
Ke, Q., Ahn, Y.-Y., and Sugimoto, C. R. (2017). A systematic identification and analysis of scientists on Twitter. PLoS One 12:e0175368. doi: 10.1371/journal.pone.0175368
Koto, F., and Adriani, M. (2015). “A comparative study on Twitter sentiment analysis: which features are good?,” in Natural Language Processing and Information Systems, eds C. Biemann, S. Handschuh, A. Freitas, F. Meziane, and E. Métais (Cham: Springer), 453–457.
Kwak, H., Lee, C., Park, H., and Moon, S. (2010). “What is Twitter, a social network or a news media?,” in Proceedings of the 19th International Conference on World Wide Web (New York, NY: ACM), 591–600. doi: 10.1145/1772690.1772751
Lehr, J. L. (2007). “Democracy, scientific literacy and values in science education in the United States,” in The Re-Emergence of Values in Science Education, eds D. Corrigan, J. Dillon, and R. Gunstone (Rotterdam: Sense Publishers),29–43.
Lemeshow, S., and Hosmer, D. W. Jr. (1982). A review of goodness of fit statistics for use in the development of logistic regression mdoels. Am. J. Epidemiol. 115, 92–106. doi: 10.1093/oxfordjournals.aje.a113284
Li, J., Ritter, A., and Hovy, E. (2014). “Weakly supervised user profile extraction from twitter,” in Proceedings of the 52nd Annual Meeting of the Association for Computational Linguistics (Baltimore, MD: ACL), 165–174.
López-Goñi, I., and Sánchez-Angulo, M. (2017). Social networks as a tool for science communication and public engagement: focus on Twitter. FEMS Microbiol. Lett. 365:fnx246. doi: 10.1093/femsle/fnx246
Lotze, H. K., Guest, H., O’leary, J., Tuda, A., and Wallace, D. (2018). Public perceptions of marine threats and protection from around the world. Ocean Coast. Manag. 152, 14–22. doi: 10.1016/j.ocecoaman.2017.11.004
Lowe, T., Brown, K., Dessai, S., De França Doria, M., Haynes, K., and Vincent, K. (2006). Does tomorrow ever come? Disaster narrative and public perceptions of climate change. Public Underst. Sci. 15, 435–457. doi: 10.1177/0963662506063796
Macskassy, S. A., and Michelson, M. (2011). “Why do people retweet? anti-homophily wins the day!,” in Proceedings of the Fifth International Conference on Weblogs and Social Media (ICWSM) (Barcelona: AAAI Press),209–216.
McCullagh, P. (1980). Regression models for ordinal data. J. R. Stat. Soc. Series B 42, 109–142. doi: 10.1111/j.2517-6161.1980.tb01109.x
Mckay, M., Sanko, J. S., Shekhter, I., and Birnbach, D. J. (2014). Twitter as a tool to enhance student engagement during an interprofessional patient safety course. J. Interprof. Care 28, 565–567. doi: 10.3109/13561820.2014.912618
McKinley, E., and Fletcher, S. (2010). Individual responsibility for the oceans? An evaluation of marine citizenship by UK marine practitioners. Ocean Coast. Manag. 53, 379–384. doi: 10.1016/j.ocecoaman.2010.04.012
McPherson, M., Smith-Lovin, L., and Cook, J. M. (2001). Birds of a feather: homophily in social networks. Annu. Rev. Sociol. 27, 415–444. doi: 10.1146/annurev.soc.27.1.415
Medhat, W., Hassan, A., and Korashy, H. (2014). Sentiment analysis algorithms and applications: a survey. Ain Shams Eng. J. 5, 1093–1113. doi: 10.1016/j.asej.2014.04.011
Nagarajan, M., Purohit, H., and Sheth, A. P. (2010). A qualitative examination of topical tweet and retweet practices. ICWSM 2, 295–298.
Nakov, P., Ritter, A., Rosenthal, S., Sebastiani, F., and Stoyanov, V. (2016). “SemEval-2016 task 4: sentiment analysis in Twitter,” in Proceedings of the 10th International Workshop on Semantic Evaluation (semeval-2016) (San Diego, CA: Association for Computational Linguistics), 1–18. doi: 10.18653/v1/S16-1001
Newman, T. P. (2017). Tracking the release of IPCC AR5 on Twitter: users, comments, and sources following the release of the working Group I summary for policymakers. Public Underst. Sci. 26, 815–825. doi: 10.1177/0963662516628477
Nielsen, F. Å (2011). “A new anew: evaluation of a word list for sentiment analysis in microblogs,” in Proceedings of the ESWC2011 Workshop on ’Making Sense of Microposts’: Big Things Come in Small Packages 718 in CEUR Workshop Proceedings, Heraklion, 93–98.
Nordhaus, T., and Shellenberger, M. (2009). Apocalypse fatigue: losing the public on climate change. Yale Environ. 360:16.
O’Brien, S. M., and Dunson, D. B. (2004). Bayesian multivariate logistic regression. Biometrics 60, 739–746. doi: 10.1111/j.0006-341X.2004.00224.x
O’Neill, S., and Nicholson-Cole, S. (2009). “Fear won’t do it” promoting positive engagement with climate change through visual and iconic representations. Sci. Commun. 30, 355–379. doi: 10.1177/1075547008329201
Peng, C.-Y. J., Lee, K. L., and Ingersoll, G. M. (2002). An introduction to logistic regression analysis and reporting. J. Educ. Res. 96, 3–14. doi: 10.1080/00220670209598786
Peoples, B. K., Midway, S. R., Sackett, D., Lynch, A., and Cooney, P. B. (2016). Twitter predicts citation rates of ecological research. PLoS One 11:e0166570. doi: 10.1371/journal.pone.0166570
Potts, T., Pita, C., O’higgins, T., and Mee, L. (2016). Who cares? European attitudes towards marine and coastal environments. Mar. Policy 72, 59–66. doi: 10.1016/j.marpol.2016.06.012
Pregibon, D. (1981). Logistic regression diagnostics. Ann. Stat. 9, 705–724. doi: 10.1214/aos/1176345513
Priante, A., Hiemstra, D., van den Broek, T., Saeed, A., Ehrenhard, M., and Need, A. (2016). “#WhoAmI in 160 characters? Classifying social identities based on twitter profile descriptions,” in Proceedings of the First Workshop on NLP and Computational Social Science, Austin, TX, 55–65. doi: 10.18653/v1/W16-5608
Rozin, P., and Royzman, E. B. (2001). Negativity bias, negativity dominance, and contagion. Pers. Soc. Psychol. Rev. 5, 296–320. doi: 10.1207/S15327957PSPR0504_2
Saif, H., He, Y., and Alani, H. (2012). “Semantic sentiment analysis of Twitter,” in Proceedings of the 11th International Conference on the Semantic Web (Berlin: Springer), 508–524. doi: 10.1007/978-3-642-35176-1_32
Santoro, F., Santin, S., Scowcroft, G., Fauville, G., and Tuddenham, P. (eds). (2017). Ocean Literacy for All - A Toolkit. Paris: Unesco Venice Office.
Šćepanović, S., Mishkovski, I., Gonçalves, B., Nguyen, T. H., and Hui, P. (2017). Semantic homophily in online communication: evidence from Twitter. Online Soc. Netw. Media 2, 1–18. doi: 10.1016/j.osnem.2017.06.001
Schoedinger, S., Tran, L. U., and Whitley, L. (2010). From the principles to the scope and sequence: a brief history of the ocean literacy campaign. NMEA Spec. Rep. 3, 3–7.
Shiffman, D. S. (2012). Twitter as a tool for conservation education and outreach: what scientific conferences can do to promote live-tweeting. J. Environ. Stud. Sci. 2, 257–262. doi: 10.1007/s13412-012-0080-1
Smith, A. (2015). “Wow, I didn’t know that before; thank you”: how scientists use Twitter for public engagement. J. Promot. Commun. 3, 320–339.
Steel, B. S., Smith, C., Opsommer, L., Curiel, S., and Warner-Steel, R. (2005). Public ocean literacy in the United States. Ocean Coast. Manag. 48, 97–114. doi: 10.1016/j.ocecoaman.2005.01.002
Stieglitz, S., and Dang-Xuan, L. (2013). Emotions and information diffusion in social media—sentiment of microblogs and sharing behavior. J. Manag. Inform. Syst. 29, 217–248. doi: 10.2753/MIS0742-1222290408
Suh, B., Hong, L., Pirolli, P., and Chi, E. H. (2010). “Want to be retweeted? Large scale analytics on factors impacting retweet in Twitter network,” in Proceedings of the 2010 IEEE Second International Conference on Social Computing (Washington, DC: IEEE Computer Society), 177–184. doi: 10.1109/SocialCom.2010.33
Ver Hoef, J. M., and Boveng, P. L. (2007). Quasi-Poisson vs. negative binomial regression: how should we model overdispersed count data? Ecology 88, 2766–2772.
Wadhwa, V., Devgan, A., Patel, M. V. M., Bourgeois, A. C., and Ahmed, O. (2018). Factors increasing engagement rate for the journal of vascular and interventional radiology Twitter feed. J. Vasc. Interv. Radiol. 29, 1057–1059. doi: 10.1016/j.jvir.2018.03.004
Wadhwa, V., Latimer, E., Chatterjee, K., Mccarty, J., and Fitzgerald, R. (2017). Maximizing the tweet engagement rate in academia: analysis of the AJNR Twitter feed. Am. J. Neuroradiol. 38, 1866–1868. doi: 10.3174/ajnr.A5283
Wagner, C., Liao, V., Pirolli, P., Nelson, L., and Strohamaier, M. (2012). “It’s not in their tweets: modeling topical expertise of twitter users. Privacy, security, risk and trust (PASSAT),” in Proceedings of the 2012 ASE/IEEE International Conference on Social Computing and 2012 ASE/IEEE International Conference on Privacy, Security, Risk and Trust, SOCIALCOM-PASSAT 2012 (Washington, DC: IEEE Computer Society), 91–100. doi: 10.1109/SocialCom-PASSAT.2012.30
Weng, J., Lim, E.-P., Jiang, J., and He, Q. (2010). “TwitterRank: finding topic-sensitive influential Twitterers,” in Proceedings of the Third ACM International Conference on Web Search and Data Mining 2010. Research Collection School Of Information Systems (New York, NY: ACM), 261–270.
Wickham, H. (2017). Stringr: Simple, Consistent Wrappers for Common String Operations. R Package Version 1.2.0.
Yang, J., and Counts, S. (2010). Predicting the speed, scale, and range of information diffusion in Twitter. ICWSM 10, 355–358.
Keywords: ocean literacy, science communication, public engagement, Twitter, social networking sites, sentiment analysis
Citation: Kopke K, Black J and Dozier A (2019) Stepping Out of the Ivory Tower for Ocean Literacy. Front. Mar. Sci. 6:60. doi: 10.3389/fmars.2019.00060
Received: 18 December 2018; Accepted: 04 February 2019;
Published: 19 February 2019.
Edited by:
Angel Borja, Centro Tecnológico Experto en Innovación Marina y Alimentaria (AZTI), SpainReviewed by:
George I. Matsumoto, Monterey Bay Aquarium Research Institute (MBARI), United StatesTakuro Uehara, Ritsumeikan University, Japan
Copyright © 2019 Kopke, Black and Dozier. This is an open-access article distributed under the terms of the Creative Commons Attribution License (CC BY). The use, distribution or reproduction in other forums is permitted, provided the original author(s) and the copyright owner(s) are credited and that the original publication in this journal is cited, in accordance with accepted academic practice. No use, distribution or reproduction is permitted which does not comply with these terms.
*Correspondence: Kathrin Kopke, ay5rb3BrZUB1Y2MuaWU=