 Margrethe Aanesen
 Claire W. Armstrong*
- Norwegian College of Fishery Science, UiT The Arctic University of Norway, Tromsø, Norway
Ecosystem services (ESs) may be both non-market and market based. Both may provide important input to societal welfare. Using natural resources, or converting nature in the development of market based ES may impact the access to non-market or more conservationist ES, and vice versa. How does the general public trade-off between these two types of ES? We use two valuation studies in Northern Norway to identify the public’s preferences for marine industries versus other marine use and non-use values. One study assesses willingness to pay to protect cold-water corals, a relatively abundant, and to some degree, protected resource off the coast of Norway. The other study elicits people’s willingness to pay for stricter regulations of industrial activity in the coastal zone, providing more coastal area for recreational activities. Both studies show strong conservation preferences, and willingness to forego blue industrial growth. However, these preferences are heterogeneous across socio-economic characteristics, and, interestingly, educational level is the characteristic that most distinctly separates the population into various preference groups.
Introduction
There is a substantial push to increase the potential commercial output, or more specifically blue growth, from marine environments worldwide (EU, 2017; WB/UN, 2017). FAO defines Blue Growth as “Sustainable growth and development emanating from economic activities using living renewable resources of the oceans, wetlands, and coastal zones that minimize environmental degradation, biodiversity loss and unsustainable use of aquatic resources, and maximize economic and social benefits.” The marine commercial production, whether sustainable or not, is usually co-produced alongside other ecosystem services (ESs), which humans benefit from, and some of these services are traded-off against the commercial output, either directly or via allocation of space. Marine scientists, both natural and social, have long been sounding the warning bell with regards to economic growth plans in marine environments and the potential impacts on ecosystems and their services (Barbier et al., 2014), and have been warning about the move away from conservation toward conversion of ocean environments (Weaver and Johnson, 2012).
Largely the parties present at the discussion of conversion versus conservation are commercial interests, scientists, governmental institutions and non-governmental organizations, while the public is only indirectly represented via the latter two. Many of the marine issues are also far removed both physically and temporally from the public, and hence literacy, awareness and engagement is limited (Eddy, 2014; Guest et al., 2015). Indeed, even when close to the marine environments, and benefiting from their ESs, the general public often has limited impact upon choices made regarding the conversion of natural environments or resources into commercial activities and services. This is due to either institutional barriers, few arenas for contribution, or limited possibilities to organize interests. This does not, however, necessarily mean that the public has no preferences for the trade-offs that might occur in the push for blue growth. We therefore want to investigate the public’s preferences by combining results from two valuation studies, and discuss them in relation to the on-going debate on blue growth in the Arctic region of Norway. The studies both use choice experiments (CEs) (Hanley et al., 1998) regarding tradeoffs between cultural and supporting ESs on the one hand, and provisioning services on the other. We use the Millennium Ecosystem Assessment ES framework (Millennium Ecosystem Assessment [MEA], 2005) as it includes supporting services, which are of relevance for the coral case. The first study is related to cultural and supporting ES from cold- water coral conservation versus continued activities within fisheries and the petroleum industry. The data applied are extracted from CE internet surveys on cold-water coral protection in Norway, where we utilize the responses from Arctic Norway. The other study is a CE split sample survey assessing coastal recreational activities versus expansions in tourism and aquaculture industries in Arctic Norway. Some of the data in each of the two studies used here has been published earlier, separately (Sandorf et al., 2016; Aanesen et al., 2018).
On the conversion side, natural resource based industries include provisioning services from traditional offshore fisheries, oil and gas exploration and exploitation and marine aquaculture, in addition to cultural services from marine fishing tourism. Hence, the variety in blue growth spans out very different industries, and include the most important sectors of the Norwegian economy. Our focus on Arctic Norway is motivated by legitimacy arguments for the inclusion of local participation in ES trade-off decision making (Robards et al., 2011), and by the principle of subsidiarity, implying that social and political issues should be dealt with at the most immediate (or local) level that is consistent with their resolution (Graeger, 1996). Thus, our regional focus is especially motivated by the fact that in the Arctic the dependence on natural resources is greater than is the case for many more southern and urbanized areas. In addition, for industries like aquaculture as well as oil and gas, a super-proportional share of the future development is assumed to take place in Arctic Norway.
The paper explores how people in Arctic Norway trade off industrial activities, supplying provisioning services, for cultural and supporting services. Further, it analyses how such trade-offs depend on whether you live in rural or urban areas, and other socio-demographic characteristics like gender, age, education and income. The paper is organized as follows. In the next section we present the methodology and data collection. This is followed by a presentation of the results of the two surveys. The final section discusses and concludes.
Materials and Methods
The Empirical Case – Arctic Norway
Arctic Norway differs from southern parts of Norway by offering more space per inhabitant, vast access to natural resources and outdoor recreational activities. Inhabitants in the region make extensive use of the nature and natural resources both for recreational and subsistence purposes (Aanesen et al., 2018). On the other hand, the region is also characterized by an economy heavily dependent on natural resource extraction, and public employment (Statistics Norway, 2018). Based on interviews with civil servants in the county administrations, industrial expansion is expected to come in already existing marine industries, such as aquaculture and marine tourism. Traditional fisheries are expected to remain a backbone of the economy in all three counties, but natural growth rates limit expansion in this industry. There is still large uncertainty regarding future developments in oil and gas exploration and exploitation in the Arctic. While aquaculture and the oil industry are relatively new industries in Arctic Norway, and less developed here compared to in the south, we find the largest and some of the most profitable Norwegian fisheries in this region. In addition, marine fishing tourism is more widespread in Arctic Norway compared to in the south (Borch et al., 2011). Aquaculture and the oil industry are clearly more capital intensive, at least compared to marine fishing tourism, which is more labor intensive. While the fisheries traditionally have required limited investments, technological development and the introduction of individual transferable quotas (ITQs) has made this industry more capital intensive (Johnsen and Jentoft, 2018). Technological development and downsizing of the fishing fleet has led to a substantial reduction in the employment in fisheries, making it less labor intensive. Nonetheless, it is still an important industry in many small arctic communities (Armstrong et al., 2014).
The industries studied vary across a number of different aspects; capital input, marine and societal location, ownership, and traditional versus modern. In Table 1 these scales are listed for the industries included in the surveys, in order to assess later whether any of these differences could explain variations in preferences.
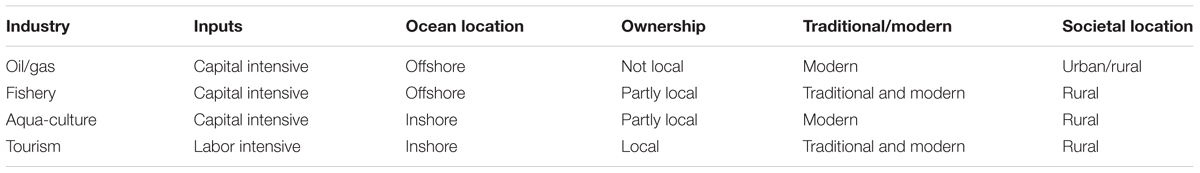
Table 1. Industry scales.
Based on expectations of growth in the mentioned marine industries, it is of interest to elicit to what degree residents are willing to trade off ESs, some of which they utilize extensively for recreational purposes, for economic growth.
The Surveys
Survey 1 – Protection of Cold-Water Coral Off the Norwegian Coast
From 2013 to 2015 a single CE survey was implemented in several different ways. The aim of the survey was to assess the Norwegian public’s willingness to pay to increase the protection of the cold-water coral reefs off the Norwegian coast. Positive effects of such protection in the form of supporting services (habitat) and cultural services (existence values) was traded off against negative effects of increased protection on provisioning services in the form of reduced access to sea areas for traditional bottom-trawling fisheries and oil and gas exploration and exploitation. The survey output was used to inform decision makers, as input in bioeconomic modeling and for testing the elicitation instrument (the CE technique). For the latter purpose, one and the same survey was implemented both electronically (internet) and as valuation workshops (see LaRiviere et al., 2014; Aanesen et al., 2015 for results from the valuation workshops). For use in this paper we have extracted respondents residing in Arctic Norway from two internet versions of the survey, giving a total of 75 respondents.
Currently, cold-water coral areas off the Norwegian coast totaling 2,445 km2 are protected in the form of marine reserves, and the CE asked whether people were willing to increase this area. We know that trawlers sometimes prefer to fish close to coral-reefs, and that the oil industry has been interested in exploring areas close to these reefs (Armstrong and van den Hove, 2008). Hence, the CE asked whether people were willing to protect coral areas even if this implied restrictions on commercial activities like bottom-trawl offshore fisheries and oil exploration. It has been observed that coral reefs seem to concentrate fish, and it is hypothesized that the reefs serve as shelter and refuge for young fish (Husebø et al., 2002). It has, however, not been scientifically verified that coral reefs in general are important habitat for young fish (Kutti et al., 2014). Hence, the CE asked if people were willing to protect coral areas, dependent on whether such areas were important habitat for young fish or not. Furthermore, choosing to not increase the protected area would have no cost. Choosing alternatives with larger protection would imply a cost, varying from 200 NOK (EUR 20,4) to 1000 NOK (EUR 102) (see Table 2 for attributes and levels). The choice cards used in the CE presented a status quo (SQ) alternative, with no changes in protected coral area and no costs, and two alternatives; one with protected area equal to 5,000 km2 and one with protected area equal to 10,000 km2, both implying extra costs. Appendix Figure A1 exhibits an example of a choice card. The survey encompassed 12 choice cards. We applied a Bayesian design and the Ngene software to decide the combination of attribute levels in the two non-SQ alternatives.
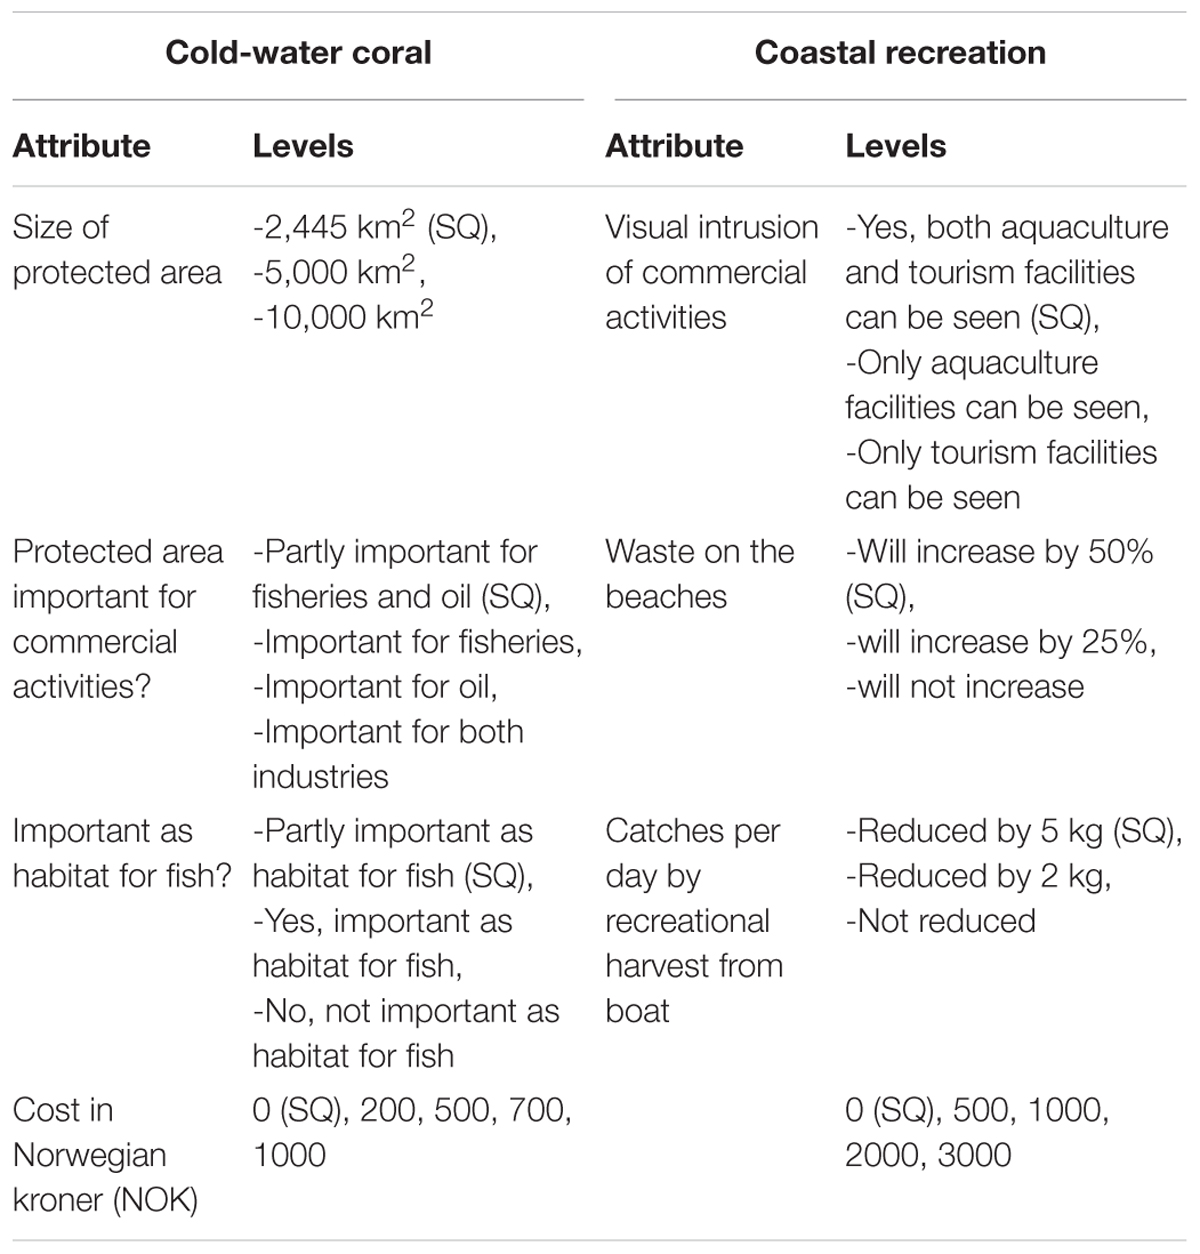
Table 2. Attributes and attribute levels in the two choice experiments (SQ is status quo level).
Survey 2 – Preserving Coastal Zone Areas for Recreational Activities
In 2015 we implemented a CE among inhabitants of Arctic Norway, defined as the three northernmost counties; Nordland, Troms, and Finnmark. This survey aimed at eliciting whether inhabitants in the region were willing to pay to reduce the planned expansion in industrial activities taking place in the coastal zone. Due to methodological issues, the survey was implemented as a split sample survey, where one sample got a CE including a “number of new jobs” attribute, whereas the other sample got a CE excluding the job attribute. As results from the former are already published, we chose the latter, encompassing 490 respondents for this study.
The most prominent coastal commercial activities expected to expand in Arctic Norway the next decade are aquaculture and tourism. Depending on how restrictive the regulations are for commercial activities in the coastal zone, more, or less development will take place. More development implies more waste on the beaches and less catch by (private) recreational fishing. Hence, the SQ-alternative yields a situation with the highest visual intrusion of commercial activities, the highest increase in waste on the beaches and the largest reduction in recreational catches of fish. It is possible to restrict the commercial development, limit the increase in waste on the beaches and the reduction in recreational catches of fish, but this can only come at a cost. The cost varied from 500 Norwegian kroner to 3000. The choice cards presented three alternatives, an SQ and two alternatives with less development. Appendix Figure A1 exhibits an example of a choice card and Table 2 shows attributes and levels. The survey encompassed eight choice cards. We applied a D-efficiency design (Train, 2009) and the Ngene software to decide the combination of attribute levels in the two non-SQ alternatives.
For both surveys, permission to collect and store personal data was received from The Norwegian Centre for Research Data. This is the requirement for carrying out surveys with personal information in Norway, and at the time the surveys were carried out, respondent consent lay in active participation.
The Survey Samples
The female share is somewhat below 50% in Arctic Norway, and this is reflected in the coral survey. The coastal recreation survey, on the other hand, has a female share of 55%, which is above the population average. The distribution on age shows that both surveys have more people in the age group 51–67, and less people in the age group 18–31 compared to the Arctic Norway population. In other words, we have less young and more middle aged people in the survey than in the population. In addition, the survey respondents are more highly educated compared to the average Arctic Norway population. One reason for the very large difference in survey and population share for primary education is that the Arctic average includes all persons above 16 years, whereas the survey numbers include only people above 18 years. The difference, i.e., people 16–18 years old, will mainly belong to the primary education group. Note that university degree includes both lower (3 years) and higher (5 years) degrees. Finally, survey respondents do not have higher income compared to the Arctic Norway average. Table 3 shows socio-demographic characteristics of the two samples and compares them to averages for the Arctic Norwegian population. In addition to the choice cards, both surveys encompassed attitudinal questions and socio-demographic variables such as gender, age, education, and income.
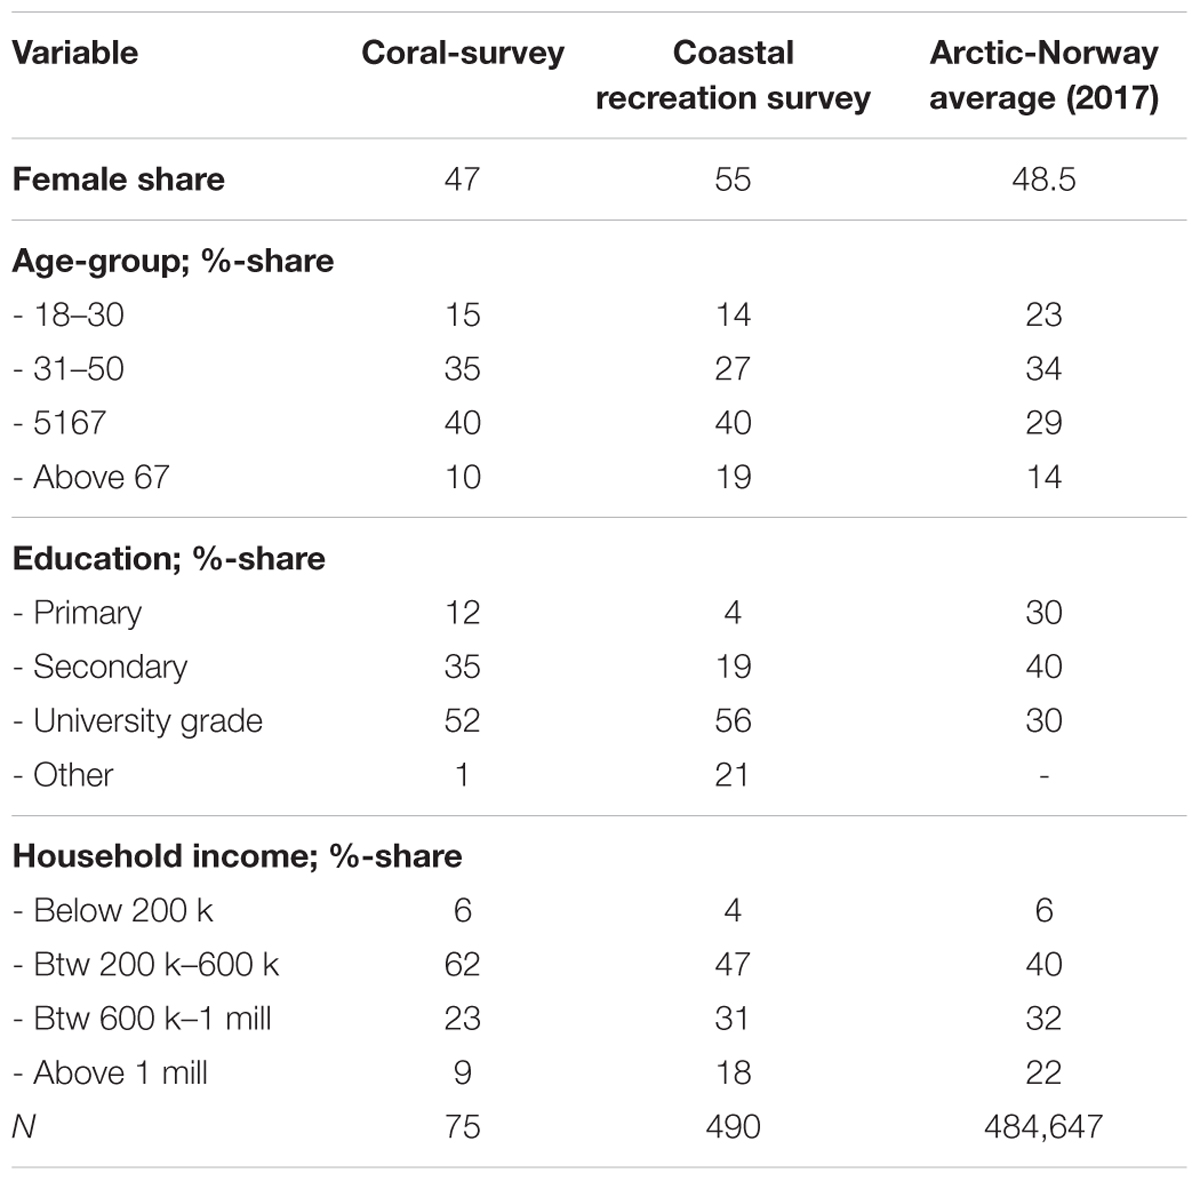
Table 3. Socio-demographic characteristics.
The Choice Experiment Methodology
We apply a random utility model (RUM) to process the data collected in the two CEs. RUM assumes that utility consists of two parts; one which can be observed by the researcher, and an idiosyncratic error term, unobservable for the researcher (McFadden, 1974). Assuming that the observable part of utility can be explained by characteristics of the good to be valued, i.e., the attributes, and by characteristics of the respondents, i.e., socio-demographics, we can formulate the utility of respondent n of choosing alternative j in choice occasion t as follows:
where X is a vector indicating attribute levels, Z is a vector with socio-demographic characteristics, and b and a are parameters expressing attribute sensitivities and how such sensitivities vary across respondents with different characteristics.
Assuming utility maximization, respondent n will choose alternative j in choice occasion t if . When the error term is identically and independently extreme value (Gumbel) distributed, the probability for choosing alternative j is given by;
where .
The joint probability of observing all choices from each of the respondents is given by the product of the probabilities in (2) over all choice sets and respondents (Train, 2009). For ease of calculation, we usually use the log of this expression when deriving estimates for the b- and a-vectors. Using maximum likelihood optimization the log-likelihood function is given by
where yjnt is a dichotomous variable taking the value 1 if respondent n chooses alternative j in choice occasion t, and 0 otherwise. Maximizing (3) with regard to b and a, we derive the attribute and socio-demographic parameter estimates that maximize the likelihood for the observed choices. The above statistical model is called the multinomial logit (MNL) model, and presupposes the IIA (independence of irrelevant alternatives) property. To ascertain that this property is fulfilled, we use the Hausman-McFadden test (Cheng and Long, 2007).
When the Hausman-McFadden test fails to ascertain the IIA property, the MNL model is not appropriate to analyze a specific dataset. Then other models, like the probit model, nested multinomial logit or mixed multinomial logit (MMNL) model has to be applied (Train, 2009). The MMNL model assumes heterogeneous preferences across individuals and the researcher decides the appropriate distribution to apply. This means that in addition to average preference sensitivities, which are reported in the MNL model, the MMNL model also reports standard deviations of the attribute preferences. Hence, the vector of attribute preferences, b, is now given by
where is the average of the distribution, μ is the lower definite of the Cholesky matrix and D represents draws from the specified distribution. When the preference sensitivities are random, the model no longer has analytical solutions, and simulations must be applied to find the maximum of the log-likelihood function. Hence, in the MMNL model choice probabilities and the LL function are now given as follows:
Results
We use random utility theory to process the two datasets. Ideally, we would use the mixed multinomial logit model. A mixed multinomial logit model is a multinomial logit (MNL) model with random coefficients drawn from a cumulative distribution function, while the MNL model exhibits fixed coefficients (Hensher et al., 2005). However, the coral dataset encompassing 75 respondents is small for running mixed MNL models with socio-demographic interaction variables that may take up to 10 values. The MNL model requires a lower number of observations to estimate coefficients for both the attributes and attribute interaction with socio-demographic characteristics. On the other hand, for the coastal recreation dataset we had to reject the IIA property (independence of irrelevant alternatives) (ChisqTestStat = 664.5, p-value = 0.00), and thus we cannot analyze it using the MNL model (Hausman and McFadden, 1984). Often, the MNL and the mixed MNL models do not give very different results, but due to higher degree of flexibility the mixed MNL model yields a higher R-squared. We ran the mixed MNL on the coral dataset to check whether this substantially changed the estimated coefficients compared to the MNL model [see results for this in Appendix (Table A1)]. As this was not the case, we continued to analyze the coral data by the MNL model.
On average, people are indifferent when it comes to all commercial attributes except tourism. The coefficient for the tourism attribute is significant at 10% level, and the sign is negative, indicating that people prefer to see more rather than less tourism facilities along the coast (see Table 4). Note that for all commercial attributes a negative sign of the coefficient implies a positive preference for the actual industry. The oil and gas (oil), and fisheries attributes take the value 0 if protection does not conflict with these activities, and 1 if it does. Hence, a negative sign on each of these attributes implies that people are less willing to protect coral reefs if this conflicts with commercial activities, i.e., they “protect” the commercial activities. The aquaculture (aqua) and marine fishing tourism (tourism) attributes takes the value 0 if the commercial activity is present along the coast and 1 if it is not. Hence, a negative sign for each of these attributes indicates a preference for their presence.
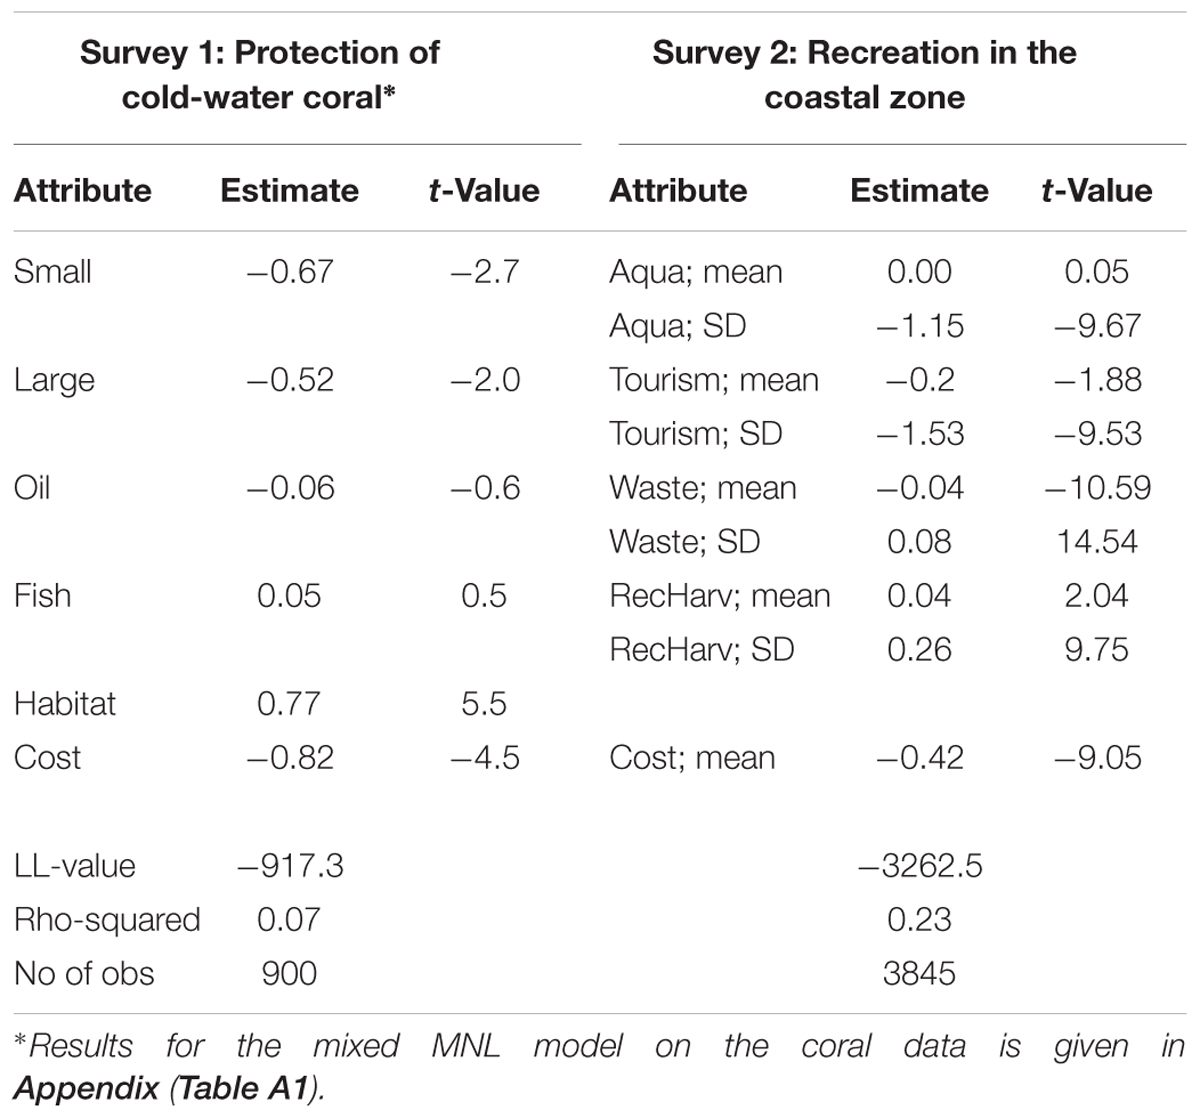
Table 4. Average preference sensitivities for economic vs. environmental attributes across two surveys.
Insignificant coefficients means either that people are indifferent with respect to the actual industry or that preferences in support of the industry are equally strong as preferences against. The non-significant standard deviation for the oil attribute [see Appendix (Table A1)] indicates that people are indifferent to whether or not this industry is hampered in its activities when they choose to protect more coral reefs. The significant standard deviation for the fisheries attribute means that people’s preferences for offshore fisheries activities are heterogeneous, and that those who oppose protection if it hampers fisheries activities cancel out those who support such protection. Both aquaculture and tourism have relatively large and significant standard deviations, implying heterogeneous preferences for the presence of both industries. For aquaculture, this implies that preferences for seeing aquaculture plants along the coast are equally strong as preferences for not seeing such plants along the coast.
Stated preferences for supporting and cultural ES in the coral survey, expressed by the habitat and the two size attributes, are significant. On the one hand, there is a positive preference for protection of coral reefs due if it functions as habitat for fish. On the other hand, there are negative stated preferences for protecting cold-water coral per se, i.e., people do not hold positive existence values for coral reefs. In the coastal recreation survey, the cultural ES, expressed by waste on the beaches (waste) and recreational harvest (RecHarv) for local inhabitants, are both significant. The negative sign of the coefficient for the waste attribute implies that people have preferences for less waste on the beaches, as expected. The positive sign of the RecHarv attribute means that people prefer greater reductions in recreational harvests, to lower reductions. This seems somewhat counterintuitive, as we had expected that people would prefer lower reductions in recreational catches to higher ones. In a small follow-up face-to-face survey, applying the same questionnaire, we asked people about how they understood the RecHarv attribute, and about half of these respondents said they assumed this was recreational catches for tourists (Aanesen et al., 2018). In such a context, a positive sign for the RecHarv attribute coefficient is as expected, as it indicates a preference for higher reduction in catches for tourist fishers.
The only large, urban center in the region is the city of Tromsø, and from previous studies on preferences for recreational ESs in Arctic Norway we know that respondents from this city state preferences significantly different to the average of the region (Aanesen et al., 2018). Thus we split the two datasets in two sub-sets, one containing only respondents from Tromsø, and the other all other respondents. Results from the four subsets are shown in Appendix (Tables A2, A3). For the coral dataset the split does not affect the results. The attribute coefficients for the urban subset are more extreme compared to the rural subset, which may be due to the lower number of respondents. For the coastal recreation dataset two attributes that had significant average coefficients in the full dataset, are no longer significant. These are tourism and RecHarv. They still have significant standard deviations. The average coefficients for tourism are smaller in both subsets, and while significant at 15% level in the rural subset it is not significant at any reasonable level in the urban subset. This indicates that in the urban subset there are more respondents who are either very positive or very negative to seeing marine tourism facilities along the coast. In the rural sub-set stated preferences for this attribute are less polarized. Regarding the RecHarv attribute, the urban subset exhibits a higher average attribute coefficient and standard deviation compared to the full dataset, whereas the rural dataset exhibits a lower average coefficient and standard deviation. This means that urban respondents have stronger preferences for reduction in recreational harvest compared to rural respondents. While the difference in average attribute coefficient in the two subsets is significant, this attribute is no longer significant in any of the subsets.
The variables we used to test how preferences vary across personal characteristics were gender, age, education, and income. Gender took the value 1 if the respondent was a man and 2 if a woman. Age is a continuous variable starting at 18 (the youngest respondent) and running to the age of the oldest respondent, who was 74 years old. Education is a discrete variable, running from 1, which is education at primary school level, to 4, which is education at graduate university level. Income is given by income intervals, starting with 1, who are those who earn below 200,000 Norwegian kroner annually (USD 23,530), and running through 15, who are those earning more than 1 million Norwegian kroner annually (USD 117,467). In Table 5 the estimates of the interaction terms are presented. The results for the full models are given in the Appendix (Tables A4–A7).
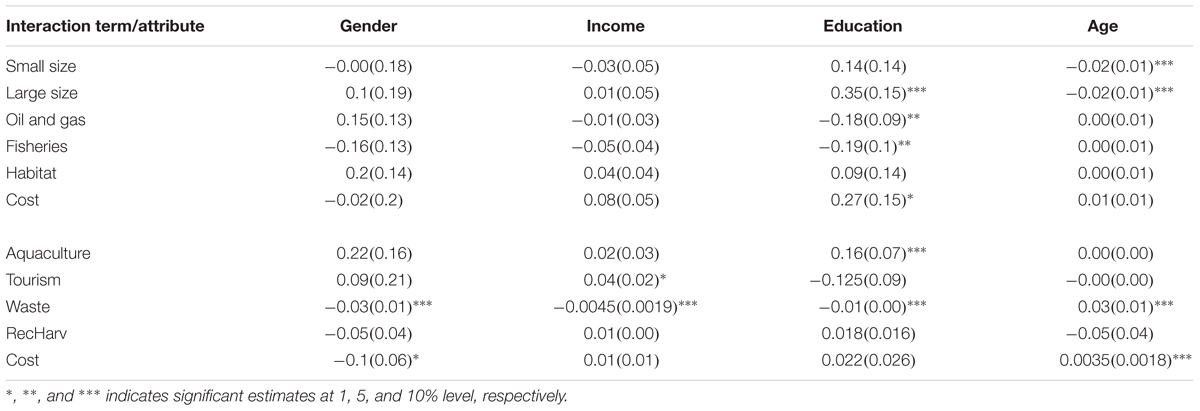
Table 5. Socio-demographic interaction effects; average estimates for interaction parameters (standard error in brackets).
Education is the socio-demographic variable which most effects average preferences, and the sign of the effect is unambiguously negative. The negative estimate of the oil_edu and fish_edu interactions indicates that people with higher education are less willing to protect coral-reef areas if this hampers oil and gas, and offshore fisheries activities. Similarly, the positive sign of the aquaculture-education interaction implies that higher educated people prefer to see more rather than less aquaculture plants along the coast. Hence, across both surveys there is a tendency that higher educated people are more positive to industry compared to lower educated people. On the other hand, higher educated people are more willing to protect larger coral reef areas than are lower educated people, which can be seen from the positive sign of the large_edu interaction estimate. In addition, they are willing to pay more for coral reef protection, which is indicated by the positive cost_edu interaction estimate. Higher educated people also have greater preferences for reduction in waste on the beaches, which can be seen from the negative sign of the waste_edu interaction estimate.
In Appendix (Table A5) we observe that the sign on the interaction terms waste_sex and cost_sex are negative. This indicates that women are more concerned about increases in waste on the beaches, but they are less willing to pay to reduce it. In the coral survey none of the interaction terms with gender are significant, implying that gender is not a characteristic that explains differences in preferences for coral protection. The negative sign of small_age and large_age in Appendix (Table A4) indicates that younger people are more willing to protect coral reefs per se (both small and large areas) than are older people. Similarly, the positive sign of the waste_age interaction estimate indicates that younger people have greater preferences for reduction in waste on the beaches than have older people.
Finally, the tourism_inc and waste_inc interaction coefficients in Appendix (Table A7) show that income is positively interacted with tourism and negatively with waste. The former implies that people with higher income are more positive to marine fishing tourism facilities along the coast, and the latter that higher income people are more negative to waste on the beaches.
Discussion and Conclusion
Traditionally, Arctic Norway has been more marginalized than the rest of the country when it comes to income, education and job possibilities. One might expect that in such areas the focus on conversion in the form of commercial expansion and new jobs would trump conservation in the form of increased protection of non-market ESs. However, our results show that conservation has strong support in Arctic Norway, while people are indifferent to expansions in important marine industries like aquaculture, fisheries and oil and gas. Only for marine fishing tourism do people state a positive preference.
This is the unified result from two CE surveys implemented in this region. People prefer to protect offshore resources such as cold-water coral reefs due to their importance as habitat for fish, and they do not care if this implies limitations on commercial activities such as fisheries and oil and gas. Similarly, people prefer management alternatives for the coastal zone that favor less waste on the beaches and lower harvest for recreational fishers, and they do not care whether they can see aquaculture plants along the coast. On the other hand, they are positive to see marine fishing tourism facilities along the coast.
Unexpectedly, only one socio-demographic variable showed significant effects on the preferences for more than one attribute in both surveys, namely education. In both surveys, people with higher education were either more positive to commercial activities like aquaculture, or less willing to protect coral areas if this hampered commercial activities like oil and gas exploitation and fisheries (see Appendix Table A6). There may be a few explanations for this. First, more highly educated people may see the necessity of economic activities for national welfare. Second, people with higher education may be more in favor of high-tech industries because these industries yield larger opportunities for well-paid jobs for higher educated compared to lower educated people. Examples of such industries are oil and gas, and aquaculture, both of which higher educated people exhibit more positive preferences toward compared to lower educated people. Marine fishing tourism, on the other hand, is not an example of a high-tech industry offering well-paid jobs, and for this industry higher educated people does not exhibit more positive preferences compared to lower educated people.
Although more willing to accept and protect commercial activities, higher educated people also have greater preferences for protection of large coral-reef areas, as long as these areas are not important for the oil and gas industries and for offshore fisheries, and they are more adverse to increases in waste on the beaches, compared to lower educated people. This means that they see the need for protection of natural habitats, and the ESs they provide, but are not willing to compromise commercial activities that are currently large income generating sectors to the Norwegian economy.
In general, preferences do not vary much according to gender, age, and income. A few exceptions exist. Women, younger people, and people with higher income have stronger negative preferences for more waste on the beaches than had men, older people, and people with lower income. The fact that women and younger people have stronger pro-environmental preferences than have men and older people is not unexpected, and has been demonstrated in previous work. For example, Togler et al. (2008), reporting from a survey on environmental protection and using a large micro-dataset with respondents from 33 western and eastern European countries, demonstrates that women hold stronger (positive) preferences toward the environment and are more willing to contribute to its protection. Their higher willingness to contribute is measured both as voluntary contribution from their net income and in the form of increased taxes. Likewise, Togler et al. (op cit) demonstrate a negative correlation between environmental preferences and age, implying that younger people have stronger (positive) environmental preferences than have older. Dalen and Halvorsen (2011) reports from a survey conducted for the OECD on environmentally friendly efforts in households, based on 10,000 households distributed amongst 10 countries. They show that women tend to be more positive to hypothetical pro-environmental policy measures, but also underline that since these hypothetical responses are not mirrored in reported behavior, they cannot say anything about gender differences in actual behavior. Villamor et al. (2014) use gender as one explanatory variable when discussing various strategies of land use, and show that while men incorporate trees in farm production it is mostly for financial purposes, women plant trees for soil conservation and subsistence reasons.
From Appendix (Table A1), we observe that when allowing heterogeneous preferences across respondents for coral-reef protection, people exhibit significant heterogeneity when it comes to protection that hampers fisheries activities, while they are far more homogeneous when it comes to protection that hampers oil and gas activities. As in the MNL model, neither of the attributes has a significant estimate. However, while this “indifference” result regarding the oil and gas industry can be interpreted as if they do not care whether coral-reef protection hampers oil and gas activities or not, this is not the case for fisheries activities. The significant standard deviation indicates that there are some people that oppose the idea of protecting coral-reefs when this hampers fisheries activities, and some who support this idea. This difference in attitudes to the two industries is interesting. It indicates that some respondents have strong preferences for unhampered fisheries activities, but do not care whether oil and gas activities are affected. Such a result may be related to fisheries being an old and traditional industry, perceived to have some historic rights in relation to ocean access. Oil and gas exploration, on the other hand, is a young industry in Arctic Norway, and its development is currently very limited. However, this industry has generated huge wealth in Norway, which in turn generates expectations in Arctic Norway as the industry expands northward. It is probably such expectations that lead to significantly lower willingness to limit oil and gas activities among higher educated people compared to lower educated people, seeing the potential for well-paid jobs.
While future expansions in oil and gas related activities in Arctic Norway are highly uncertain (Meld. St. 16, 2014/2015), the exporting industry with the largest expectations for future expansions in Norway in general, and in Arctic Norway in particular, is aquaculture (op cit). Due to problems connected to sea-lice infestation in the heaviest aquaculture concentrated regions, a super-proportional share of the growth in this sector is supposed to take place in Arctic Norway (op cit). In this context, our results, showing that people on average are indifferent to seeing aquaculture facilities along the coast are interesting. Although not an unambiguous endorsement of the governmental policy, it shows that people in Arctic Norway in general do not oppose the idea of more aquaculture facilities along the coast, and that the higher educated a person is, the more likely that (s)he supports such a policy. On the other hand, the significant standard deviation indicates strong preference heterogeneity for this commercial activity. This, in turn, means that parts of the population supports the existence, and possibly, expansion of aquaculture along the coast in Arctic Norway, while other parts oppose such plans. In 2015, the Tromsø municipality, together with four neighboring municipalities, developed an inter-municipal coastal plan, in which 20 new areas were designated to aquaculture activities (Tromsø municipality, 2015). While parts of the population welcomed the plan, it also was strongly criticized (see, e.g., Brattland and Eythorsson, 2016).
The urban – rural divide, which we expected to find, is not very pronounced. One could hypothesize that this is due to the division made between rural and urban, where only respondents from the city of Tromsø are in the latter group. However, on the contrary, including respondents from more towns in the urban subset only contributed to make the distinction between results from the two subsets, urban and rural, less distinct. Hence, Tromsø respondents can be seen as one extreme on a continuum (of preferences) from urban to rural preferences.
Though relatively few studies of conservation preferences include trade-offs between conservation and conversion, similar results as ours regarding preference for conservation rather than conversion are also found elsewhere. For example, Morrison et al. (1999) used a CE to trade-off environmental preferences and job-losses, from protecting a large wetland in Australia. While both environmental attributes and the job-attribute were significant in explaining the choices people made, people were on average willing to pay AUS $ 0.13 per extra job versus AUS $ 4 per additional endangered species in the area. This implies that people on average are willing to accept the loss of 30 jobs if this means an increase of one endangered species in the wetland area studied. Mallawaarachchi et al. (2001) used regional income to represent the economic attribute, and two environmental attributes in a CE on protection of natural vegetation in an area also suitable for cane production. The results showed that people on average were willing to pay less than one AUS $ for an increase in regional income of 1 million AUS $ versus AUS $ 2.56 per 1000 hectare protected woodland and AUS $ 39.95 for the protection of one additional hectare of wetland.
Observing that many valuation surveys amongst the general public underline the preferences for conservation over conversion, parallel with a development where many countries, like Norway, are increasingly losing non-converted areas, one could ask to what degree “ordinary” people’s opinions are accounted for in decision making? Skonhoft and Solem (2001) have shown how terrestrial natural habitats are converted into private or commercial use at an increasing pace in Norway, and globally in the case of the marine Halpern et al. (2008) demonstrates a similar trend. Our results indicate that including the publics’ preferences in decision-making to a larger degree than what seem to be the case currently, may change this trend.
Ethics Statement
This study was carried out in accordance with the requirements of the Norwegian Center for Research Data.
Author Contributions
Both authors have substantial contributions to the conception and design of the work, interpretation of data, conclusion and assessment, drafting and critical revision of the work, and approve the content for publication and are accountable for all aspects of the work.
Funding
The Research Council of Norway has funded data gathering over the projects CoralValue and NatureValue (Grant Nos. 216486 and 225228), The analysis has received funding from the European Union’s Horizon 2020 research and innovation programme (Grant Agreement No. 678760) (ATLAS). This output reflects only the authors’ views and the European Union cannot be held responsible for any use that may be made of the information contained therein. The publication charges for this article have been funded by a grant from the publication fund of UiT The Arctic University of Norway.
Conflict of Interest Statement
The authors declare that the research was conducted in the absence of any commercial or financial relationships that could be construed as a potential conflict of interest.
References
Aanesen, M., Armstrong, C. W., Czajkowski, M., Falk-Petersen, J., Hanley, N., and Navrud, S. (2015). Willingness to pay for unfamiliar public goods: preserving cold-water coral in norway. Ecol. Econ. 112, 53–67. doi: 10.1016/j.ecolecon.2015.02.007
Aanesen, M., Falk-Andersson, J., Vondolia, G. K., Borch, T., Navrud, S., and Tinch, D. (2018). Valuing coastal recreation and the visual intrusion from commercial activities in Arctic Norway. Ocean Coast. Manag. 153, 157–167. doi: 10.1016/j.ocecoaman.2017.12.017
Armstrong, C. W., and van den Hove, S. (2008). The formation of policy for protection of cold-water coral off the coast of Norway. Mar. Policy 32, 66–73. doi: 10.1016/j.marpol.2007.04.007
Armstrong, C. W., Eide, A., Flaaten, O., Heen, K., and Kaspersen, I. W. (2014). Rebuilding the northeast arctic cod fisheries – economic and social issues. Arct. Rev. Law Polit. 5, 11–38.
Barbier, E. B., Moreno-Mateos, D., Rogers, A. D., Aronson, J., Pendleton, L., Danavaro, R., et al. (2014). Protect the deep sea. Nature 505, 475–477. doi: 10.1038/505475a
Borch, T., Moilanen, M., and Olsen, F. (2011). Marine fishing tourism in Norway. Structure and economic effects. Økonomisk Fiskeriforskning 21, 1–17.
Brattland, C., and Eythorsson, E. (2016). The fishing span - the Spildra fishers activity and aquaculture (in Norwegian). Fiskesløyfa: spildrafiskernes driftsformer og oppdrettsaktiviteten. Ottar 312, 23–33.
Cheng, S., and Long, J. S. (2007). Testing for IIA in the Multinomial logit model. Sociol. Methods Res. 35, 583–600. doi: 10.1177/0049124106292361
Dalen, H. M., and Halvorsen, B. (2011). Gender Differences in Environmental Related Behaviour. Statistics Norway Report No. 38/2011.
Eddy, T. D. (2014). One hundred-fold difference between perceived and actual levels of marine protection in New Zealand. Mar. Policy 46, 61–67. doi: 10.1016/j.marpol.2014.01.004
EU (ed.). (2017). “Report on the Blue Growth Strategy. Towards more sustainable growth and jobs in the blue economy,” in Commission Staff Working Document, (Brussels: EU Commission).
Graeger, N. (1996). Environmental security? J. Peace Res. 33, 109–116. doi: 10.1177/0022343396033001008
Guest, H., Lotze, H. K., and Wallace, D. (2015). Youth and the sea: ocean literacy in Nova Scotia, Canada. Mar. Policy 58, 98–107. doi: 10.1016/j.marpol.2015.04.007
Halpern, B. S., Walbridge, S., Selkoe, K. A., Kappel, C. V., Micheli, F., D’Agrosa, C., et al. (2008). A global map of human impact on marine ecosystems. Science 319, 948–952. doi: 10.1126/science.1149345
Hanley, N., Wright, R. E., and Adamowicz, V. (1998). Using choice experiments to value the environment. Environ. Resour. Econ. 11, 413–428. doi: 10.1023/a:1008287310583
Hausman, J., and McFadden, D. (1984). Specification tests for the multinomial logit model. Econometrica 52, 1219–1240. doi: 10.2307/1910997
Hensher, D. A., Rose, J. M., and Greene, W. H. (2005). Applied Choice Analysis. A Primer. Cambridge: Cambridge University Press. doi: 10.1017/CBO9780511610356
Husebø,Å., Nøttestad, L., Fosså, J. H., Furevik, D. M., and Jørgensen, S. B. (2002). Distribution and abundance of fish in deep-sea coral habitats. Hydrobiologia 471, 91–99. doi: 10.1023/A:1016549203368
Johnsen, J. P., and Jentoft, S., (2018). “Transferable quotas in Norwegian fisheries,” in Fisheries Quota, Management and Quota Transfer, ed. G. M. Winder (Amsterdam: MARE Publication Series, Springer).
Kutti, T., Bergstad, O. A., Fosså, J. H., and Helle, K. (2014). Cold-water coral mounds and sponge-beds as habitats for demersal fish on the Norwegian shelf. Deep Sea Res. Part II Top. Stud. Oceanogr. 99, 122–133. doi: 10.1016/j.dsr2.2013.07.021
LaRiviere J., Czajkowski, M., Hanley, N., Aanesen, M. Falk-Petersen, J., and Tinch, D. (2014). The value of familiarity: effects of knowledge and objective signals on willingness to pay for a public good. J. Environ. Econ. Manage. 68, 376–389. doi: 10.1016/j.jeem.2014.07.004
McFadden, D. (1974). The measurement of urban travel demand. J. Public Econ. 3, 303–328. doi: 10.1016/0047-2727(74)90003-6
Meld. St. 16 (2014/2015). Report to the Parliament: Forutsigbar og Miljømessig Bærekraftig Vekst i Norsk Lakse- og Ørretoppdrett. (Predictable and Environmentally Sustainable growth in Norwegian Salmon and Trout Farming). Oslo: Ministry of Trade, Industry and Fisheries.
Millennium Ecosystem Assessment [MEA] (2005). Ecosystems and Human Wellbeing. Synthesis. Washington DC: Island Press.
Morrison, M., Bennett, J. W., and Blamey, R. K. (1999). Valuing improved wetland quality using choice modelling. Water Resour. Res. 35, 2805–2814.
Mallawaarachchi, T., Blamey, R. K., Morrison, M. D., Johnson, A. K. L., and Bennett, J. W. (2001). Community values for environmental protection in a cane farming catchment in northern australia: a choice modelling study. J. Environ. Manag. 62, 301–316. doi: 10.1006/jema.2001.0446
Robards, M. D., Schoon, M. L., Meek, C. L., and Engle, N. L. (2011). The importance of social drivers in the resilient provision of ecosystem services. Glob. Environ. Change 21, 522–529. doi: 10.1016/j.gloenvcha.2010.12.004
Sandorf, E. D., Aanesen, M., and Navrud, S. (2016). Valuing unfamiliar and complex environmental goods. A comparison of valuation workshops and internet panel surveys with videos. Ecol. Econ. 129, 51–60. doi: 10.1016/j.ecolecon.2016.06.008
Skonhoft, A., and Solem, H. (2001). Economic growth and land-use changes: the declining amount of wilderness land in Norway. Ecol. Econ. 37, 289–301. doi: 10.1016/S0921-8009(00)00282-2
Statistics Norway (2018). Available at: https://www.ssb.no/statbank/table/12539
Togler, B., Garcia, M. A., and Macintyre, V. A. (2008). Differences in Preferences Towards the Environment. The Impact of Gender, Age and Parental Effect. Milano: Fondazione Eni Enrico Mattei.
Train, K. (2009). Discrete Choice Methods with Simulation, 2nd Edn. Cambridge: Cambridge University Press. doi: 10.1017/CBO9780511805271
Tromsø municipality (2015). Kystplan Tromsøregionen. Interkommunal Kystsoneplan for Kommunene Balsfjord, Karlsøy, Lyngen, Målselv og Tromsø (Inter-Municipal Coastal Zone Plan for the Municipalities Balsfjord, Karlsøy, Lyngen, Målselv and Tromsø - in Norwegian). Tromsø: Målselv Betongservice AS.
Villamor, G. B., Noordwijk, M. V., Djanibekov, U., Chiong, E. M., and Catacutan, J. D. (2014). Gender differences and land-use decisions: shaping multifunctional landscapes. Curr. Opin. Environ. Sustain. 6, 128–133. doi: 10.1016/j.cosust.2013.11.015
WB/UN (ed.). (2017). The Potential of the Blue Economy: Increasing Long-term Benefits of the Sustainable Use of Marine Resources for Small Island Developing States and Coastal Least Developed Countries. Washington, DC: World Bank.
Weaver, P., and Johnson, D. (2012). Think big for marine conservation. Nature 483:399. doi: 10.1038/483399a
Appendix
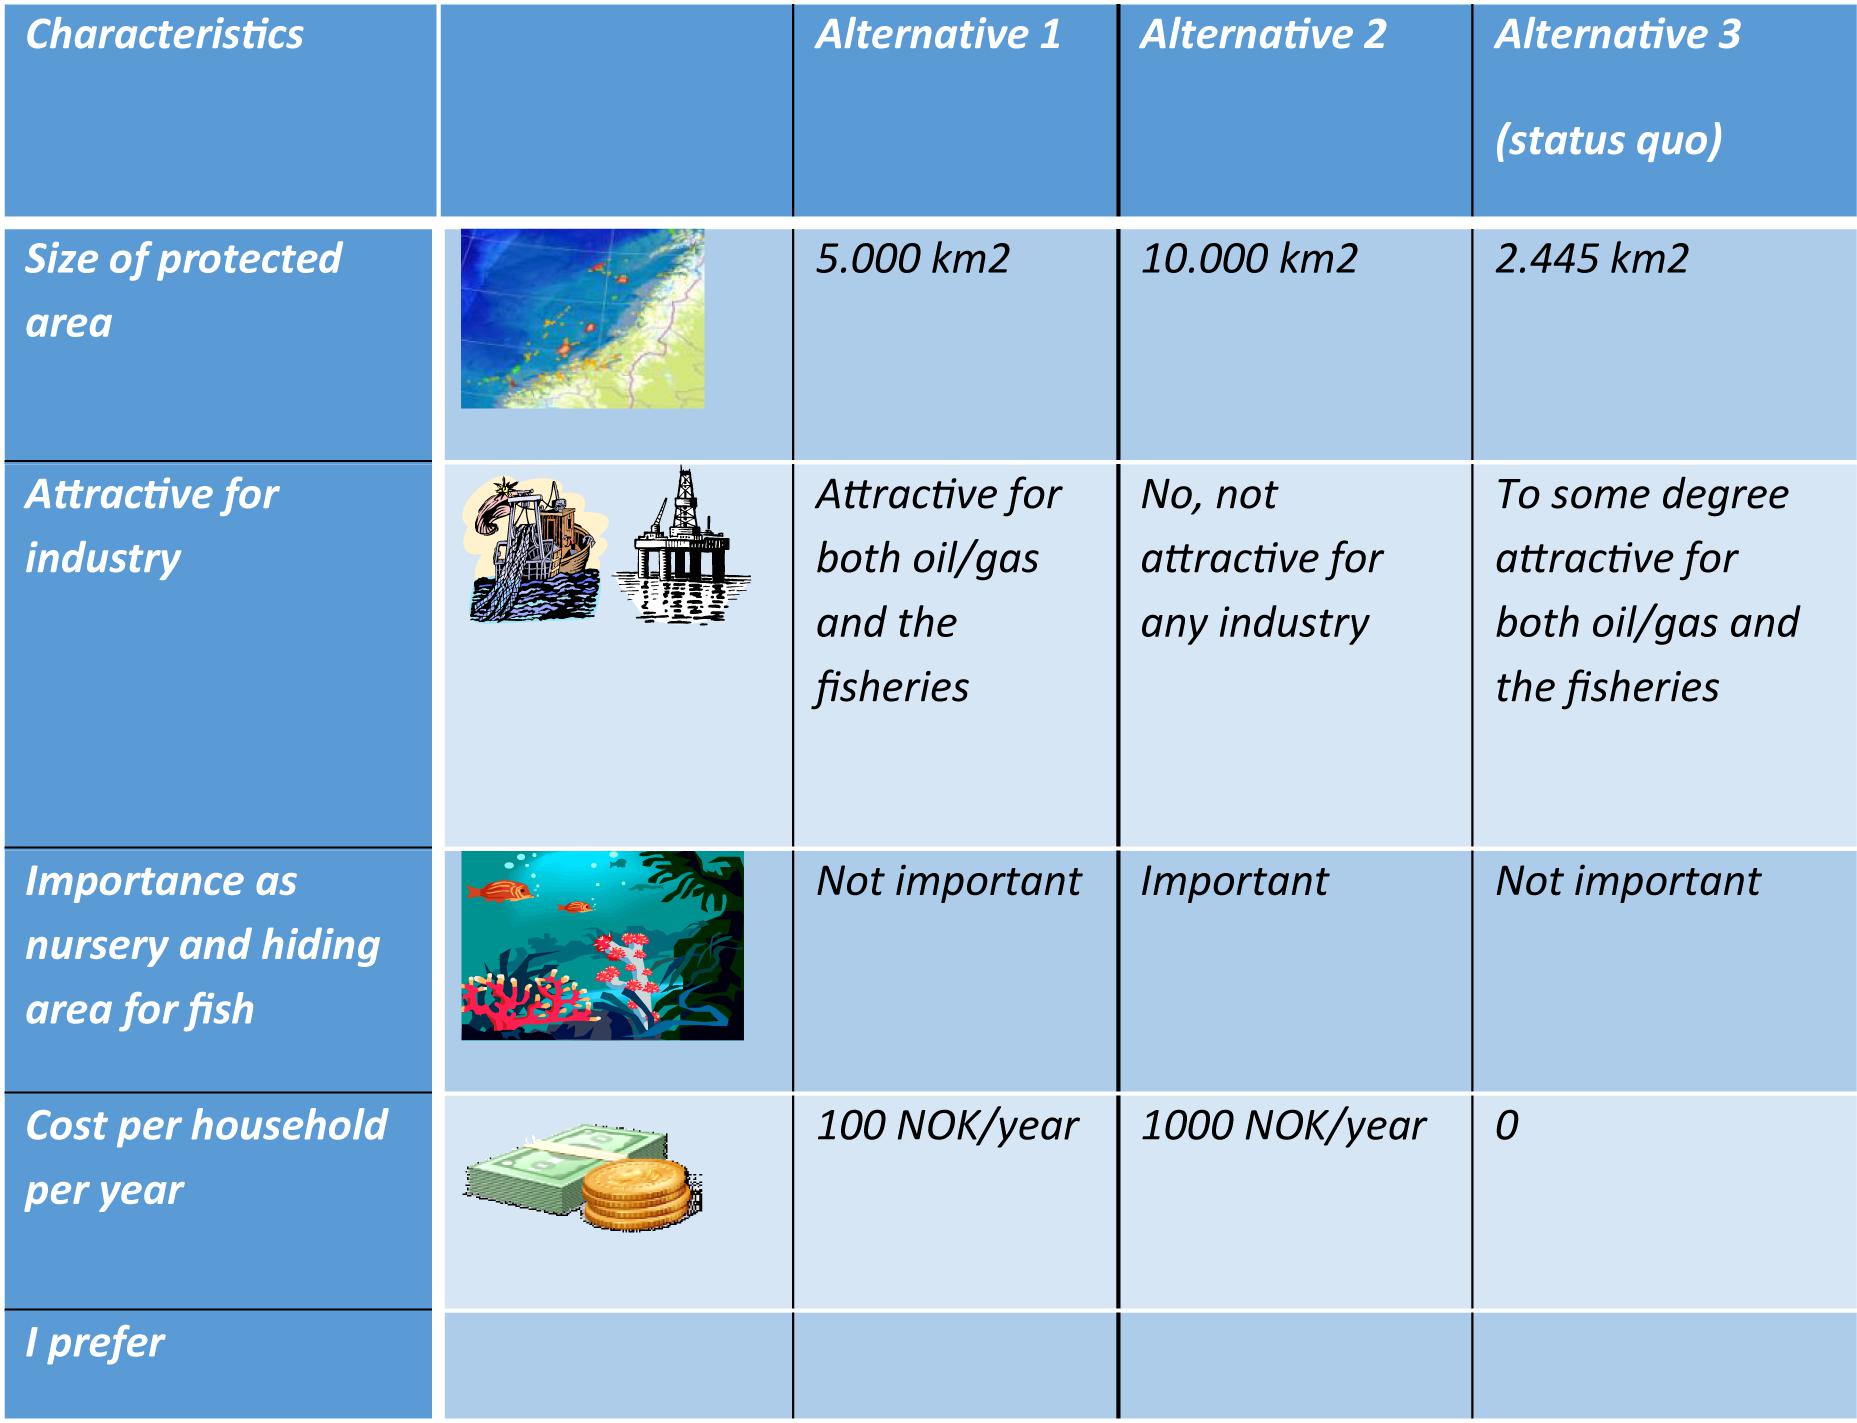
Figure A1. An example of a choice card used in the cold-water coral discrete choice experiment.
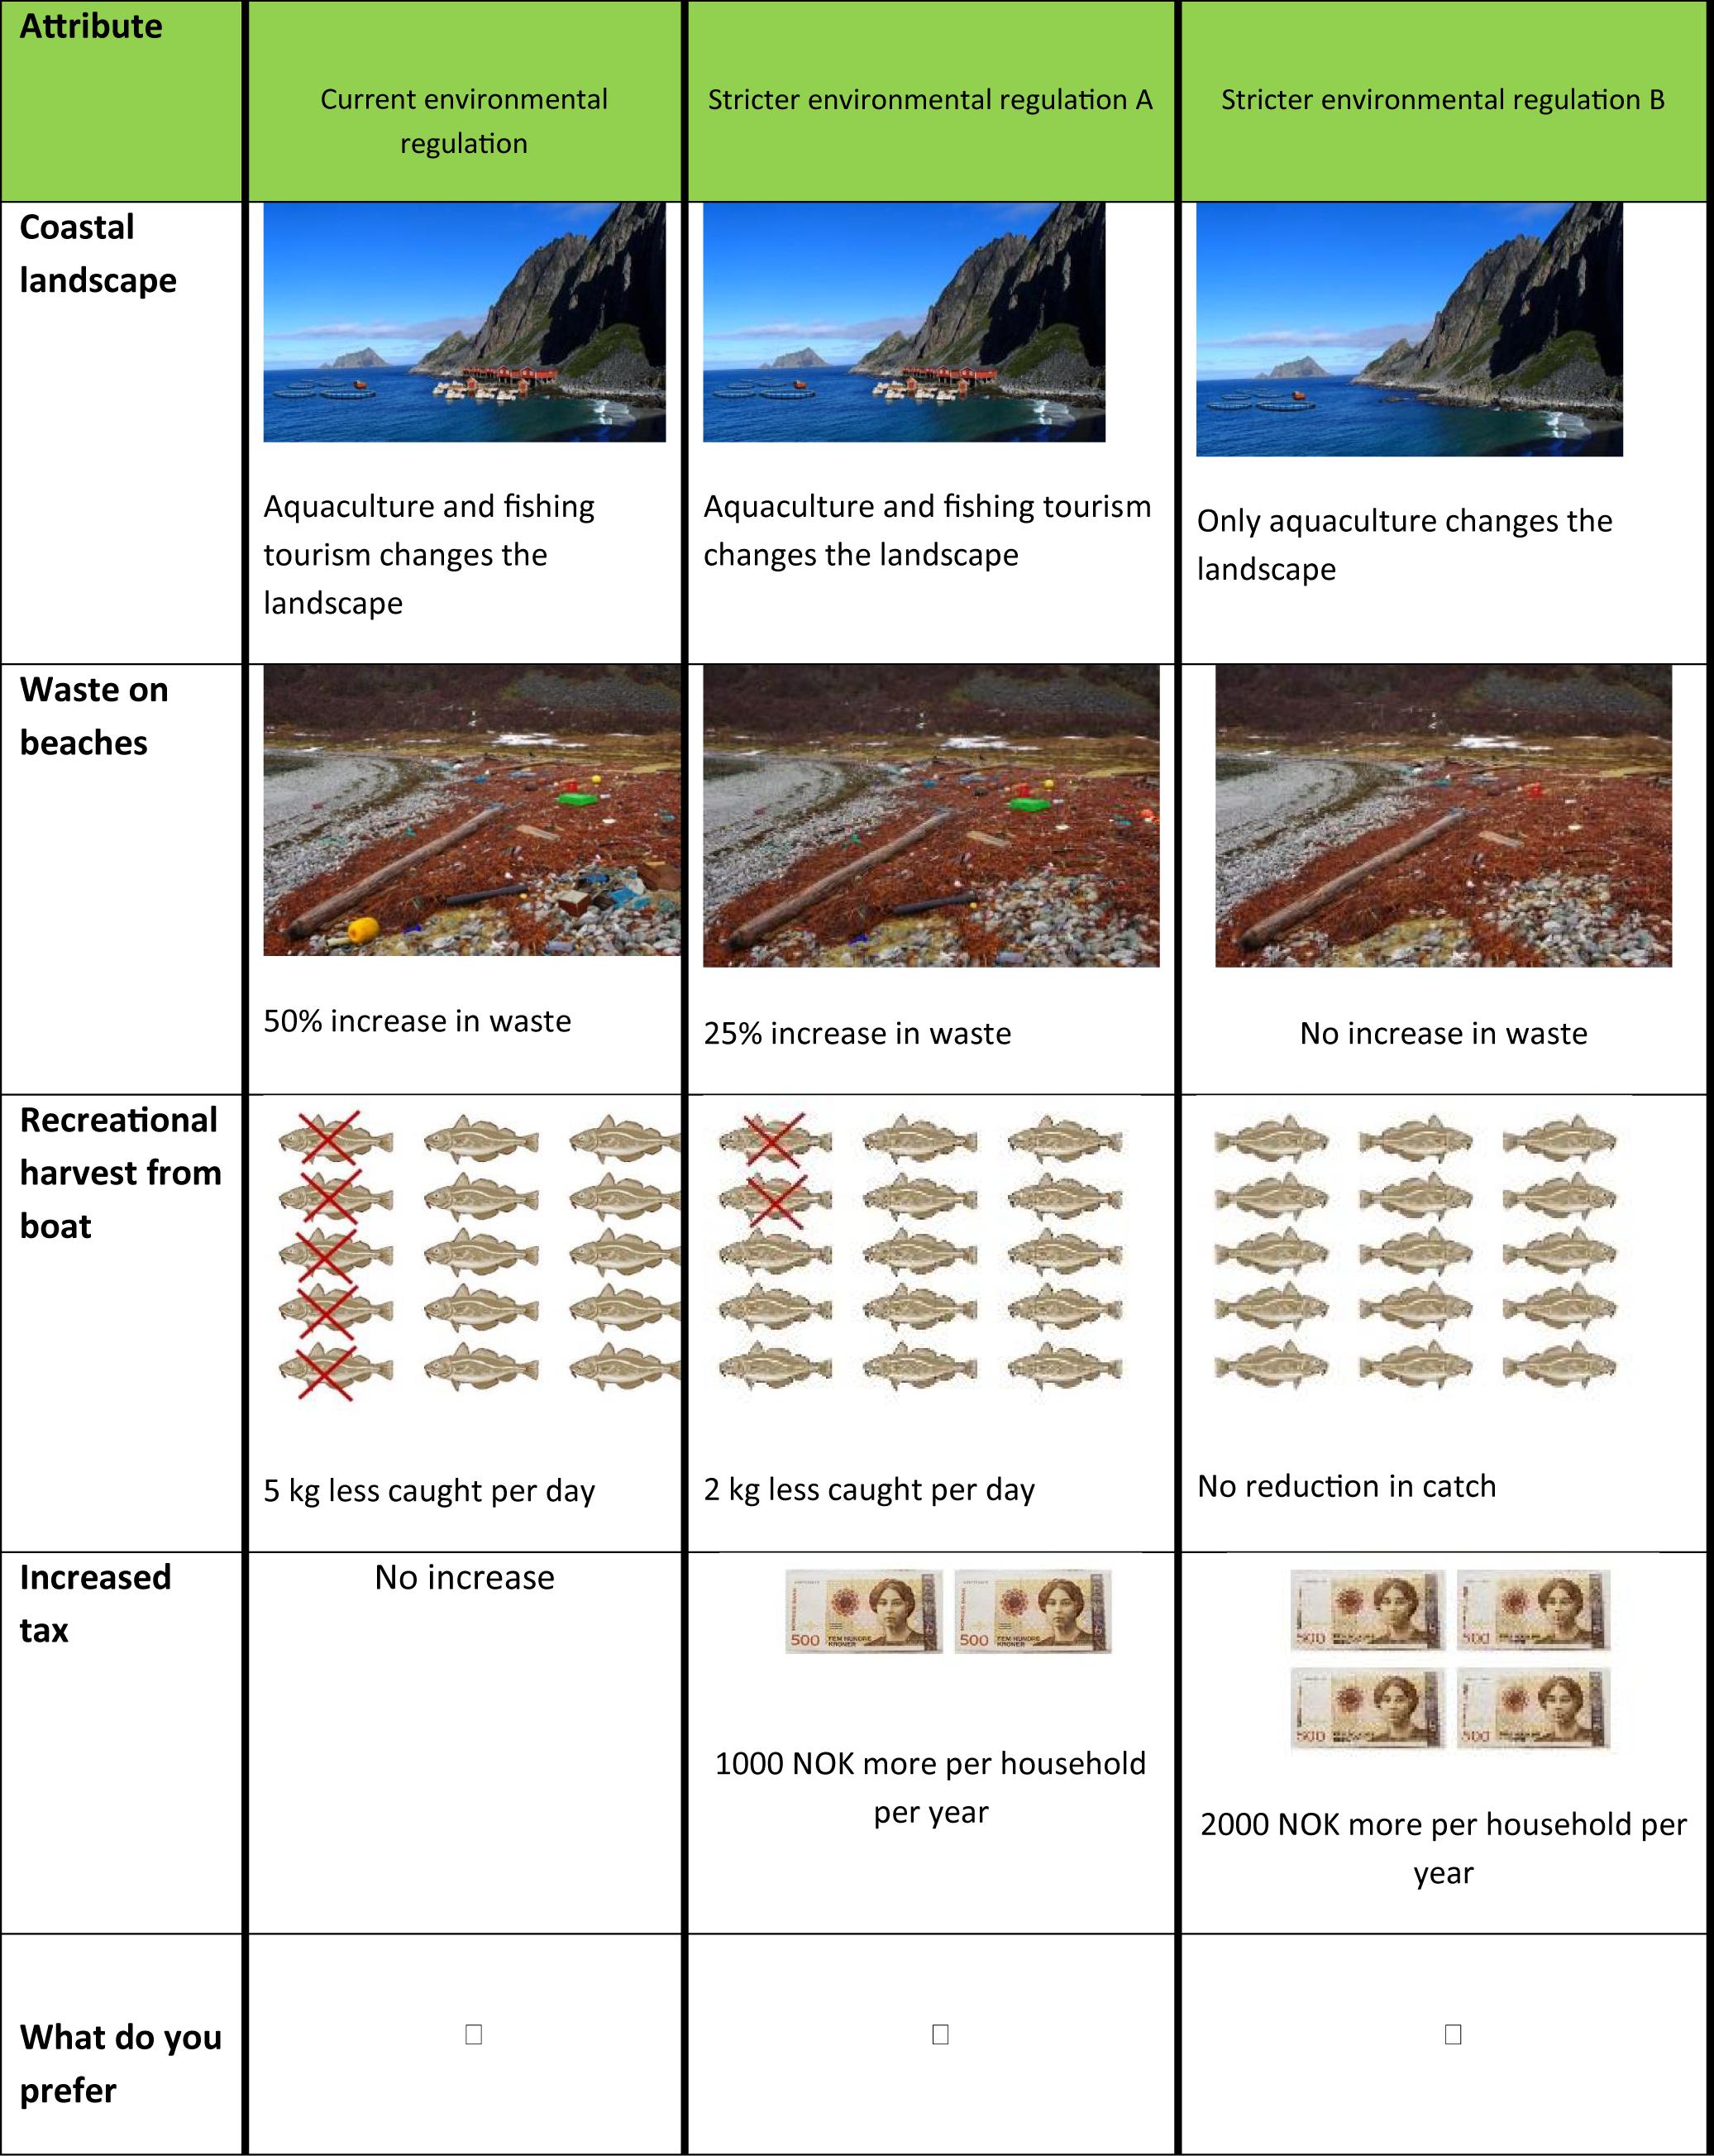
Figure A2. An example of a choice card used in the coastal recreation choice experiment.
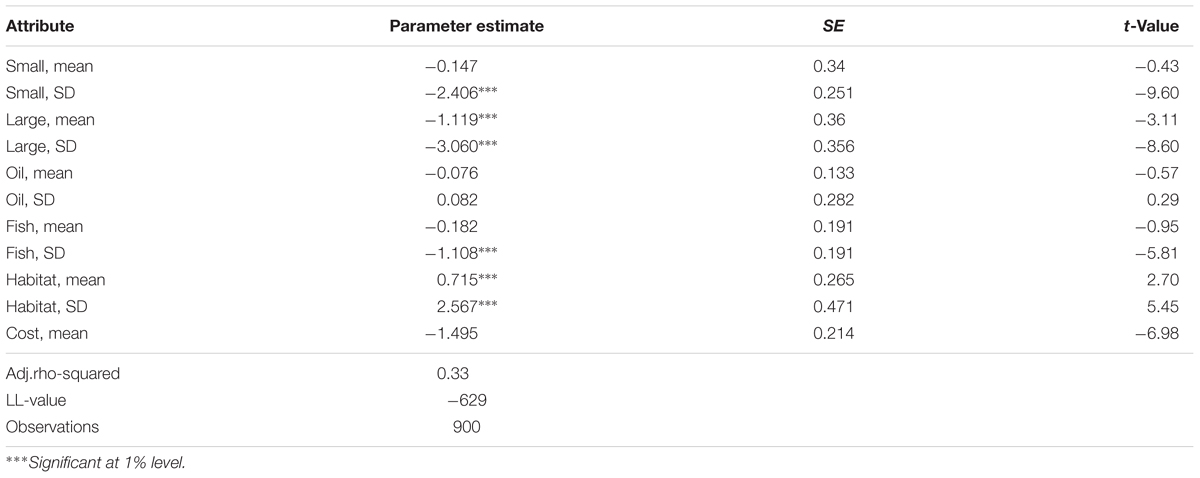
Table A1. Mixed MNL model for coral dataset.
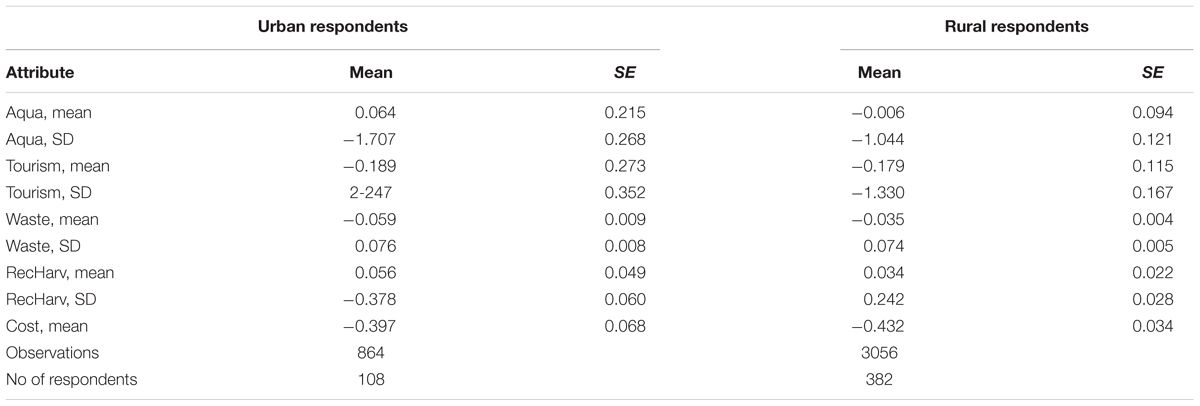
Table A2. Preference estimates for urban and rural respondents for the recreation dataset.
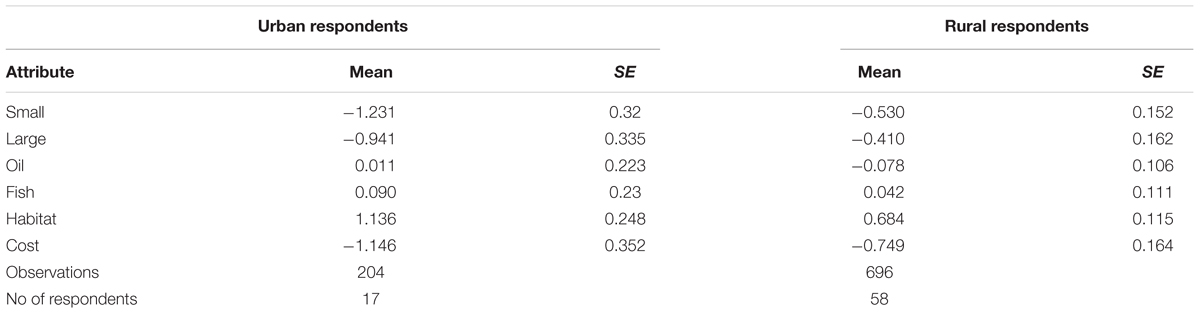
Table A3. Preference estimates for urban and rural respondents in coral dataset.
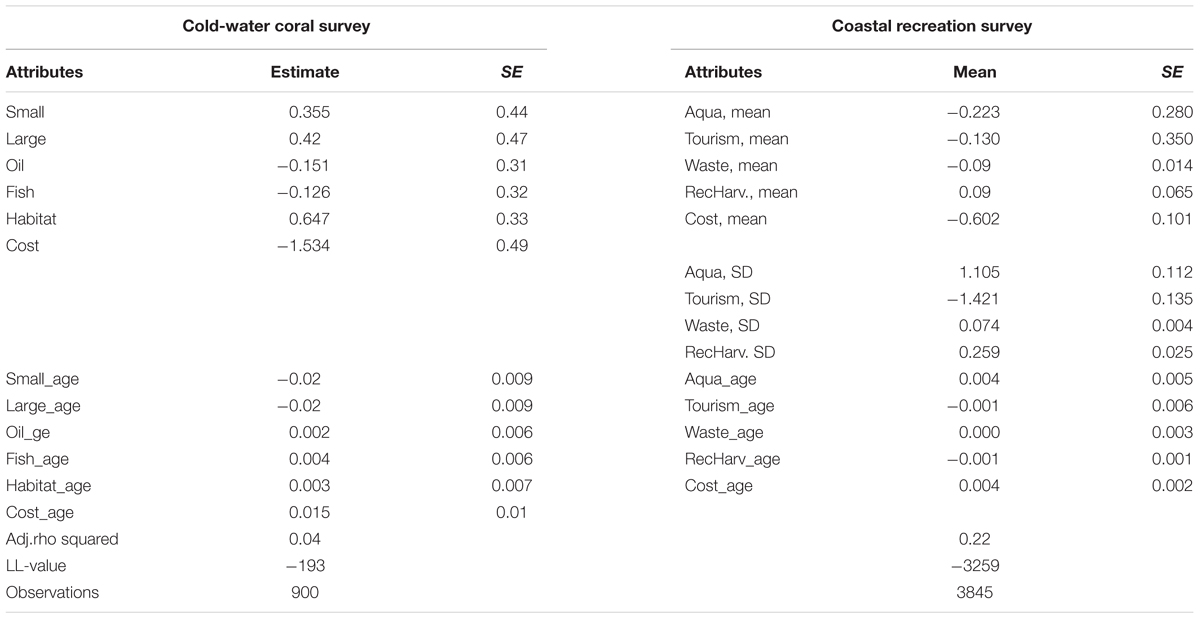
Table A4. Results for model with socio-demographic interaction for age.
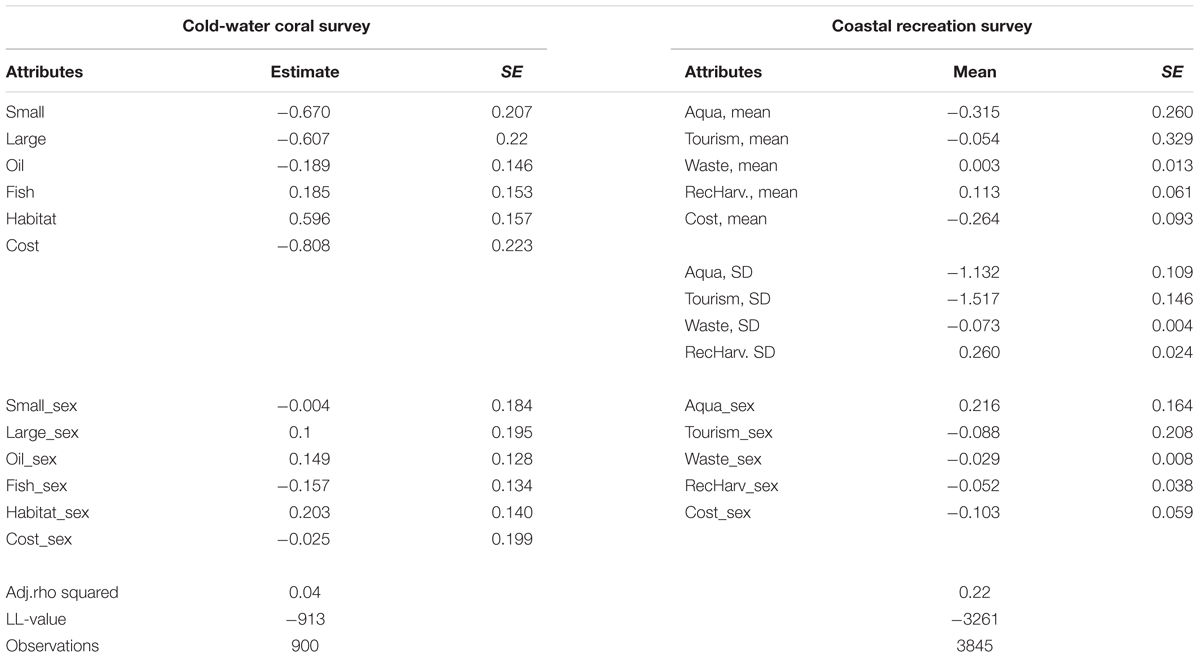
Table A5. Results for model with socio-demographic interaction for gender.
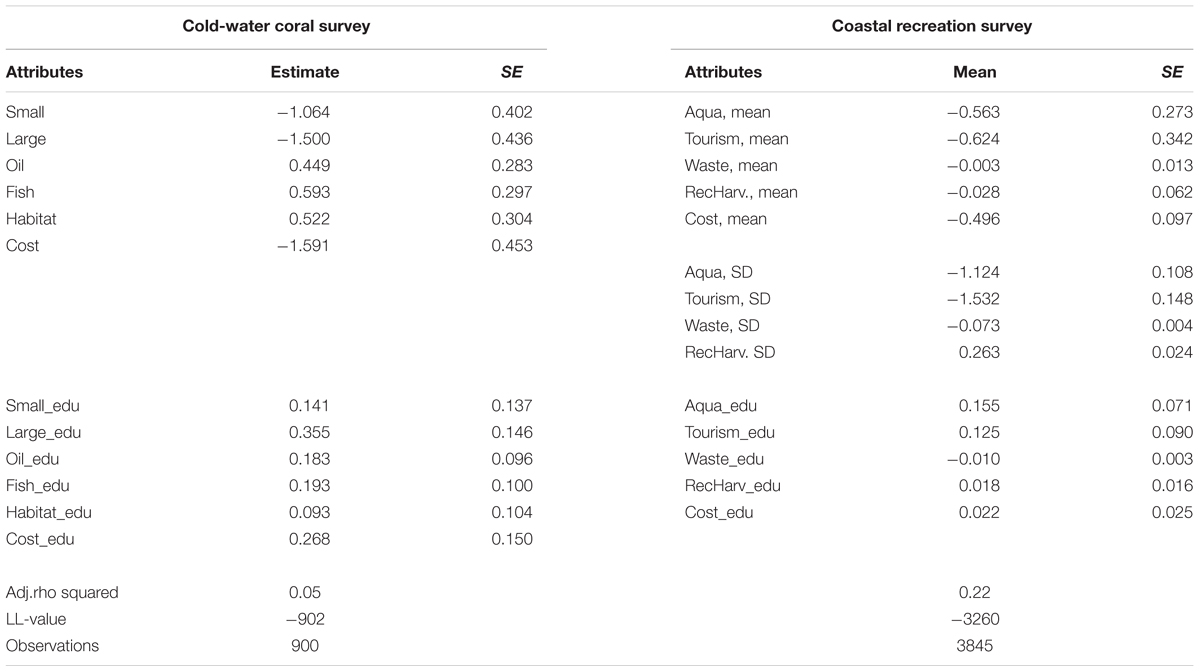
Table A6. Results for model with socio-demographic interaction for education.
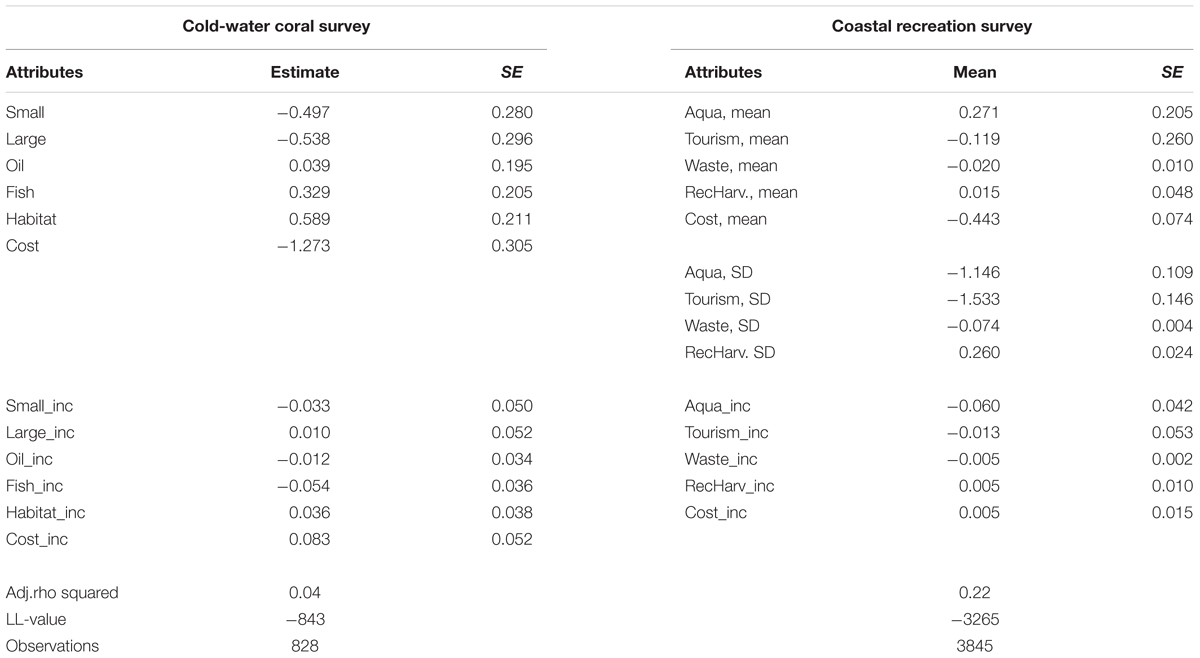
Table A7. Results for model with socio-demographic interaction for income.
Keywords: ecosystem services, Arctic, Norway, conversion, conservation
Citation: Aanesen M and Armstrong CW (2019) Trading Off Co-produced Marine Ecosystem Services: Natural Resource Industries Versus Other Use and Non-use Ecosystem Service Values. Front. Mar. Sci. 6:102. doi: 10.3389/fmars.2019.00102
Received: 25 September 2018; Accepted: 20 February 2019;
Published: 22 March 2019.
Edited by:
Sebastian Villasante, University of Santiago de Compostela, SpainReviewed by:
Donata Melaku Canu, Istituto Nazionale di Oceanografia e di Geofisica Sperimentale (OGS), ItalyIbon Galparsoro, Centro Tecnológico Experto en Innovación Marina y Alimentaria (AZTI), Spain
Copyright © 2019 Aanesen and Armstrong. This is an open-access article distributed under the terms of the Creative Commons Attribution License (CC BY). The use, distribution or reproduction in other forums is permitted, provided the original author(s) and the copyright owner(s) are credited and that the original publication in this journal is cited, in accordance with accepted academic practice. No use, distribution or reproduction is permitted which does not comply with these terms.
*Correspondence: Claire W. Armstrong, Y2xhaXJlLmFybXN0cm9uZ0B1aXQubm8=