 Abigail McQuatters-Gollop1*
 Ian Mitchell2Cristina Vina-Herbon3Jacob Bedford1Prue F. E. Addison4
 Christopher P. Lynam5
 P. N. Geetha6Estee Ann Vermeulan7Kaylee Smit7
 Daniel T. I. Bayley8
 Elisabeth Morris-Webb9
 Holly J. Niner10
 Saskia A. Otto11
- 1Centre for Marine and Conservation Policy, University of Plymouth, Plymouth, United Kingdom
- 2Joint Nature Conservation Committee, Aberdeen, United Kingdom
- 3Joint Nature Conservation Committee, Peterborough, United Kingdom
- 4Interdisciplinary Centre for Conservation Science, Department of Zoology, University of Oxford, Oxford, United Kingdom
- 5Centre for Environment, Fisheries and Aquaculture Science, Lowestoft Laboratory, Lowestoft, United Kingdom
- 6PG and Research Department of Zoology, Mahatma Gandhi University, Kottayam, India
- 7Institute for Coastal and Marine Research, Ocean Sciences Campus, Nelson Mandela University, Port Elizabeth, South Africa
- 8Centre for Biodiversity and Environment Research, University College London, London, United Kingdom
- 9School of Ocean Sciences, Bangor University, Menai Bridge, United Kingdom
- 10Faculty of Engineering, University College London, Adelaide, SA, Australia
- 11Institute of Marine Ecosystem and Fishery Science, Center for Earth System Research and Sustainability, University of Hamburg, Hamburg, Germany
Indicators are effective tools for summarizing and communicating key aspects of ecosystem state and have a long record of use in marine pollution and fisheries management. The application of biodiversity indicators to assess the status of species, habitats, and functional diversity in marine conservation and policy, however, is still developing and multiple indicator roles and features are emerging. For example, some operational biodiversity indicators trigger management action when a threshold is reached, while others play an interpretive, or surveillance, role in informing management. Links between biodiversity indicators and the pressures affecting them are frequently unclear as links can be obscured by environmental change, data limitations, food web dynamics, or the cumulative effects of multiple pressures. In practice, the application of biodiversity indicators to meet marine conservation policy and management demands is developing rapidly in the management realm, with a lag before academic publication detailing indicator development. Making best use of biodiversity indicators depends on sharing and synthesizing cutting-edge knowledge and experience. Using lessons learned from the application of biodiversity indicators in policy and management from around the globe, we define the concept of ‘biodiversity indicators,’ explore barriers to their use and potential solutions, and outline strategies for their effective communication to decision-makers.
Introduction
Threats to marine biodiversity, from human activities such as fishing, shipping, coastal development, and energy production and from indirect pressures, like climate change, are increasing (Halpern et al., 2015), with only 13% of the world ocean still considered unimpacted by humans, or ‘wild’ (Jones et al., 2018). The loss of marine biodiversity impacts the resilience of ecosystems and the ability to maintain essential ecosystem services that support human life, such as food provision and water quality maintenance (Worm et al., 2006). The vulnerable state of global marine ecosystems and the need to sustainably monitor, assess, and manage habitats and species is increasingly recognized (Addison et al., 2017). Consequently, the assessment of the state of marine biodiversity, with associated biodiversity management and conservation measures, is now explicitly articulated in national (Department of Environmental Affairs and Tourism, 2004; Natural Resource Management Ministerial Council, 2010; Defra, 2018), regional (Cartagena Convention, 1983; European Commission, 2008b, 2011), and international (United Nations, 2010; United Nations General Assembly, 2015) legislative mechanisms. These mechanisms address both marine policy (the setting of regulation through legislation) and management (implementation of management plans, monitoring, evaluation and reporting on the status of the marine environment).
‘Biodiversity’ is “the variability among living organisms, from all sources, including, inter alia, terrestrial, marine and other aquatic ecosystems and the ecological complexes of which they are part; this includes diversity within species, between species and of ecosystems” [Convention on Biological Diversity (CBD); United Nations, 1992]. In other words, ‘biodiversity’ refers broadly to all species and habitats in an ecosystem, rather than simply the number of taxa. This definition is broad, encompassing all marine and coastal species and habitats. It is impossible to monitor and assess the state of all aspects of marine biodiversity, so the complexity of biodiversity is typically reduced in dimension by using indicators to summarize its key aspects. Indicators are therefore frequently used in marine policy and management to assess and communicate change in ecosystem state. They are the primary tool for assessing progress toward the CBD Aichi targets, which aim to halt global biodiversity decline (Balmford et al., 2005; Tittensor et al., 2014; United Nations General Assembly, 2015). Indicators as a concept have been used for decades in marine fisheries management [e.g., commercial fish stock management in South Africa and Europe (Plagányi et al., 2007; ICES, 2018), ecosystem-based fisheries management in Australia, New Zealand, the United States, and Canada (Sainsbury et al., 2000; Link et al., 2002; Methratta and Link, 2006; Fu et al., 2015)], in marine pollution regulation [e.g., assessment and management of marine sediment pollution in the North Sea (OSPAR, 2017k), and pollution assessment of fish, crustaceans, and molluscs in the Baltic Sea (HELCOM, 2018)].
Unlike more established indicators in marine fisheries and pollution regulation, which are measurable against a clear objective or target, techniques to develop indicators and targets and to assess the status of marine biodiversity to inform biodiversity management more widely, however, are new but rapidly developing (e.g., Tam et al., 2017). In Europe, for example, the Marine Strategy Framework Directive (MSFD) uses biodiversity indicators to assess the state of marine habitats and species, with the overarching objective of achieving ‘Good Environmental Status’ (GES) (European Commission, 2008b). Similarly in South Africa, the National Biodiversity Strategy and Action Plan aims to achieve ‘Good Ecological Condition’ which refers to ecosystems that are intact or largely intact with minimal modification from a natural condition (Department of Environmental Affairs, 2015). In the United States, implementing the ecosystem-based approach to management has moved to the forefront of efforts, including the development of quantitative indicators and criteria that can be used to assess overall ecosystem status (Leslie and McLeod, 2007). Where ecological data are lacking, such as in South Africa, expert judgment is often used to set targets for marine biodiversity indicators (e.g., Driver et al., 2011; Department of Environmental Affairs, 2015). Under the MSFD, while some biodiversity indicators already have agreed quantitative targets for individual regions (Defra, 2012; HELCOM, 2018), targets for other regions or indicators are still in development. Approaches to indicator development and target setting for effective management require not only a clear understanding of the system in question, which might need substantial amounts of data in some cases, but also explicit policy goals or objectives. These attributes may inhibit indicator development and policy uptake.
In June 2018, international developers and users of marine biodiversity indicators participated in a symposium and focus group entitled “From science to evidence – innovative uses of biodiversity indicators for effective marine policy and conservation” as part of the 5th International Marine Conservation Congress (IMCC5) in Kuching, Malaysia. The mission of the symposium and focus group was to form a community of practice for both users and developers of biodiversity indicators for marine policy and conservation, and to provide a forum to share successes and failures in developing and applying these indicators. Themes emerged which are common across geographic regions and political scales. This paper uses lessons learned from the application of biodiversity indicators in policy from around the globe to define the concept of biodiversity indicators, explore and discuss barriers and solutions to their use, and outline strategies for their effective communication to policy-makers.
Concept, Use, and Suitability of Biodiversity Indicators
The wide definition of the terms ‘indicator’ and ‘biodiversity,’ as well as their broad applicability, can lead to confusion regarding the function of a biodiversity indicator. For instance, indicators can be defined simply as a “quantitative or qualitative variable that provides reliable means to measure a particular phenomenon or attribute” (USAID, 2009) or, using a process-oriented definition, as a “quantitative or qualitative factor or variable that provides a simple and reliable means to measure achievement, to reflect changes connected to an intervention, or to help assess the performance of a development actor” (OECD, 2002). In a marine context, indicators have been defined as a tool “to monitor and assess the state of the marine environment and to manage human activities having an impact upon it” (European Commission, 2008b). Under the Convention of Biological Diversity (CBD), indicators are defined as tools “for assessing progress toward, and communicating the 2010s target at the global level” (United Nations Environment Programme, 2004), which hereby further extends their application and allows a broader use of terminology.
A bibliographic analysis of >2500 abstracts queried from the Web of Science database revealed a difference in treatment of the term ‘biodiversity indicator’ between academic scientists, marine policy-makers and managers (Figure 1). In publications on marine systems, ‘ecosystem indicator’ is used more commonly and synonymously with ‘biodiversity indicator,’ though the use of the ‘biodiversity indicator’ is increasing (see Figure 1A). Overall, we found that depending on the purpose, region, or policy context, indicator terminologies can differ despite representing similar ecosystem/biodiversity components. Nevertheless, biodiversity indicators are still often represented by conventional diversity indices such as species richness or evenness. These indices can be highly useful for summarizing and assessing community structures such as biogenic reefs or infaunal communities and linking them to anthropogenic pressures such as trawling (Cook et al., 2013; Fariñas-Franco et al., 2014; Van Loon et al., 2018). To provide sufficient information on ecosystem dynamics and processes for sound policy and management, however, other components such as biological trait diversity and ecosystem functioning can be similarly useful (Diaz and Cabido, 2001; Juan et al., 2007; Bremner, 2008; Pacheco et al., 2011).
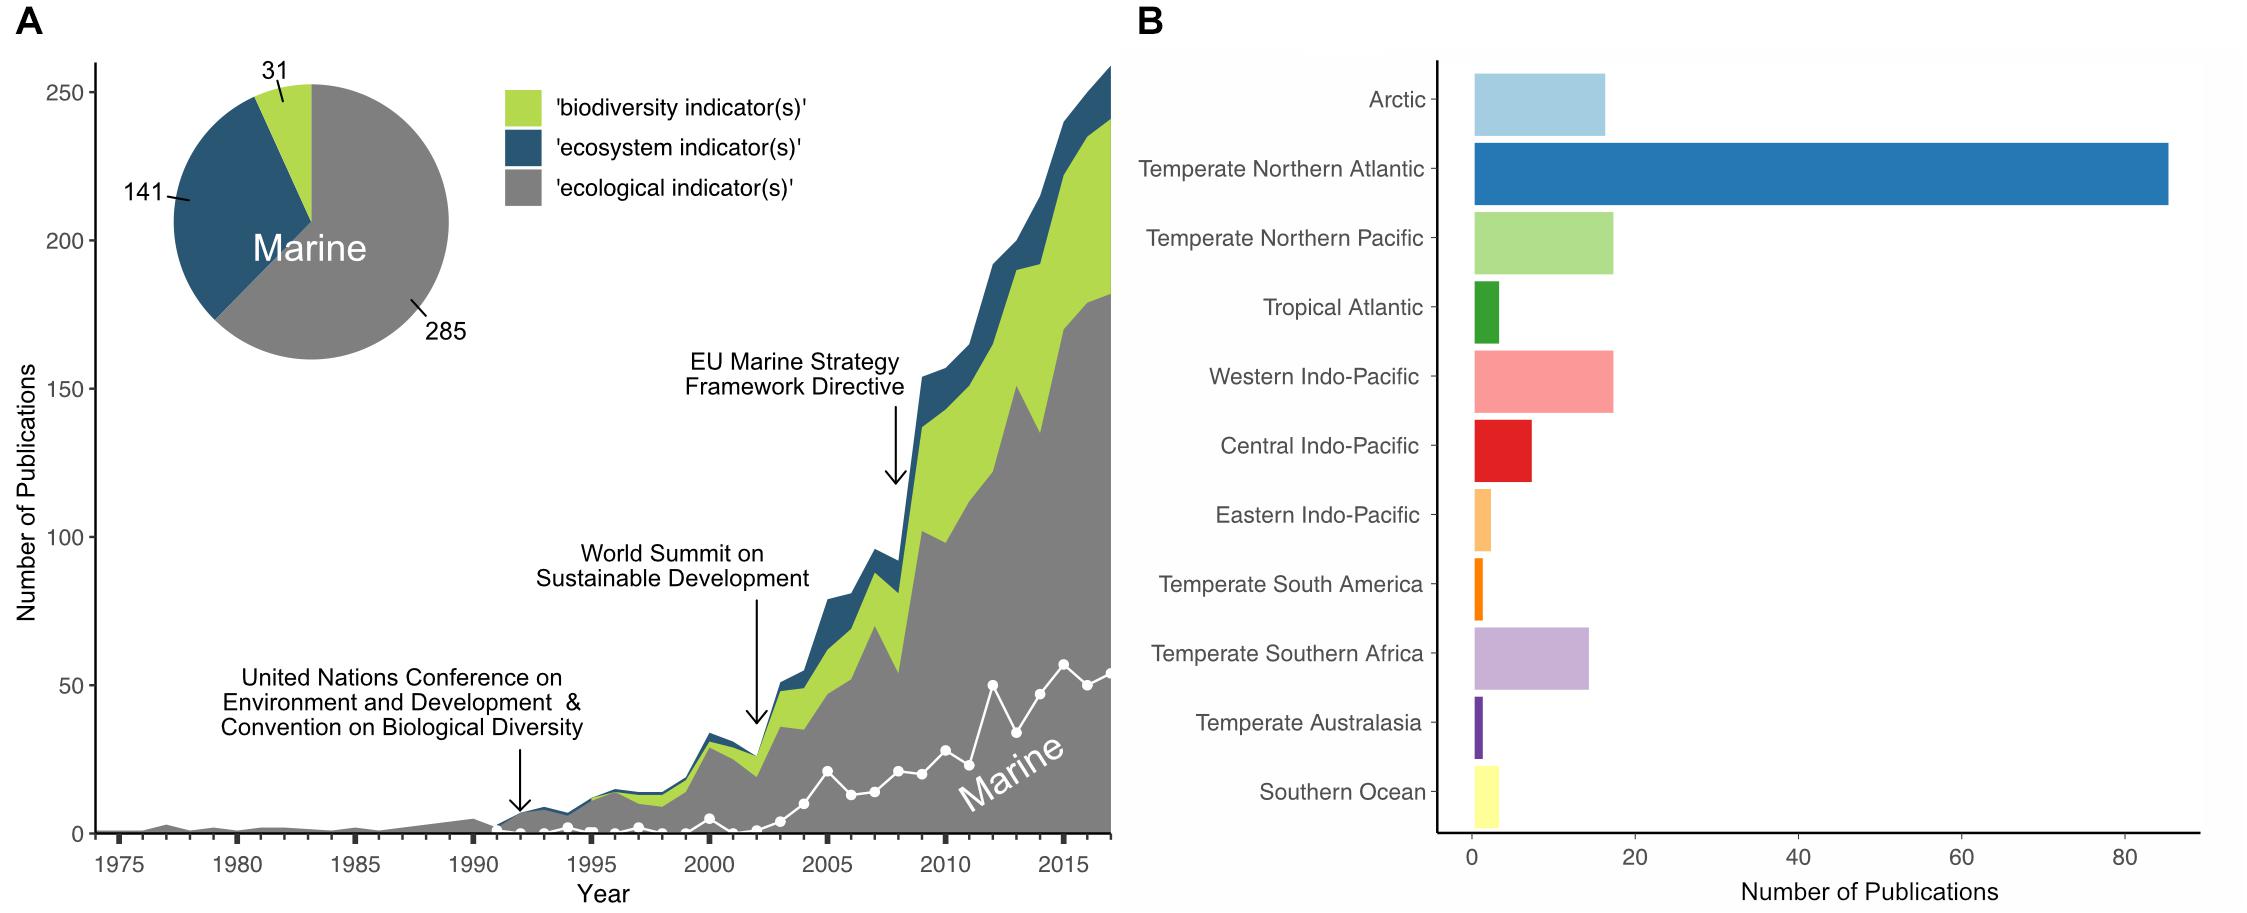
Figure 1. Bibliographic analysis of publications on biodiversity, ecological, or ecosystem indicators in general and for marine systems specifically. (A) The number of publications using one of the indicator terms [biodiversity (green shading), ecosystem (blue shading), or ecological (gray shading) indicator(s)] between 1975 and 2017 (total of 2502), and the number of publications using these terms in relation to marine systems only (white trend line; total of 457), shown in relation to the years when three significant international or regional legislative frameworks were implemented. (B) The geographic distribution of a subset of 1430 publications across marine ecoregions (Spalding et al., 2007), extracted from publication abstracts and keywords. The bibliographic data were queried from the Web of Science database (accessed last Sept 18th, 2018).
The implementation of regional and international legislative frameworks has triggered a big rise in developing biodiversity indicators to determine the state of the ecosystem and its components in the last two decades. Publications on ‘ecological,’ ‘ecosystem,’ or ‘biodiversity’ indicators started to increase in the early 1990s after the United Nations Conference on Environment and Development with the resulting ratification of the CBD (Figure 1A) (United Nations, 1992) and the publication of the Organization for Economic Co-operation and Development (OECD) core set of indicators for environmental performance reviews (OECD, 1993). Publications addressing marine systems, however, started much later, in the mid-2000s, and so represent only 18% of all articles on biodiversity indicators, covering predominantly the temperate northern Atlantic ecoregion (see Figure 1B).
While the term ‘biodiversity’ may refer strictly to the diversity of biological components in an ecosystem, ‘biodiversity’ is increasingly used to reflect a much broader ecosystem view. This broader definition includes trophic interactions, network structure and system stability or resilience (e.g., Samhouri et al., 2009; Dakos et al., 2011), which is in line with the Convention on Biodiversity’s definition of ‘biodiversity,’ above, and is often used by applied scientists, policy-makers, and managers. It is this second definition of ‘biodiversity’ that is used throughout this paper, due to its frequency of use in conservation. While we do not want to ignite a discussion on terminology superiority, we want to highlight the importance of understanding biodiversity in a wider context and propose a more flexible approach to the term ‘biodiversity indicator’ that includes multiple concepts such as ecosystem structure and functioning (as outlined by the Essential Biodiversity Variables for policy; Pereira et al., 2013).
In recent decades, a variety of approaches for the use of indicators in the marine environment have emerged, particularly in the temperate northern Atlantic ecoregion, which is largely triggered by the implementation of regional and international legislative frameworks (Figure 1). Table 1 illustrates some examples of the applied versatility of biodiversity indicators, providing a wide-range of evidence types, at different ecological and spatial scales, for the assessment and management of marine biodiversity within the context of the policy questions they aim to address.
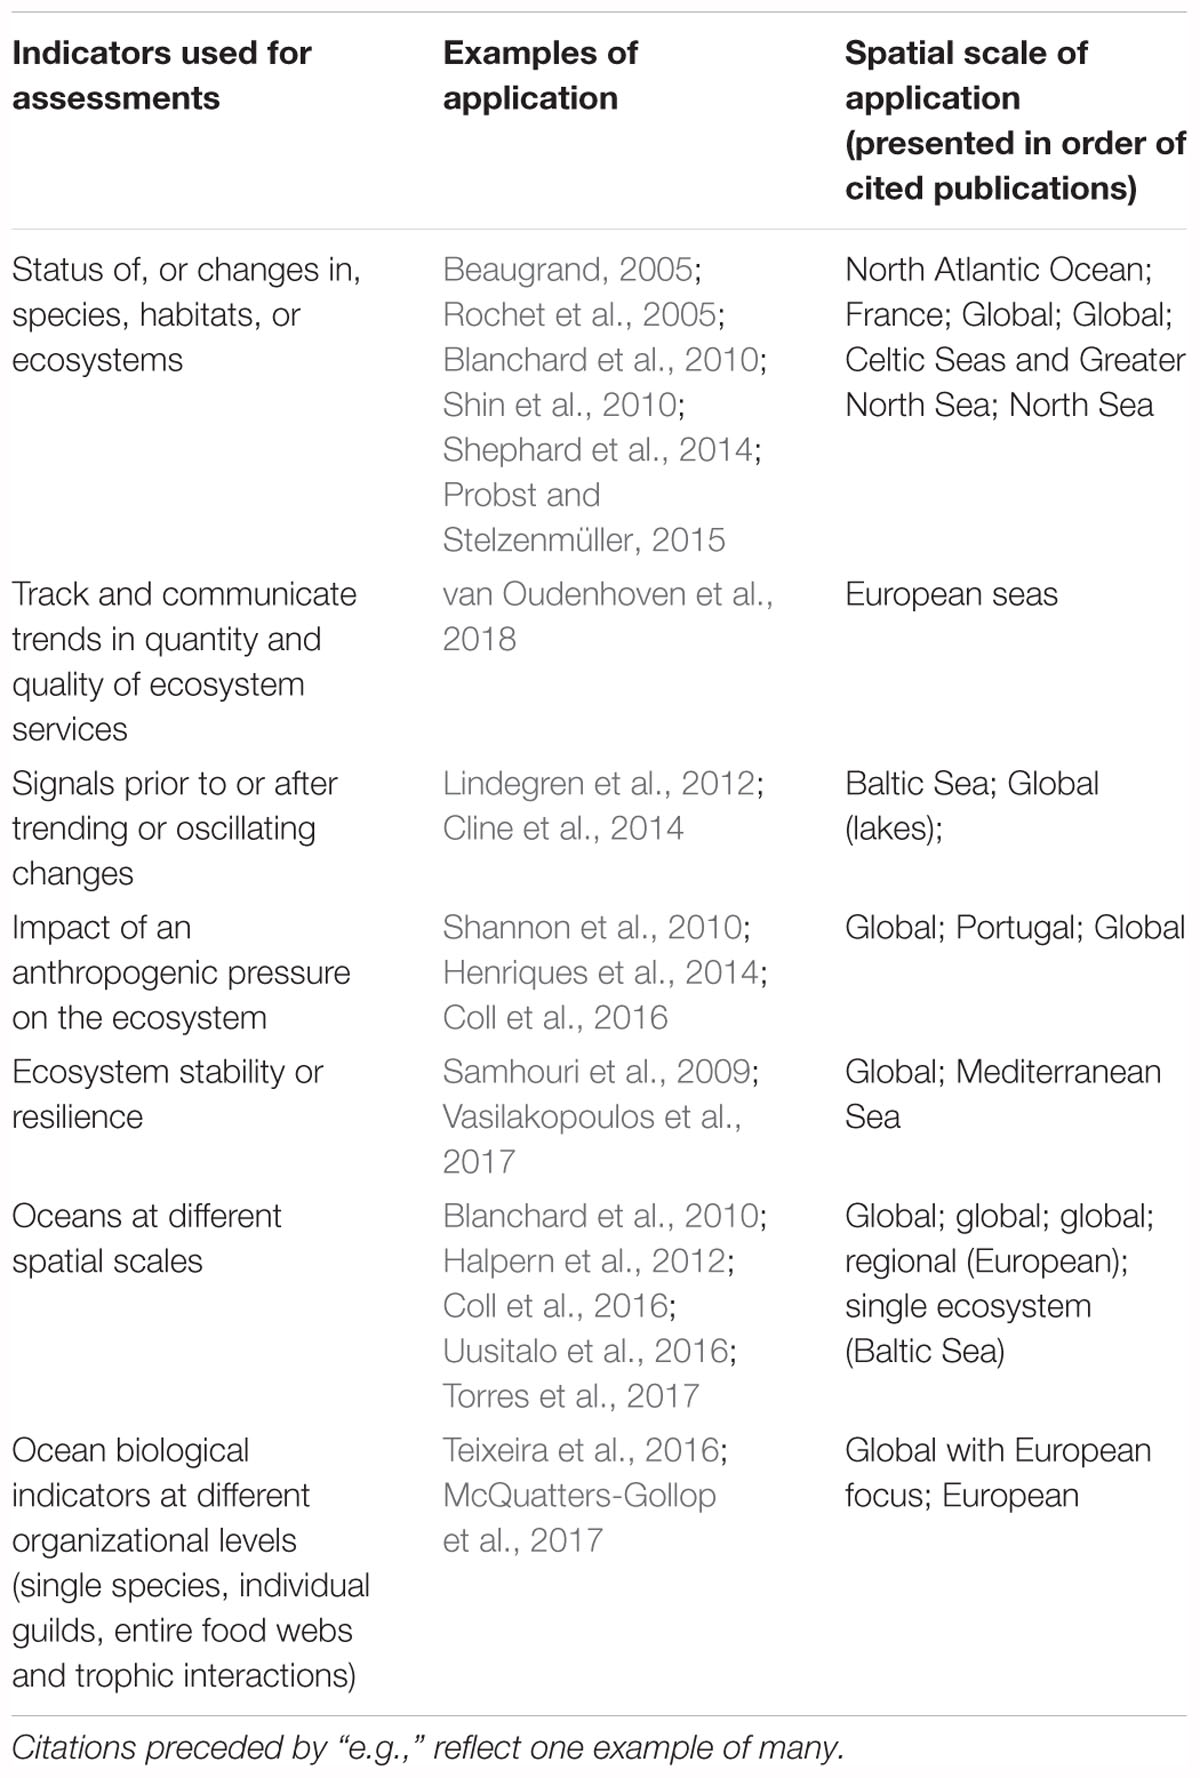
Table 1. Applications of biodiversity indicators relevant to marine environments and global marine conservation policy and management.
Despite the wide range of applications of biodiversity indicators observed during recent decades, specific selection criteria have been commonly accepted within the scientific community to determine indicator suitability for operational use. These include measurability, scientific basis, interpretability, and ease of communication, but also sensitivity and responsiveness to environmental changes, specificity, robustness with well-known pressure-state relationships, and links to identified targets and thresholds (e.g., OECD, 1993; FAO, 1997; Rice and Rochet, 2005; Heink and Kowarik, 2010; Kershner et al., 2011; Queirós et al., 2016; Otto et al., 2018a). Biodiversity indicators that address policy and management goals are likely to be most effective if the relevant stakeholders and decision-makers also perceive them to be credible, salient, and legitimate (Cash et al., 2003; van Oudenhoven et al., 2018). Linking indicators to environmental conditions and ideally to management measures requires a good understanding of indicator responses to pressures and a sound testing of indicator performance, which is often lacking for biodiversity indicators (Rossberg et al., 2017). Thus, new modeling approaches and decision support tools are emerging to tackle the performance evaluation of indicators for assessing the health status of marine ecosystem and biodiversity components (Hayes et al., 2015; Lynam et al., 2016; Otto et al., 2018a; Shin et al., 2018) (see also section Linking biodiversity indicators to ecosystem change). To complement assessments of state, additional pressure indicators can be useful, particularly to measure the impacts of human activities on the system when there can be a long time-lag before natural processes can be expected to respond (Rossberg et al., 2017).
Indicators that lack a clear link to a defined pressure, however, can still contribute effectively to the assessment and management of biodiversity. These indicators without clear links to defined pressures, known as ‘surveillance indicators’ (Shephard et al., 2015), may not be able to be assessed against quantitative thresholds, but can still provide contextual information on either wider ecosystem impacts of pressures or underlying environmental change (Bedford et al., 2018). Critically, indicators used in a ‘surveillance’ context should still increase the knowledge base from which to make management decisions. For example, a suite of ‘Essential Ocean Variables’ for biodiversity and ecosystem change has been identified by Miloslavich et al. (2018) to effectively reduce the complexity of ecosystem processes for a summary of ecosystem state. Although not linked to specific defined pressures, the impacts of both direct anthropogenic pressures and climate change on these ecosystem processes can be monitored and assessed, providing holistic surveillance information to support management.
Biodiversity Indicators in Policy and Management: Needs, Barriers, and Solutions
Indicator development is challenged by the need to establish associated targets, political acceptance, and evaluation of confidence to support widespread use for management of biodiversity (Table 2).
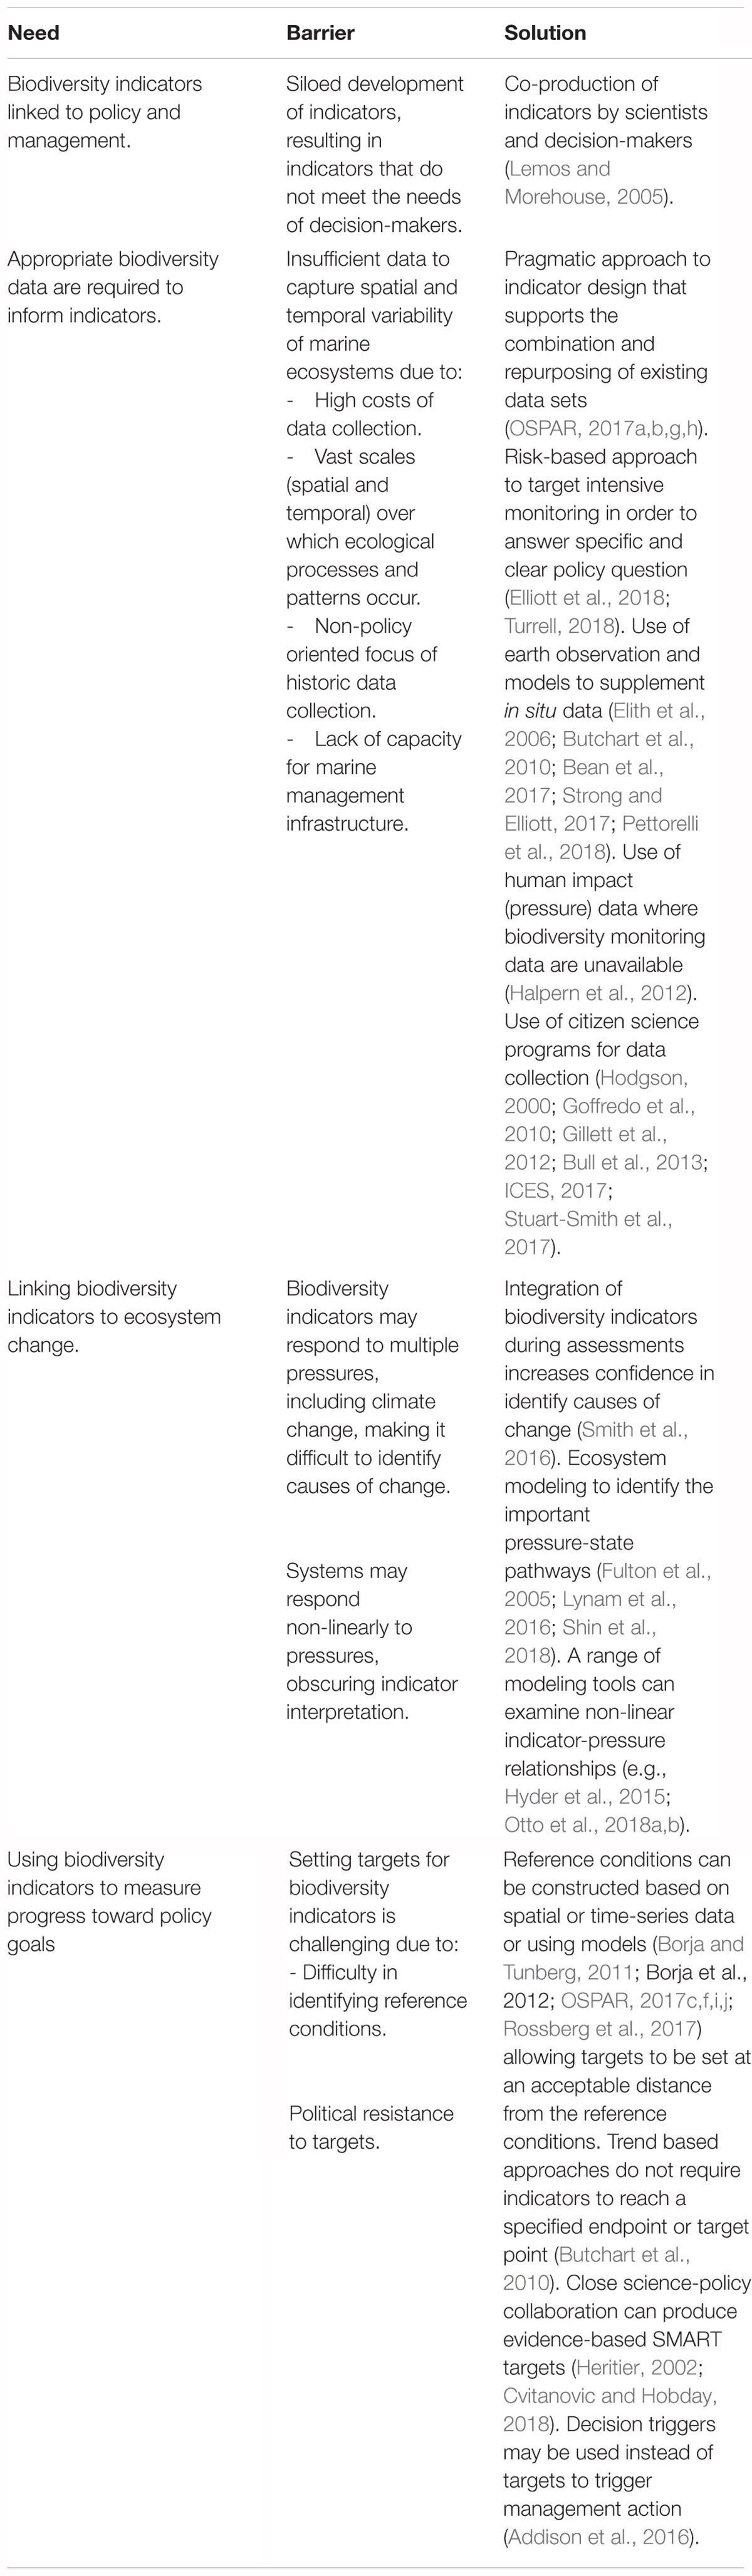
Table 2. Needs, barriers, and solutions to the development and use of marine biodiversity indicators.
Biodiversity Indicators Linked to Policy and Management
Often, scientists develop biodiversity indicators in academia, usually to address a scientific problem but also to assess the ecosystem status within the context of specific policies, and then publish their results in the scientific literature. A recent review by Bal et al. (2018) showed that indicators (in this case, those based on species traits) developed in academia and reported in the scientific literature typically fail to address decision-making requirements for biodiversity management, with only 21% of studies detailing how indicators explicitly address policy objectives. This review clearly demonstrates the broad use of the term ‘indicator,’ but it also shows that the academic approach to indicator development is often driven by scientific questions rather than a response to policy needs, or if policy-focused takes place outside the policy process. In such cases indicators are frequently not formally incorporated into the assessment of management objectives and targets (Bal et al., 2018). Regardless of the scientific soundness of an indicator, or even the appropriateness for a specific policy, the lack of involvement of end-users (e.g., marine managers, policy-makers, and stakeholders) during the development of indicators may result in unsuccessful implementation of the outputs or even the application and use of the indicator itself.
A solution resulting in fit-for-purpose biodiversity indicators is to co-produce indicators, with scientists providing the scientific input and decision-makers providing the policy steer (Lemos and Morehouse, 2005; Hayes et al., 2015; Bolman et al., 2018; Cvitanovic and Hobday, 2018; De Juan et al., 2018). Co-production spans the science-policy interface and is an iterative process, with each party relying on the other’s experience and expertise to gain a deeper understanding of the current science and policy landscapes, opportunities, and limitations (Lemos and Morehouse, 2005). The co-production of biodiversity indicators has resulted in their successful use in marine policy and management (e.g., in Australia and Europe; Pocklington et al., 2012; OSPAR, 2017d). For example, biodiversity indicators developed for the 2017 OSPAR Intermediate Assessment followed this process (OSPAR, 2017d). The indicators were developed by scientists with significant and consistent input from policy-makers to ensure the indicators fulfill policy obligations. As a result, the regional biodiversity assessments can be used by EU member states for the fulfillment of the MSFD (OSPAR, 2017d).
Data Requirements for Biodiversity Indicators
A basic requirement when developing a biodiversity indicator is an understanding of the types of data available and a critical evaluation of the temporal and spatial scales that are appropriate for the ecological processes being assessed and the pressures on the marine ecosystem. Large-scale monitoring programs collecting time-series data are very rare, particularly in offshore areas, mainly due to the costs of data collection (Koslow and Couture, 2013). Marine monitoring needs to be well governed, cost-effective, organized, transparent, open, designed on a scientific basis, and “fit for purpose” (Turrell, 2018). Furthermore, data collection for biodiversity indicators ideally should be tailored to the policy questions the indicator is trying to address, for example by developing relevant sampling strategies and power analyses to establish the level of sampling effort required to detect community change at a particular scale.
However, data-intensive indicators, even if they are high in confidence and accuracy, are not always practical for large scale biodiversity assessments, such as required for management of regional marine environments, especially for those ecosystem components for which monitoring is expensive. This lack of practicality is a particular challenge for evaluating ecological processes or distributional patterns of habitats or species which require monitoring surveys over a large spatial area as compared to verifying the presence of, for example, a sensitive species in an MPA (Barrio Froján, 2016).
The costs of data collection can pose a barrier to indicator development, particularly for low income countries, which contain some of the world’s most diverse species and habitats (Tittensor et al., 2010; Ramírez et al., 2017), but are generally poorly monitored due to economic challenges and lack of infrastructure and scientific experts (Danielsen et al., 2000). While high-income countries tend to pose more threats to marine ecosystems (Beck et al., 2011; Thurstan et al., 2013; Halpern et al., 2015; Fariñas-Franco et al., 2018), a lack of fundamental biodiversity research, capacity and coordination of information in low-income countries makes them highly vulnerable, particularly to climate change (Bellard et al., 2014). Many marine and coastal ecosystems are highly diverse, yet there is a lack of fundamental biodiversity research required to understand processes and species distributions in the marine environment (Griffiths et al., 2010). This lack of investment also extends to the capacity and coordination of marine biodiversity information within and outside of the scientific community which can prevent its use within decision-making (Atkinson et al., 2016).
A solution to overcome data shortages or limitations to access, involves a pragmatic approach to indicator construction, together with good use of existing ecological datasets for the relatively new purpose of informing biodiversity indicators for policy and management. Data limitations often can be overcome by constructing indicators with the flexibility to use data from multiple sources (e.g., OSPAR, 2017a,b,g,h) or by using a risk based approach to identify areas where targeted, more intensive monitoring should be concentrated (Elliott et al., 2018).
Additional solutions include setting clear monitoring objectives and clearly articulating the decision context that defines the temporal and spatial requirements for management decisions. This will ensure that the data required to inform biodiversity indicators are collected in a cost efficient manner (Turrell, 2018). In cases where extensive monitoring data are needed but not practical to collect, the use of alternative data sources, such as Earth observation, rather than data solely collected via in situ monitoring, can facilitate regional biodiversity assessments (Bean et al., 2017; Strong and Elliott, 2017; Pettorelli et al., 2018). For example, models combining physical, geological and biological parameters are currently being used to evaluate the extent and distribution of benthic habitat types at regional scale (OSPAR, 2017b). Furthermore, modeled species distributions can provide data to develop indicators such as the presence/absence of species and biotopes based on their environmental preferences for areas where survey data are missing or limited in extent (Elith et al., 2006; Butchart et al., 2010). They can also help in identifying impact hot spots and evaluating management actions (Guisan et al., 2013).
South African practice presents a possible solution to the challenges of monitoring marine biodiversity (Atkinson et al., 2016). Broad scale assessments of the state of South African marine ecosystems have been based on the Ocean Health Index method (Halpern et al., 2008, 2009) which uses cumulative human impacts in the absence of spatially extensive biodiversity monitoring data. This method can enable low income countries and other regions with limited biodiversity data to arrive at an indicative national scale assessment of biodiversity. The Ocean Health Index assumes that areas of high human pressure are in poor ecological condition. While useful, the method may not capture fine-scale natural variability, and can fail to identify areas of high resilience as well as the presence of unique or vulnerable ecosystems. Nevertheless, South African policy-makers have so far accepted this method of assessment, acknowledging the challenges and limitations to assessing the condition of the marine environment for the entire exclusive economic zone of South Africa using impact, or pressure, information in the absence of biodiversity data (Driver et al., 2011; Department of Environmental Affairs, 2015). To evaluate the outcomes of this practice, these methods should be verified with empirical evidence at varying scales using ecological monitoring data where available (Sink et al., 2012).
Involving the public in monitoring may be another cost-effective solution to the labor-intensive data collection required to inform biodiversity indicators (Thiel et al., 2014; Freiwald et al., 2018). Limitations on data collection are common, such as lack of standardization and spatio-temporal coverage, particularly in geographical areas which are greatly impacted but less accessible to the public. Despite these challenges, there are some notable regional and global citizen science programs that are increasing data coverage for some aspects of the marine environment for use in policy and management such as: Seasearch, which uses volunteer scuba divers to collect species data around the coast of Britain and Ireland1; Reef Check and Reef Life Survey, which are global programs that monitor the health of temperate and tropical reefs (Hodgson, 2000; Stuart-Smith et al., 2017); public monitoring of European seabirds (ICES, 2017); and a series of national citizen science programs for temperate rocky reefs in California (Gillett et al., 2012), subtidal habitats in the United Kingdom (Bull et al., 2013), and marine biodiversity health in northern Italy (Goffredo et al., 2010).
Linking Biodiversity Indicators to Ecosystem Change
Developing biodiversity indicators that are responsive to a defined anthropogenic pressure or linking biodiversity indicator change to a single manageable pressure is often desired by policy-makers but is scientifically challenging to achieve. Micheli et al. (2013) found that ∼60–99% of the territorial waters of EU member states were heavily impacted as a result of multiple pressures, rather than one individual stressor. These multiple pressures, which include climate change, can have cumulative and synergistic effects on biodiversity components, reflected by indicator state (Côté et al., 2016). For example, warming temperatures have been shown to interact with fishing pressure on temperate fish stocks (Kirby et al., 2009) and with multiple stressors including pathogens on coral reef ecosystems (Ban et al., 2014). Furthermore, biodiversity components are fundamentally linked through trophic interactions, affecting biodiversity indicators. Torres et al. (2017) showed that no pressure-state relationships for fish indicators in the Central Baltic Sea could be found unless predator-prey feedback or density dependence was accounted for. These complex and interacting drivers obscure the interpretation of change in biodiversity indicators. For example, the limited understanding of the effects of environmental drivers on the variation of Porifera and Anthozoa assemblages across the North of Scotland and Celtic Sea is hindering the ability to accurately measure ecological responses of benthic rocky reef indicators to direct anthropogenic pressures (Haynes et al., 2014).
Multiple biodiversity indicators may respond to the same anthropogenic pressure. Integrating information from a range of biodiversity indicators is a solution that can help to provide an overall assessment of the ecosystem (Elliott et al., 2018) and clarify the main drivers of change affecting a system (Smith et al., 2016). Although significant development is often required, ecosystem modeling can provide a comprehensive means to detect change in multiple biodiversity components and identify the important pathways by which impacts from pressures can cascade through an ecosystem (Lynam et al., 2016). Thus embedding indicators within a model framework can demonstrate key pressure-state linkages (Fulton et al., 2005; Shin et al., 2018), although it must be noted that data quality may impact model performance. Such models can then be used to examine the effects on biodiversity indicators of potential management measures or climate change through scenario testing (e.g., Mackinson et al., 2018; Queirós et al., 2018).
Another factor to consider when linking indicators to pressures is the non-linearity in marine ecological systems. For some marine ecosystems abrupt community shifts have been reported (e.g., Hare and Mantua, 2000; Frank et al., 2005) that can only be explained by non-linear state responses to abrupt changes in pressures (Scheffer and Carpenter, 2003). Non-stationarity, i.e., spatio-temporal change in the state-pressure relationship (Hunsicker et al., 2016), impedes the development of robust indicators that behave in a consistent and predictable way. A new tool, the R package ‘INDperform’ (Otto et al., 2018b) accounts for these dynamics and allows the user to explicitly test for non-linear and non-additive indicator-pressure relationships. The package builds on a quantitative framework for selecting and validating the performance of indicators tailored to specific management needs (Otto et al., 2018a) and offers additional functions to quantify the robustness of these models, identify temporal indicator changes, test for indicator redundancy, and visualize performances. While single indicator-pressure models, such as offered in INDperform, can easily be applied to any number of indicators and pressures they cannot account for synergistic or counteracting effects of multiple pressures or estimate trade-offs between individual indicators. For this, more complex modeling tools are required, which in turn can be difficult to communicate, may require many assumptions, and take longer to build (Hyder et al., 2015).
Using Biodiversity Indicators to Measure Progress Toward Policy Goals
Policy goals are often definitive, moving beyond broad-scale visions, and instead specifying a target condition that needs to be reached to meet the goal. An example of this is “…the abundance/extent, distribution and condition of marine species and habitats are in line with prevailing environmental conditions” from Descriptor 1 Biological Diversity of the EU’s Marine Strategy Framework Directive (2008/56/EC). Such an approach has long been used to assess indicators of environmental quality, including concentration of contaminants in water bodies (e.g., mercury, PCBs, nitrates) and of harmful gasses in the air (e.g., carbon monoxide, sulfur dioxide). For these indicators, laboratory tests establish safe limits which can then be used to define desirable target levels for environmental conditions (European Commission, 2008a). Setting quantitative targets that define a good or favorable condition for biodiversity indicators, however, is much more challenging, as our understanding of ecological processes influencing the recovery of species or habitats and the associated ecosystems functions is more limited. Consequently, many biodiversity indicators currently still lack associated defined targets (Teixeira et al., 2016).
The most common first step to defining targets for biodiversity indicators is to establish a baseline against which future change in condition can be measured (Figure 2). The most robust approach to baseline setting is to first establish a ‘reference condition’ (Borja et al., 2012; Greenstreet et al., 2012; OSPAR, 2012; Probst et al., 2013) or “natural range” (Rossberg et al., 2017) which will enable the full effects and changes caused by anthropogenic pressures to be evaluated (Van Loon et al., 2018). Reference conditions can be derived from information on species and habitats from areas where human pressure is considered negligible or non-existent but that information must be shown to be applicable to other areas (Borja and Tunberg, 2011). Reference conditions for marine biodiversity indicators, however, can be difficult to identify as areas of the marine environment that have been unimpacted by human pressures are increasingly scarce (Jones et al., 2018). Furthermore, time-series for most indicators are not long enough to include a time when human impacts were absent or negligible (Butchart et al., 2010; Dornelas et al., 2018). Unimpacted conditions are particularly difficult to identify for mobile species such as birds, marine mammals, fish and turtles because they move between impacted and unimpacted areas (OSPAR, 2012). Modeling, however, can be used to predict reference conditions, based on knowledge of human pressures and their impact on the state of the indicator (Borja et al., 2012; Rossberg et al., 2017). Once reference conditions are established, targets can then be set that are within a specified distance from them (OSPAR, 2012), where the acceptable target range for this distance is dependent on the rate of recovery of the state in question (Rossberg et al., 2017).
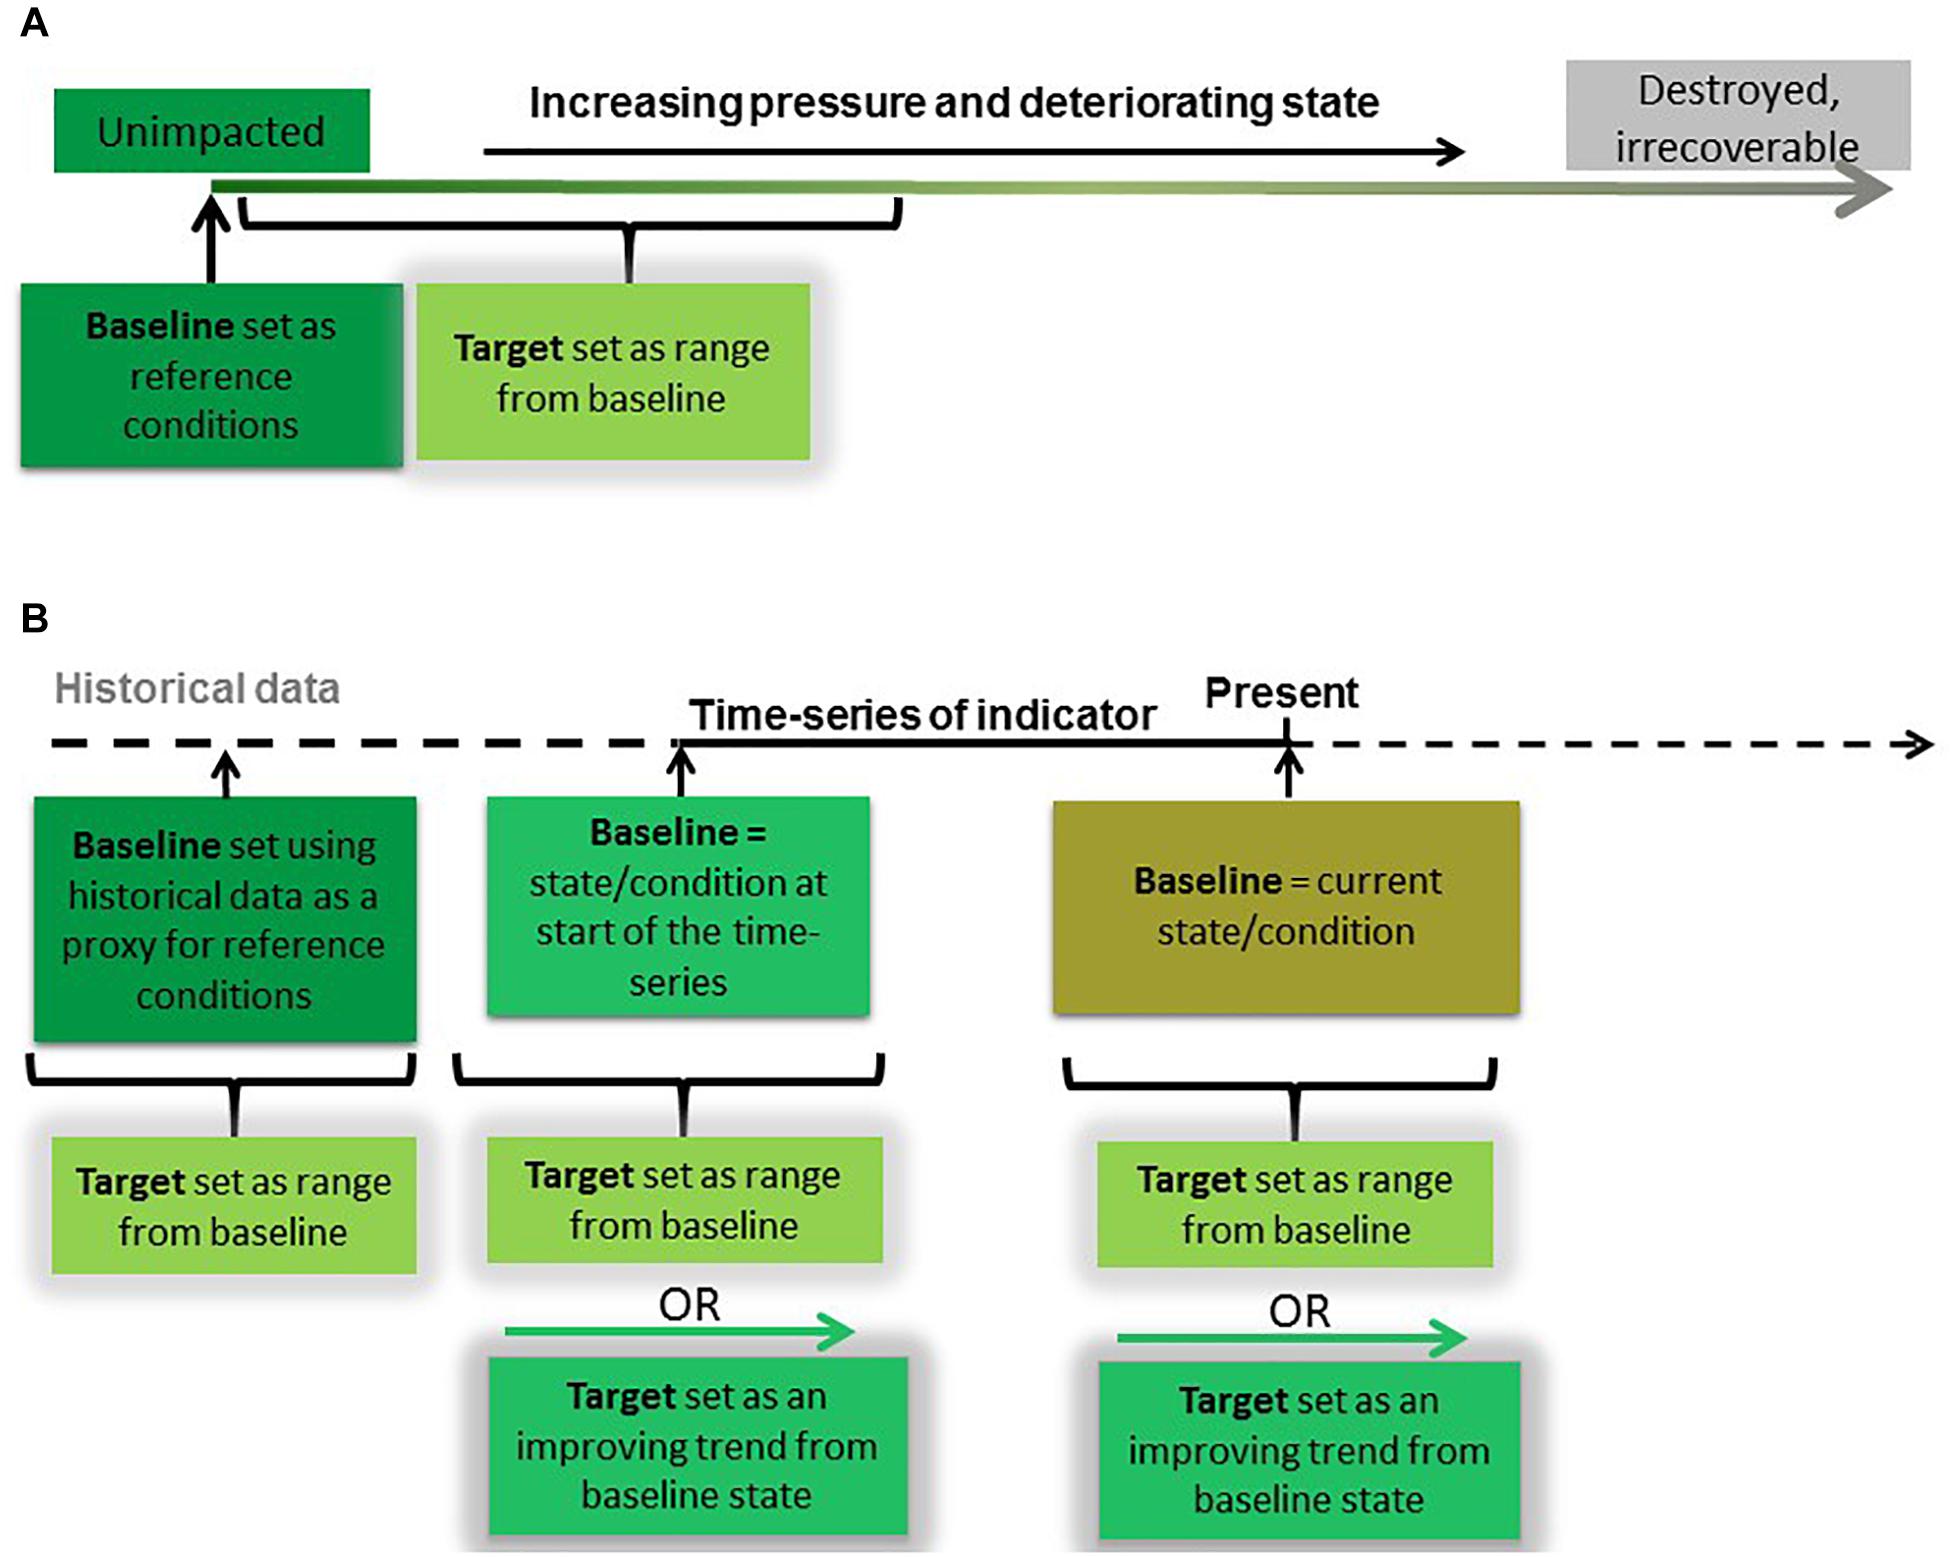
Figure 2. Establishing baselines and setting targets under two scenarios of biodiversity data availability. (A) The relative condition of the indicator is known, with data available representing unimpacted conditions (reference conditions). In this case, an indicator target can be set as a range of indicator values within a specified distance from the baseline reference conditions. (B) The relative condition of the indicator is not known, and no data representing reference conditions are available. In this case, time-series data are used to establish baseline conditions and set targets. Baselines can be set using (1) historical data, such as from an alternative data source or model, (2) the earliest time-series data available, or (3) data representing current conditions. Targets can then be set as a range or as an ‘improving’ trend from baseline state.
In the absence of empirical or modeled reference conditions, recent assessments of birds, seals, and fish in the NE Atlantic have used the start of time-series to define baselines for indicators (Figure 2) (OSPAR, 2017c,f,i,j). The risk with this approach is that the baseline is set at a value that represents a degraded condition which may or may not be within the acceptable target range of the ecosystem state. If targets are then set close to the baseline condition, this may jeopardize any improvement or recovery beyond that observed recently. This concept is referred to as Shifting Baseline Syndrome (Pauly, 1995; Pinnegar and Engelhard, 2008; Papworth et al., 2009) and can result in targets lacking in ambition (Plumeridge and Roberts, 2017) or worse, ‘locking in loss’ (Maron et al., 2015). Objective baselines and targets can be set once we improve our understanding of pressure-state relationships and the influence of the environment on them. Duarte et al. (2009) caution that it might not be possible for an indicator to return to a historic state because of fundamental alterations to the ecosystem caused by long-term or chronic effects of pressures or similarly changes in environmental conditions (Möllmann et al., 2009). In such cases, baselines that denote reference conditions would need to be set at a theoretical natural state, which could be achieved in the future if all current human impacts were removed (Rossberg et al., 2017). If the policy goal is sustainable use, the indicator targets should allow components of the ecosystem to achieve the theoretical natural state in a societally acceptable period of time (such as within a human generation) if all current human activities were to cease (Rossberg et al., 2017). To ensure the highest probability of such a recovery, impacts by human activities on structure, productivity, function and biological diversity of the ecosystem should be minimized (Garcia et al., 2003).
Where indicators are required to measure progress toward broad-level policy goals and visions, trend-based targets provide an appropriate solution. Trend-based assessment approaches are relatively simple to apply and communicate and are useful to inform on the progress of management in helping to recover degraded habitats or ecosystems or depleted species populations. For example, the Convention on Biological Diversity Aichi Target 12 is a broad-level vision stating that “By 2020 the extinction of known threatened species has been prevented and their conservation status, particularly of those most in decline, has been improved and sustained” and is used to assess progress toward Strategic Goal C “to improve the status of biodiversity by safeguarding ecosystems, species and genetic diversity” (United Nations, 2010). Measuring progress toward this goal, however, does not require indicators to reach a specified endpoint or target point, but instead assessment is based on indicator trend.
An additional barrier to setting targets for biodiversity indicators is that political resistance can be generated by a lack of agreement on the level of ambition by different parties, for example, across different countries sharing the same sea area. This can stem from a lack of understanding of what the indicator values signify and/or uncertainty around the implications or consequences of missing a target. Failure to meet targets may carry reputational risks or could lead to costly remedial measures such as changes in regulation or management, which may create resistance to targets from industry. Some of these political sensitivities can be alleviated through scientists working closely with policy leads to co-produce SMART targets that make the most of the available evidence (Cvitanovic and Hobday, 2018). For international targets, fora involving national representatives from science and policy can help to achieve international consensus and ensure targets are adopted by countries rather than imposed upon them (Heritier, 2002; OSPAR, 2017c,f,i,j).
Decision triggers are less contentious than firm targets and can provide a useful link from monitoring data to management decisions. Decision triggers are becoming an appealing tool for conservation managers to help support decision-making by providing clarity about when and how to act; improving transparency of organizational decisions; removing the need for guess work; guarding against the paralyzing effects of uncertainty; and preventing negative conservation outcomes (Addison et al., 2016). Decision triggers represent a point or zone in the status of a monitored variable indicating when management intervention is required to address undesirable ecosystem changes (Cook et al., 2016). Decision triggers can be set using a number of methods, depending on the availability of scientific data and expertise, the number of objectives for management and the resources available (Bie et al., 2018).
Strategies for Communicating Biodiversity Indicators to Policy
Effective communication of biodiversity indicators and assessments is integral to their uptake by policy-makers and managers. Critically, the target audience must be identified so indicator communication can be tailored appropriately. The group ‘policy-makers’ is often used as a generic term for decision-makers at multiple levels, including local councilors, environmental managers, civil servants, congress people, Members of Parliament (MPs), and ministers, among others. These subgroups use biodiversity indicators in different ways to make decisions and therefore require information in different formats with varying levels of associated detail and specificity.
Regardless of the audience, biodiversity indicator communication must be clear, transparent and easy to understand to support their legitimate use in decision-making. There are different ways to present indicator results and assessments, each of which involves trade-offs between the complexity of biodiversity information and the simplicity of the product required for clear communication (Figure 3). The simplest methods of indicator communication use traffic lights summaries (United Kingdom Marine Monitoring and Assessment Strategy, 2010; Driver et al., 2011; Karnauskas et al., 2017) or trend lines (WWF, 2016), which are simple visual illustrations of indicator change and are easily understood by non-scientists. These approaches often include composite indicators that are constructed by integrating numerous indicators to provide a single value (e.g., the Ocean Health Index, 2017) or trend (e.g., the Living Planet Index; WWF and ZSL, 2016). These products can deliver a simple but powerful, attention-grabbing message to a wide and diverse policy- and decision-making audience. However, the simplicity of these approaches, and lack of associated written narrative, also brings a risk that the audience may misinterpret the message conveyed by the indicator results. It is therefore the responsibility of scientists and managers to communicate results unambiguously, in a way that effectively takes account of any uncertainty in the results (Fischhoff and Davis, 2014).
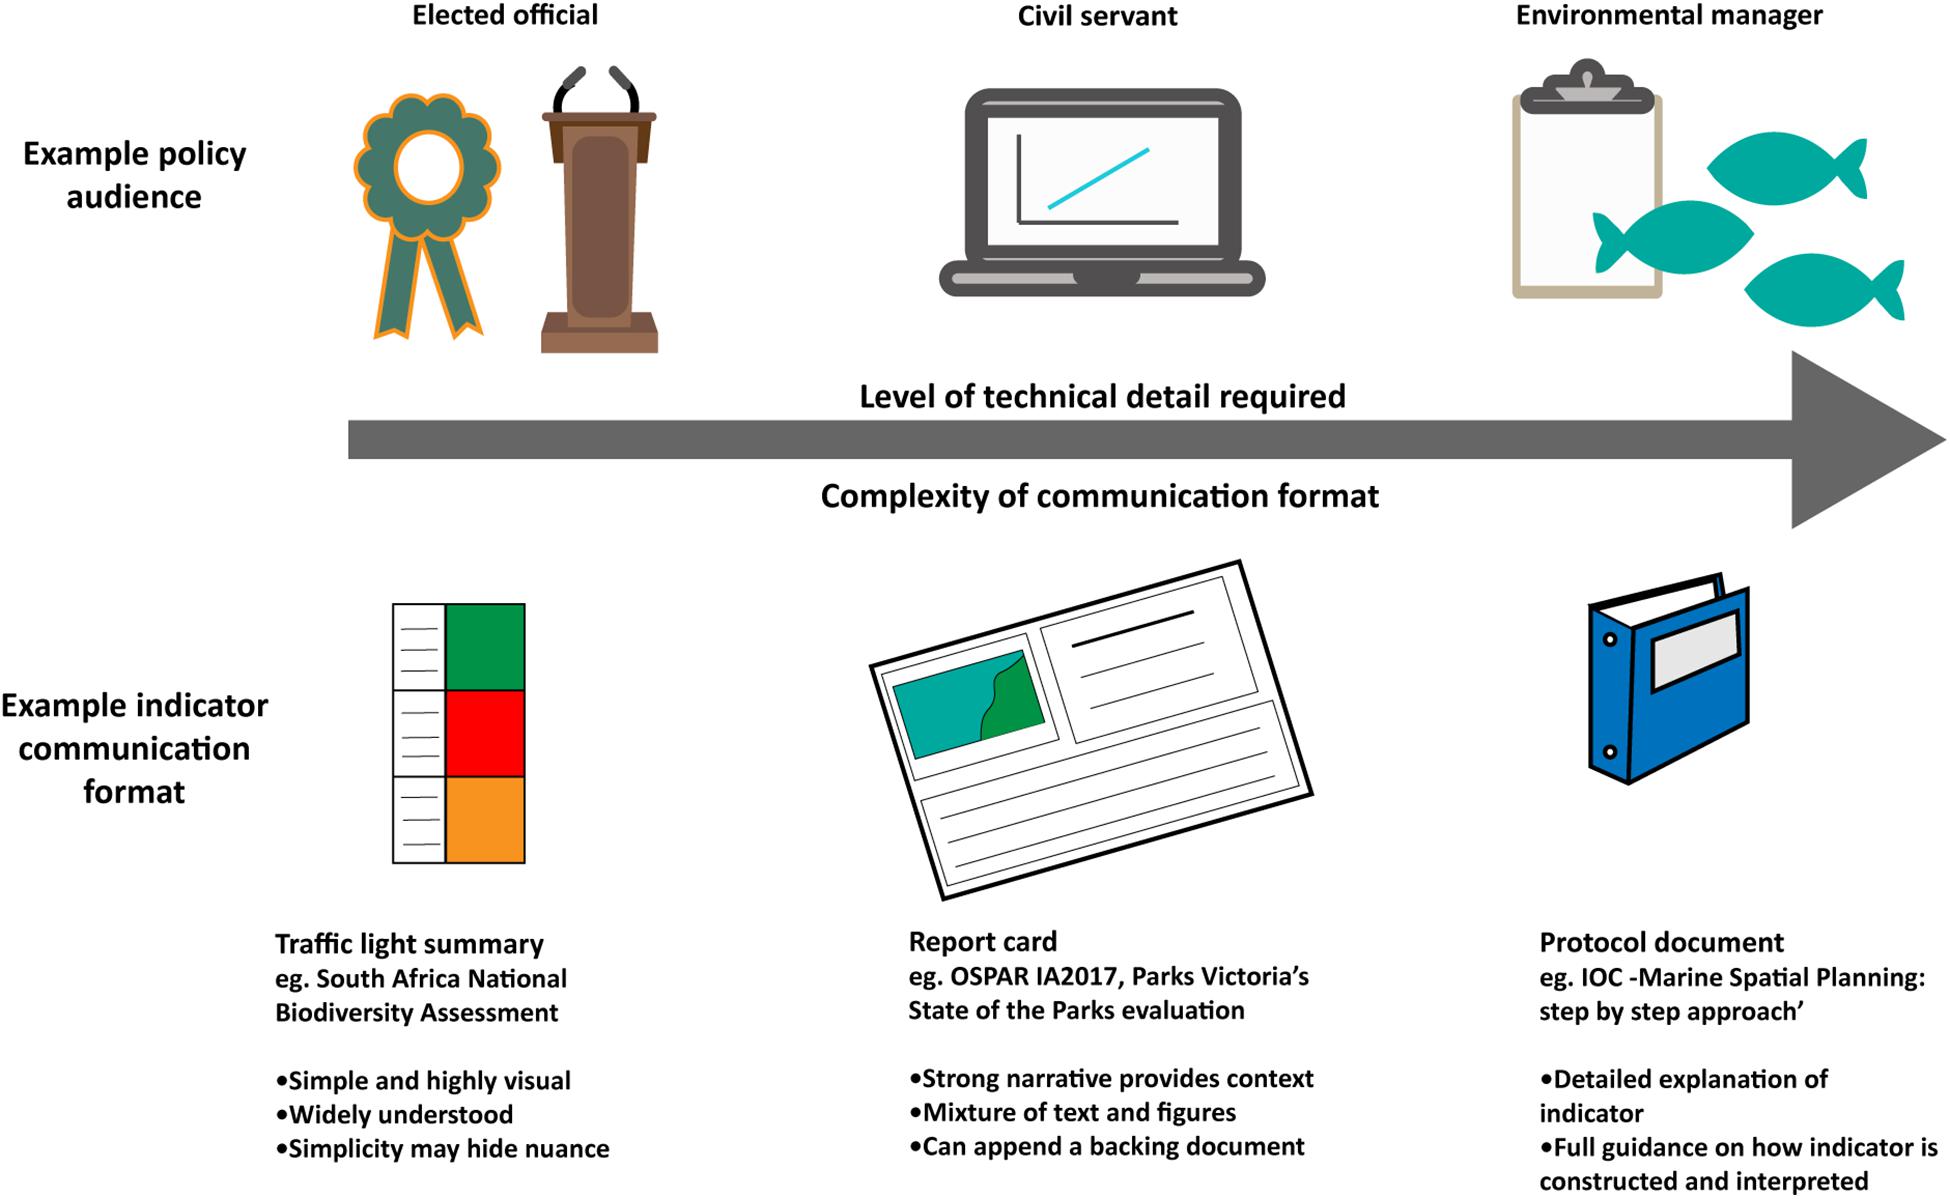
Figure 3. Indicator communication formats should vary in level of technical detail depending on the policy audience.
Conversely, more complex communication methods such as summary report cards (e.g., Carey et al., 2017; European Environment Agency, 2017; Marine Climate Change Impacts Partnership, 2017) and narrative reports (e.g., Conservation of Arctic Flora and Fauna, 2017; Evans et al., 2017; OSPAR, 2017d) can provide a strong written narrative and contextual information, reducing the likelihood of misinterpretation by policy-makers. Protocol documents (e.g., Ehler and Douvere, 2009) are even more detailed, acting as a ‘user guide’ for indicators.
For all policy audiences, confidence in indicator assessments must also be clearly communicated. Addison et al. (2017) suggest that confidence in indicator assessments can be communicated through a variety of ways. For example, relatively simple categorical estimates of confidence in scientific robustness and/or supporting data informing indicator assessments can be applied. Some examples from Australia and Europe include reporting simple ‘high, medium, and low’ confidence designations (e.g., Carey et al., 2017; OSPAR, 2017e), measuring comparability with previous assessments [e.g., designating current indicator assessments as ‘comparable,’ ‘somewhat comparable,’ or ‘not comparable’ with previous assessments (e.g., Evans et al., 2017)], and making the evidence (data, metadata, reports, and papers) used in assessment transparent and accessible (e.g., Ocean Health Index, 2017; OSPAR, 2017d).
Progress toward achieving any associated targets may also be appropriate to communicate to policy-makers, including some measure of distance from the associated target as well as an indication of management interventions needed to achieve the target in the future (Andersen et al., 2014; HELCOM, 2018). Emphasizing socioeconomic needs linked to biodiversity indicators and assessment, such as ecosystem service provision, can help articulate policy relevance and increase usefulness of biodiversity indicators and assessments. Delivering the right indicator information in the right communication format for the right audience is therefore key to successful use of biodiversity indicators and assessments. For example, environmental managers who must make rapid management decisions require a higher level of detail about indicator implementation and interpretation than a national minister, who may only need to understand high-level information (Figure 3).
The co-development of indicators by scientists working closely with policy-makers can facilitate feedback on product communication format to ensure that the final indicators or assessment products are useful for policy-makers. Furthermore, indicator co-production allows the articulation of scientific confidence limits and risks, enabling agreement on a way to consider and express these limitations in assessments (Addison et al., 2017; Bolman et al., 2018). This is a critical, and often iterative, step in biodiversity indicator and assessment utility. Recent examples of this collaborative approach to indicator development are the OSPAR Intermediate Assessment of the Northeast Atlantic (OSPAR, 2017d) and the HELCOM Holistic Assessment of the Baltic Sea (HELCOM, 2018) where scientists worked closely with policy-makers to develop a suite of marine biodiversity indicators. The science-policy working groups co-developed communication products tailored to the requirements of two levels of decision-makers. Firstly, a detailed assessment report containing information about indicator development, assessment methods, and the interpretation of indicator results was developed for government civil servants to use for reporting. Secondly, a two-page report card for elected officials, containing simple figures, provided a high-level overview of assessment results. Close working across the science-policy interface therefore resulted in biodiversity assessment products which meet the needs of both policy audiences.
Lastly, evidence-based decision making is essential for effective biodiversity management in the marine environment and in that sense promotes the use of user friendly mathematical or statistical models, such as decision-support tools that can translate science into policy (Pınarbaşı et al., 2017). Multifunctional decision support tools have been developed for a wide range of components in marine management, some of which may be useful to communicate results to decision-makers or to identify trade-offs and perform scenario analyses. These types of DSTs are particularly useful for detecting changes in marine ecosystems by performing scenario analyses on key drivers or biodiversity indicators within marine systems.
Although the scientific process in developing a set of indicators may be complex, the outputs should be simplified such that the outputs are connected to the human or social context in which they will be used. Technical DSTs or complex indicators may result in a disconnection between the objective of the indicator and its utilization in the decision-making process (Bolman et al., 2018). Therefore, simplifying complexity should rather focus on the communication of the scientific outputs rather than on the actual development of the indictors or tools. Communicating biodiversity indicators should include emphasizing key trends or sensitive parameters to communicate the dynamics within complex marine systems, in the format most useful to different decision-makers (e.g., decision support tools, report cards, or web-based interfaces).
Conclusion
As we enter the UN Decade of Ocean Science for Sustainable Development (UNESCO, 2018) a concerted effort will be required to develop strategies to meet the UN global goal to “Conserve and sustainably use the oceans, seas and marine resources for sustainable development” [Sustainable Development Goal 14 (United Nations General Assembly, 2015)]. Marine biodiversity indicators are likely to be critical to meeting the targets associated with this ambitious goal.
In the context of marine management, we highlight a holistic approach to understanding the term ‘biodiversity indicator’ to include ecosystem structure and functioning. Several challenges around biodiversity indicator development limit the widespread implementation in biodiversity management. Firstly, the policy application of marine biodiversity indicators varies across geographical regions and is currently most common in, but not limited to, high income countries with established monitoring programs. Where marine biodiversity indicators are in use for policy assessments, these indicators often use region-specific terminologies and data requirements, and were created for specific policy drivers. Additionally, marine ecosystems are complex, non-linear systems and links between internal interactions and exogenous pressures frequently distort human intuition of the marine system and hence management approaches. Marine management, and the development of biodiversity indicators to support management, thus require methods of analysis and decision-support tools that recognize multiple forms of complexity.
Formation of a community of practice was a key aim of this IMCC symposium and focus group, and these sessions revealed that the concept of biodiversity indicators is most useful when kept broad and flexible in both definition and application. A community of practice will facilitate knowledge exchange between indicator users to find alternative solutions for the common challenges outlined in this paper. Solutions to many of the challenges facing the policy application of marine biodiversity indicators were discussed and further developed and are now described in this paper. Some solutions require advanced numerical expertise while others address barriers by adopting innovative solutions involving citizen science data collection, combining multiple datasets to populate indicators, communicating assessment results in audience-specific formats, and enhancing collaborations within the international scientific community. The key to overcoming many barriers to biodiversity indicator uptake is to include policy-makers from the start of indicator development to ensure that implementation needs are met. It is our hope that the solutions outlined here will support the use of biodiversity indicators for marine policy, management, and conservation, helping us to meet the UN aspiration of the sustainable use of our oceans, seas, and marine resources.
Data Availability
All datasets generated for this study are included in the manuscript and/or the supplementary files.
Author Contributions
AM-G, IM, CV-H, JB, SO, PA, and CL conceived and led the research and designed and led authorship of the manuscript. PG, EV, KS, DB, EM-W, and HN contributed to research and manuscript authorship.
Conflict of Interest Statement
The authors declare that the research was conducted in the absence of any commercial or financial relationships that could be construed as a potential conflict of interest.
Acknowledgments
AM-G and PA would like to thank the United Kingdom National Environmental Research Council for support through the NERC Knowledge Exchange Fellowship Scheme (NE/R002738/1 and NE/N005457/1). SO was also financially supported by the BONUS BLUEWEBS project which has received funding from BONUS (Art 185), funded jointly by the EU, the Academy of Finland, Projektträger Jülich (PtJ), Germany, the State Education Development Agency of Latvia, the National Centre for Research and Development, Poland, and the Swedish Research Council Formas. EV would like to acknowledge the Department of Science and Technology and the National Research Foundation of South Africa for support through the South African Marine Spatial Planning grant (SARChl MSP 98574). EM-W is funded by Marine EcoSol and Knowledge Economy Skills Scholarships (KESS 2), funded by the Welsh Government’s European Social Fund (ESF) convergence programme for West Wales and the Valleys. DB was kindly supported by NERC (NE/L002485/1) and the Bertarelli Foundation.
Footnotes
References
Addison, P. F. E., Collins, D. J., Trebilco, R., Howe, S., Bax, N., Hedge, P., et al. (2017). A new wave of marine evidence-based management: emerging challenges and solutions to transform monitoring, evaluating, and reporting. ICES J. Mar. Sci. 75, 941–952. doi: 10.1093/icesjms/fsx216
Addison, P. F. E., Cook, C. N., and Bie, K. (2016). Conservation practitioners’ perspectives on decision triggers for evidence-based management. J. Appl. Ecol. 53, 1351–1357. doi: 10.1111/1365-2664.12734
Andersen, J. H., Dahl, K., Göke, C., Hartvig, M., Murray, C., Rindorf, A., et al. (2014). Integrated assessment of marine biodiversity status using a prototype indicator-based assessment tool. Front. Mar. Sci. 1:55. doi: 10.3389/fmars.2014.00055
Atkinson, L., Sink, K., Raven, H., Franken, M.-L., and Terrapon, H. (2016). SeaKeys Monitoring Working Group Workshop Report. Available at: https://www.sanbi.org/wp-content/uploads/2018/04/seakeys-monitoring-workshop-reportaug2016.pdf
Bal, P., Tulloch, A., Addison, P., Mcdonald-Madden, E., and Rhodes, J. R. (2018). Selecting indicator species for biodiversity management. Front. Ecol. Environ. 16:589–598. doi: 10.1002/fee.1972
Balmford, A., Bennun, L., Ten Brink, B., Cooper, D., Côté, I. M., Crane, P., et al. (2005). The convention on biological diversity’s 2010 target. Science 307, 212–213. doi: 10.1126/science.1106281
Ban, S. S., Graham, N. A., and Connolly, S. R. (2014). Evidence for multiple stressor interactions and effects on coral reefs. Glob. Chang. Biol. 20, 681–697. doi: 10.1111/gcb.12453
Barrio Froján, C. (2016). 1714S Solan Bank Reef SCI Environmental Data Analysis: JNCC/Cefas Partnership Report Series, No. 12. Peterborough: JNCC/Cefas.
Bean, T. P., Greenwood, N., Beckett, R., Biermann, L., Bignell, J. P., Brant, J. L., et al. (2017). A review of the tools used for marine monitoring in the UK: combining historic and contemporary methods with modeling and socioeconomics to fulfill legislative needs and scientific ambitions. Front. Mar. Sci. 4:263. doi: 10.3389/fmars.2017.00263
Beaugrand, G. (2005). Monitoring pelagic ecosystems using plankton indicators. ICES J. Mar. Sci. 62, 333–338. doi: 10.1016/j.icesjms.2005.01.002
Beck, M. W., Brumbaugh, R. D., Airoldi, L., Carranza, A., Coen, L. D., Crawford, C., et al. (2011). Oyster reefs at risk and recommendations for conservation, restoration, and management. Bioscience 61, 107–116. doi: 10.1525/bio.2011.61.2.5
Bedford, J., Johns, D., Greenstreet, S., and Mcquatters-Gollop, A. (2018). Plankton as prevailing conditions: a surveillance role for plankton indicators within the marine strategy framework directive. Mar. Policy 89, 109–115. doi: 10.1016/j.marpol.2017.12.021
Bellard, C., Leclerc, C., Leroy, B., Bakkenes, M., Veloz, S., Thuiller, W., et al. (2014). Vulnerability of biodiversity hotspots to global change. Glob. Ecol. Biogeogr. 23, 1376–1386. doi: 10.1111/geb.12228
Bie, K., Addison, P. F. E., and Cook, C. N. (2018). Integrating decision triggers into conservation management practice. J. Appl. Ecol. 55, 494–502. doi: 10.1016/j.jenvman.2018.09.067
Blanchard, J. L., Coll, M., Trenkel, V. M., Vergnon, R., Yemane, D., Jouffre, D., et al. (2010). Trend analysis of indicators: a comparison of recent changes in the status of marine ecosystems around the world. ICES J. Mar. Sci. 67, 732–744. doi: 10.1093/icesjms/fsp282
Bolman, B., Jak, R. G., and Van Hoof, L. (2018). Unravelling the myth – the use of decisions support systems in marine management. Mar. Policy 87, 241–249. doi: 10.1016/j.marpol.2017.10.027
Borja, A., and Tunberg, B. G. (2011). Assessing benthic health in stressed subtropical estuaries, eastern Florida, USA using AMBI and M-AMBI. Ecol. Indic. 11, 295–303. doi: 10.1016/j.ecolind.2010.05.007
Borja,Á, Dauer, D. M., and Grémare, A. (2012). The importance of setting targets and reference conditions in assessing marine ecosystem quality. Ecol. Indic. 12, 1–7. doi: 10.1016/j.ecolind.2011.06.018
Bremner, J. (2008). Species’ traits and ecological functioning in marine conservation and management. J. Exp. Mar. Biol. Ecol. 366, 37–47. doi: 10.1016/j.marenvres.2013.05.011
Bull, J. C., Mason, S., Wood, C., and Price, A. R. G. (2013). Benthic marine biodiversity patterns across the United Kingdom and Ireland determined from recreational diver observations: a baseline for possible species range shifts induced by climate change. Aquat. Ecosyst. Health Manag. 16, 20–30. doi: 10.1080/14634988.2013.761086
Butchart, S. H. M., Walpole, M., Collen, B., Van Strien, A., Scharlemann, J. P. W., Almond, R. E. A., et al. (2010). Global biodiversity: indicators of recent declines. Science 328, 1164–1168. doi: 10.1126/science.1187512
Carey, J., Howe, S., Pocklington, J., Rodrigue, M., Campbell, A., Addison, P., et al. (2017). Report on Condition of Yaringa Marine National Park - 2002-2013, in: Parks Victoria. Technical Report No. 112. Melbourne: Parks Victoria.
Cartagena Convention (1983). Convention for the Protection and Development of the Marine Environment in the Wider Caribbean Region. Available at: http://www.cep.unep.org/cartagena-convention
Cash, D. W., Clark, W. C., Alcock, F., Dickson, N. M., Eckley, N., Guston, D. H., et al. (2003). Knowledge systems for sustainable development. Proc. Natl. Acad. Sci. U.S.A. 100, 8086–8091. doi: 10.1073/pnas.1231332100
Cline, T. J., Seekell, D. A., Carpenter, S. R., Pace, M. L., Hodgson, J. R., Kitchell, J. F., et al. (2014). Early warnings of regime shifts: evaluation of spatial indicators from a whole-ecosystem experiment. Ecosphere 5:art102. doi: 10.1890/ES13-00398.1
Coll, M., Shannon, L. J., Kleisner, K. M., Juan-Jordá, M. J., Bundy, A., Akoglu, A. G., et al. (2016). Ecological indicators to capture the effects of fishing on biodiversity and conservation status of marine ecosystems. Ecol. Indic. 60, 947–962. doi: 10.1016/j.ecolind.2015.08.048
Conservation of Arctic Flora and Fauna (2017). State of the Arctic Marine Biodiversity Report. Akureyri: Conservation of Arctic Flora and Fauna International Secretariat.
Cook, C. N., De Bie, K., Keith, D. A., and Addison, P. F. E. (2016). Decision triggers are a critical part of evidence-based conservation. Biol. Conserv. 195, 46–51. doi: 10.1016/j.biocon.2015.12.024
Cook, R., Fariñas-Franco, J. M., Gell, F. R., Holt, R. H. F., Holt, T., Lindenbaum, C., et al. (2013). The substantial first impact of bottom fishing on rare biodiversity hotspots: a dilemma for evidence-based conservation. PLoS One 8:e69904. doi: 10.1371/journal.pone.0069904
Côté, I. M., Darling, E. S., and Brown, C. J. (2016). Interactions among ecosystem stressors and their importance in conservation. Proc. R. Soc. B 283:20152592. doi: 10.1098/rspb.2015.2592
Cvitanovic, C., and Hobday, A. J. (2018). Building optimism at the environmental science-policy-practice interface through the study of bright spots. Nat. Commun. 9:3466. doi: 10.1038/s41467-018-05977-w
Dakos, V., Kefi, S., Rietkerk, M., Van Nes, E. H., and Scheffer, M. (2011). Slowing down in spatially patterned ecosystems at the brink of collapse. Am. Nat. 117, E153–E166. doi: 10.1086/659945
Danielsen, F., Balete, D. S., Poulsen, M. K., Enghoff, M., Nozawa, C. M., and Jensen, A. E. (2000). A simple system for monitoring biodiversity in protected areas of a developing country. Biodivers. Conserv. 9, 1671–1705. doi: 10.1023/A:1026505324342
De Juan, S., Hewitt, J., Subida, M. D., and Thrush, S. (2018). Translating ecological integrity terms into operational language to inform societies. J. Environ. Manag. 228, 319–327. doi: 10.1016/j.jenvman.2018.09.034
Defra (2012). Marine Strategy Part One: UK Initial Assessment and Good Environmental Status. London: Department for Environment, Food and Rural Affairs.
Defra (2018). A Green Future: Our 25 Year Plan to Improve the Environment. London: Department of Environment, Farming, and Rural Affairs.
Department of Environmental Affairs (2015). South Africa’s 2nd National Biodiversity Strategy and Action Plan. Pretoria: Government of South Africa.
Department of Environmental Affairs and Tourism (2004). The National Environmental Management: Biodiversity Act, No. 10 of 2004. Pretoria: Government of South Africa.
Diaz, S., and Cabido, M. (2001). Vive la différence: plant functional diversity matters to ecosystem processes. Trends Ecol. Evol. 16, 646–655. doi: 10.1016/S0169-5347(01)02283-2
Dornelas, M., Antão, L. H., Moyes, F., Bates, A. E., Magurran, A. E., Adam, D., et al. (2018). BioTIME: a database of biodiversity time series for the Anthropocene. Glob. Ecol. Biogeogr. 27, 760–786. doi: 10.1111/geb.12729
Driver, A., Sink, K. J., Nel, J. N., Holness, S., Van Niekerk, L., Daniels, F., et al. (2011). NBA (National Biodiversity Assessment) 2011: An Assessment of South Africa’s Biodiversity and Ecosystems. Synthesis Report. Pretoria: South African National Biodiversity Institute.
Duarte, C. M., Conley, D. J., Carstensen, J., and Sánchez-Camacho, M. (2009). Return to neverland: shifting baselines affect eutrophication restoration targets. Estuar. Coasts 32, 29–36. doi: 10.1007/s12237-008-9111-2
Ehler, C., and Douvere, F. (2009). Marien Spatial Planning: A Step-by-Step Approach Toward Ecosystem-Based Management. Paris: UNESCO.
Elith, J. H., Graham, C. P., Anderson, R., Dudík, M., Ferrier, S., Guisan, A., et al. (2006). Novel methods improve prediction of species’ distributions from occurrence data. Ecography 29, 129–151. doi: 10.1111/j.2006.0906-7590.04596.x
Elliott, S. A. M., Guérin, L., Pesch, R., Schmitt, P., Meakins, B., Vina-Herbon, C., et al. (2018). Integrating benthic habitat indicators: working towards an ecosystem approach. Mar. Policy 90, 88–94. doi: 10.1016/j.marpol.2018.01.003
European Commission (2008a). “Environmental Quality Standards Directive”, in: 2008/105/EC. Available at: https://rod.eionet.europa.eu/instruments/634.
European Commission (2008b). “Marine Strategy Framework Directive”, in: 2008/56/EC. Available at: https://www.eea.europa.eu/policy-documents/200-56-ec
European Commission (2011). Our Life Insurance, Our Natural Capital: An EU Biodiversity Strategy to 2020, in: COM/2011/0244. Available at: https://eur-lex.europa.eu/legal-content/EN/TXT/?uri=celex%3A52011DC0244.
European Environment Agency (2017). State of Europe’s Seas. Copenhagen: European Environment Agency.
Evans, K., Bax, N., and Smith, D. C. (2017). Australia State of the Environment 2016: Marine Environment, Independent Report to the Australian Government Minister for the Environment and Energy. Canberra: Australian Government Department of the Environment and Energy.
FAO (1997). Land Quality Indicators and Their Use in Sustainable Agriculture and Rural Development. Rome: Food and Agricultura Organization of the United Nations.
Fariñas-Franco, J. M., Pearce, B., Mair, J. M., Harries, D. B., Macpherson, R. C., Porter, J. S., et al. (2018). Missing native oyster (Ostrea edulis L.) beds in a european marine protected area: should there be widespread restorative management? Biol. Conserv. 221, 293–311. doi: 10.1016/j.biocon.2018.03.010
Fariñas-Franco, J. M., Pearce, B., Porter, J., Harries, D., Mair, J. M., Woolmer, A. S., et al. (2014). Marine Strategy Framework Directive Indicators for Biogenic Reefs Formed by Modiolus modiolus, Mytilus edulis and Sabellaria spinulosa Part 1: Defining and Validating the Indicators. Peterborough: JNCC.
Fischhoff, B., and Davis, A. L. (2014). Communicating scientific uncertainty. Proc. Natl. Acad. Sci. U.S.A. 111, 13664–13671. doi: 10.1073/pnas.1317504111
Frank, K. T., Petrie, B., Choi, J. S., and Leggett, W. C. (2005). Trophic cascades in a formerly cod-dominated ecosystem. Science 308, 1621–1623. doi: 10.1126/science.1113075
Freiwald, J., Meyer, R., Caselle, J. E., Blanchette, C. A., Hovel, K., Neilson, D., et al. (2018). Citizen science monitoring of marine protected areas: case studies and recommendations for integration into monitoring programs. Mar. Ecol. 39:e12470. doi: 10.1111/maec.12470
Fu, C., Large, S., Knight, B., Richardson, A. J., Bundy, A., Reygondeau, G., et al. (2015). Relationships among fisheries exploitation, environmental conditions, and ecological indicators across a series of marine ecosystems. J. Mar. Syst. 148, 101–111. doi: 10.1016/j.jmarsys.2015.01.004
Fulton, E. A., Smith, A. D. M., and Punt, A. E. (2005). Which ecological indicators can robustly detect effects of fishing? ICES J. Mar. Sci. 62, 540–551. doi: 10.1016/j.icesjms.2004.12.012
Garcia, S. M., Zerbi, A., Aliaume, C., Do Chi, T., and Lasserre, G. (2003). The Ecosystem Approach to Fisheries. Issues, Terminology, Principles, Institutional Foundations, Implementation and Outlook. Rome: FAO.
Gillett, D. J., Pondella, D. J., Freiwald, J., Schiff, K. C., Caselle, J. E., Shuman, C., et al. (2012). Comparing volunteer and professionally collected monitoring data from the rocky subtidal reefs of Southern California, USA. Environ. Monitor. Assess. 184, 3239–3257. doi: 10.1007/s10661-011-2185-5
Goffredo, S., Pensa, F., Neri, P., Orlandi, A., Gagliardi, M. S., Velardi, A., et al. (2010). Unite research with what citizens do for fun: “recreational monitoring” of marine biodiversity. Ecol. Appl. 20, 2170–2187. doi: 10.1890/09-1546.1
Greenstreet, S. P. R., Rossberg, A. G., Fox, C. J., Le Quesne, W. J. F., Blasdale, T., Boulcott, P., et al. (2012). Demersal fish biodiversity: species-level indicators and trends-based targets for the marine strategy framework directive. ICES J. Mar. Sci. 69, 1789–1801. doi: 10.1093/icesjms/fss148
Griffiths, C. L., Robinson, T. B., Lange, L., and Mead, A. (2010). Marine biodiversity in south africa: an evaluation of current states of knowledge. PLoS One 5:e12008. doi: 10.1371/journal.pone.0012008
Guisan, A., Tingley, R., Baumgartner, J. B., Naujokaitis-Lewis, I., Sutcliffe, P. R., Tulloch, A. I. T., et al. (2013). Predicting species distributions for conservation decisions. Ecol. Lett. 16, 1424–1435. doi: 10.1111/ele.12189
Halpern, B. S., Frazier, M., Potapenko, J., Casey, K. S., Koenig, K., Longo, C., et al. (2015). Spatial and temporal changes in cumulative human impacts on the world’s ocean. Nat. Commun. 6:7615. doi: 10.1038/ncomms8615
Halpern, B. S., Kappel, C. V., Selkoe, K. A., Micheli, F., Ebert, C. M., Kontgis, C., et al. (2009). Mapping cumulative human impacts to California current marine ecosystems. Conserv. Lett. 2, 138–148. doi: 10.1371/journal.pone.0079889
Halpern, B. S., Longo, C., Hardy, D., Mcleod, K. L., Samhouri, J. F., Katona, S. K., et al. (2012). An index to assess the health and benefits of the global ocean. Nature 488:615. doi: 10.1038/nature11397
Halpern, B. S., Walbridge, S., Selkoe, K. A., Kappel, C. V., Micheli, F., D’agrosa, C., et al. (2008). A global map of human impact on marine ecosystems. Science 319, 948–952. doi: 10.1126/science.1149345
Hare, S. R., and Mantua, N. J. (2000). Empirical evidence for North Pacific regime shifts in 1977 and 1989. Prog. Oceanogr. 47, 103–145. doi: 10.1016/S0079-6611(00)00033-1
Hayes, K. R., Dambacher, J. M., Hosack, G. R., Bax, N. J., Dunstan, P. K., Fulton, E. A., et al. (2015). Identifying indicators and essential variables for marine ecosystems. Ecol. Indic. 57, 409–419. doi: 10.1016/j.ecolind.2015.05.006
Haynes, T., Bell, J., Saunders, G., Irving, R., Williams, J., and Bell, G. (2014). Marine Strategy Framework Directive Shallow Sublittoral Rock Indicators for Fragile Sponges and Anthozoan Assemblages. Part 1: Developing Proposals for Potential Indicators. JNCC Report No. 524. Peterborough: JNCC.
Heink, U., and Kowarik, I. (2010). What criteria should be used to select biodiversity indicators? Biodiv. Conserv. 19, 3769–3797. doi: 10.1007/s10531-010-9926-6
HELCOM (2018). State of the Baltic Sea – Second HELCOM Holistic Assessment 2011-2016”, in: Baltic Sea Environment Proceedings 155. Available at: www.helcom.fi/baltic-sea-trends/holistic-assessments/stateof-the-baltic-sea-2018/reports-and-materials/
Henriques, S., Pais, M. P., Vasconcelos, R. P., Murta, A., Azevedo, M., Costa, M. J., et al. (2014). Structural and functional trends indicate fishing pressure on marine fish assemblages. J. Appl. Ecol. 51, 623–631. doi: 10.1111/1365-2664.12235
Heritier, A. (2002). “New modes of governance in europe: policy-making without legislating?,” in Common Goods: Reinventing European and International Governance, ed. A. Hertier (Oxford: Rowman & Littlefield Publishers), 196. doi: 10.2139/ssrn.299431
Hodgson, G. (2000). Coral reef monitoring and management using reef check. Integr. Coast. Zone Manag. 1, 169–179.
Hunsicker, M. E., Kappel, C. V., Selkoe, K. A., Halpern, B. S., Scarborough, C., Mease, L., et al. (2016). Characterizing driver–response relationships in marine pelagic ecosystems for improved ocean management. Ecol. Appl. 26, 651–663. doi: 10.1890/14-2200
Hyder, K., Rossberg, A. G., Allen, J. I., Austen, M. C., Barciela, R. M., Bannister, H. J., et al. (2015). Making modelling count - increasing the contribution of shelf-seas community and ecosystem models to policy development and management. Mar. Policy 61, 291–302. doi: 10.1016/j.marpol.2015.07.015
ICES (2017). Report of the OSPAR/HELCOM/ICES Working Group on Marine Birds (JWGBIRD), Riga, Latvia. 6-10 November 2017. Copenhagen: ICES.
ICES (2018). ICES Reference Points for Stocks in Categrories 3 and 4, in: ICES Technical Guidelines. Copenhagen: ICES.
Jones, K. R., Klein, C. J., Halpern, B. S., Venter, O., Grantham, H., Kuempel, C. D., et al. (2018). The location and protection status of Earth’ diminishing marine wilderness. Curr. Biol. 28, 2506–2512.e3 doi: 10.1016/j.cub.2018.06.010
Juan, S. D., Thrush, S. F., and Demestre, M. (2007). Functional changes as indicators of trawling disturbance on a benthic community located in a fishing ground (NW Mediterranean Sea). Mar. Ecol. Prog. Ser. 334, 117–129. doi: 10.3354/meps334117
Karnauskas, M., Kelble, C. R., Regan, S., Quenée, C., Allee, R., Jepson, M., et al. (2017). Ecosystem Status Report Update for the Gulf of Mexico. Miami, FL: National Oceanic and Atmospheric Administration and the National Marine Fisheries Service.
Kershner, J., Samhouri, J. F., James, C. A., and Levin, P. S. (2011). Selecting indicator portfolios for marine species and food webs: a puget sound case study. PLoS One 6:e25248. doi: 10.1371/journal.pone.0025248
Kirby, R. R., Beaugrand, G., and Lindley, J. A. (2009). Synergistic effects of climate and fishing in a marine ecosystem. Ecosystems 12, 548–561. doi: 10.1007/s10021-009-9241-9
Koslow, J. A., and Couture, J. (2013). Ocean sciences: follow the fish. Nature 502, 163–164. doi: 10.1038/502163a
Lemos, M. C., and Morehouse, B. J. (2005). The co-production of science and policy in integrated climate assessments. Glob. Environ. Chang. 15, 57–68. doi: 10.1098/rsta.2018.0106
Leslie, H. M., and McLeod, K. L. (2007). Confronting the challenges of implementing marine ecosystem-based management. Front. Ecol. Environ. 5:540–548. doi: 10.1890/060093
Lindegren, M., Dakos, V., Gröger, J. P., Gårdmark, A., Kornilovs, G., Otto, S. A., et al. (2012). Early detection of ecosystem regime shifts: a multiple method evaluation for management application. PLoS One 7:e38410. doi: 10.1371/journal.pone.0038410
Link, J. S., Brodziak, J. K. T., Edwards, S. F., Overholtz, W. J., Mountain, D., Jossi, J. W., et al. (2002). Marine ecosystem assessment in a fisheries management context. Can. J. Fish. Aquat. Sci. 59, 1429–1440. doi: 10.1139/f02-115
Lynam, C. P., Uusitalo, L., Patrício, J., Piroddi, C., Queirós, A. M., Teixeira, H., et al. (2016). Uses of innovative modeling tools within the implementation of the marine strategy framework directive. Front. Mar. Sci. 3:182. doi: 10.3389/fmars.2016.00182
Mackinson, S., Platts, M., Garcia, C., and Lynam, C. (2018). Evaluating the fishery and ecological consequences of the proposed North Sea multi-annual plan. PLoS One 13:e0190015. doi: 10.1371/journal.pone.0190015
Marine Climate Change Impacts Partnership (2017). in Marine Climate Change Impacts: 10 Years’ Experience of Science to Policy Reporting, eds M. Frost, P. Buckley, S. Dye, and B. Stoker (Lowestoft: MCCIP).
Maron, M., Bull, J. W., Evans, M. C., and Gordon, A. (2015). Locking in loss: baselines of decline in Australian biodiversity offset policies. Biol. Conserv. 192, 504–512. doi: 10.1016/j.biocon.2015.05.017
McQuatters-Gollop, A., Johns, D. G., Bresnan, E., Skinner, J., Rombouts, I., Stern, R. F., et al. (2017). From microscope to management: the critical value of plankton taxonomy to marine policy and biodiversity conservation. Mar. Policy 83, 1–10. doi: 10.1016/j.marpol.2017.05.022
Methratta, E. T., and Link, J. S. (2006). Evaluation of quantitative indicators for marine fish communities. Ecol. Indic. 6, 575–588. doi: 10.1016/j.ecolind.2005.08.022
Micheli, F., Halpern, B. S., Walbridge, S., Ciriaco, S., Ferretti, F., Fraschetti, S., et al. (2013). Cumulative human impacts on mediterranean and black sea marine ecosystems: assessing current pressures and opportunities. PLoS One 8:e79889. doi: 10.1371/journal.pone.0079889
Miloslavich, P., Bax, N. J., Simmons, S. E., Klein, E., Appeltans, W., Aburto-Oropeza, O., et al. (2018). Essential ocean variables for global sustained observations of biodiversity and ecosystem changes. Glob. Change Biol. 24, 2416–2433. doi: 10.1111/gcb.14108
Möllmann, C., Diekmann, R., Müller-Karulis, B., Kornilovs, G., Plikshs, M., and Axe, P. (2009). Reorganization of a large marine ecosystem due to atmospheric and anthropogenic pressure: a discontinuous regime shift in the Central Baltic Sea. Glob. Change Biol. 15, 1377–1393. doi: 10.1111/j.1365-2486.2008.01814.x
Natural Resource Management Ministerial Council (2010). Australia’s Biodiversity Conservation Strategy 2010-2030. Canberra: Australian Government, Department of Sustainability, Environment, Water, Population and Communities.
Ocean Health Index (2017). The Ocean Health Index Annual Scores. Available at: http://www.oceanhealthindex.org/region-scores/annual-scores-and-rankings [Accessed]
OECD (1993). OECD Core Set of Indicators for Environmental Performance Reviews - A Synthesis Report by the Group on the State of the Environment in: Environment Monographs. Paris: OECD.
OSPAR (2012). MSFD Advice Manual and Background Document on Biodiversity: Approaches to Determining Good Environmental Status, Setting of Environmental Targets and Selecting Indicators for Marine Strategy Framework Directive Descriptors 1, 2, 4 and 6. Paris: OSOAR.
OSPAR (2017a). BH2: Condition of Benthic Habitat Communities: The Common Conceptual Approach. Paris: OSOAR.
OSPAR (2017d). Intermediate Assessment 2017. Available at: https://oap.ospar.org/en/ospar-assessments/intermediate-assessment-2017.
OSPAR (2017e). Intermediate Assessment 2017: Assessment Process and Methods. Available at: https://oap.ospar.org/en/ospar-assessments/intermediate-assessment-2017/introduction/assessment-process-and-methods/ [Accessed].
OSPAR (2017j). Seal Abundance and Distribution. Available at: https://oap.ospar.org/en/ospar-assessments/intermediate-assessment-2017/biodiversity-status/marine-mammals/seal-abundance-and-distribution/ [Accessed].
Otto, S. A., Kadin, M., Casini, M., Torres, M. A., and Blenckner, T. (2018a). A quantitative framework for selecting and validating food web indicators. Ecol. Indic. 84, 619–631. doi: 10.1016/j.ecolind.2017.05.045
Otto, S. A., Plonus, R., Funk, S., and Keth, A. (2018b). INDperform: Evaluation of Indicator Performances for Assessing Ecosystem States. R Package Version 0.1.1. Available at: https://CRAN.R-project.org/package=INDperform.
Pacheco, A. S., González, M. T., Bremner, J., Oliva, M., Heilmayer, O., Laudien, J., et al. (2011). Functional diversity of marine macrobenthic communities from sublittoral soft-sediment habitats off northern Chile. Helgol. Mar. Res. 65, 413–424. doi: 10.1007/s10152-010-0238-8
Papworth, S. K., Rist, J., Coad, L., and Milner-Gulland, E. J. (2009). Evidence for shifting baseline syndrome in conservation. Conserv. Lett. 2, 93–100. doi: 10.1111/j.1755-263X.2009.00049.x
Pauly, D. (1995). Anecdotes and the shifting baseline syndrome of fisheries. Trends Ecol. Evol. 10:430. doi: 10.1016/S0169-5347(00)89171-5
Pereira, H. M., Ferrier, S., Walters, M., Geller, G. N., Jongman, R. H. G., Scholes, R. J., et al. (2013). Essential biodiversity variables. Science 339, 277–278. doi: 10.1126/science.1229931
Pettorelli, N., Schulte to Bühne, H., Tulloch, A., Dubois, G., Macinnis-Ng, C., Queirós, A. M., et al. (2018). Satellite remote sensing of ecosystem functions: opportunities, challenges and way forward. Remote Sens. Ecol. Conserv. 4, 71–93. doi: 10.1002/rse2.59
Pınarbaşı, K., Galparsoro, I., Borja,Á, Stelzenmüller, V., Ehler, C. N., and Gimpel, A. (2017). Decision support tools in marine spatial planning: present applications, gaps and future perspectives. Mar. Policy 83, 83–91. doi: 10.1016/j.marpol.2017.05.031
Pinnegar, J. K., and Engelhard, G. H. (2008). The ‘shifting baseline’ phenomenon: a global perspective. Rev. Fish. Biol. Fish. 18, 1–16. doi: 10.1007/s11160-007-9058-6
Plagányi,ÉE., Rademeyer, R. A., Butterworth, D. S., Cunningham, C. L., and Johnston, S. J. (2007). Making management procedures operational—innovations implemented in South Africa. ICES J. Mar. Sci. 64, 626–632. doi: 10.1093/icesjms/fsm043
Plumeridge, A. A., and Roberts, C. M. (2017). Conservation targets in marine protected area management suffer from shifting baseline syndrome: a case study on the Dogger Bank. Mar. Pollut. Bull. 116, 395–404. doi: 10.1016/j.marpolbul.2017.01.012
Pocklington, J. B., Carey, J. M., Murshed, M. D. T., and Howe, S. A. J. (2012). Conceptual Models for Victorian Ecosystems: Marine and Estuarine Ecosystems. Melbourne: Parks Victoria.
Probst, W. N., Kloppmann, M., and Kraus, G. (2013). Indicator-based status assessment of commercial fish species in the North Sea according to the EU Marine Strategy Framework Directive (MSFD). ICES J. Mar. Sci. 70, 694–706. doi: 10.1093/icesjms/fst010
Probst, W. N., and Stelzenmüller, V. (2015). A benchmarking and assessment framework to operationalise ecological indicators based on time series analysis. Ecol. Indic. 55, 94–106. doi: 10.1016/j.ecolind.2015.02.035
Queirós, A. M., Fernandes, J., Genevier, L., and Lynam, C. P. (2018). Climate change alters fish community size-structure, requiring adaptive policy targets. Fish Fish. 19, 613–621. doi: 10.1111/faf.12278
Queirós, A. M., Strong, J. A., Mazik, K., Carstensen, J., Bruun, J., Somerfield, P. J., et al. (2016). An objective framework to test the quality of candidate indicators of good environmental status. Front. Mar. Sci. 3:73. doi: 10.3389/fmars.2016.00073
Ramírez, F., Afán, I., Davis, L. S., and Chiaradia, A. (2017). Climate impacts on global hot spots of marine biodiversity. Sci. Adv. 3:e1601198. doi: 10.1126/sciadv.1601198
Rice, J. C., and Rochet, M.-J. (2005). A framework for selecting a suite of indicators for fisheries management. ICES J. Mar. Sci. 62, 516–527. doi: 10.1016/j.icesjms.2005.01.003
Rochet, M.-J., Trenkel, V., Bellail, R., Coppin, F., Le Pape, O., Mahé, J.-C., et al. (2005). Combining indicator trends to assess ongoing changes in exploited fish communities: diagnostic of communities off the coasts of France. ICES J. Mar. Sci. 62, 1647–1664. doi: 10.1016/j.icesjms.2005.06.009
Rossberg, A. G., Uusitalo, L., Berg, T., Zaiko, A., Chenuil, A., Uyarra, M. C., et al. (2017). Quantitative criteria for choosing targets and indicators for sustainable use of ecosystems. Ecol. Indic. 72, 215–224. doi: 10.1016/j.ecolind.2016.08.005
Sainsbury, K. J., Punt, A. E., and Smith, A. D. M. (2000). Design of operational management strategies for achieving fishery ecosystem objectives. ICES J. Mar. Sci. 57, 731–741. doi: 10.1006/jmsc.2000.0737
Samhouri, J. F., Levin, P. S., and Harvey, C. J. (2009). Quantitative evaluation of marine ecosystem indicator performance using food web models. Ecosystems 12, 1283–1298. doi: 10.1007/s10021-009-9286-9
Scheffer, M., and Carpenter, S. R. (2003). Catastrophic regime shifts in ecosystems: linking theory to observation. Trends Ecol. Evol. 18, 648–656. doi: 10.1016/j.tree.2003.09.002
Shannon, L. J., Coll, M., Yemane, D., Jouffre, D., Neira, S., Bertrand, A., et al. (2010). Comparing data-based indicators across upwelling and comparable systems for communicating ecosystem states and trends. ICES J. Mar. Sci. 67, 807–832. doi: 10.1093/icesjms/fsp270
Shephard, S., Greenstreet, S. P. R., Piet, G. J., Rindorf, A., and Dickey-Collas, M. (2015). Surveillance indicators and their use in implementation of the marine strategy framework directive. ICES J. Mar. Sci. 72, 2269–2277. doi: 10.1093/icesjms/fsv131
Shephard, S., Rindorf, A., Dickey-Collas, M., Hintzen, N. T., Farnsworth, K., and Reid, D. G. (2014). Assessing the state of pelagic fish communities within an ecosystem approach and the european marine strategy framework directive. ICES J. Mar. Sci. 71, 1572–1585. doi: 10.1093/icesjms/fsu005
Shin, Y.-J., Houle, J. E., Akoglu, E., Blanchard, J. L., Bundy, A., Coll, M., et al. (2018). The specificity of marine ecological indicators to fishing in the face of environmental change: a multi-model evaluation. Ecol. Indic. 89, 317–326. doi: 10.1016/j.ecolind.2018.01.010
Shin, Y.-J., Shannon, L. J., Bundy, A., Coll, M., Aydin, K., Bez, N., et al. (2010). Using indicators for evaluating, comparing, and communicating the ecological status of exploited marine ecosystems. 2. Setting the scene. ICES J. Mar. Sci. 67, 692–716. doi: 10.1093/icesjms/fsp294
Sink, K., Holness, S., Harris, L., Majiedt, P., Atkinson, L., Robinson, T., et al. (2012). National Biodiversity Assessment 2011: Technical Report. Volume 4: Marine and Coastal Component. Pretoria: South African National Biodiversity Institute,
Smith, C. J., Papadopoulou, K.-N., Barnard, S., Mazik, K., Elliott, M., Patrício, J., et al. (2016). Managing the marine environment, conceptual models and assessment considerations for the european marine strategy framework directive. Front. Mar. Sci. 3:144. doi: 10.3389/fmars.2016.00144
Spalding, M. D., Fox, H. E., Allen, G. R., Davidson, N., Ferdaña, Z. A., Finlayson, M., et al. (2007). Marine ecoregions of the world: a bioregionalization of coastal and shelf areas. Bioscience 57, 573–583. doi: 10.1641/B570707
Strong, J. A., and Elliott, M. (2017). The value of remote sensing techniques in supporting effective extrapolation across multiple marine spatial scales. Mar. Pollut. Bull. 116, 405–419. doi: 10.1016/j.marpolbul.2017.01.028
Stuart-Smith, R. D., Edgar, G. J., Barrett, N. S., Bates, A. E., Baker, S. C., Bax, N. J., et al. (2017). Assessing national biodiversity trends for rocky and coral reefs through the integration of citizen science and scientific monitoring programs. Bioscience 67, 134–146. doi: 10.1093/biosci/biw180
Tam, J. C., Link, J. S., Tam, J. C., Large, S. I., Van De Wolfshaar, K., Pranovi, F., et al. (2017). Towards ecosystem-based management: identifying operational food-web indicators for marine ecosystems. ICES J. Mar. Sci. 74, 2040–2052. doi: 10.1093/icesjms/fsw230
Teixeira, H., Berg, T., Uusitalo, L., Fürhaupter, K., Heiskanen, A.-S., Mazik, K., et al. (2016). A catalogue of marine biodiversity indicators. Front. Mar. Sci. 3:207. doi: 10.3389/fmars.2016.00207
Thiel, M., Penna-Diaz, M. A., Luna-Jorquera, G., Salas, S., Sellanes, J., and Stotz, W. (2014). Citizen scientists and marine research: volunteer participants, their contributions and projection for the future. Oceanogr. Mar. Biol. Annu Rev. 52, 257–314. doi: 10.1201/b17143-6
Thurstan, R. H., Hawkins, J. P., Raby, L., and Roberts, C. M. (2013). Oyster (Ostrea edulis) extirpation and ecosystem transformation in the Firth of Forth, Scotland. J. Nat. Conserv. 21, 253–261. doi: 10.1016/j.jnc.2013.01.004
Tittensor, D. P., Mora, C., Jetz, W., Lotze, H. K., Ricard, D., Berghe, E. V., et al. (2010). Global patterns and predictors of marine biodiversity across taxa. Nature 466:1098. doi: 10.1038/nature09329
Tittensor, D. P., Walpole, M., Hill, S. L. L., Boyce, D. G., Britten, G. L., Burgess, N. D., et al. (2014). A mid-term analysis of progress toward international biodiversity targets. Science 346, 241–244. doi: 10.1126/science.1257484
Torres, M. A., Casini, M., Huss, M., Otto, S. A., Kadin, M., and Gårdmark, A. (2017). Food-web indicators accounting for species interactions respond to multiple pressures. Ecol. Indic. 77, 67–79. doi: 10.1016/j.ecolind.2017.01.030
Turrell, W. R. (2018). Improving the implementation of marine monitoring in the northeast Atlantic. Mar. Pollut. Bull. 128, 527–538. doi: 10.1016/j.marpolbul.2018.01.067
UNESCO (2018). United Nations Decade of Ocean Science for Sustainable Development (2021–2030). Paris: UNESCO.
United Kingdom Marine Monitoring and Assessment Strategy (2010). Charting Progress 2: The State of UK Seas. An Overview. London: DEFRA.
United Nations (2010). Strategic Plan for Biodiversity 2011-2020, Including Aichi Biodiversity Targets in: Decision x/2. New York, NY: United Nations.
United Nations Environment Programme (2004). Decision Adopted by the Conference of the Parties to the Convention on Biological Diversity at its Seventh Meeting. Nairobi: United Nations Environment Programme.
United Nations General Assembly (2015). Transforming Our World : the 2030 Agenda for Sustainable Development”, in: A/RES/70/1. New York, NY: United Nations General Assembly.
USAID (2009). USAID Glossary of Evaluation Terms. Washington, DC: United States Agency for International Development.
Uusitalo, L., Blanchet, H., Andersen, J. H., Beauchard, O., Berg, T., Bianchelli, S., et al. (2016). Indicator-based assessment of marine biological diversity–lessons from 10 case studies across the european seas. Front. Mar. Sci. 3:159. doi: 10.3389/fmars.2016.00159
Van Loon, W. M. G. M., Walvoort, D. J. J., Van Hoey, G., Vina-Herbon, C., Blandon, A., Pesch, R., et al. (2018). A regional benthic fauna assessment method for the Southern North Sea using Margalef diversity and reference value modelling. Ecol. Indic. 89, 667–679. doi: 10.1016/j.ecolind.2017.09.029
van Oudenhoven, A. P. E., Schröter, M., Drakou, E. G., Geijzendorffer, I. R., Jacobs, S., Van Bodegom, P. M., et al. (2018). Key criteria for developing ecosystem service indicators to inform decision making. Ecol. Indic. 95, 417–426. doi: 10.1016/j.ecolind.2018.06.020
Vasilakopoulos, P., Raitsos, D. E., Tzanatos, E., and Maravelias, C. D. (2017). Resilience and regime shifts in a marine biodiversity hotspot. Sci. Rep. 7:13647. doi: 10.1038/s41598-017-13852-9
Worm, B., Barbier, E. B., Beaumont, N., Duffy, J. E., Folke, C., Halpern, B. S., et al. (2006). Impacts of biodiversity loss on ocean ecosystem services. Science 314, 787–790. doi: 10.1126/science.1132294
Keywords: ecosystem approach, assessment, monitoring, baselines, thresholds, policy communication, cumulative effects
Citation: McQuatters-Gollop A, Mitchell I, Vina-Herbon C, Bedford J, Addison PFE, Lynam CP, Geetha PN, Vermeulan EA, Smit K, Bayley DTI, Morris-Webb E, Niner HJ and Otto SA (2019) From Science to Evidence – How Biodiversity Indicators Can Be Used for Effective Marine Conservation Policy and Management. Front. Mar. Sci. 6:109. doi: 10.3389/fmars.2019.00109
Received: 19 October 2018; Accepted: 21 February 2019;
Published: 13 March 2019.
Edited by:
Leslie Cornick, Eastern Washington University, United StatesReviewed by:
Jose M. Fariñas-Franco, National University of Ireland Galway, IrelandSilvia De Juan Mohan, Institute of Marine Sciences (ICM), Spain
Copyright © 2019 McQuatters-Gollop, Mitchell, Vina-Herbon, Bedford, Addison, Lynam, Geetha, Vermeulan, Smit, Bayley, Morris-Webb, Niner and Otto. This is an open-access article distributed under the terms of the Creative Commons Attribution License (CC BY). The use, distribution or reproduction in other forums is permitted, provided the original author(s) and the copyright owner(s) are credited and that the original publication in this journal is cited, in accordance with accepted academic practice. No use, distribution or reproduction is permitted which does not comply with these terms.
*Correspondence: Abigail McQuatters-Gollop, YWJpZ2FpbC5tY3F1YXR0ZXJzLWdvbGxvcEBwbHltb3V0aC5hYy51aw==