 Frédéric Cyr
 Marc Tedetti
 Florent Besson
 Nagib Bhairy2
 Madeleine Goutx
- 1Northwest Atlantic Fisheries Centre, Fisheries and Oceans Canada, St. John's, NL, Canada
- 2CNRS, IRD, Aix-Marseille Université, Université de Toulon, MIO UM 110, Marseille, France
- 3ALSEAMAR, Rousset, France
This study presents the MiniFluo-UV, an ocean glider-compatible fluorescence sensor that targets the detection of polycyclic aromatic hydrocarbons (PAHs) in the marine environment. Two MiniFluos can be installed on a glider, each equipped with two optical channels (one PAH is measured per channel). This setup allows the measurement of up to 4 different fluorescent PAHs: Naphthalene, Phenanthrene, Fluorene and Pyrene. Laboratory tests on oil products (Maya crude oil and Diesel fuel) as well as on marine samples near industrial areas (urban harbor and offshore installations) revealed that the concentration of the four PAHs targeted accounted for 62–97% of the total PAH concentration found in samples (∑16 PAHs determined by standard international protocols). Laboratory tests also revealed that for marine applications, the calibration on Water Accommodated Fraction (WAF) of crude oil is more appropriate than the one on pure standards (STD). This is because PAH fluorescence is constituted in large part of alkylated compounds that are not considered with STD calibration. Results from three glider deployments with increasing levels of complexity (a laboratory trial, a field mission in non-autonomous mode and a fully autonomous mission) are also presented. During field deployments, the MiniFluo-glider package was able to detect concentration gradients from offshore marine waters toward the head of a Mediterranean harbor (< 80 ng L−1) as well as hydrocarbon patches at the surface waters of an oil and gas exploitation field in the North Sea (< 200 ng L−1, mainly Naphthalene). It is suggested that using only the WAF calibration, the concentration derived with the MiniFluo agrees within one order of magnitude with the concentration determined by Gas Chromatography coupled with Mass Spectrometry (overestimation by a factor 7 on average). These performances can be improved if the calibration is made with a WAF with PAH proportions similar to the one find in the environment. Finally, it is shown that the use of in situ calibration on water samples collected during the glider deployment, when possible, gives the best results.
1. Introduction
Polycyclic aromatic hydrocarbons (PAHs), a specific type of petroleum hydrocarbons, are lipophilic compounds consisting of two or more fused benzene rings. They are among the most widespread organic contaminants in the marine environment (Roose and Brinkman, 2005; González-Gaya et al., 2016). PAHs are persistent and mobile, can strongly bio-accumulate in food chains and are harmful to living organisms through carcinogenic and mutagenic effects (Kennish, 1991; Hylland, 2006). They are therefore recognized as high priority contaminants by the European Union and the US Environmental Protection Agency.
PAHs are introduced in the marine environment in mainly two different ways. The first type of contamination occurs as rare but catastrophic events related to well blowout, wrecked tankers, broken pipelines, etc. These situations require rapid assessment of the disaster in support of decision makers and environmental response. Such analyzes are however complex when not much is known about the extent of the spill apart from its surface signature visible from aerial or remote sensing surveys. The second type of contamination is more subtle and occurs as chronic releases in the environment, for example when small quantities of hydrocarbons are permanently found in water as a result of various industrial and urban activities. Such contamination requires a quasi-permanent monitoring of neighboring waters, specially in proximity of populated areas with economical activities based on beaches, water sports, fisheries, etc. In both cases, the workload associated with such measurements makes the temporal and spatial coverage of the area of interest difficult. This is because traditional measurement implies the collection of discrete water samples that need to be further analyzed in the laboratory.
In surface oceanic waters, total dissolved PAHs (∑13-19 parent PAHs) display a wide range of concentrations: from 0.15 to 10 ng L−1 in open ocean (Witt and Matthäus, 2001; Stortini et al., 2009; Berrojalbiz et al., 2011), from 4 to 500 ng L−1 in coastal areas (Guitart et al., 2007; Valavanidis et al., 2008; Qiu et al., 2009) and from 100 to >1,000 ng L−1 in harbor waters (Zhou et al., 2000). It is worth noting that when taking into account alkylated derivatives (i.e., mono-, di-, tri- or tetra-methyl PAHs), the concentration of dissolved total PAHs (∑ 32 parents + alkylated PAHs) may increase by a factor 1.5–3 in coastal and harbor waters (Guigue et al., 2011, 2014). In oceanic waters affected by intense oil spills, the concentrations of dissolved total (parents or parents + alkylated) PAHs may reach from 300 up to 100,000 ng L−1 (Reddy and Quinn, 2001; Zhou and Maskaoui, 2003; González et al., 2006). In these conditions of oil spill, the distribution of dissolved PAHs is generally dominated by low molecular weight petrogenic compounds, mainly naphthalene (Naph), phenanthrene (Phe), fluorene (Flu) and their alkylated derivatives (González et al., 2006; Zhou et al., 2013).
Due to their aromatic structure, PAHs are highly fluorescent in the ultraviolet spectral domain (UV: 200–400 nm). New techniques exploiting these fluorescence properties have been recently employed to overcome difficulties associated with laboratory measurements, and to increase the spatiotemporal coverage of the observations. Submersible UV fluorometers have been proposed to acquire real time, continuous and high frequency in situ measurements of dissolved PAHs/oil in natural or engineered waters (Zielinski et al., 2009; Conmy et al., 2014a,b). Many of these techniques were tested and validated during Deepwater Horizon spill, the largest spill in the recent history of oil and gas offshore industry. A good example of such new technique is the use of fluorescence properties of PAHs and autonomous underwater vehicles (AUV). These techniques were proven successful in tracking the hydrocarbon plume of Deep Water Horizon (Camilli et al., 2010). But while many fluorometers can detect the presence of oil in seawater (Conmy et al., 2014b), their performances usually depend on the correspondence between the choice of the sensor's spectral domain and the fluorescence signatures of the compounds found in the oil (Tedetti et al., 2012, 2013; Ferretto et al., 2014).
Unlike other AUVs, gliders have no propelling systems and their motion is driven by buoyancy changes (Davis et al., 2003; Rudnick et al., 2004). They cruise the ocean at relatively low speed (0.5–1 m s−1) guided by satellite communications while acquiring variety of scientific parameters. Because of their relatively large autonomy and low utilization cost, they have received increased attention in ocean sciences research over the last decade, and are now increasingly used as standard pieces of ocean observing systems (Testor et al., 2010; Rudnick and Cole, 2011). When equipped with specific sensors, gliders could thus be used as powerful assessment tools to track dissolved PAHs in natural waters. One of these sensors is the MiniFluo-UV, hereinafter simply MiniFluo (Tedetti et al., 2013; Cyr et al., 2017), now fully operational on SeaExplorer gliders. Through laboratory work on the sensor alone and 3 scenarios of increasing complexity with the glider, it is shown below that glider-based optical measurements with the MiniFluo is a promising environmental assessment tool to monitor PAH concentrations in natural waters.
2. Sensor Description and Method
2.1. MiniFluo Sensor
The first version of the MiniFluo was developed between 2009 and 2011 as a field-portable fluorometer. In its original configuration, the MiniFluo was targeting the detection of Naphthalene-like (Naph-like) and Phenanthrene-like (Phe-like) fluorophores from discrete water samples (Tedetti et al., 2013). Here, and for the remaining of this study, -like suffix refers to the concentrations derived with the MiniFluo that target a certain PAH, although it is acknowledged that other compounds present in the environment may also fluoresce at close excitation/emission wavelengths (λEx/λEm). Based on this first prototype, a second generation of the MiniFluo was developed during the period 2012–2015. This new submersible version is now compatible with underwater gliders SeaExplorer, and exhibits significant improvements in term of opto-electronic architecture (this version is first presented in Cyr et al., 2017). In addition to these improvements, the number of fluorophores to be detected has been extended with the addition of Fluorene-like (Flu-like) and Pyrene-like (Pyr-like) fluorophores. This new version is now commercialized by ALSEAMAR, also the manufacturer of the SeaExplorer glider.
Two configurations are presented here: the “MiniFluo-1” for the detection of Naph-like and Phe-like, and the “MiniFluo-2” for the detection of Pyr-like and Flu-like. A first study using the actual version of the sensor was already published (Cyr et al., 2017), but the sensor was used to detect natural dissolved organic matter (DOM) fluorophores, and the study limited to MiniFluo-1 configuration without the emphasis on PAHs detection. The present study focuses on PAHs detection and the utilization of the MiniFluo/glider combination in the case of industrial contamination and/or risk-assessment applications.
Basic working principles relevant for this new application are recalled here, but we refer to previous studies for a more complete description of the sensor architecture and functioning (Tedetti et al., 2013; Cyr et al., 2017). The MiniFluo has two optical channels, enabling the simultaneous detection/quantification of 2 fluorescent compounds of interest (1 compound per optical channel). These channels may be chosen among a list of four λEx/λEm couples to be set up by the manufacturer (see list in Table 1). Because of firmware limitations, the installation of two MiniFluos with different configurations was not possible at the time the glider tests were performed (feature implemented since). While both MiniFluo-1 and MiniFluo-2 (Phe/Naph and Flu/Pyr) were used during laboratory measurements and for glider deployment in the experimental basin (polludrome), glider deployments in natural waters (Saumaty Harbor and North Sea) were carried out using only MiniFluo-1 (Phe/Naph). The glider deployments are described in section 2.3
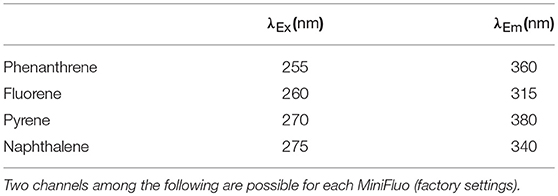
Table 1. Excitation/emission wavelengths of the MiniFluo channels and their targeted fluorophores.
2.2. MiniFluo Calibration and GC−MS Analyses
As reported in an earlier study (see Cyr et al., 2017, for a complete description), the conversion from relative unit (RU) signal of the MiniFluo () to mass concentration (C in ng L−1) is done through the equation:
Here Cc is the measured count value of the detection photo-diode, Cm the measured count value of the monitoring photo-diode, ND = 4096 the electronic noise of the circuit (dark offset). Parameters SF (scale factor, in RU L ng−1) and B (blank noise, in RU) are obtained, respectively, as the slope and intercept of the calibration linear regression between the measured concentration and relative unit signal returned by the MiniFluo.
For each fluorometer (MiniFluo-1 and MiniFluo-2), the response of each optical channel (respectively Naph/Phe and Flu/Pyr) was calibrated using two different approaches (see also Cyr et al., 2017). The first calibration is performed on pure standards (STD), i.e., on the individual parent PAH compound. Each solution was prepared by solubilizing pure standards (Sigma-Aldrich ≥ 98%) in methanol, before realizing successive dilution in both ultra-pure (milli-Q) water and synthetic seawater (SSW) in order to obtain concentration ranging from 50 to 5,000 ng L−1.
A second set of calibrations was conducted with water accommodated fraction (WAF) of oil in seawater in order to calibrate the sensors with solutions whose PAH composition is more representative of that found in the marine environment. These were realized using Maya Crude oil that naturally contains the targeted (parents) PAHs and their alkylated derivatives. The WAF was prepared by introducing 2 mL of crude oil (“Maya” type) at the surface of 1 L of filtered seawater (filter pore size 0.2 μm). The underlying water was then stirred with a magnetic stirrer for a minimum of 36 h. The water under the crude oil micro-layer is considered the WAF (Cyr et al., 2017).
The PAH composition of the WAF was determined in laboratory by Gas Chromatography coupled with Mass Spectrometry (GC−MS). This followed the CEDRE (Center of Documentation, Research and Experimentation on Accidental Water Pollution located in Brest, France) standard protocol that is part of the Bonn Agreement oil spill identification network OSInet certified ISO 9001:2015 (SGS-ICS). Compared to calibrations on STD, the calibration using WAF better captures the fluorescence of the entire PAH family of interest. The compound family, consisting of the parent (e.g., Naph, Phe, Pyr and Flu) and their alkylated derivatives, will be further referred as “Naphs,” “Phes,” “Pyrs,” and “Flus,” respectively. The WAF was diluted in SSW in order to obtain concentrations of 1.5, 3, 6, 12.5, and 25% of the initial WAF. For each of these WAF solutions, concentrations in Naphs, Phes, Pyrs et Flus were determined by GC−MS.
STD and WAF calibrations are carried with the MiniFluo connected to a computer via a communication box (see Tedetti et al., 2013, for picture and detailed description). The measurements are performed using quartz cuvettes placed on a cuvette holder containing prisms similar to the one found in the MiniFluo optical cap. In addition to measurements of each prepared solution mentioned above, a measurement in the absence of PAH (only milli-Q water or SSW) is also taken. The “detection limit” (DL) of the sensor is determined as the following: , where σC0 is the standard deviation of the blank measurement (i.e., only SSW or milli-Q water).
2.3. Glider Deployments
Three glider deployments were realized as part of this study. They are presented here in order of increasing level of complexity in terms of glider mission design. The first deployment is a validation of the sensor's response in a controlled environment at CEDRE in July 2017. The CEDRE experimental basin (polludrome) is a controlled petroleum-impacted marine environment (flume tank) that reproduces a flow passing through the sensor's cap (see Figure 1). This aims to reproduce in situ conditions as if the glider was gliding in the ocean. The standard CEDRE procedure was applied. The day before the experiment, 50 mL petroleum fuel (Total S.A. Diesel) was gently poured into the 7 m3 experimental basin and mixed (without surfactant addition) under a 1 m s−1 current overnight to establish the WAF. The next day (~14 h later), the glider was introduced in the polludrome, still under the same current. Then, the concentration of hydrocarbons was decreased by several steps via successive dilutions (, , , ) by removing each time about half of the polludrome volume before replacing it by seawater pumped from near-shore waters. Before being introduced in the polludrome, the water is filtered using a standard aquarium-grade sand filtration treatment that removes most large size particles and part of the dissolved organic material. At each concentration, 500 mL of water was sampled from the polludrome and the hydrocarbon fraction was extracted using a method of Stir Bar Sorptive Extraction (SBSE) and analyzed by GC−MS. While the MiniFluo was constantly sampling, only the average over about 2 min is taken as the measured fluorescence value for this concentration. This measurement was made after an approximate 10-min stabilization pause, a period determined by visual inspection of the MiniFluo signal after each dilution.
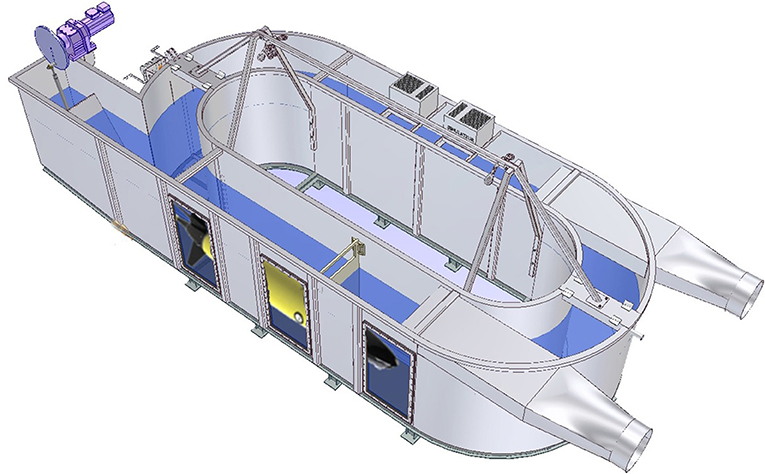
Figure 1. Sketch of the “polludrome” at the Center of Documentation, Research and Experimentation on Accidental Water Pollution (CEDRE). The glider equipped with MiniFluo-1 and MiniFluo-2 was placed as illustrated here. Source of original image: G2B / CEDRE (modified with permission).
The second deployment was realized in natural waters. For this trial, the glider was deployed in Saumaty, a highly anthropized harbor located in Marseille metropolitan area (France) on October 11th 2016. The choice of this location was motivated by a known offshore-inshore gradient in PAHs concentration (Tedetti et al., 2013). For this 1-day mission, the glider was not performing normal dives, but was rather towed with a small inflatable embarkation approximately 1 m below the surface (see inset in Figure 2). The track of the deployment is a return transect from outside harbor (Figure 2). On the return transect, subsurface water samples were also collected at waypoints S01 to S05 for GC−MS analysis in the laboratory.
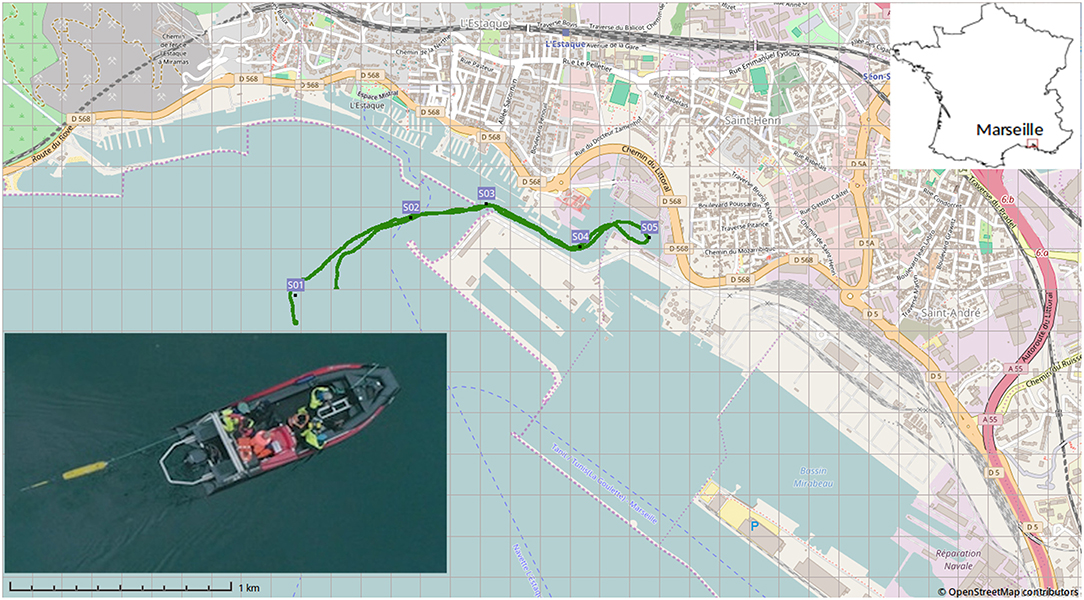
Figure 2. Glider sampling track in Saumaty Harbor (main figure) near the city of Marseille, France (see upper inset for location). The glider was towed behind a small boat (see inset for an example from another similar mission). The photography in the lower inset was reproduced with the permission of Dr. J. Pearlman.
The third glider mission is a standard glider deployment that took place between November 18th and December 3rd 2016, near Troll oil and gas field in the North Sea (see map Figure 3). The mission was performed in partnership with Statoil and Havila Shipping and served as a demonstration scenario assessing the feasibility of using gliders to patrol in proximity of offshore installations. During this mission, the glider SeaExplorer SEA003 was deployed at waypoint T1 where 4 water samples were collected (at 1, 10, 25, and 40 m depths) for further GC−MS analysis in laboratory. The glider completed a return transect across the channel along the T1-L2-L1 section, before surveying the triangle delimited by waypoints T1-T2-T3-T1 near 6 offshore oil and gas installations (blue stars on Figure 3 map).
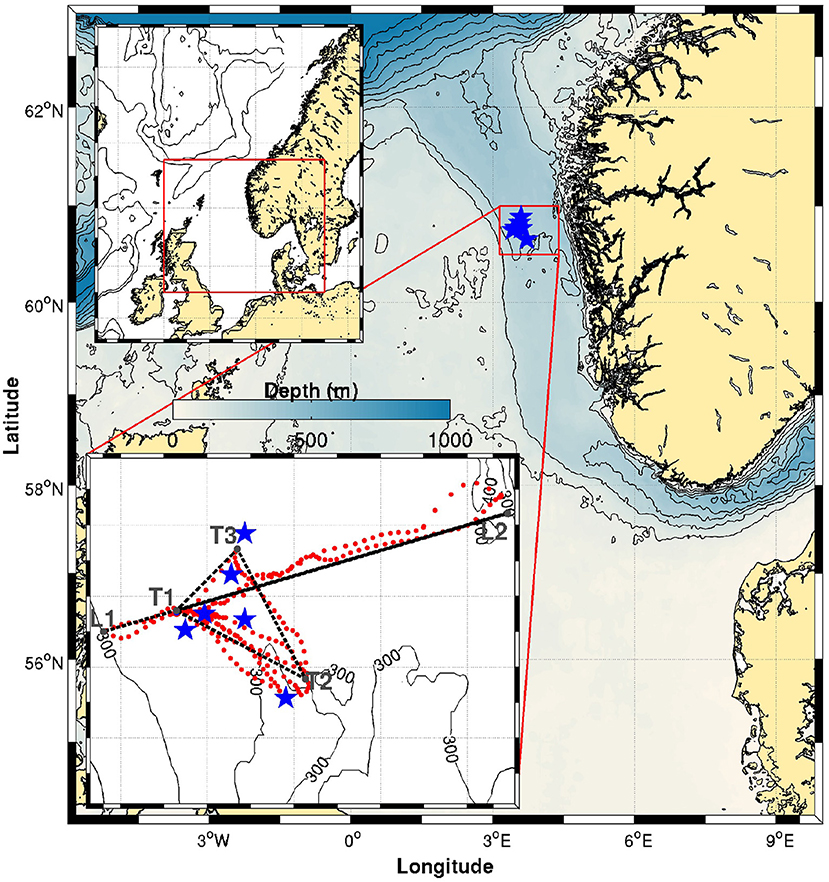
Figure 3. Glider track completed during the deployment in the North Sea. Each red dot correspond to a glider yo (downcast+upcast). Offshore installations are shown with blue stars. Dark gray dots and reference letters are waypoints used for piloting and to delimit the transects referred to in the text.
For this last mission, the glider data were processed using the same procedure as in Cyr et al. (2017) and briefly recalled here. The glider was equipped with a pumped conductivity-temperature-depth sensor (Seabird's GPCTD) from which the conservative temperature (Θ), the absolute salinity (SA) and the density anomaly referenced to the surface (σ0) are derived using TEOS-10 toolbox (McDougall and Barker, 2011). This GPCTD is also equipped with a dissolved oxygen (O2) sensor (Seabird's SBE-43F) from which concentrations are derived. A WetLabs ECO FLBBCD was also mounted on the glider for measurements of Chlorophyll-a (Chl-a) fluorescence (λEx/λEm: 470/695 nm), backscattering at 700 nm (BB700) and humic-like fluorophore fluorescence (λEx/λEm: 370/460 nm) expressed in μg L−1 equivalent quinine sulfate units (μg L−1QSU). For this sensor, the manufacturer's calibration was used. Glider observations were processed with the Socib glider toolbox (Troupin et al., 2015) for cast identification and georeferencing. For the first deployment in the polludrome, the glider was equipped with MiniFluo-1 and MiniFluo-2, while for the two campaigns at sea the glider was only equipped with MiniFluo-1.
3. Results and Discussion
3.1. Relative Proportions of PAHs Determined by GC−MS Analyzes
For the two WAFs prepared (laboratory calibration and polludrome experiment), Table 2 (left half) shows the relative proportions of the 4 PAHs targeted among the total number of PAHs measured from GC−MS. Naphs (defined as the sum of parent and alkylated compounds) are the dominant PAH in both preparation, reaching 49.3% and 78.0% of the total amount PAH measured from the WAF, respectively, for the Maya used for laboratory calibration and for the Diesel used during the polludrome experiment. Among the 4 PAHs reported, Phes are the second dominant family (6.0% and 10.9%), followed by Flus (5.5% and 5.8%) and the Pyrs (1.3% for both preparations). The fact that the cumulative fraction of these 4 PAHs composes a large part of the total PAHs of both WAF (respectively 62.0% and 96.0%) is an indication that the choice of the compounds targeted by the MiniFluo is justified.
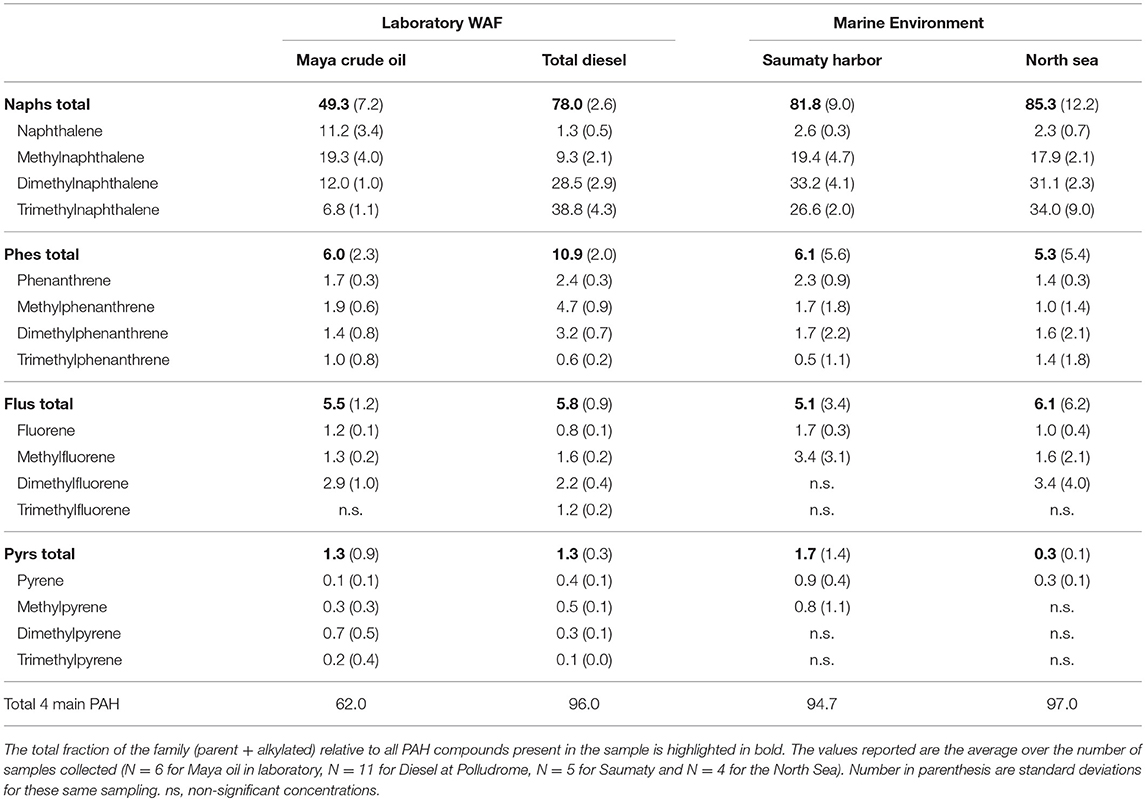
Table 2. Proportions (in %) of Naphthalene, Phenanthrene, Fluorene, and Pyrene in laboratory prepared WAF (Maya crude oil used in the laboratory and TOTAL Diesel fuel used in the polludrome; left two columns) and in the marine environment (Saumaty and North Sea; right two columns) as determined by GC−MS analysis.
For the water samples collected in marine environment (Table 2, right half), the dominant PAHs are again Naphs, with a slightly higher proportion among total PAHs compared to the prepared WAFs (81.8% and 85.3%, respectively, for Saumaty and the North Sea glider campaigns). For the other compounds (Phes, Flus and Pyrs), the proportion are remarkably similar to the WAF prepared. Overall, the 4 PAHs analyzed corresponded to 94.7% and 97.0% of the total dissolved PAHs concentration measured by GC−MS.
Table 2 also highlights that the contribution of the parent compound is never dominant over the rest of the family. The alkylated compounds that are instead generally dominant, specially for Naphs in the marine environment, where they represent roughly 80% or more of the total PAH fraction. These results are in agreement with many works that have reported the dominance of low molecular weight PAHs and their alkylated homologs (particularly Naphthalenes) within the pool of total dissolved PAHs in seawater (González et al., 2006; Guigue et al., 2014; Adhikari et al., 2015; Fourati et al., 2018).
These observations provide the scientific background to prefer the use of the WAF calibration over STD to detect oil in the marine environment. A WAF with relative proportions of each parent/alkylated compounds close to those found in the environment is preferable, and would likely improve the measurement with the MiniFluo or other optical sensors. The ability of collecting water samples to assess the hydrocarbon composition of environment where fluorescence measurements are planned is thus an important aspect to consider. This aspect will be discussed in the next sections.
3.2. Laboratory Calibrations
Calibration curves for each MiniFluo are presented in Figures 4, 5, from which the scale factor (SF) and the blank noise B (respectively slope and intercept of the calibration curves) are determined for both STD and WAF. As mentioned above, the large proportion of alkylated compounds explains the higher SF for the WAF calibration compared to the STD curve. This explains why using a calibration on STD (lower SF) would overestimate both the parent PAH concentration and total (parent + alkylated) PAH concentration.
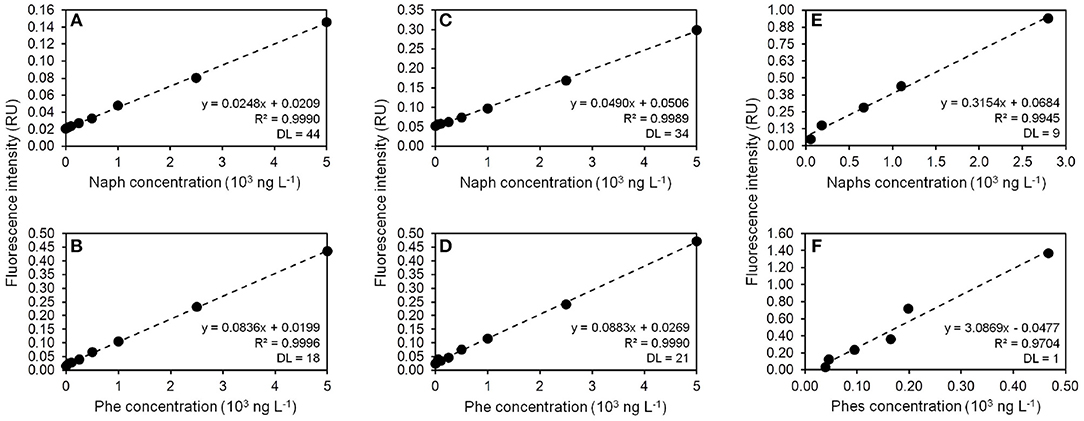
Figure 4. Calibration of the MiniFluo-1 (MFL S/N #14) sensor (Naph and Phe) for pure standards in ultra-pure (milli-Q) water (A,B), pure standards in synthetic seawater (SSW) (C,D) and with crude oil (Maya type) water accommodated fraction (WAF) containing parents and alkylated fractions of both PAH (E,F). Concentrations of Naphs and Phes (for WAF only) were obtained by GC−MS analyses. DL is the detection limit in ng L−1. Scale factor (SF) and Blank (B) values in Equation (1) are, respectively, the slope and y-intercept of the linear regression curve.
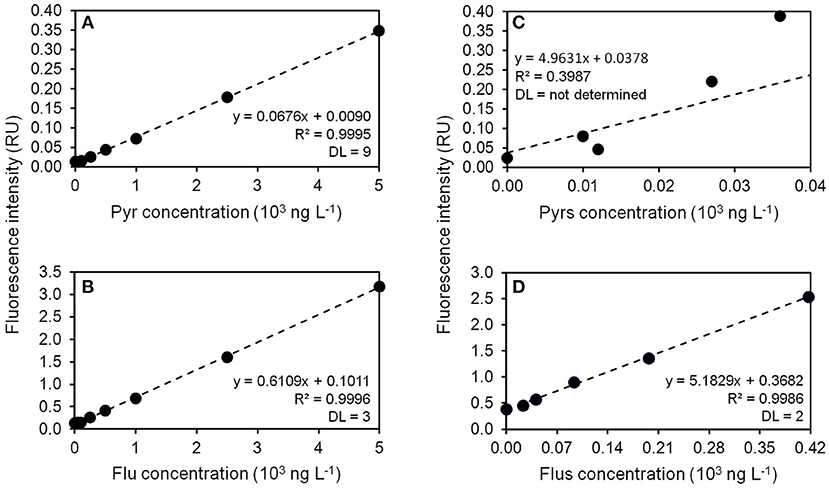
Figure 5. Calibration of the MiniFluo-2 (MFL S/N #11) sensor (Flu and Pyr) for pure standards in ultra-pure (milli-Q) water (A,B) and with crude oil (Maya type) water accommodated fraction (WAF) containing parents and alkylated fractions of both PAH (C,D). Concentrations of Flus and Pyrs were obtained by GC−MS analyses. DL is the detection limit in ng L−1. Scale factor (SF) and Blank (B) values in Equation (1) are, respectively, the slope and y-intercept of the linear regression curve. Calibration curves with pure standards in synthetic seawater (SSW) are not available.
It is also observed that calibration with SSW leads to higher SF and B values compared to calibration with milli-Q water (Figures 4A–D). This discrepancy in calibration factors between ultra-pure water and seawater has been already pointed out by Tedetti et al. (2010) with the EnviroFlu-HC fluorometer (TriOS Optical Sensors) and attributed to matrix effect, mainly related to differences in salt content or pH. Moreover, the higher slopes for Phe compared to Naph in both milli-Q water and SSW may reflect a higher fluorescence capacity of Phe, which may be explained by the more elevated fluorescence quantum yield and/or molar absorption coefficient of Phe (relative to Naph) due to its higher number of conjugated π-electrons and its higher resonance energy (Valeur and Berberan-Santos, 2012).
The calibration of MiniFluo-1 with WAF shows R2 coefficients of 0.995 and 0.970, respectively, for Naphs and Phes, that is slightly lower than for STD (R2 = 0.999). This diminution may be attributed to the fact that the WAF dilution is difficult to achieve, specially at the highest concentrations. One solution would be to enrich the SSW with increasing concentration of crude oil rather than conducting dilutions.
Regarding calibrations made on STD in ultra-pure water, Flu presented much higher SF and B values compared to the three other PAHs, while Pyr displayed SF value close to that of Phe (Figures 4A,B, 5A,B). The trend observed here for the four PAHs concerning the SF value (Flu >Phe >Pyr >Naph) has been already reported for the same kind of calibrations on STD in ultra-pure water from 3D fluorescence measurements performed using a laboratory spectrofluorometer (Ferretto et al., 2014). This trend in SF values reflects the intrinsic fluorescence capacity of the four PAHs (highest capacities for Flu and Phe, lowest for Naph) in accordance with their resonance energy (positive linear relationship between SF value and energy resonance for the four PAHs; Figure not shown). For the case of Pyrs and Flus, their proportions in the WAF (as analyzed by GC−MS) are less important than those of Naphs and Phes (Table 2). The concentrations range tested for those two compounds are thus more restricted than those for Naphs and Phes, especially for Pyrs (Figures 5C,D). In all cases, SF values (ratio of fluorescence intensity over PAH concentration) obtained when calibrating on WAF were higher than those obtained with STD calibration.
3.3. Validation in a Polludrome
PAH concentrations measured by GC−MS before the introduction of fuel in the basin (initial concentration) were already relatively high, with . This made the quantification of the concentrations at high dilution relatively difficult. This problem is probably related to an insufficient cleaning of the basin, and/or to non-negligible concentrations of PAHs in the water used for dilution (pumped from Brest Harbor). No measurements were performed in the water collection area, but concentrations measured in the European coastal marine environment generally vary in the range 10−500 ng L−1 (Guigue et al., 2014), and are therefore not negligible. However, they remain below the initial concentration reported above (e.g., 1377 ng L−1 for the ∑ 32 parents + alkylated PAHs). These relatively high values are likely due to a residual fraction of hydrocarbons that remains in the system after dilution (e.g., on the walls of the basin or in the pumping and filtering systems). In addition, the dilution system of the basin works in such a way that starting from the initial concentration (100% WAF), the total volume is reduced to its half before being completed by the filtered seawater (to reach 50% WAF), and so on until the minimum concentration is reached (6.5% WAF). Given the large volume considered here (7 m3) and the possible inertia of the drainage system, it is also probable that the dilution was less efficient than expected. Nevertheless, this system validated the calibration method and helped verifying that the sensor works as expected on the glider.
Table 3 shows the concentration of the 4 PAHs targeted here as determined by GC−MS in the experimental basin and measured by MiniFluo-1 (Naph, Phe) and MiniFluo-2 (Flu, Pyr) using the 2 calibrations previously discussed (STD and WAF). Because of technical issues, MiniFluo-2 was only deployed in the three dilutions with lowest concentrations. Due to the very low proportion of pyrenes in the fuel used to prepare the solutions, Pyrs concentration measured in the basin are very close to the detection limit and, although presented in Table 3, will therefore not be considered for further analysis.
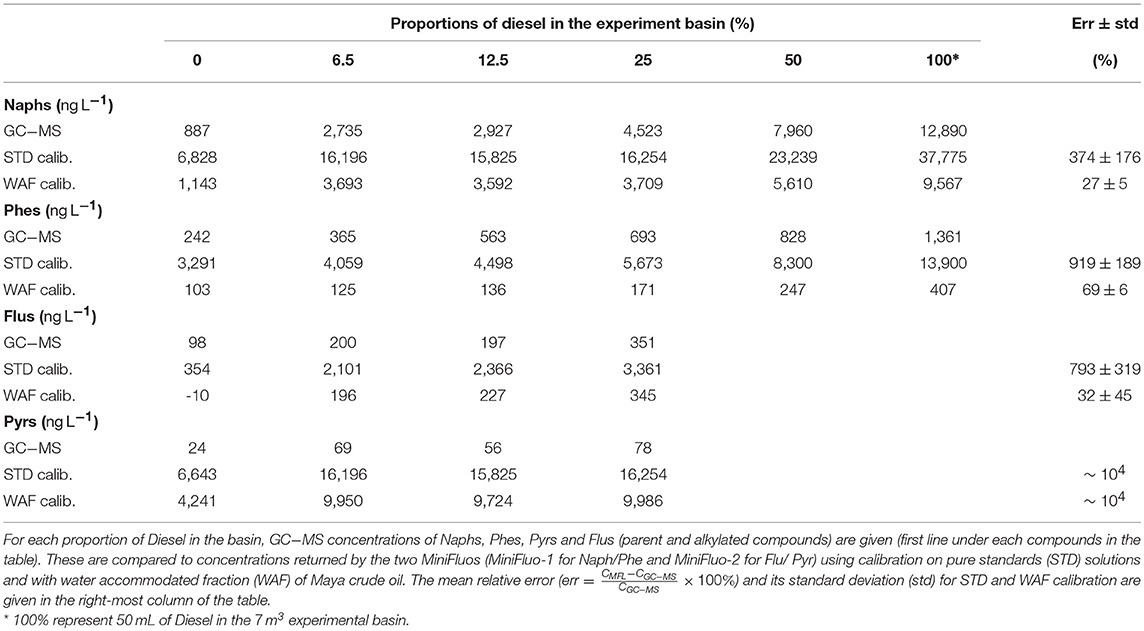
Table 3. Performances of the MiniFluo in the polludrome experimental basin.
Results derived from the MiniFluos using STD calibration overestimate the concentrations determined by GC−MS by a factor 3–15. This is expected because, as mentioned above, crude oil / fuel contains alkylated PAHs that fluoresce in the same spectral domain than their parent compound. The calibration using Maya-based WAF however gives results that are in relatively good accordance with GC−MS measurements. Naphs and Flus concentrations are very close to those measured by GC−MS (by a factor 0.98 to 1.15), while Phes were slightly underestimated (factor 2–4). One assumption to explain this difference may be the different proportions of the parent and alkylated compounds between the Maya WAF used for calibration and the WAF (Total Diesel) from the experimental basin (Table 2).
While calibration with laboratory-prepared standard solutions is highly reproducible and appeared necessary for characterizing the sensor in terms of detection limit, performance compared to other sensors and aging, it appears that the calibration using WAF is a better approach to quantify petroleum products in seawater. Whenever possible, using the oil expected to be found on the exploitation field for sensor calibration will result in an even more accurate results. While WAF calibration captures the bulk part of the signal, it is shown in the next section that, when available, a third calibration using in situ GC−MS measurements may further refine the MiniFluo measurements.
3.4. Coastal Application in Marseille Metropolitan Area
The MiniFluo was tested in natural environment in Saumaty Harbor, Marseille Metropolitan area (see section 2.3). For this campaign, the glider was only equipped with MiniFluo-1 (Naph/Phe). Concentrations measured by the MiniFluo using laboratory WAF calibration are reported in Table 4 and in Figure 6 for Naph-like (top) and Phe-like (bottom). Results show a rapid increase of fluorescence as the glider advance toward the head of the harbor. Naphs and Phes concentrations determined by GC−MS are reported in the figure panels as star symbols. Using the laboratory WAF calibration, the MiniFluo overestimates Naph-like concentration by a factor 8 on average (~700% error) and Phe-like concentration by a factor 10 (~900% error) on average over the water samples (the maximum over-estimation over a single measurement is a factor 18). These are reported in the last line of Table 4 (note that for Phes, the two lowest concentrations near instrumental noise at S01 and S02 are ignored, see Table's footnote). While the MiniFluo was able to measure PAH concentrations very close to GC−MS concentrations during the polludrome experiment, an overestimation here is likely due to the fact that the waters in this urbanized area is a mixture of several organic pollutants or biological by-products (e.g., Tryptophan or Chl-a) that may fluoresce at wavelengths close to the targeted compounds. Other explanations includes the fact that we calibrated on a Maya crude oil WAF that have alkylated proportions not representative of those found in Saumaty (Table 2), or the presence of higher blank noise (background fluorescence levels) compared to the laboratory seawater used (SSW).
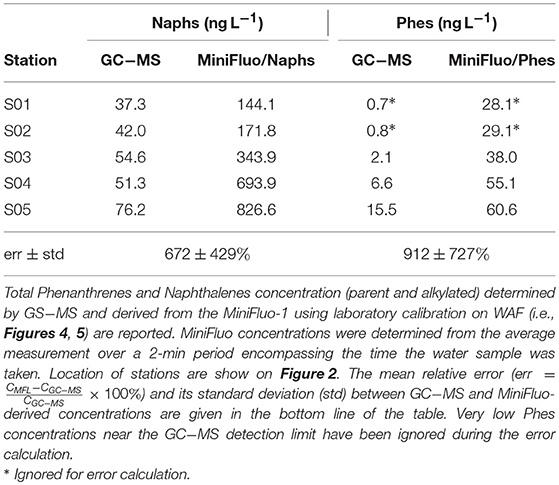
Table 4. Comparison between MiniFluo and GS−MS measurements during the Saumaty glider mission.
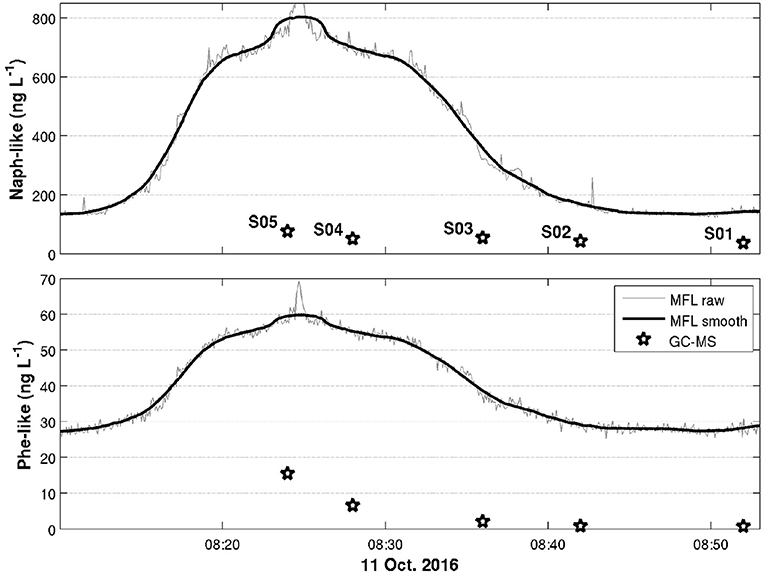
Figure 6. Phenanthrenes (Top) and Naphthalenes (Bottom) concentration in Saumaty harbor. The thin gray line represent the full measurements from the the MiniFluo using laboratory WAF calibration. The thick black line is the smoothed timeseries using a 1-min running mean algorithm. Black stars are concentrations measured by GC−MS from collected water samples along the track.
It is also possible to further improve the performances of the MiniFluo by performing site-specific (e.g., in situ) calibration. This type of in situ calibration is similar to what is routinely done on Chl-a or dissolved oxygen measurements during hydrographic surveys. Figure 7 illustrates such calibration. Here panels a and c show the concentrations measured by the MiniFluo using SF and B calculated as the linear regression between the MiniFluo fluorescence and PAHs concentration determined by GC−MS at the 5 water collection stations (see panels b and d for the calibration curves). This figure illustrates how, with a certain number of discrete validation points, PAH concentrations can be adjusted for the entire timeseries to better represent the actual concentrations.
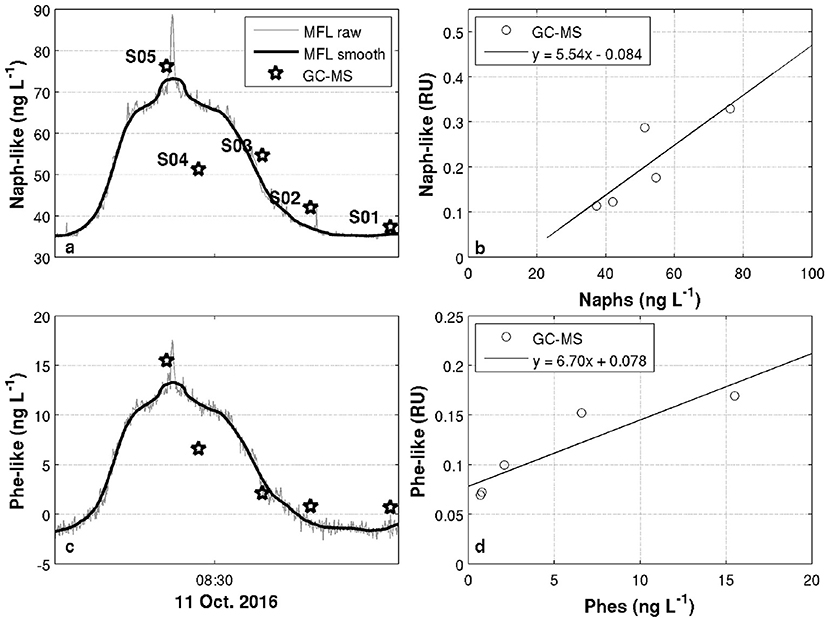
Figure 7. Left column is similar to Figure 6, but using in situ calibration instead of laboratory calibration. The in situ calibration (right column) was calculated from the linear fit (solid line) between GC−MS data the mean relative-unit fluorescence returned by the MiniFluo over a 2-min period encompassing the water sample collection (black circles).
While the latter calibration method is always preferable, this extra step requires important means, such as the possibility of collecting sufficient water samples followed by PAH extraction and GC−MS analyzes. Such in situ calibration method should be considered, for example, when systematic monitoring surveys of the same region are required. When not possible, a WAF laboratory calibration seems sufficient to give an order of magnitude precision on the PAHs concentration (e.g., here an overestimation by a factor 8 and 10, respectively, for Naph-like and Phe-like), a precision sufficient to detect the presence of a major oil spill incident.
3.5. Offshore Application in the North Sea
As part of an offshore application scenario, the glider SEA003 equipped with MiniFluo-1 was deployed for 15 days in the North Sea in November-December 2016 (see section 2.3). Naph-like and Phe-like concentrations presented in this section are derived using laboratory WAF calibrations only (i.e., Figures 4, 5). This is because while water samples were collected at deployment site (one station, 4 depths between 0-40 m), the concentration range encountered was relatively narrow and did not allow in situ calibrations of the MiniFluo channels. For this single station, Table 5 however shows that PAH concentrations measured by the MiniFluo agree with the concentrations derived by GC−MS within 22% on average for Naphs and 873% (about factor 10) for Phes. In accordance with previous experiments (Polludrome and Saumaty), it is thus relatively conservative to expect that the concentrations measured here by the MiniFluo are within one order of magnitude to the true concentrations on average. Surface concentration of Naph-like and Phe-like concentrations averaged over the top 10 m of the water column are shown in Figure 8. Highest concentrations are found along the first transect line across the channel, east/southeast of T3 (approximately 20 November). This higher concentration patch has disappeared during the return transect. Another relatively high concentration patch was also detected at the northern edge of the channel (between 21–22 November). This location is near Fensfjorden entrance, a region with heavy marine traffic due to a large oil refinery and industrial area located at Mongstad. At the very end of the mission, while waiting for recovery at proximity of T1 waypoint, the MiniFluo also captured higher than average concentrations for a period of about 24 h (visible on the map only for Naph-like channel).
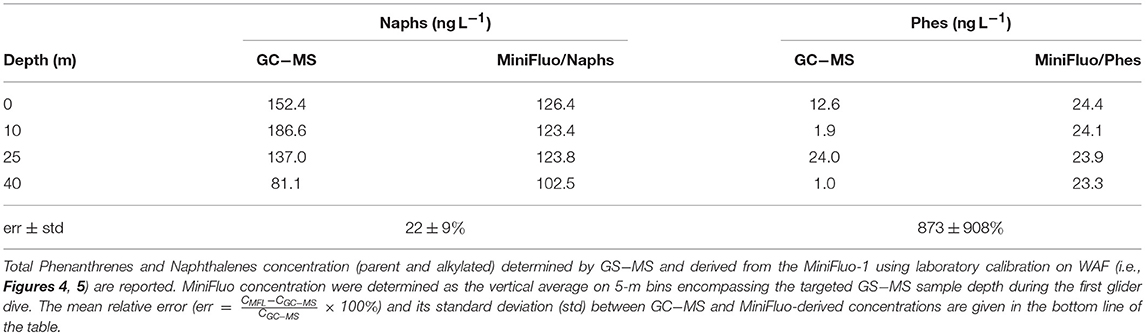
Table 5. Comparison between MiniFluo and GS−MS measurements during the North Sea glider mission.
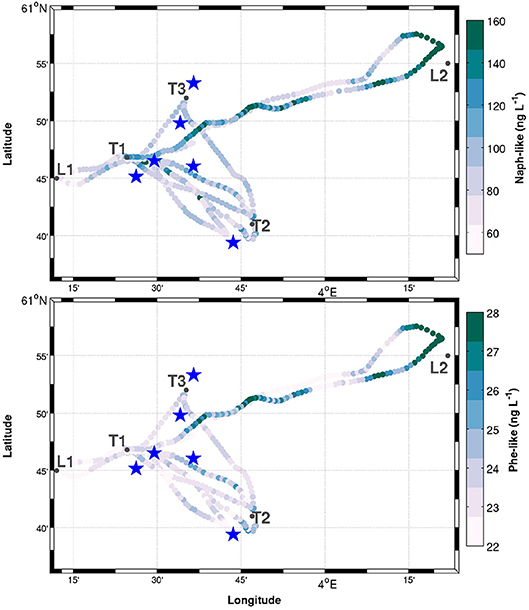
Figure 8. Surface concentration of Naphs (upper) and Phes (lower) as measured with the MiniFluo along the glider track (averaged over the 0–10 m depth range). Offshore installations are highlighted with stars (see Figure 3 for legend).
Figure 8 suggests a relative spatio-temporal heterogeneity of this region. This is not surprising given the tidal dynamics and the winter winds at play during the survey. However, the coherence in successive glider profiles with the MiniFluo, shows the ability of the sensor to detect hydrocarbon patches. The maximum surface concentration encountered during the mission is about 200 ng L−1 for Naphs (Phes concentrations only reached about 30 ng L−1). This is more than a factor 10 below the maximum admissible concentration of individual PAHs (2, 400 ng L−1) set by the European Water Framework Directive (reported from Nasher et al., 2013).
Similar concentration levels are found deeper in the water column. Here only the first across-channel transect (projected along the L1-L2 line) is presented as it is the one with the most interesting features of this mission (Figure 9). As observed in Figure 8, patches of higher PAH concentrations (Phe-like and Naph-like) are found. This is specially clear in Phe-like (Figure 9F) in the top ~100 m of the water column and roughly between 20–40 and 50–70 km. Interestingly, Phe-like signal is often contrasted with Chl-a signal, the former being maximum where the latter is minimum (specially clear in the 20–40 km range). Except very close to the surface, the Naph-like signal (Figure 9E) is different from Phe-like signal (note that some data near 30, 50, and 60 km were manually removed due to measurement problems). While Phe-like patterns are reproduced in Naph-like signal, the latter seems to also reproduce some of the Chl-a patterns (panel E exhibits features of both D and F). It is likely that the Naph-like channel also captures Tryptophan-like fluorescence that is associated with biological activities, and thus Chl-a. This is because Naphthalene λEx/λEm fluorescence couple is similar to the one of Tryptophan (Tedetti et al., 2010; Cyr et al., 2017).
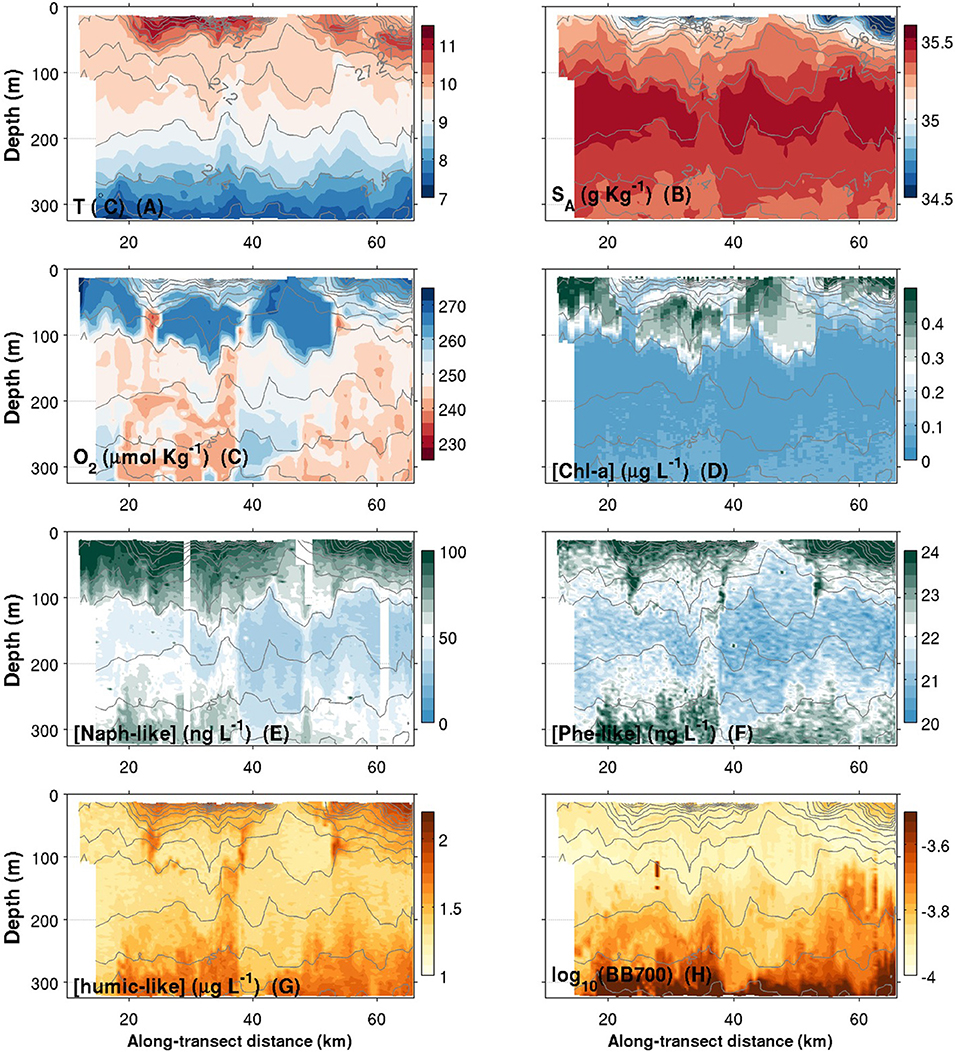
Figure 9. Contours plots of various variables measured by the glider in function of depth and along-transect distance along the line L1-L2 (see map Figure 3). (A) Conservative temperature; (B) Absolute salinity; (C) Dissolved oxygen concentration; (D) Chlorophyll-a concentration; (E) Naphthalene-like concentration; (F) Phenanthrene-like concentration; (G) Humic-like concentration; (H) Turbidity measured as the backscattering signal at 700 nm. Isopycnals are plotted in each panel with thin solid light gray lines (values identified in A,B).
Also worth noting is the relatively high Phe-like signal near the seafloor. This signal seems to reach surface concentration signal in plume-like patterns. These patterns are also reproduced in the humic-like fluorophore (higher concentration, Figure 9G), in the O2 (lower concentrations, Figure 9C), and, to a lesser extent, in the Naph-like and Backscattering measurements (Figures 9E,H, respectively). These signatures may suggest hydrocarbon emanations from the seafloor entraining low oxygen concentration waters, or the sinking of organic matter containing hydrocarbon in degradation. These signatures also seem associated with a surface frontal zone located between 40 and 50 km (see isopycnals outcropping at the surface).
While analyzing in details the results of these campaign is outside the scope of this study, these results are one of the earliest demonstration of the large-scale interactions between hydrocarbon concentrations and physical-biochemical properties in an oceanic basin. Overall, this campaign successfully demonstrates that it is possible to use the glider-MiniFluo package as a powerful tool to monitor hydrocarbon concentrations in seawater. Such usage may include, the detection of natural seeps from the seafloor, the monitoring of a region for baseline studies or to monitor long-term effects, or the tracking of a spill in case of industrial accident.
4. Conclusion
This study summarizes the development of a glider-compatible fluorometer capable of detecting PAHs in the marine environment. Results suggest that a calibration of the MiniFluo on WAF is preferable over STD because the alkylated compounds often represent the largest part of a PAH family. It is thus important to consider not only the parent (such as a calibration on pure standard), but also the alkylated compounds when deriving concentration of a certain PAH in the marine environment. Results also show that when using such WAF calibration, it is relatively conservative to expect the concentrations derived from the MiniFluo and those determined by GC−MS to agree within one order of magnitude on average (e.g., overestimation by a factor 7 on average over the two in situ campaigns presented in this study). Because the relative proportion of the parent and alkylated compounds of a PAH family slightly differ from one type of hydrocarbon to the other, a calibration on a WAF with proportions close to the one in the targeted environment will give best results. In this sense, a calibration with different types of WAFs (i.e., different proportions of parent/alkylated hydrocarbons), but also on WAFs having undergone weathering/degradation processes, in order to better reflect the PAHs proportions found in the marine environment seems relevant for future improvement. This is because dissolved PAHs in the aquatic media are subjected to various transformation processes including, for example, biodegradation and photodegradation. These processes do not affect parent and alkylated compounds equally (Dachs et al., 1997; Diez et al., 2005), and thus likely lead to modifications of their relative abundances with time (in addition of possible spatial and seasonal effects). A series of laboratory controlled experiments dealing with the biodegradation and/or photodegradation of WAFs prior to their use for MiniFluo calibrations would thus be an interesting further improvement of the calibration procedure. As suggested earlier, however, a site-specific in situ calibration similar to what is performed with other biogeochemical sensors (e.g., dissolved O2 or Chl-a), although more demanding in terms of logistics, is likely to give the best results. If performed during the glider mission, such calibration would also solve a large part of these biodegradation/photodegradation problems by providing an up-to-date response of the sensor in the natural environment. Overall, this study suggests new possibilities for research on industrial marine accidents, while offering new tools to the industry to monitor PAHs in seawater.
Data Availability
The datasets generated for this study are available on request to the corresponding author.
Author Contributions
MG and MT initiated the development of the MiniFluo and its inclusion on the SeaExplorer glider, while FB is the R&D engineer in charge of the MiniFluo development at ALSEAMAR. MG led the laboratory calibration work and the polludrome experiment during which NB was responsible of the glider measurements. FC led the field work studies, including the data processing, and the writing of the manuscript. All authors contributed to the writing and the discussion around the manuscript.
Funding
This study is a contribution to the European project NeXOS - Next generation Low-Cost Multifunctional Web Enabled Ocean Sensor Systems Empowering Marine, Maritime and Fisheries Management, is funded by the European Commission's 7th Framework Programme - Grant Agreement N°614102.
Conflict of Interest Statement
The authors declare that the affiliation of FB, the manufacturer of the MiniFluo and the glider SeaExplorer, do not preclude to the scientific independence of this scientific work.
The remaining authors declare that the research was conducted in the absence of any commercial or financial relationships that could be construed as a potential conflict of interest.
Acknowledgments
The authors would like to thank L. Beguery and ALSEAMAR, the SAM at MIO, J. Receveur and R. Jezequel at CEDRE, Statoil, Captains and crew of the R/V Antedon II and the Havila Troll, K. Kvalsund and N. Roar Hareide from the Runde Environmental Centre and personnel who participated to the development of the sensor: M. Abaker, C. Bachet, C. Guigue, C. Germain, P. Joffre and G. Wassouf. MG thanks IFREMER for hosting her during the writing. Two reviewers are greatly acknowledged for their comments.
References
Adhikari, P. L., Maiti, K., and Overton, E. B. (2015). Vertical fluxes of polycyclic aromatic hydrocarbons in the northern Gulf of Mexico. Mar. Chem. 168, 60–68. doi: 10.1016/j.marchem.2014.11.001
Berrojalbiz, N., Dachs, J., Ojeda, M. J., Valle, M. C., Castro-Jiménez, J., Wollgast, J., et al. (2011). Biogeochemical and physical controls on concentrations of polycyclic aromatic hydrocarbons in water and plankton of the Mediterranean and Black Seas. Glob. Biogeochem. Cycles 25, 1–14. doi: 10.1029/2010GB003775
Camilli, R., Reddy, C. M., Yoerger, D. R., Van Mooy, B. A., Jakuba, M. V., Kinsey, J. C., et al. (2010). Tracking hydrocarbon plume transport and biodegradation at Deepwater Horizon. Science 330, 201–204. doi: 10.1126/science.1195223
Conmy, R., Del Castillo, C., Downing, B., and Chen, R. (2014a). “Experimental design and quality assurance: in-situ fluorescence instrumentation,” in Aquatic Organic Matter Fluorescence, eds P. Coble, J. Lead, A. Baker, D. Reynolds, and R. Spencer (New York, NY: Cambridge University Press), 190–230.
Conmy, R. N., Coble, P. G., Farr, J., Wood, A. M., Lee, K., Pegau, W. S., et al. (2014b). Submersible optical sensors exposed to chemically dispersed crude oil: Wave tank simulations for improved oil spill monitoring. Environ. Sci. Technol. 48, 1803–1810. doi: 10.1021/es404206y
Cyr, F., Tedetti, M., Besson, F., Beguery, L., Doglioli, A. M., Petrenko, A. A., et al. (2017). A new glider-compatible optical sensor for dissolved organic matter measurements : test case from the NW Mediterranean Sea. Front. Mar. Sci. 4:89. doi: 10.3389/fmars.2017.00089
Dachs, J., Bayona, J. M., Raoux, C., and Albaigés, J. (1997). Spatial, vertical distribution and budget of polycyclic aromatic hydrocarbons in the Western mediterranean seawater. Environ. Sci. Technol. 31, 682–688. doi: 10.1021/es960233j
Davis, R., Eriksen, C., and Jones, C. (2003). “Autonomous buoyancy-driven underwater gliders,” in Technology and Applications of Autonomous Underwater Vehicles, Chapter 3, ed G. Griffiths (London: Taylor and Francis), 37–58.
Díez, S., Sabaté, J., Viñas, M., Bayona, J. M., Solanas, A. M., and Albaigés, J. (2005). The Prestige oil spill. I. Biodegradation of a heavy fuel oil under simulated conditions. Environ. Toxicol. Chem. 24, 2203–2217. doi: 10.1897/04-604R.1
Ferretto, N., Tedetti, M., Guigue, C., Mounier, S., Redon, R., and Goutx, M. (2014). Identification and quantification of known polycyclic aromatic hydrocarbons and pesticides in complex mixtures using fluorescence excitation-emission matrices and parallel factor analysis. Chemosphere 107, 344–353. doi: 10.1016/j.chemosphere.2013.12.087
Fourati, R., Tedetti, M., Guigue, C., Goutx, M., Garcia, N., Zaghden, H., et al. (2018). Sources and spatial distribution of dissolved aliphatic and polycyclic aromatic hydrocarbons in surface coastal waters of the Gulf of Gabès (Tunisia, Southern Mediterranean Sea). Prog. Oceanogr. 163, 232–247. doi: 10.1016/j.pocean.2017.02.001
González, J. J., Viñas, L., Franco, M. A., Fumega, J., Soriano, J. A., Grueiro, G., et al. (2006). Spatial and temporal distribution of dissolved/dispersed aromatic hydrocarbons in seawater in the area affected by the Prestige oil spill. Mar. Pollut. Bull. 53, 250–259. doi: 10.1016/j.marpolbul.2005.09.039
González-Gaya, B., Morales, L., Méjanelle, L., Abad, E., Piña, B., Duarte, C. M., et al. (2016). High atmosphere - ocean exchange of semivolatile aromatic hydrocarbons. Nat. Geosci. 9, 438–442. doi: 10.1038/ngeo2714
Guigue, C., Tedetti, M., Ferretto, N., Garcia, N., Méjanelle, L., and Goutx, M. (2014). Spatial and seasonal variabilities of dissolved hydrocarbons in surface waters from the Northwestern Mediterranean Sea: Results from one year intensive sampling. Sci. Total Environ. 466–467, 650–662. doi: 10.1016/j.scitotenv.2013.07.082
Guigue, C., Tedetti, M., Giorgi, S., and Goutx, M. (2011). Occurrence and distribution of hydrocarbons in the surface microlayer and subsurface water from the urban coastal marine area off Marseilles, Northwestern Mediterranean Sea. Mar. Pollut. Bull. 62, 2741–2752. doi: 10.1016/j.marpolbul.2011.09.013
Guitart, C., García-Flor, N., Bayona, J. M., and Albaigés, J. (2007). Occurrence and fate of polycyclic aromatic hydrocarbons in the coastal surface microlayer. Mar. Pollut. Bull. 54, 186–194. doi: 10.1016/j.marpolbul.2006.10.008
Hylland, K. (2006). Polycyclic aromatic hydrocarbon (PAH) ecotoxicology in marine ecosystems. J. Toxicol. Environ. Health A 69, 109–123. doi: 10.1080/15287390500259327
Kennish, M. J. (1991). Ecology of Estuaries: Anthropogenic Effects, Vol. 1. Boca Raton, FL: CRC Press.
McDougall, T. J., and Barker, P. M. (2011). Getting Started With TEOS-10 and the Gibbs Seawater (GSW) Oceanographic Toolbox. Number May. SCOR/IAPSO WG127.
Nasher, E., Heng, L. Y., Zakaria, Z., and Surif, S. (2013). Concentrations and sources of polycyclic aromatic hydrocarbons in the seawater around Langkawi Island, Malaysia. J. Chem. 2013:975781. doi: 10.1155/2013/975781
Qiu, Y. W., Zhang, G., Liu, G. Q., Guo, L. L., Li, X. D., and Wai, O. (2009). Polycyclic aromatic hydrocarbons (PAHs) in the water column and sediment core of Deep Bay, South China. Estuar. Coast. Shelf Sci. 83, 60–66. doi: 10.1016/j.ecss.2009.03.018
Reddy, C. M., and Quinn, J. G. (2001). The North Cape oil spill: hydrocarbons in Rhode Island coastal waters and Point Judith Pond. Mar. Environ. Res. 52, 445–461. doi: 10.1016/S0141-1136(01)00100-3
Roose, P., and Brinkman, U. A. (2005). Monitoring organic microcontaminants in the marine environment: principles, programmes and progress. Trends Anal. Chem. 24, 897–926. doi: 10.1016/j.trac.2005.10.007
Rudnick, D. L., and Cole, S. T. (2011). On sampling the ocean using underwater gliders. J. Geophys. Res. Oceans 116, 1–12. doi: 10.1029/2010JC006849
Rudnick, D. L., Davis, R. E., Eriksen, C. C., Fratantoni, D. M., and Perry, M. J. (2004). Underwater gliders for ocean research. Mar. Technol. Soc. J. 38, 73–84. doi: 10.4031/002533204787522703
Stortini, A. M., Martellini, T., Del Bubba, M., Lepri, L., Capodaglio, G., and Cincinelli, A. (2009). n-Alkanes, PAHs and surfactants in the sea surface microlayer and sea water samples of the Gerlache Inlet sea (Antarctica). Microchem. J. 92, 37–43. doi: 10.1016/j.microc.2008.11.005
Tedetti, M., Guigue, C., and Goutx, M. (2010). Utilization of a submersible UV fluorometer for monitoring anthropogenic inputs in the Mediterranean coastal waters. Mar. Pollut. Bull. 60, 350–362. doi: 10.1016/j.marpolbul.2009.10.018
Tedetti, M., Joffre, P., and Goutx, M. (2013). Development of a field-portable fluorometer based on deep ultraviolet LEDs for the detection of phenanthrene- and tryptophan-like compounds in natural waters. Sens. Actuat. B Chem. 182, 416–423. doi: 10.1016/j.snb.2013.03.052
Tedetti, M., Longhitano, B. R., Garcia, A. N., Guigue, A. C., Ferretto, N., and Goutx, M. (2012). Fluorescence properties of dissolved organic matter in coastal Mediterranean waters influenced by a municipal sewage effluent (Bay of Marseilles, France). Environ. Chem. 9, 438–449. doi: 10.1071/EN12081
Testor, P., Meyers, G., Pattiaratchi, C., Bachmeyer, R., Hayes, D., Pouliquen, S., et al. (2010). “Gliders as a component of future observing systems,” in Proceedings of OceanObs'09: Sustained Ocean Observations and Information for Society, Vol. 1, eds J. Hall, D. E. Harrison, and D. Stammer (Venice: ESA Publication WPP-306), 961–978.
Troupin, C., Beltran, J. P., Heslop, E., Torner, M., Garau, B., Allen, J., et al. (2015). A toolbox for glider data processing and management. Methods Oceanogr. 13–14, 13–23. doi: 10.1016/j.mio.2016.01.001
Valavanidis, A., Vlachogianni, T., Triantafillaki, S., Dassenakis, M., Androutsos, F., and Scoullos, M. (2008). Polycyclic aromatic hydrocarbons in surface seawater and in indigenous mussels (Mytilus galloprovincialis) from coastal areas of the Saronikos Gulf (Greece). Estuar. Coast. Shelf Sci. 79, 733–739. doi: 10.1016/j.ecss.2008.06.018
Valeur, B., and Berberan-Santos, M. N. (2012). Molecular Fluorescence: Principles and Applications. Weinheim: Wiley-VCH.
Witt, G., and Matthäus, W. (2001). The impact of salt water inflows on the distribution of polycyclic aromatic hydrocarbons in the deep water of the Baltic Sea. Mar. Chem. 74, 279–301. doi: 10.1016/S0304-4203(01)00020-2
Zhou, J. L., Hong, H., Zhang, Z., Maskaoui, K., and Chen, W. (2000). Multi-phase distribution of organic micropollutants in Xiamen Harbour, China. Water Res. 34, 2132–2150. doi: 10.1016/S0043-1354(99)00360-7
Zhou, J. L., and Maskaoui, K. (2003). Distribution of polycyclic aromatic hydrocarbons in water and surface sediments from Daya Bay, China. Environ. Pollut. (Barking, Essex : 1987) 121, 269–281. doi: 10.1016/S0269-7491(02)00215-4
Zhou, Z., Liu, Z., and Guo, L. (2013). Chemical evolution of Macondo crude oil during laboratory degradation as characterized by fluorescence EEMs and hydrocarbon composition. Mar. Pollut. Bull. 66, 164–175. doi: 10.1016/j.marpolbul.2012.09.028
Keywords: MiniFluo-UV, glider, SeaExplorer, fluorescence, hydrocarbons, PAH, oil spills, marine environment monitoring
Citation: Cyr F, Tedetti M, Besson F, Bhairy N and Goutx M (2019) A Glider-Compatible Optical Sensor for the Detection of Polycyclic Aromatic Hydrocarbons in the Marine Environment. Front. Mar. Sci. 6:110. doi: 10.3389/fmars.2019.00110
Received: 15 October 2018; Accepted: 21 February 2019;
Published: 18 March 2019.
Edited by:
Ketil Hylland, University of Oslo, NorwayReviewed by:
Antonio Olita, Italian National Research Council (CNR), ItalyLaura Guimarães, Universidade do Porto, Portugal
Copyright © 2019 Cyr, Tedetti, Besson, Bhairy and Goutx. This is an open-access article distributed under the terms of the Creative Commons Attribution License (CC BY). The use, distribution or reproduction in other forums is permitted, provided the original author(s) and the copyright owner(s) are credited and that the original publication in this journal is cited, in accordance with accepted academic practice. No use, distribution or reproduction is permitted which does not comply with these terms.
*Correspondence: Frédéric Cyr, RnJlZGVyaWMuQ3lyQGRmby1tcG8uZ2MuY2E=