 Chris T. Perry
 Michael A. Salter
 Kyle M. Morgan2
 Alastair R. Harborne
- 1Department of Geography, College of Life and Environmental Sciences, University of Exeter, Exeter, United Kingdom
- 2Asian School of the Environment, Nanyang Technological University, Singapore, Singapore
- 3Department of Biological Sciences, Florida International University, North Miami, FL, United States
Tropical shelf, platform and reef-lagoon systems are dominated by calcium carbonate (CaCO3) sediments. However, data on habitat-specific CaCO3 sediment production rates by different sediment producing taxa are sparse, limiting understanding of where and in what form CaCO3 sediment is produced, and how overall sediment budgets are influenced by habitat type and scale. Using novel census methodologies, based primarily on measures of plant biovolumes and carbonate content, we assessed habitat-scale production by two ubiquitous biogenic CaCO3 sediment producers, calcareous green algae and seagrass epiphytes, across southern Eleuthera Bank, Bahamas (area ∼140 km2). Data from species-specific plant disaggregation experiments and from X-ray diffraction (XRD) analysis of calcified plants also allowed us to resolve questions about the size fractions and mineralogies of the carbonates produced. Production rates varied significantly among habitats (range: 1.8–237.3 g CaCO3 m−2 yr−1), collectively totaling ∼0.98 M kg annually across the study area. Outputs comprise similar amounts of aragonite and high Mg-calcite, with ∼54% of the CaCO3 produced being contributed as mud-grade (<63 μm) sediment. Our analysis also reveals that habitat type and extent – especially of medium and high density seagrass beds - strongly influence the amounts and types of carbonate sediment generated. Dense seagrass beds were identified as the dominant per unit area production sites, contributing ∼17% of total CaCO3 despite covering only 0.5% of the study area. These findings have direct relevance for quantifying present-day sediment budgets and for predicting changes in sediment generation at the system scale in responses to modified habitat extent and productivity.
Introduction
Calcium carbonate (CaCO3) dominated tropical and sub-tropical coral reef, lagoon, and shallow shelf and platform systems cover an area estimated at > 11 M km2 (Milliman and Droxler, 1996; Green et al., 2000). These environments are not only focal points of marine CaCO3 accumulation, but they also provide sediments to sustain tropical shorelines and islands (Perry et al., 2015) and export material to adjacent deeper-water deposits (Berelson et al., 2007). In both shallow and deep-water settings significant CaCO3 dissolution also occurs (Walters et al., 1993; Brock et al., 2006; Berelson et al., 2007; Eyre et al., 2018), and thus the production, accumulation and cycling of shallow marine CaCO3 sediment is a critical element of the marine inorganic carbon cycle. A defining characteristic of these shallow carbonate systems is that a high proportion of the accumulating sediment derives from in situ biogenic sources. Direct contributions can derive post-mortem from fauna such as molluscs and foraminifera (Bosence, 1989), and from flora such as the calcareous green algae, which disaggregate to release carbonate after death (Lowenstam, 1955). Many seagrass species also contribute CaCO3 to the sediment reservoir from the post-mortem release of calcareous epiphytes that colonize the seagrass blades (Corlett and Jones, 2007) and potentially from directly facilitated carbonate secretions (Enriquez and Schubert, 2014). Significant quantities of sediment can also be generated indirectly by the grazing activities of species of parrotfish and urchins, which excrete carbonate particles after ingestion (Bellwood, 1996), and recent work has shown that all bony marine fish (teleosts) excrete fine grained carbonates with a diverse range of morphologies and mineralogies (Perry et al., 2011; Salter et al., 2012, 2018). In addition, several locally important, non-skeletally-derived, sources of fine-grained carbonate have been identified. These include the generation of carbonate mud via “whiting” events (Robbins et al., 1997), and the precipitation of carbonate within oolitic sands (Newell et al., 1960). Complex cycles of carbonate precipitation and dissolution may also occur within permeable reef and platform sediments (Eyre et al., 2018) and may thus also influence net carbonate production rates (Brock et al., 2006).
Whilst very high localized rates of gross CaCO3 sediment production have been reported from some sources (e.g., up to 1.4 kg CaCO3 m−2 yr−1 for Halimeda and 2.8 kg CaCO3 m−2 yr−1 for seagrass epiphytes; Patriquin, 1972; Payri, 1988), such rates - being a function of species abundance and productivity – are inherently highly variable. Thus habitat heterogeneity and associated variations in plant/species density and productivity will exert a major influence on the rates and types (and consequently the mineralogies and size fractions) of sediment generated, such that assumptions about the predominant role of one producer over another in driving CaCO3 sediment production are too simplistic. Such variation is a non-trivial issue because the type of sediment generated influences sediment preservation and accumulation due to differential susceptibility to post-depositional taphonomic processes, dissolution and transport (Braithwaite, 1973; Walters and Morse, 1984; Perry, 1998, 2000; Ford and Kench, 2012; Eyre et al., 2018). However, whilst a number of studies have estimated sediment production rates for individual species, including foraminifera (Doo et al., 2012), calcareous green algae (Halimeda; Multer, 1988), and epiphytes on seagrass (Nelsen and Ginsburg, 1986), and which add detail to wider system scale estimates of net community-scale carbonate production based on up-scaling of mesocosm and hydrochemical studies (e.g., see Atkinson and Grigg, 1984; Brock et al., 2006; Courtney et al., 2016), there have been few attempts to use detailed in-situ census data to quantify sediment production at the habitat-scale (but see Bosence et al., 1985; Perry et al., 2017). Furthermore, and to our knowledge, there have been no attempts to date to quantify rates, grain sizes and mineralogies of CaCO3 sediment being generated in different habitats across carbonate systems. These gaps in knowledge are significant not only because environments dominated by CaCO3 sediments are spatially extensive across the tropics and sub-tropics, but also because: (i) the assumption that different habitats produce and preserve distinct sedimentary signatures represents the fundamental basis for interpreting palaeoenvironmental facies (Flugel, 2004); and (ii) an understanding of variation in production at system scales can support an applied understanding of sediment supply to proximal beaches and shorelines.
Here we report a methodology designed to underpin habitat-scale estimates of CaCO3 sediment production that resolve for sediment grain size and mineralogy. This method is based on empirical data collected for epiphytic communities of the bladed seagrass Thalassia testudinum, as well as for seven species of calcareous green algae: Halimeda incrassata, Penicillus capitatus, Penicillus dumetosus, Rhipocephalus phoenix, Udotea flabellum, Udotea cyathiformis, and Acetabularia calyculus. These species are ubiquitous across the Caribbean, with closely related species also common across most tropical and sub-tropical shallow marine carbonate systems globally. We then applied this methodology across a range of shallow-water habitats within the southern area of Eleuthera Bank, The Bahamas to determine rates of sediment production (g CaCO3 m−2 yr−1) associated with calcareous green algae and seagrass epiphytes within each habitat. For most green algal species production estimates were based on a non-destructive census method adapted from methods previously used to estimate sponge and gorgonian biovolumes (Santavy et al., 2013), and as previously tested on Halimeda species in the central Indian Ocean (Perry et al., 2016). Alongside these approaches, we used established methodologies (Nelsen and Ginsburg, 1986) to assess epiphytic carbonate production associated with the seagrass T. testudinum. The sediment size-fractions to which the different species contribute post-mortem were determined from plant (or for T. testudinum from epiphyte) disaggregation experiments following the methods used by Neumann and Land (1975) and Perry et al. (2016). X-ray diffraction (XRD) was used to quantify carbonate mineralogies produced by each species, which are described as the proportions of aragonite, high Mg-calcite (HMC; >4% mol% MgCO3) and low Mg-calcite (LMC; 0–4 mol% MgCO3). In combination with measures of CaCO3 production by each algal type or from epiphytes per habitat and measures of the extent of the habitats, the total amounts of gravel, sand and mud grade CaCO3 and the volumes of different mineralogical sediment fractions could be estimated for the various contributors.
Materials and Methods
Study Site and Habitats
Sampling and surveying were undertaken at sites across the shallow water environments within the southern section of Eleuthera Bank, Eleuthera Island, The Bahamas (24°50′ N, 76°20′ W; Figure 1). The total extent of this survey area is 140.5 km2. Eleuthera Bank, located in the lee of the island, is up to ∼8 m deep along the seaward margin that borders the deep-water Exuma Sound, but it is mostly < 3–4 m deep and influenced by strong diurnal tidal currents that reach up to 0.5 m s−1 (Dravis, 1979; Harborne et al., 2017). The platform itself comprises a range of sub-tidal and intertidal habitats, and whilst there is inevitably some gradation between habitat boundaries, the following major habitat types were delineated: mangrove fringed tidal creeks and embayments; hardgrounds sparsely colonized by green algae, sponges and corals; large expanses of patchily bioturbated sands colonized by sparse green algae and seagrass (a mix of T. testudinum and, less commonly, Syringodium filiforme); and beds of T. testudinum seagrass. Seagrass beds were further differentiated based on average blade densities: sparse (mean < 200 blades/m2); medium (mean 200–600 blades/m2), and dense (mean > 600 blades/m2). Numerous patch reefs also occur throughout the bay, but they occur as discrete build-ups surrounded by sands and/or seagrass beds and were not included in our censuses. Along the northern section of the survey area, numerous, tidally-emergent shoals of oolitic sand occur. These shoals are largely devoid of algae and seagrass and thus although they are important areas of non-biogenic CaCO3 precipitation (Newell et al., 1960), no survey work was undertaken on these. The innermost areas of Eleuthera Bank (known as Rock Sound; Figure 1) are characterized by fine-grained, heavily bioturbated sediments which are also essentially devoid of seagrass and algae, and no detailed surveys were undertaken in this area.
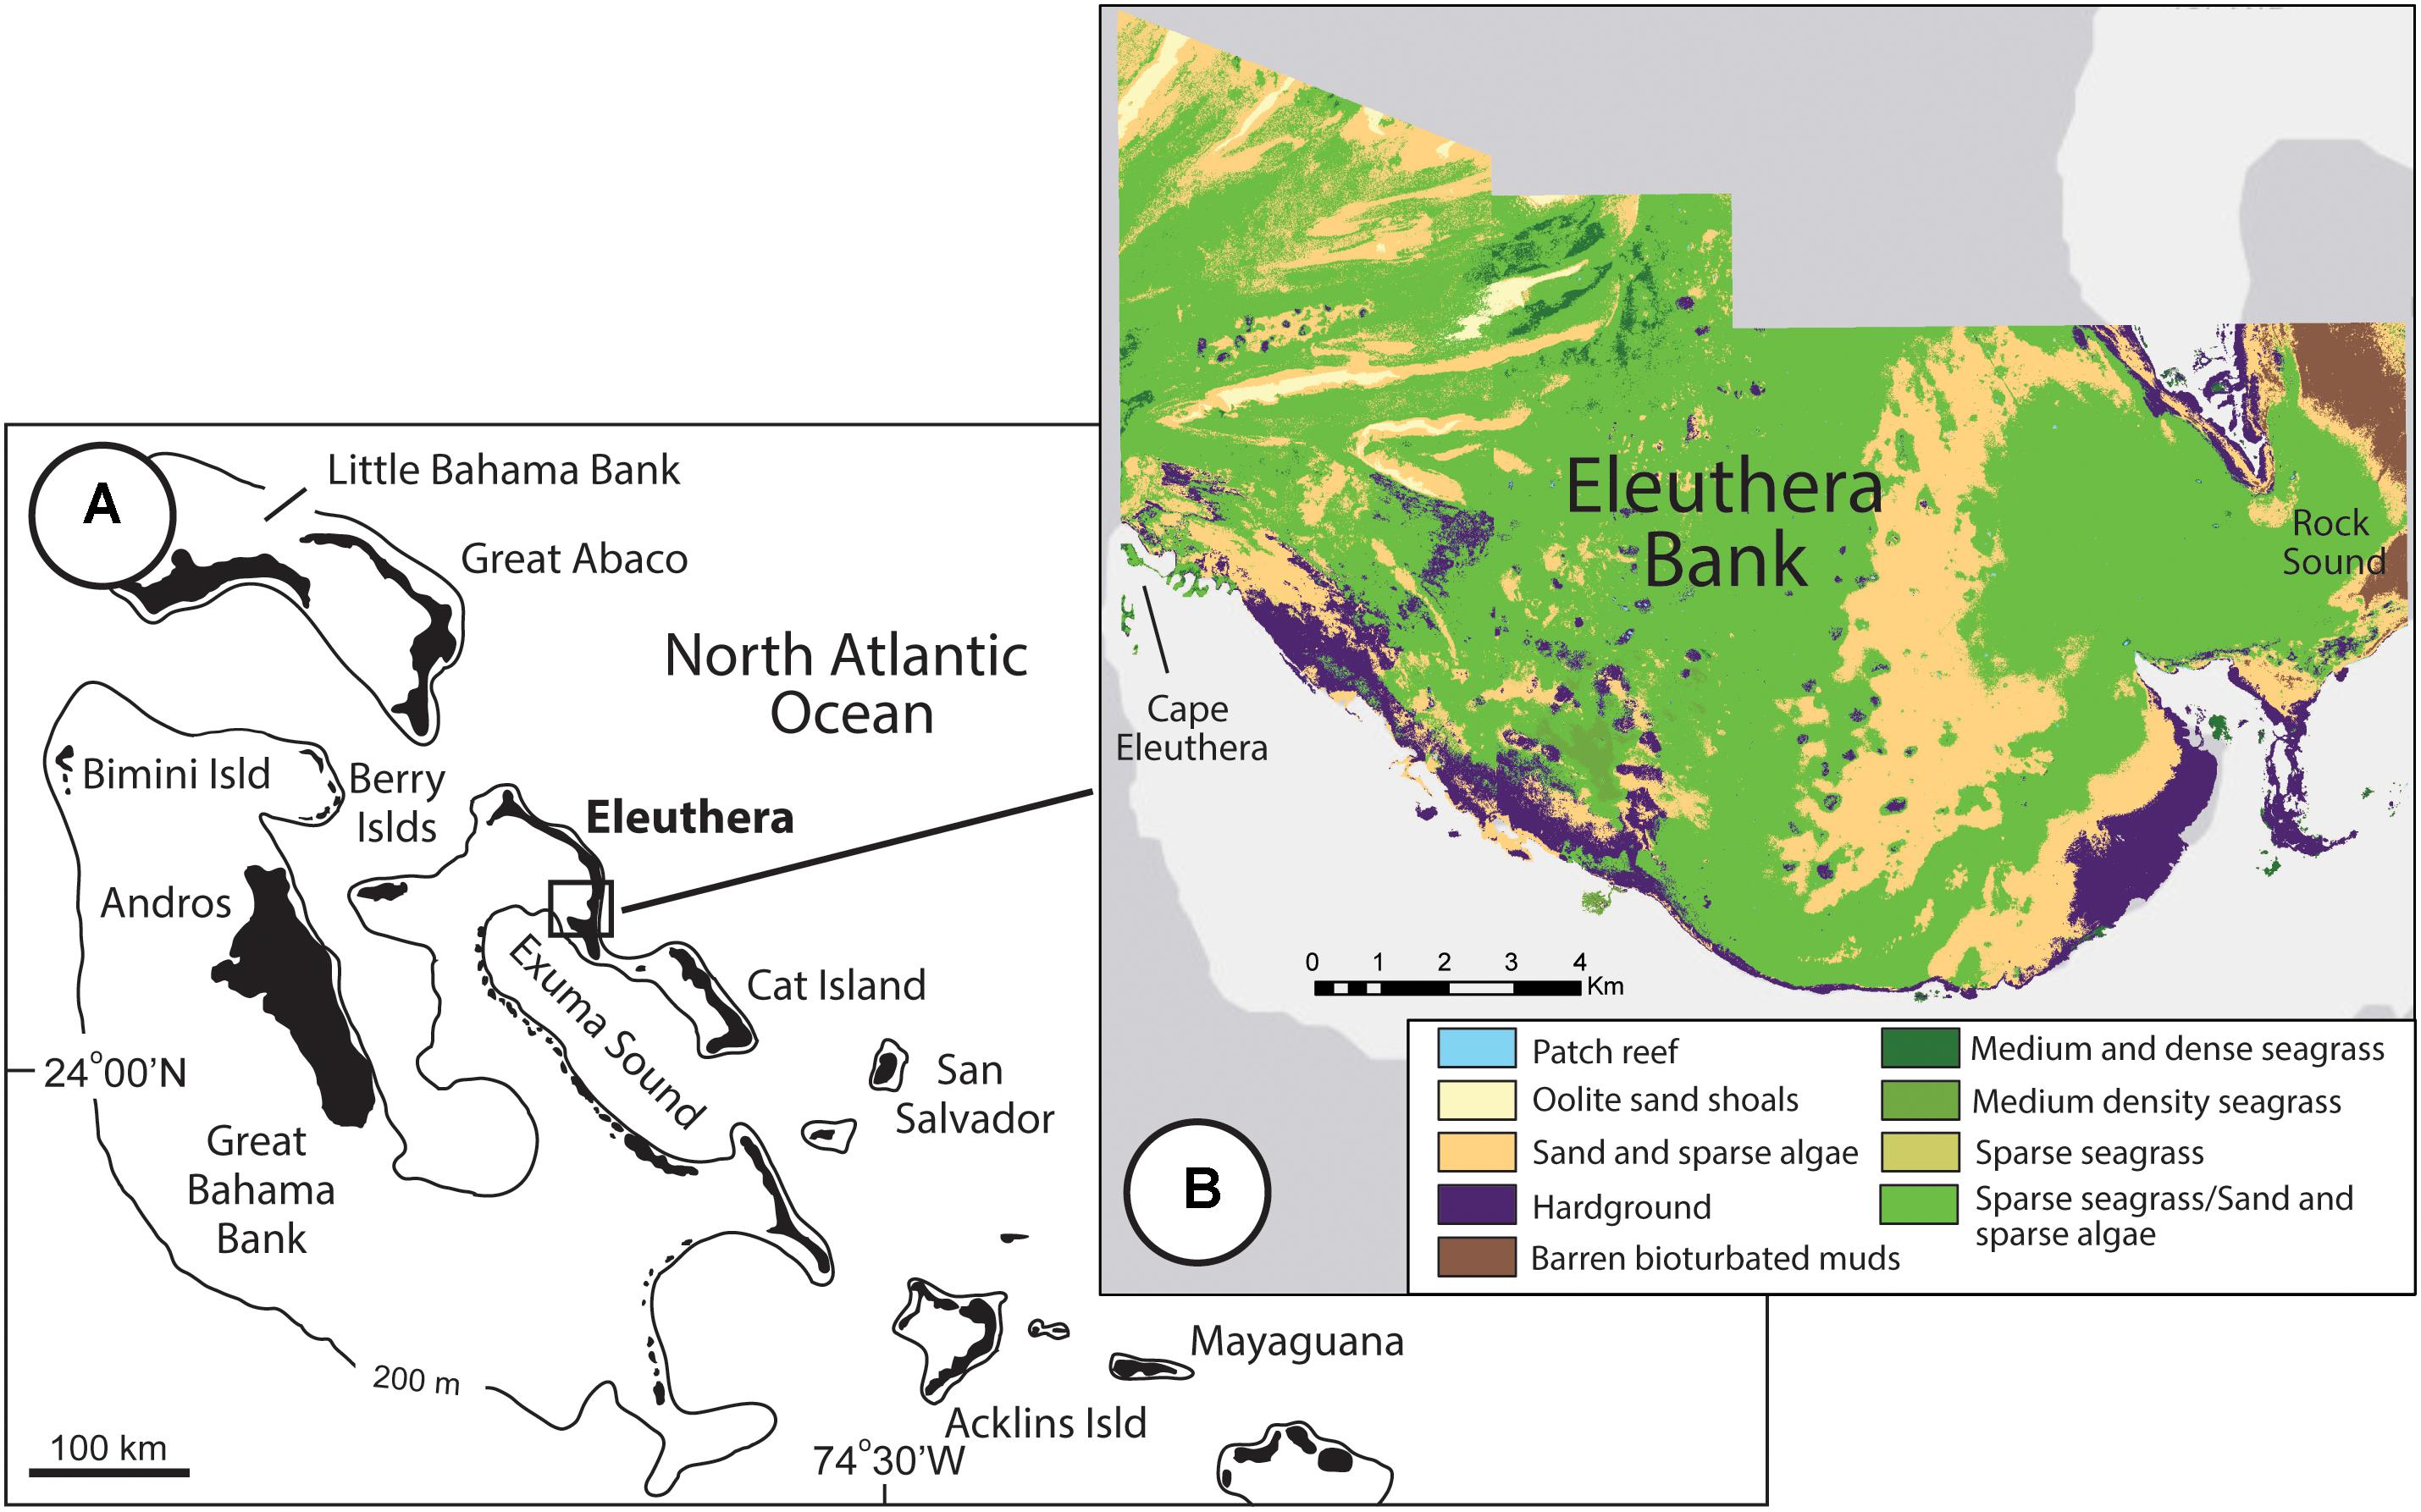
Figure 1. (A) Regional location of Eleuthera in the Bahamas (map modified after Salter et al., 2012); and (B) Map showing the distribution of habitat types across the southern area of Eleuthera Bank.
The area of each habitat was determined using a habitat map derived from QuickBird ortho-ready imagery, extensive ground-truthing, and standard remote sensing analytical techniques (Green et al., 2000). Land and deepwater areas were masked before pixels of marine habitat were assigned to habitat classes using unsupervised classification based on ground-truthing information, and any apparent errors were corrected with contextual decision rules. Some habitats (particularly ‘sands and sparse algae’ and ‘sparse seagrass beds’) could not be distinguished reliably from the imagery, despite being distinguishable in situ. Therefore, they were generally mapped as a combined habitat, but examination of ground-truthing data indicated that ∼50% of ground-truthing points in this combined habitat could be assigned to either class. Consequently, areal extents were calculated for each specific habitat type as 50% of the area of the combined habitat. Narrow inter-tidal mangrove habitats can be difficult to map accurately using spectral signals, so here they were delineated by eye from the imagery. Resultant measured areas of each of these habitats were: mangrove fringed creeks and embayments 0.07 km2; hardgrounds 11.26 km2; sands and sparse algae 78.94 km2; sparse seagrass beds 43.73 km2; medium seagrass beds 1.45 km2; dense seagrass beds 0.70 km2; patch reefs 0.12 km2; oolitic sand shoals 1.69 km2; and bioturbated muds 2.54 km2. Our resultant sediment production calculations necessarily assume that the extent of these habitats is relatively fixed over the annual timescale in question, but acknowledge that over multi-annual to decadal timescales habitat extent may vary slightly with resultant impacts on sediment production rates.
Calculating Algal and Seagrass Epiphyte CaCO3 Production
To estimate rates of carbonate production (g CaCO3 m−2 yr−1) by six of the seven calcareous green algal species present (the species A. calyculus was treated differently as described below) we first established an empirical relationship between plant volume (cm3) and average plant carbonate content (g CaCO3) based on collections of replicate specimens of H. incrassata (n = 142), P. capitatus (n = 57), P. dumetosus (n = 84), R. phoenix (n = 92), U. flabellum (n = 74) and U. cyathiformis (n = 58) across the full size range observed within the study area. This approach allows plant biovolumes to be calculated from measures taken in the field, and it is comparable to approaches recently used to quantify biovolumes of corals (Naumann et al., 2009), and surface areas of sponges and gorgonians (Santavy et al., 2013). For both species of Penicillus (P. dumetosus and P. capitatus) and for U. cyathiformis the growth morphology and resultant volumetric space was defined by the sum of the volume (V) of an inverted elliptical cone (for the head) and a cylinder (for the stem) (Figure 2A), and which can be determined as:
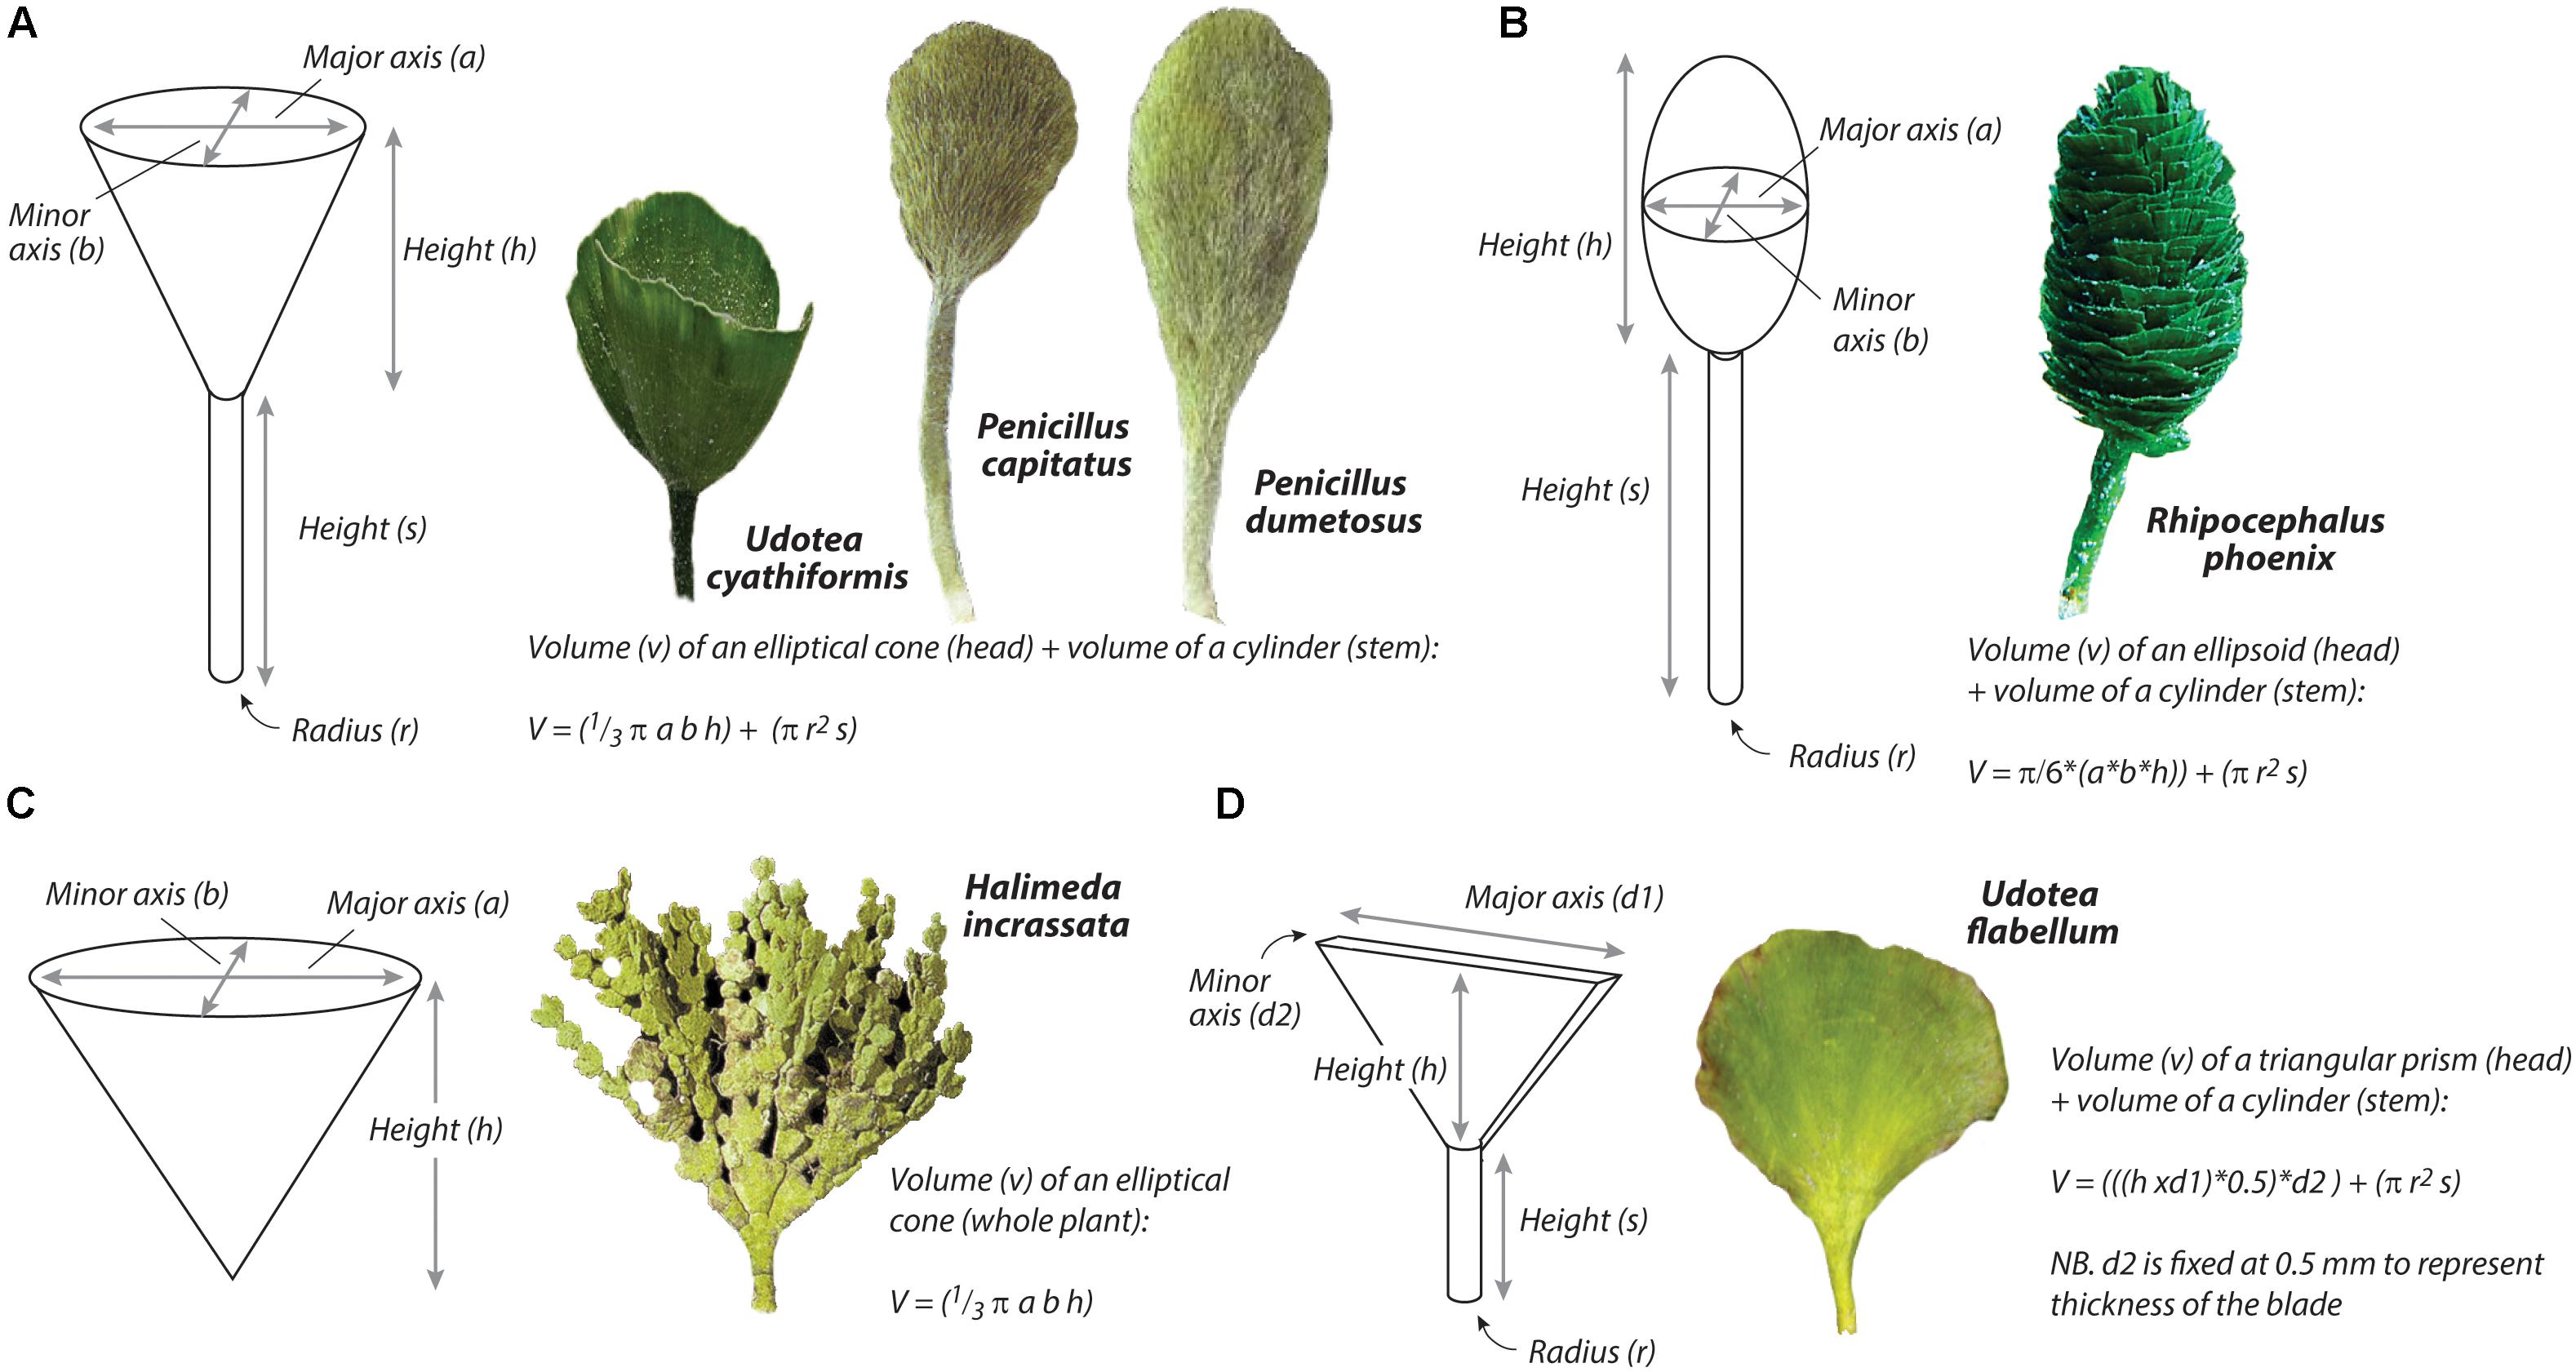
Figure 2. Schematic showing axes and dimensions used to estimate the volumetric space occupied by species of (A) Udotea cyathiformis, Penicillus capitatus, and Penicillus dumetosus; (B) Rhipocephalus phoenix; (C) Halimeda incrassata; and (D) Udotea flabellum.
Where, a = the radius of the minor axis (i.e., of the minimum head width), b = the radius of the major axis (i.e., of the maximum head width), h = the height of the head, s = height of the stem, and r = the radius of the stem.
For U. flabellum, plant volumetric space was defined by the sum of the volume of a triangular prism (for the head) and a cylinder for the stem (Figure 2D), and which can be determined as:
Where, h = the height of the head, s = height of the stem, d1 = the maximum width of the plant head, d2 = is fixed at 0.5 mm to represent the thickness of the head, and r = the radius of the stem.
For R. phoenix, plant volume was defined as the sum of the volume of an ellipsoid (head) and cylinder (stem) (Figure 2B), and which can be determined as:
Where, h = the height of the head, s = height of the stem, d1 = the maximum width of the plant head, and d2 = the minimum width of the plant head.
For H. incrassata, which comprises multiple calcified segments, we defined growth morphology and resultant volumetric space by the volume of an inverted elliptical cone (Figure 2C), which can be determined as:
Where, a = the radius of the minor axis (i.e., of the minimum plant width), b = the radius of the major axis (i.e., of the maximum plant width), and h = the height of the plant.
To determine the relationship between volume and carbonate content (g CaCO3/plant), we used two different approaches depending on species. For specimens of P. capitatus, P. dumetosus, R. phoenix, U. flabellum, and U. cyathiformis we equated the total weight of carbonate (g) in each specimen to the weight lost after treatment in acid. All plants were first soaked in two separate distilled water treatments to remove salts and checked for epiphytic encrustations (which were removed with a scalpel). Plants were then oven dried (40°C for 24 h), weighed, treated in 2M HCl until no further carbonate reaction was visible, and left in the solution for a further 2 h. The solution was then decanted, and the remnant organic fibers transferred to pre-weighed filters and rinsed with distilled water to remove any remaining salts. Filtered samples were then re-dried (40°C for 24 h), reweighed, and carbonate content determined as the net weight loss. For H. incrassata, we used a different approach based on that proposed by Perry et al. (2016). For this species, we counted the total number of segments in each plant to establish a relationship between plant volumetric space and the number of segments. To then determine the average carbonate content (g CaCO3) per plant segment, we collected replicate branches (n = 25) that comprised multiple (n = 15–20) segments of varying size/age so as to determine an average content for whole plants. Samples were cleaned, washed and acid treated as described above to determine carbonate content, which was then averaged as a function of the number of segments per branch. Average segment carbonate content was 0.0016 ± 0.0009 g. Resultant volume: carbonate content relationships are shown in Figure 3, and these were used to determine plant carbonate content from plant dimensions measured in-situ in our surveys (see below).
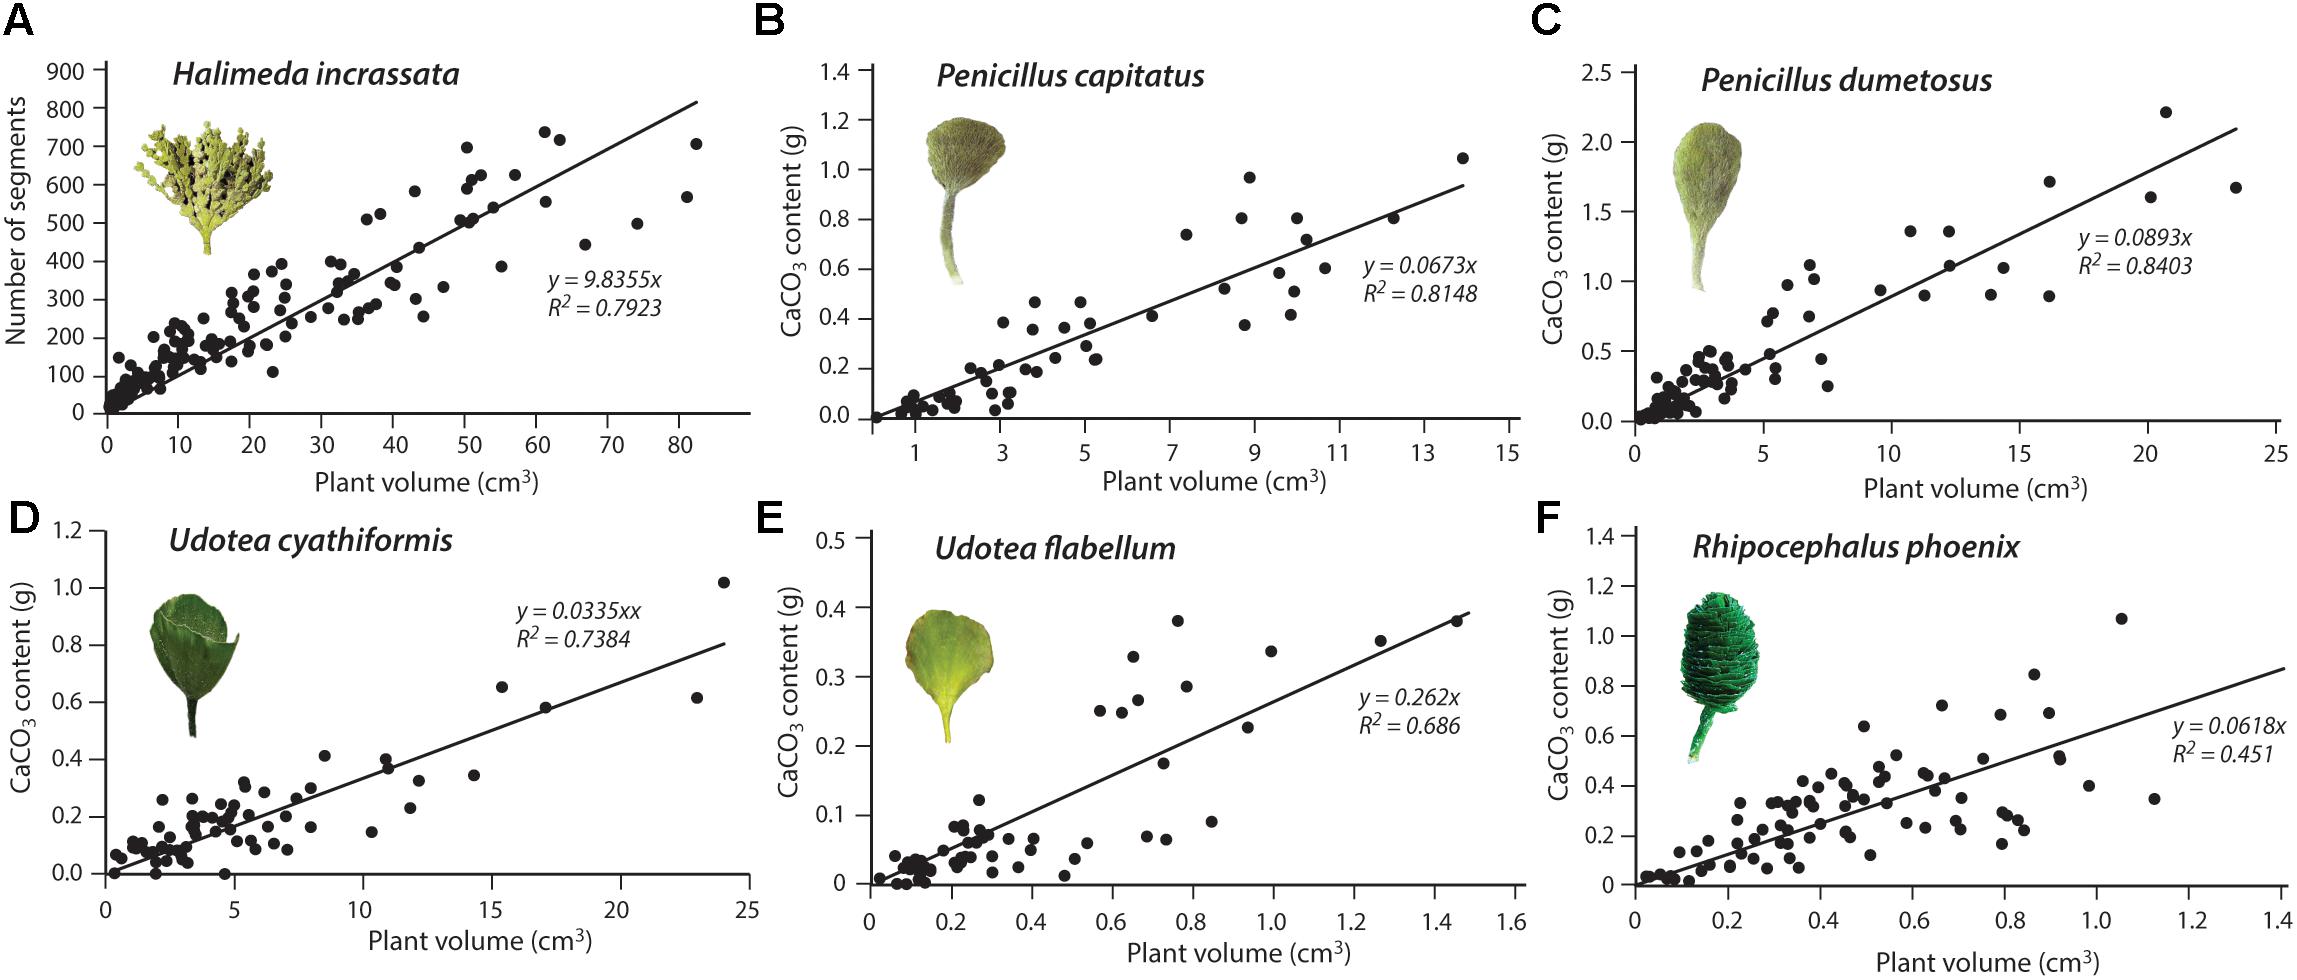
Figure 3. Relationships between plant volumetric space (cm3) and plant carbonate content (g CaCO3) for (A) Halimeda incrassata; (B) Penicillus capitatus; (C) Penicillus dumetosus; (D) Udotea cyathiformis; (E) Udotea flabellum; and (F) Rhipocephalus phoenix.
The very small size of the other calcifying algal species common in some habitats on Eleuthera Bank, A. calyculus, makes in situ dimensional measurements for this species problematic, so we instead determined an average carbonate content per plant. Based on a similar acid digest procedure to that described above, we determined the average weight of carbonate per plant to be 0.0135 ± 0.0095 g (n = 60). T. testudinum contributes to carbonate sediment production indirectly through the post-mortem release of lightly calcified epiphytes that colonize the seagrass blades (coralline algae, foraminifera, serpulids; Corlett and Jones, 2007). Plant and blade density are important controls on production rates (Nelsen and Ginsburg, 1986; Perry and Beavington-Penney, 2005) and we thus sampled individual blades from habitats with different average blade densities (sparse, medium, dense – see above) to determine the average weight of epiphytic carbonate per blade. This was determined using the weight loss after acidification method (as above) and as previously used to estimate seagrass epiphyte production (Nelsen and Ginsburg, 1986; Bosence, 1989) based on analysis of replicate (n = 20) mature blade samples (defined as blades with distinct browning of the tips; Nelsen and Ginsburg, 1986). In order to determine natural weight loss of blades during acid treatment, 10 unencrusted seagrass blades were collected from each habitat and treated in the same way as the encrusted blades. Epiphytic calcium carbonate per blade was then determined as follows:
where; A = weight of the encrusted dry blades, B = weight of the acid treated blades, C = proportion of weight loss from unencrusted blades treated with acid.
On this basis, average epiphytic carbonate blade was determined as 0.018 ± 0.005 g (sparse seagrass beds), 0.023 ± 0.010 g (medium seagrass beds), and 0.053 ± 0.034 g (dense seagrass beds).
To determine growth rates for each green algal species, we measured the increase in plant biomass (g dry weight) and, for H. incrassata, we measured the number of new segments produced by each species over time with the widely used Alizarin Red staining method (Multer, 1988; Friele and Hillis, 1997; Vroom et al., 2003). Staining experiments (H. incrassata n = 157, P. capitatus n = 25, P. dumetosus n = 73, R. phoenix n = 24, U. flabellum n = 28, and U. cyathiformis n = 36) were conducted in both winter (November) 2016 and summer (June) 2017 to factor as far as possible for any seasonal variability. The variable sample sizes reflect the different plant densities in the areas of study. Plant staining was undertaken by enclosing an area of seafloor under a clear plastic container (28 l internal volume) fitted with a sealable plastic pipe into which Alizarin Red stain (10 ml per treatment) could be injected with a large volume syringe (Freile, 2004). Staining experiments were undertaken in a range of shallow (2–4 m depth) habitats in the vicinity of, and just offshore from, Cape Eleuthera Institute. Each box was weighted down and the edges buried in the sediment to a depth of several cm to ensure minimal leakage of stain. Each box was re-checked after ∼6 h and additional stain added as necessary. Boxes were removed after ∼18 h, the edges of each plot marked with stakes and plants were left undisturbed for periods of 10–12 days after which selective harvesting (of target species and sizes) was undertaken.
Post-harvesting, each plant was individually bagged and returned to the laboratory. Plants were rinsed in sequential distilled water washes to remove salts, and then left to soak in a dilute commercial bleach solution to remove plant chlorophyll. This allows the clear delineation of areas of older (stained) and new growth (see Supplementary Figure S1). Areas of new growth where trimmed with a scalpel, the new and old portions were dried and weighed, and growth rate was determined as the ratio of new to old material as a function of growing period (after Multer, 1988). For H. incrassata, growth rates were determined in the same way but were based on the number of new versus old segments. Turnover rates were then calculated as function of the total time taken for plants to renew their standing stock and scaled to an annual rate based on the methods of Multer (1988), Friele and Hillis (1997), and Vroom et al. (2003). Turnover rates were not measured for A. calyculus or T. testudinum in this study. In the absence of published data for A. calyculus, we used a turnover rate (7.7 crops/year) based on the average for all other green algal species measured in this study. For T. testudinum we used the average turnover rate (5.9 crops per year) for this species from published studies conducted in the Caribbean (Patriquin, 1972; Nelsen and Ginsburg, 1986; Frankovich and Zieman, 1995).
Determining Calcareous Algal and Seagrass Densities
To determine the density and size of calcareous algal species and the density of seagrass in each habitat type colonized by algae and/or seagrass across Eleuthera Bank, surveys were conducted in winter (November) 2016. Water temperatures are relatively low at this time of year (mean 25–27°C; Salter et al., 2012), and plant turnover rates a little lower compared to the summer (see below). Thus the data generated are considered to provide a conservative estimate of annual carbonate production rates. Within each habitat, two separate survey areas were established, and data were collected using 0.5 × 0.5 m quadrats laid in a checkerboard arrangement along multiple (n = 16) 10 m transects. Identities and relevant dimensions needed to calculate volumes (height, widths, etc. for heads, stems and other relevant sections of plants; Figure 2) were recorded for each plant present. Additional plant/seagrass blade density data (but not size measurements) were made from the same survey areas in summer (June) 2017 to compare plant/seagrass blade densities between warmer and cooler periods of the year.
To then estimate total carbonate sediment production (CaCO3 production (g) /plant/yr) by each green algal species and by seagrass epiphytes (using data from the November 2016 surveys) the following calculations were made. For each H. incrassata the volume: segment content relationship (Figure 3) was used to estimate the total number of segments in each plant from the in-field measured plant dimensions, and then multiplied by the average CaCO3 content of each segment (0.0016 g – see above) and the average plant turnover (crops per year) rate. For specimens of P. capitatus, P. dumetosus, R. phoenix, U. flabellum, and U. cyathiformis, the volume: carbonate content relationships (Figure 3) were used to estimate plant carbonate content from dimensions measured in the field, and again multiplied by the average plant turnover (crops per year) rate for each species. The same approach was used for A. calyculus except that the volume : carbonate content relationship approach was substituted for an average weight carbonate per plant. To determine a rate of epiphytic carbonate production from T. testudinum the total number of blades per quadrat were counted and multiplied by the average weight of epiphytic carbonate per blade (as determined for sparse, medium or dense seagrass beds – see above) and the average plant turnover (crops per year) rate (following the method of Nelsen and Ginsburg, 1986). A total estimated carbonate production rate (g CaCO3 m−2 yr−1) by each species per transect (n = 16 per habitat) was then calculated, and from this a habitat mean rate (±SD) per species determined (Supplementary Table S1). An overall habitat mean production rate was then calculated as the sum of production from all species, with overall error terms (σ) calculated as:
Where a, b, c etc = species or transect level production rates.
These data were then used to calculate total habitat scale production as a function of habitat extent, and from this a total platform-scale production estimate (kg per habitat/year), with an error term calculated using Equation 6 above.
Determining Calcareous Algal and Epiphyte Breakdown Products
To determine the sediment size-fractions to which the different green algal species contribute post-mortem, we followed the same experimental approach to that used by Neumann and Land (1975) in a study of Caribbean green algal breakdown, and as recently used by Perry et al. (2016). We collected nine mature and fully calcified specimens of each algal species and placed three specimens in each of three elongate (25 cm × 10 cm × 6 cm) lidded plastic vessels containing a 50:50 solution of distilled water and 5% commercial bleach. The experimental vessels were then placed on a see-saw rocker plate (Stuart Model SSL4) set to operate at a tilt rate of 28 oscillations/min, which was determined as sufficient to enable slow, gentle continuous sample agitation. Each experiment was left to run for 21 days. Samples were then wet sieved through a sieve stack (sieve sizes of 4, 2, 1 mm, 500, 250, 125, 63, and 31 μm to conform to the standard grain size divisions under the Udden-Wentworth scheme). Each retained fraction was filtered, dried and weighed to determine size fraction contributions (Supplementary Table S2). Past studies have assumed that all epiphytic carbonate derived from T. testudinum blades is either released as, or rapidly disaggregates post-release to, mud-grade (<63 μm) carbonate (Land, 1970; Nelsen and Ginsburg, 1986). Whilst this may seem a reasonable assumption given the lightly calcified coralline algal crusts and small sizes of serpulid worm cases and encrusting foraminifera that colonize seagrass blades (Corlett and Jones, 2007), we tested this by carefully scraping the epiphytic carbonate from rinsed and dried blades of T. testudinum (n = 20) to generate one bulk sample that was then analyzed using the same sieving protocol as above.
Determining Algal and Epiphyte Carbonate Mineralogies
Bulk carbonate mineralogies for each algal species, seagrass epiphytes, and surface sediments (Table 1) from each habitat were determined using XRD (Bruker D8 Advance). Dry samples were ground to a powder in an agate mortar and mixed with a powdered quartz standard before being mounted on glass slides. Diffraction patterns were obtained using Cu Kα radiation (1.5418 nm) generated at 40 kV and 40 mA, initially employing coarse scan parameters (step size 0.04°2θ; step time 0.4 s; scan interval 16–60°2θ) to confirm that aragonite, low-Mg calcite, and high-Mg calcite were the only mineralogies present. Subsequent high resolution scans (step size 0.02°2θ; step time 1.0 s; scan interval 23–32°2θ) were performed to facilitate estimation of: (i) the MgCO3 content(s) of calcite, based on the position(s) of the calcite d104 peak(s) (after Goldsmith et al., 1961); (ii) the relative abundances (wt%) of calcite and aragonite, based on the integrals of calcite d104 and aragonite d111 and d021 peaks (after Davies and Hooper, 1963); and (iii) the relative abundances (wt%) of component calcite phases (with different MgCO3 contents) assuming that the ratio of the integrals of their respective d104 peak integrals is approximately equal to the ratio of their abundances (Sepulcre et al., 2009). To determine these parameters, a peak-fitting procedure was performed using PeakFit software (v4.12) to decompose overlapping peaks (which occur when multiple calcite phases with differing MgCO3 contents are present) and fit a computer-generated line profile to the observed data. Resulting peak positions were corrected for goniometer misalignment and/or specimen-dependant errors by reference to known fixed peak positions of the internal quartz standard. Although this approach is widely used to estimate MgCO3 contents, we qualify our results with the caveat that for biogenic carbonates this approach can carry significant uncertainties (≥± 5 mol% MgCO3; Bischoff et al., 1983). Consequently, calcites with estimated MgCO3 contents in the range 0–9 mol% can only tentatively be categorized as either HMC or LMC, although in terms of categorizing HMC (which are the dominant form) these carbonates have measured ranges from 13–15 mol% and should not be misclassified. The applicability of the aragonite:calcite calibration curve was tested for known mixtures of biogenic aragonite and high-Mg calcite (at ratios of 1:0, 3:1, 1:1, 1:2, and 0:1) and found to be accurate to within ± 3%.
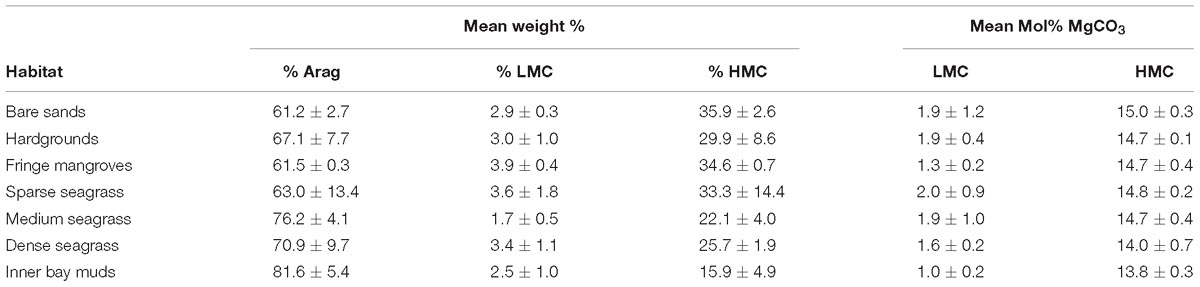
Table 1. Sediment mineralogies (±SD) from each habitat based on XRD analysis of bulk sediment samples.
Results
Census data collected across southern Eleuthera Bank indicate that algal densities were generally low in most habitats in both seasons (Figure 4). Total mean plant densities (excluding Thalassia seagrass) were lowest in the sand/sparse algal habitat (November 1.9 ± 0.6 plants/m2; June 7.1 ± 1.8 plants/m2) and the fringing mangrove habitat (November 3.3 ± 1.4 plants/m2; June 4.7 ± 2.1 plants/m2). Highest mean densities were measured in the medium density seagrass beds (Nov 15.3 ± 4.4 plants/m2; June 13.2 ± 3.7 plants/m2). At the individual species/genera level H. incrassata was most abundant in the hardground (November 7.3 ± 9.3, June 9.4 ± 12.4 plants/m2), medium density seagrass (November 10.7 ± 10.7, June 9.2 ± 13.4 plants/m2) and dense seagrass (November 4.6 ± 6.4, June 10.2 ± 6.7 plants/m2 respectively) habitats. Penicillus spp. are generally sparsely distributed (all sites/both seasons ≤ 3 plants/m2), the exception being P. dumetosus which is present in the fringing mangrove habitats at densities averaging ∼5 plants/m2. Udotea spp. are present in all habitats, but in very low densities (≤2 plants/m2).
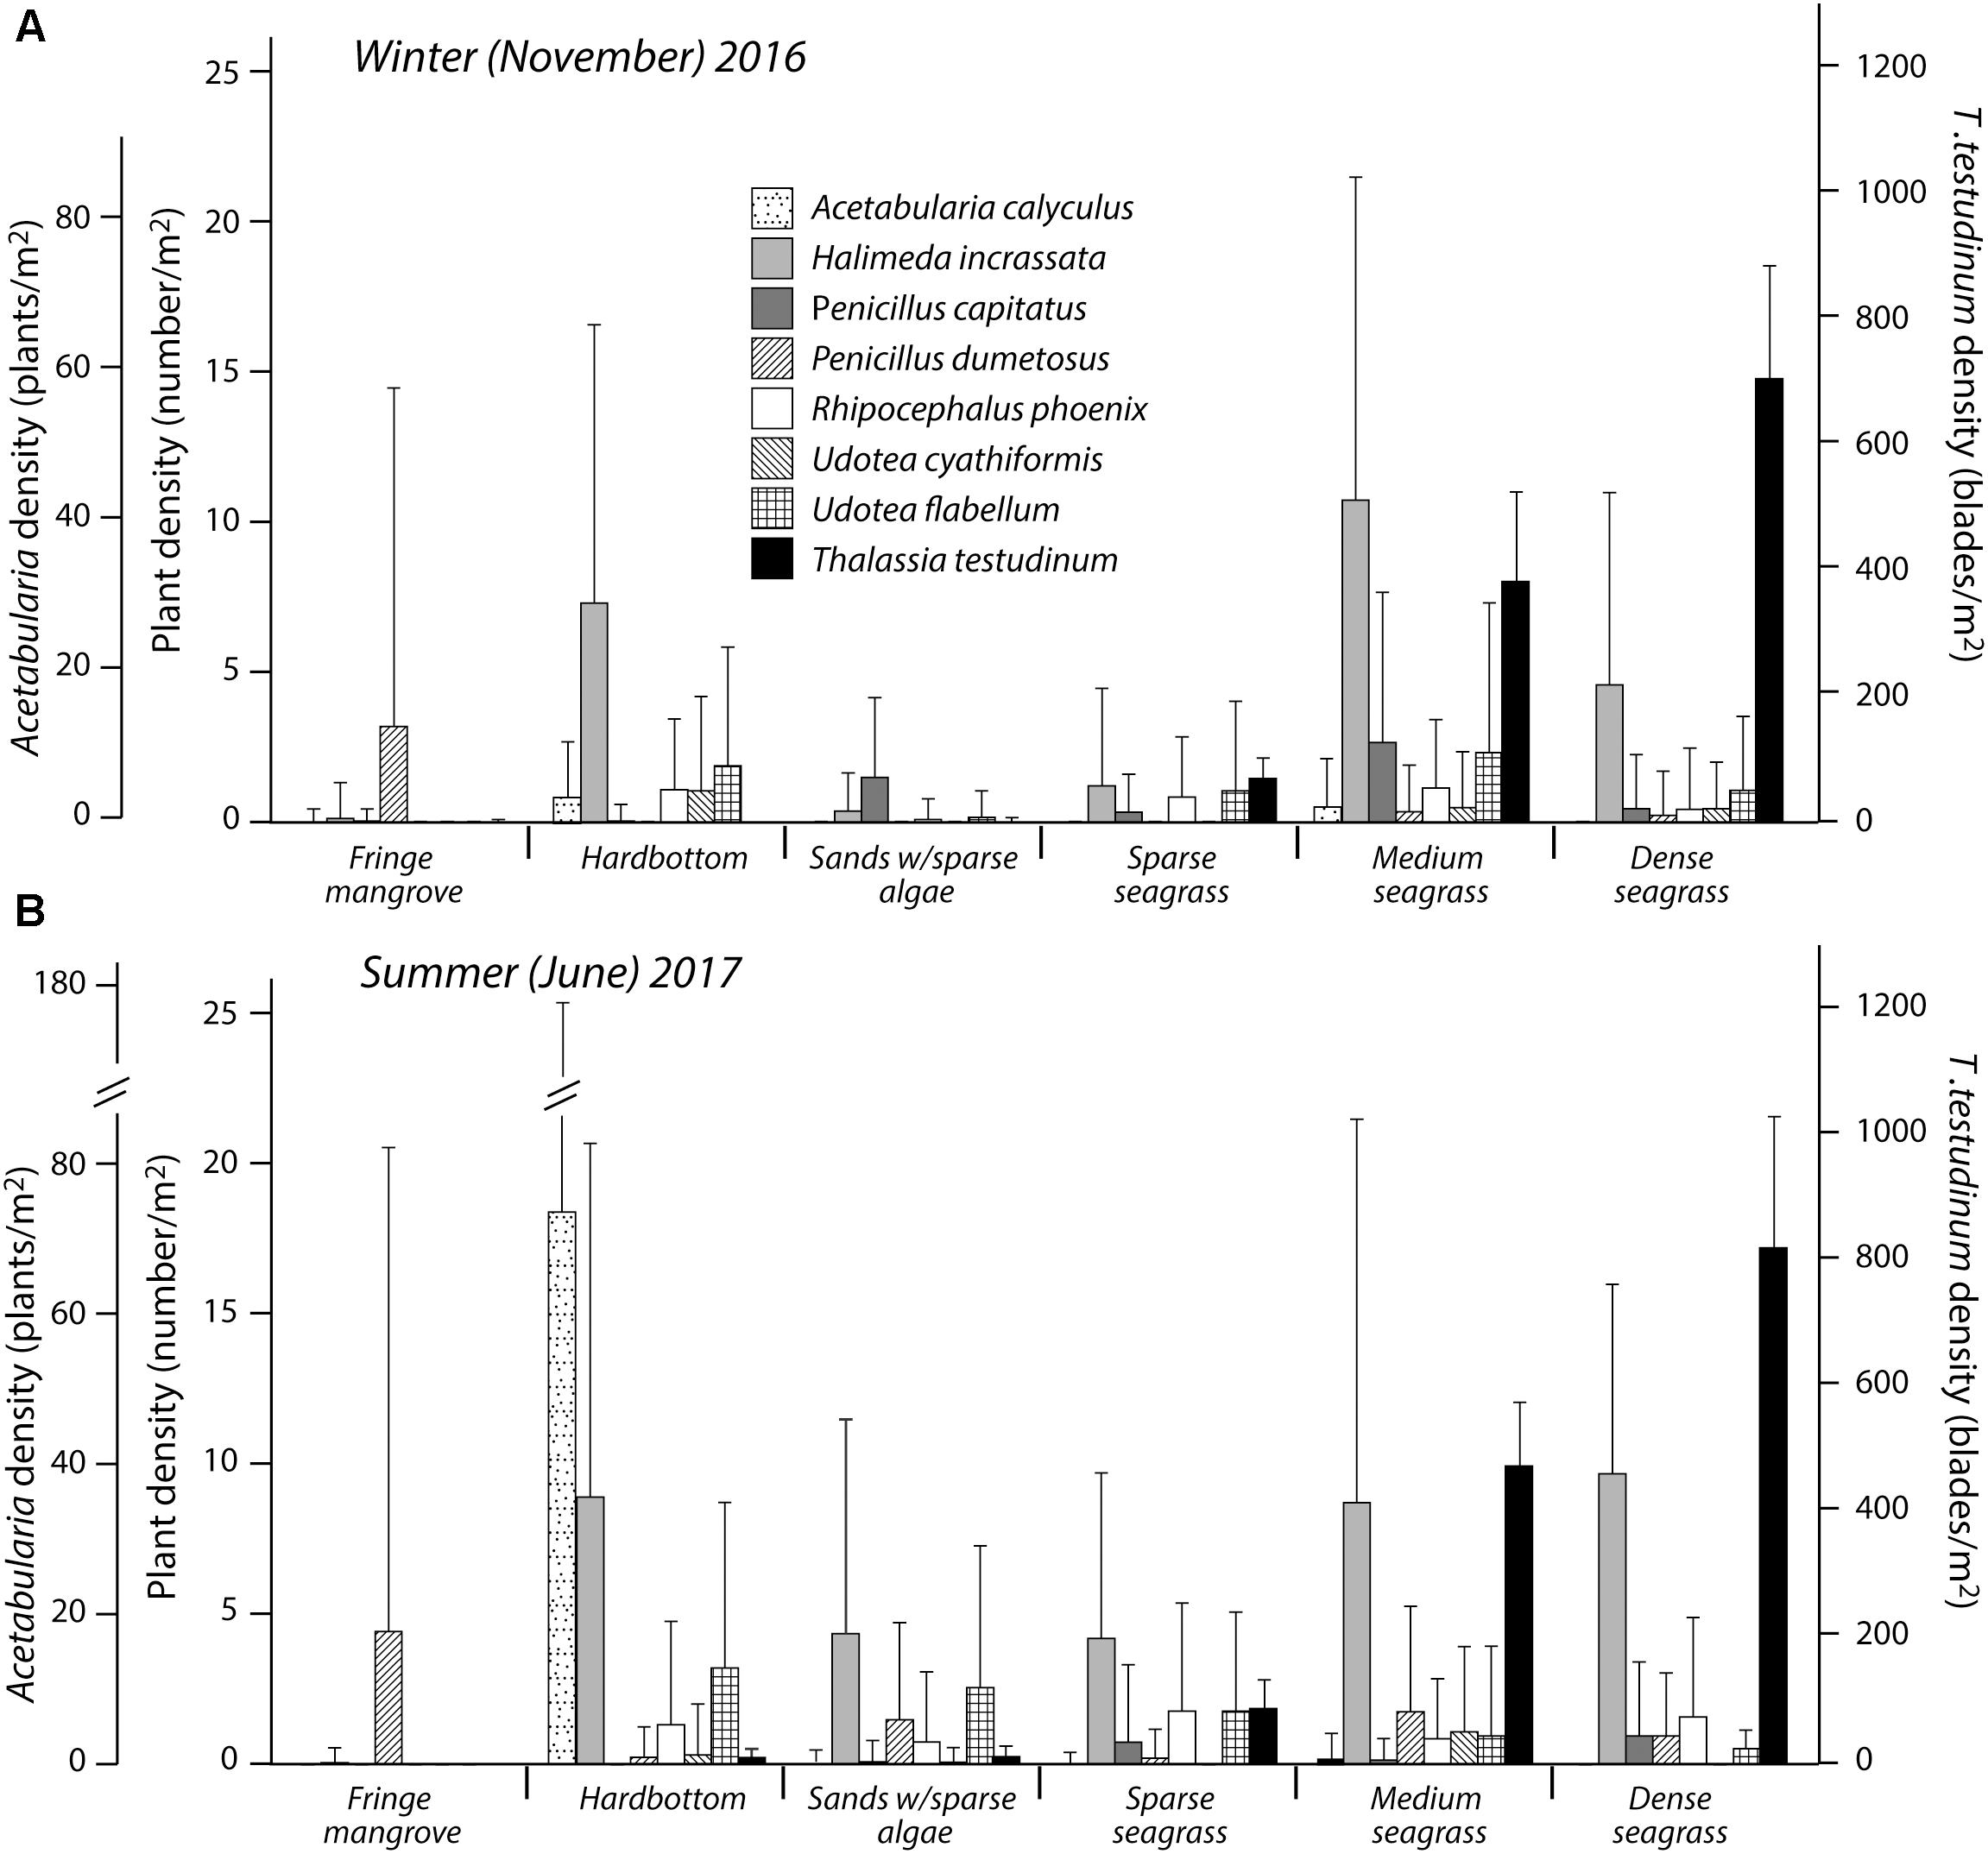
Figure 4. Mean (±SD) calcareous green algal and seagrass blades density for (A) winter (November) 2016, and (B) summer (June) 2017 for each of the six habitat types examined.
Seagrass blade density varied considerably even within habitat classes, but in the ‘sparse’ seagrass beds densities (blades/m2) averaged 66.5 ± 33.5 (November) and 81.4 ± 46.5 (June), in the ‘medium’ seagrass beds 400.5 ± 144.0 (November) and 479.2 ± 95.4 (June), and in the ‘dense’ seagrass beds 715.1 ± 171.8 (November) and 816.3 ± 199.5 (June). Algal and seagrass census data thus suggest slightly higher average plant densities in summer (June) compared to winter (November) months (Figure 4), but these differences were not significant in any habitat (t-test: fringing mangrove t = 0.9278, P = 0.3961; bare sands t = 1.6072, P = 0.1689; sparse seagrass t = 1.1949, P = 0.2772; medium seagrass t = 0.9777, P = 0.3660; dense seagrass t = 1.0426, P = 0.3373). The only exception is the hardground habitat where significantly higher densities of A. calyculus were measured in June compared to November (p < 0.0001).
Turnover (crops per year) rates for each algal species were measured in both sampling seasons, and indicate slightly higher summer as opposed to winter rates (Table 2). However, differences between the two seasons were not statistically significant (p > 0.5). The exception is P. dumetosus, with higher summer versus winter turnover rates (t = 2.1130, p < 0.05). Turnover rate data (using an annual average crops per year rate for each species) were then integrated with plant size/carbonate content conversion data and habitat-specific plant density data to estimate annual rates of carbonate production (g CaCO3 m−2 y−1) by each species per unit area of habitat. In terms of the plant size/density metrics, we deliberately used only data from our winter surveys to ensure that our calculated rates of production remain conservative, and thus resultant rates can be considered to represent minimum annual carbonate production rates by algal and seagrass epiphytes.
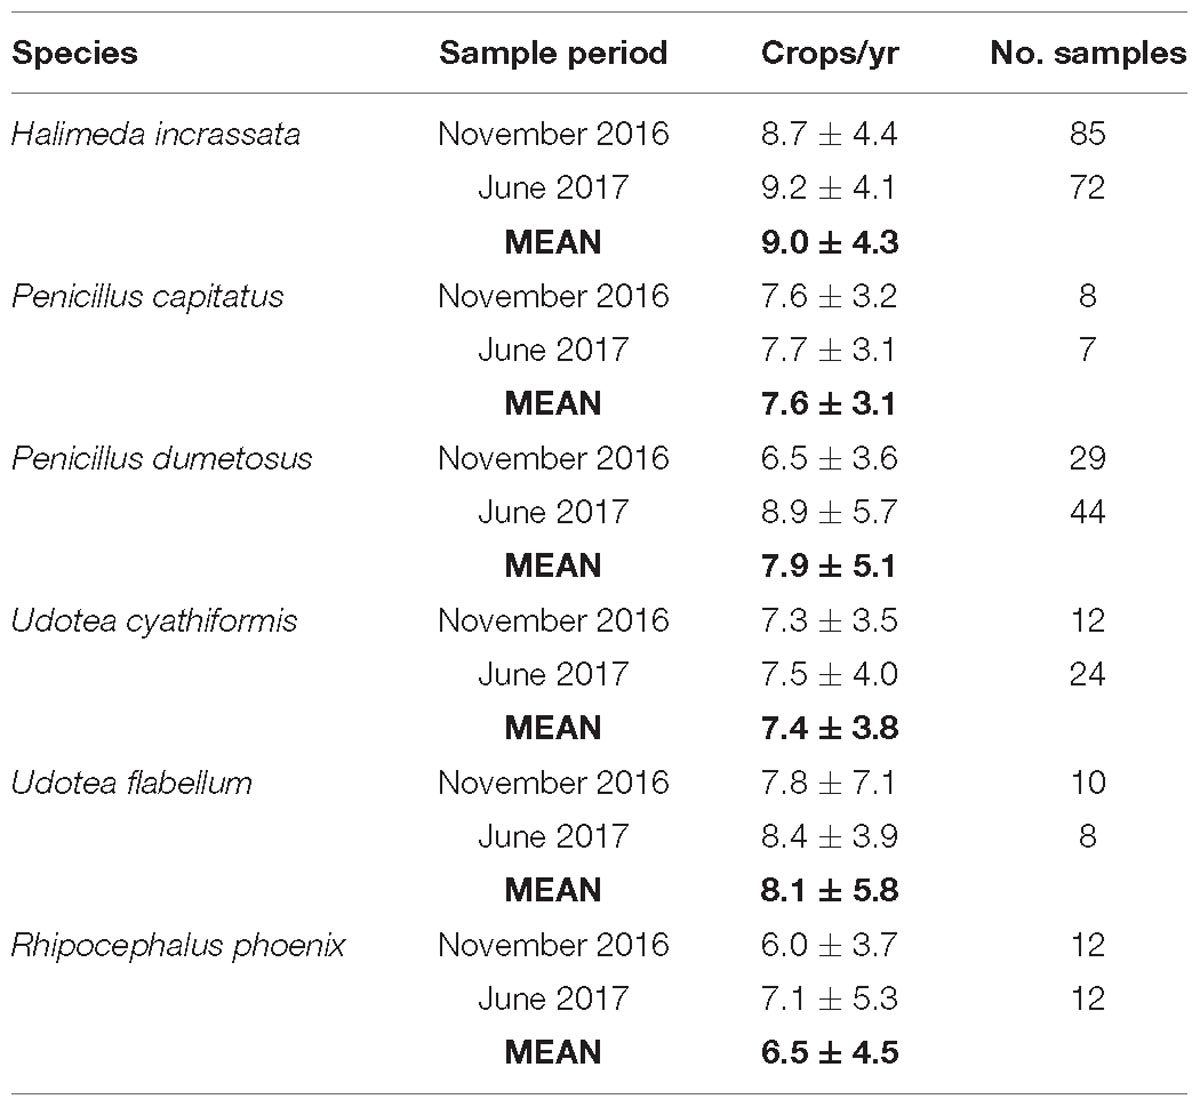
Table 2. Calculated annual turnover rates (±SD) for each green algal species for both winter (November) 2016 and summer (June) 2017.
These data were then used to explore the question of how much carbonate is produced by algae/seagrass epiphytes in each habitat. Rates are highly variable among habitats as a function of both algal species presence and density, and of seagrass presence and density. Lowest production rates were calculated in the bare sand/sparse algal habitat (1.89 ± 2.06 g CaCO3 m−2 yr−1) and the fringing mangrove habitat (6.73 ± 5.22 g CaCO3 m−2 yr−1) (Figure 5A), whilst higher rates were calculated in the medium (68.29 ± 15.74 g CaCO3 m−2 yr−1) and dense seagrass beds (238.26 ± 55.84 g CaCO3 m−2 yr−1) (Figure 5A and Table 3). Much higher production rates thus occur from seagrass epiphyte production in areas of dense seagrass development, suggesting that dense seagrass beds represent important “hotspots” of carbonate sediment production. Furthermore, and even with relatively high densities of algae in seagrass habitats (Figure 4), per unit area epiphyte production estimates significantly outweigh those associated with calcareous green algae (Table 3). We also note that even in habitats where green algae are the dominant sources of carbonate sediment, per unit area rates of production are low relative to those reported in other settings (Multer, 1988; Freile, 2004) because algal densities themselves are low across much of the study area.
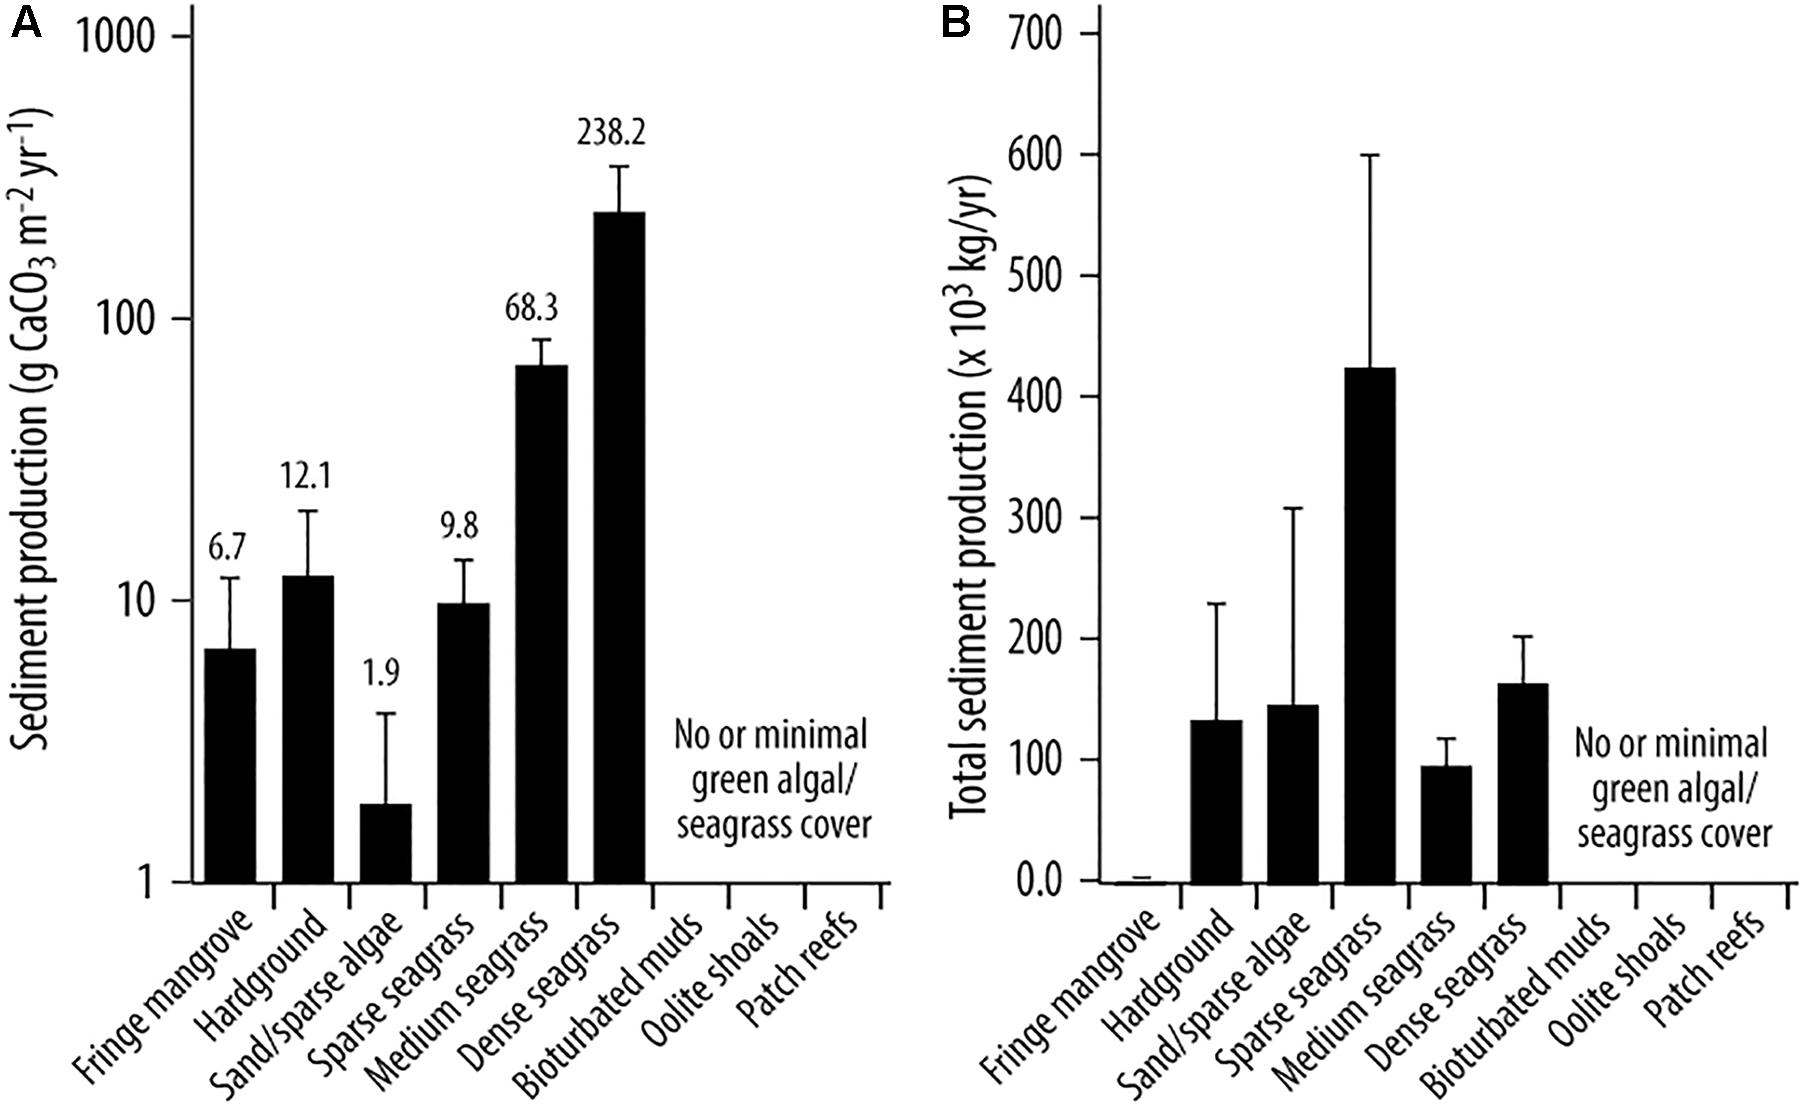
Figure 5. (A) Average carbonate sediment production (g CaCO3 m−2 yr−1± SD) by habitat; and (B) Total sediment production (kg yr−1) by habitat type.
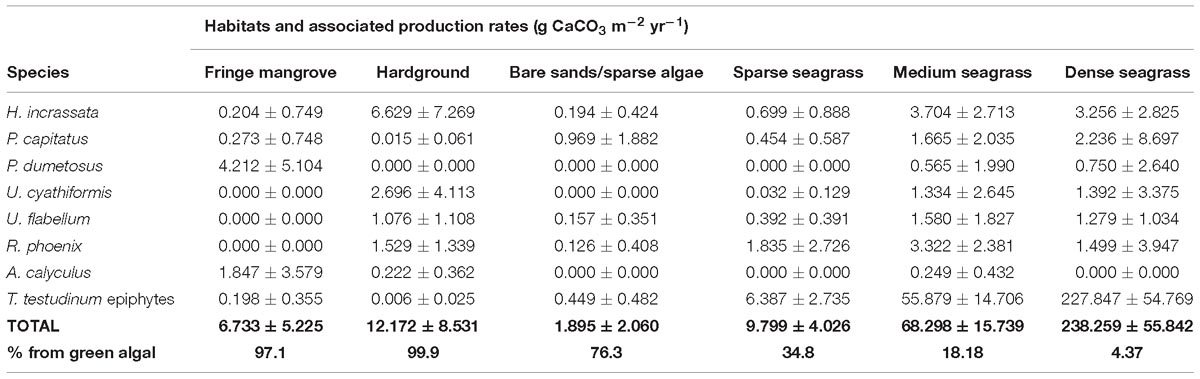
Table 3. Mean (±SD) rates of carbonate production (g CaCO3 m−2 yr−1) by calcareous green algae and seagrass epiphytes within each habitat across Eleuthera Bank, and total resultant production rates (mean ± SD) for each habitat type.
To then estimate total rates of generation of carbonate sediment, we up-scaled the habitat production rates as a function of measured habitat area. On this basis, total estimated sediment production is ∼ 980 (±261) × 103 kg/yr. This is equivalent to an average of only ∼6.9 g CaCO3 m−2 yr−1 when factoring for the spatial extent of habitats and including both the plant/algal colonized and uncolonized habitats in the study area. There are, however, marked inter-habitat variations evident that reflect both habitat spatial extent and between-habitat production rate variability. The single largest contribution to this total derives from the sparse seagrass habitat (∼428 × 103 kg/yr; Figure 5B) which covers a large area (∼31%) of the Bank. A significant, but much smaller total contribution (∼166 × 103 kg/yr) is associated with the dense seagrass bed habitat, which despite having very much higher per unit area production rates covers a very small proportion of the area (<1%). The smallest contributions (478 kg/yr) derive from the fringing mangrove habitats, reflecting both their small spatial extent and the low calculated per unit area production rates (Figure 5B).
Arising from these data, is the additional question of how much sediment in different size fractions is generated as a function of algal/seagrass abundance and overall across the study area. This question is important because of the differential transport (Braithwaite, 1973; Ford and Kench, 2012) and preservation (Perry, 2000) pathways that sediments of different size fractions and types follow. Our algal/epiphyte breakdown experiments clearly show there are marked differences in the size fractions of sediment generated by each species, and that not all material produced is mud-grade carbonate. Much of the inter-species variability probably relates to the differential breakdown of stem versus head sections of green algal species as discussed by Neumann and Land (1975), but some common patterns emerge. Firstly, H. incrassata generates sedimentary material with a distinct bi-modal grain size distribution. Thus, whilst many segments disaggregate to mud-grade carbonate, some (presumably those that are more heavily calcified) remain as intact plates that contribute to the coarse sand to gravel grade size fractions (Figure 6A). In contrast, P. capitatus, both Udotea species, and R. phoenix disaggregate to produce predominantly (>60 wt%) mud-size sediment, with especially large proportions of < 32 μm sediment being produced by P. capitatus and the Udotea species (Figure 6A). Furthermore, P. dumetosus disaggregates to produce more biomodally distributed sediment, albeit skewed toward the finer size fractions (Figure 6A). The fine and lightly calcified A. calyculus plants also disaggregate to predominantly mud-grade carbonate (Figure 6A), whilst seagrass epiphytes produce sediment that is a mix of medium-fine sands (∼40 wt%) and mud-grade carbonate (∼50 wt%) (Figure 6A).
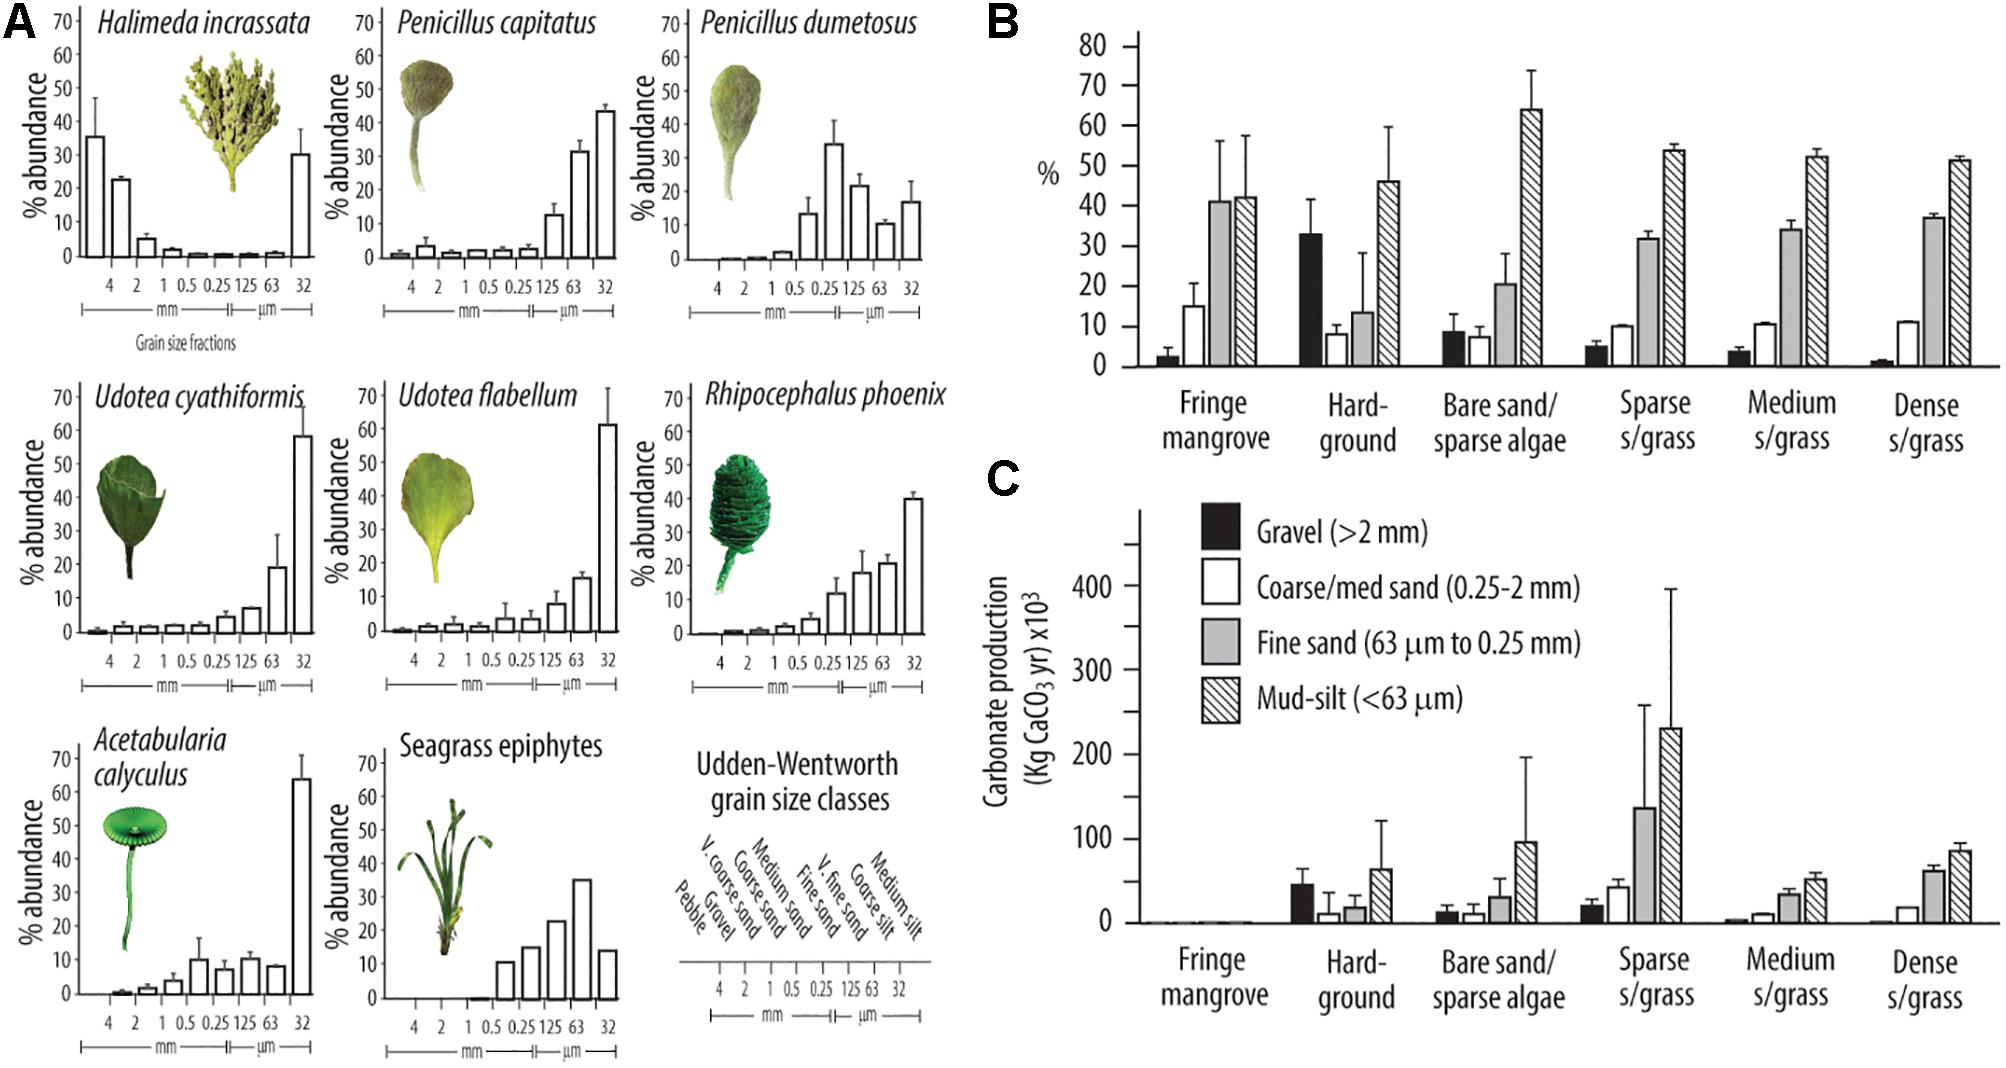
Figure 6. (A) Post-disaggregation contributions to different sediment grain size classes (±SD) by different species of calcareous green algae and seagrass epiphytes; (B) Proportional contributions (±SD) of green algae and seagrass epiphytes to different sediment size fraction classes by habitat; (C) Total estimated amounts of CaCO3 sediment (±SD) by size fraction grouping produced in each habitat type.
Using these data, along with the habitat specific production rates, we make first-order estimates of the sediment grain size distributions generated post-mortem by calcareous green algae and seagrass epiphytes, both by habitat and overall for this area of platform. The highest proportions of sediment produced are in the mud/silt size class (Figure 6B), exceeding 50 wt% of sediment generated in most habitats. However, it is pertinent to note the high proportions of fine sand grade sediment generated in the seagrass (∼35%) and fringing mangrove (∼40%) habitats, and the high relative proportions (∼32%) of gravel grade sediment generated in the hardground habitat (Figure 6B). Resultant estimates of total sediment production (kg/yr) within each sediment size class across the study area are as follows: gravel 82 × 103 kg/yr (8.4% of total); medium/coarse sand 91 × 103 kg/yr (9.4%); fine sand 280 × 103 kg/yr (28.5%); mud/silt 527 × 103kg/yr (53.6%), with the overwhelmingly largest contribution being from the spatially extensive sparse seagrass and algal meadow habitats (Figure 6C).
The above data clearly show that different algal species and seagrass epiphytes contribute to different sediment grain size fractions (Figure 6A). XRD analysis also shows that these species precipitate different proportions of CaCO3 mineralogies: aragonite, high Mg-calcite (HMC) and low Mg-calcite (LMC). All of the calcareous green algal species precipitate predominantly aragonite (range: ∼93–99 weight %), with small amounts of HMC (1–5 weight %), and trace amounts of LMC (mostly < 1%) (Table 4), consistent with data reported from other Caribbean settings (Gischler and Zingeler, 2016). In contrast, calcareous epiphytes on T. testudinum blades comprise ∼80 wt% HMC, and ∼18 wt% aragonite, again consistent with compositions reported in other studies (Bosence et al., 1985). Based on these data and our calculated production rates by each species in each habitat, we estimate that ∼51% of total algal/epiphytic carbonate produced across the entire study area is aragonite, ∼48% is HMC, and ∼1% is LMC (Table 5). However, clear differences among habitats reflect the dominant contribution by epiphytic carbonates in dense seagrass meadows. Thus, whilst most carbonate produced in the mangrove, hardground, and sparse algal habitats is aragonite, HMC dominates production in the seagrass beds (Table 5). Furthermore, and although the dense seagrass beds occupy a small proportion of the study area (<1%), the very much higher production rates per unit area in this habitat, significantly increases estimated total HMC production. What these results clearly show is that habitat type and extent, and especially the extent of dense seagrass beds, strongly influences the amounts and phases of carbonate sediment being generated across tropical and sub-tropical carbonate platform and shelf settings
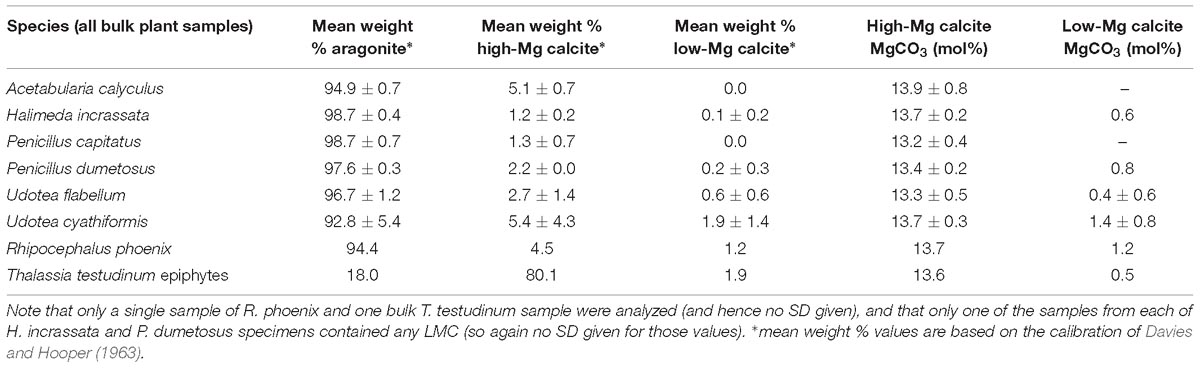
Table 4. CaCO3 mineralogies (±SD) of each species of calcareous green algae and of seagrass epiphytes measured in this study, and associated mol % MgCO3 composition of high-Mg calcite and Low-Mg calcite.
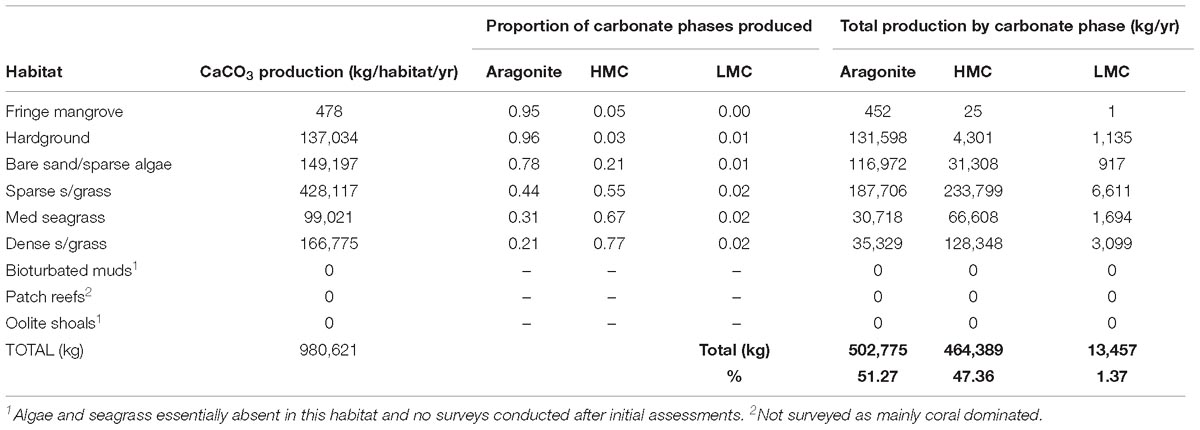
Table 5. Total proportions and amounts of aragonite, High-Mg calcite and Low-Mg calcite generated in each habitat as a function of measured mineralogies (Table 4) and plant production calculations.
Discussion
The methodology presented here is designed to support census-based estimates of carbonate sediment production by a range of calcareous green algae and by seagrass epiphytes in a way that can be applied relatively rapidly across habitats typical of Caribbean platforms and ultimately integrated with other assessments of CaCO3 production rates (e.g., from fish) to quantify total rates of CaCO3 sediment generation. Importantly, the approach supports estimates of the grain-size fractions and mineralogy of sediments being produced, which can critically influence subsequent post-deposition sediment transport and diagenetic pathways. Calcareous green algae and seagrass epiphytes have particular relevance to such assessments because they are ubiquitous substrate colonizers across tropical and sub-tropical reef, shelf and platform systems, and they are widely regarded as major benthic carbonate sediment producers. Specifically, the approach integrates both long established methods of quantifying rates of production by seagrass epiphytes (e.g., Nelsen and Ginsburg, 1986; Perry and Beavington-Penney, 2005) with the recently tested use of volume and CaCO3 content for quantifying production rates by the calcareous green algae Halimeda (Perry et al., 2016), and the results can then be combined with local (or published) metrics on algal/seagrass turnover rates to estimate CaCO3 production as a function of species abundance in different habitats. Similar applications of geometric shape have been used in the past to estimate biovolumes and surface areas of phytoplankton (Vadrucci et al., 2013), and to assess aspects of sponge (Santavy et al., 2013) and coral (Naumann et al., 2009) ecology because the data can be collected rapidly and non-invasively. Our analysis shows such approaches also have good potential for estimating production of CaCO3 sediment by plants.
Resultant data using these new approaches and scaled for seagrass/algal abundance and habitat extent suggest that a conservative estimate of carbonate sediment production by calcareous green algae and from seagrass epiphytes over the study area is ∼0.98 M kg CaCO3 yr−1. Additionally, data on the breakdown of plants suggest that > 55% of this carbonate is released post-mortem as carbonate mud (<63 μm fraction) and a further ∼28% as fine-grained sand. However, whilst these amounts seem large, they actually equate to an average production rate of only ∼7 g CaCO3 m−2 yr−1. This result reflects the fact that whilst some small areas of the platform have high seagrass/algal densities and result in high per unit area production estimates (∼238 g CaCO3 m−2 yr−1), very large areas of the platform are sparsely colonized by algae and/or seagrass (<10 plants/m2), and some areas are entirely devoid of algal/seagrass producers. In terms of understanding platform-scale sediment production, there is thus a clear need to account for such marked spatial variations in the abundance of benthic species that produce carbonate and the habitats they define. In particular, the presence or absence of extensive and dense Thalassia spp. meadows is likely to strongly influence rates of production, grain sizes and the proportions of different carbonate phases. These observations emphasize the need to understand habitat specific sources of sediment to more fully appreciate variations in both inter- and intra-shelf/platform sediment budget variations and, in the context of seagrass beds, further extend the idea that these ecosystem contribute critical ecosystem services (Orth et al., 2006; Mazarrasa et al., 2015).
Several previous studies have reported high sediment production rates from both epiphytes (Patriquin, 1972) and algal meadows (Multer, 1988), but often from systems with very high plant densities over large spatial areas. Eleuthera Bank is generally more sparsely colonized by seagrass than lagoonal and back-reef settings in other areas of the Bahamas and, indeed, the Caribbean. This difference may arise from the strong currents generated during ebb- and flood tides, but the key point is that it is inappropriate to assume that specific species always dominate production at the higher end of the rates previously reported in the literature. Indeed, if dense seagrass beds were absent from the present study area, the average rate of CaCO3 sediment production per unit area would fall even further (by ∼50%). This issue is interesting because of questions around the expansion or loss of coastal seagrass habitat under anthropogenic and environmental pressures (Waycott et al., 2009). For example, local nutrient enrichment from coastal urbanization has been reported to drive rapid expansion of seagrass extent (Udy et al., 1999), and this would have the potential to drive significant local increases in sediment production if epiphyte densities remain similar, although any such increases in epiphyte production may potentially be offset by nutrification-enhanced microbial CaCO3 sediment dissolution (Andersson, 2015), and as reported for back-reef seagrass beds in Florida (Brock et al., 2006). Conversely, deliberate removal of seagrass beds for reclamation or visual/tourist amenity reasons (Daby, 2003) would significantly reduce sediment production budgets. Changes in seagrass extent also may occur due to other environmental pressures, such as sea-level rise, and whilst modeling studies show divergent responses of seagrass extent under sea-level rise scenarios (Albert et al., 2017), the potential to change sediment generation rates markedly is clear.
An obvious question arising from the above data, however, relates to how realistic our production rate estimates are, and we make the following observations. In terms of production rates by seagrass epiphytes, we note that our estimates are in line with those from other studies using comparable approaches. For example, our estimates of epiphyte production per unit area average 96 g CaCO3 m−2 yr−1 and with average blade densities of 389 m−2. These rates are consistent with those calculated in Florida Bay (Nelsen and Ginsburg, 1986), where production rates averaged 118 g m−2 yr−1, a little above our rates, but from sites with higher average blade densities (670 m2). Relationships between blade density and rates of CaCO3 production are overall a little higher at our sites but this difference arises from the higher average weight of epiphytic carbonate per blade in our study (0.034 g v 0.026 g CaCO3/blade in Florida), and the increase in epiphytic carbonate with increased density of blades. We are thus confident that our epiphyte production rates are broadly consistent with those calculated using similar approaches elsewhere in the region.
In terms of calcareous algal production rates, direct like-for-like comparisons with past studies are hard due to methodological differences. In the present study, total rates of calcareous green algal production range from 1.4 g in the bare sand/sparse algal habitat to 12.4 g and 10.7 g CaCO3 m−2 yr−1 in, respectively, the medium and dense seagrass habitats (Table 2), and 12.2 g CaCO3 m−2 yr−1 in the hardground habitat,. While the studies available for comparison from the Caribbean inherently have different habitat configurations, algal densities, and used different or partially different methodologies, we note that average production rates from comparable depositional settings suggest our methodology delivers estimates consistent with these earlier studies. For example, data from lagoon settings (dominated by seagrass beds) in Florida Bay (Bach, 1979) calculated average calcareous green algal production rates (based on two different methodologies) of 10.3 g CaCO3 m−2 yr−1. Plant density data are not given but production rates were highest by Halimeda spp. (6.7 g), and with P. capitatus, R. phoenix and U. flabellum contributing 1.8 g, 1.6 g, and 0.3 g CaCO3 m−2 yr−1 respectively. These rates are very similar to the average rates we calculate for total green algal production in comparable (medium and dense) Thalassia seagrass habitats.
Several other studies do report both production rates and algal densities, and although average annual production rates by Halimeda spp. are significantly higher in these studies, these results are derived from sites with much higher average plant densities. Freile (2004), for example, report production by H. incrassata from sheltered (seagrass-dominated) lagoon habitats in San Salvador of 141.7 g CaCO3 m−2 yr−1, with average plant densities of 28 m−2, whilst Multer (1988) reports production/plant density averages for three sites in Antigua of 36 plants m−2 (114.3 g CaCO3 m−2 yr−1), 30 plants m−2 (62.1 g CaCO3 m−2 yr−1), and 26 plants m−2 (60.7 g CaCO3 m−2 yr−1). When differences in plant densities are taken into account, these rates are not dissimilar to those we present. Very detailed data have also been presented from shallow seagrass-dominated lagoon sites in Abaco, Bahamas across a range of the same green algal species considered here (Neumann and Land, 1975). Although between-site differences in plant sizes cannot be taken into account, we note that average measures of plant CaCO3 content (g/plant) are broadly similar to those we report: P. capitatus (this study 0.36 g v 0.27 g/plant), P. dumetosus (this study 0.42 g v 0.40 g/plant), R. phoenix (this study 0.30 g v 0.41 g/plant), and U. flabellum (this study 0.11 g v 0.23 g/plant). On the basis of these comparisons, and despite differences between sites in terms of additional confounding factors (wave energy, local environmental parameters), we are confident that the rates generated by combining the census-based approach with species specific geometric volume to carbonate content relationships provides a valid approach for estimating rates of algal and epiphyte-derived CaCO3 production.
Equally relevant here is the observation that variations in species presence and abundance will result in both variable rates of production of CaCO3 sediment between sites and marked differences in the carbonate phases (aragonite, HMC, LMC) produced. Whilst such differences at the wider shelf and platform scale have previously been discussed (Matthews, 1966; Husseini and Matthews, 1972) data on habitat-specific production of sediment mineralogies are sparse. Here, we have shown that sites where green algae are the dominant elements of the benthic community (fringing mangroves, hardground and bare sand/sparse algal habitats) are predicted to produce predominantly aragonite-rich sediment. In contrast, in seagrass-dominated habitats, and as seagrass densities increase, so the proportion of HMC produced increases, such that aragonite is a secondary component of the sediment production in these habitats. On this basis, one might thus expect clear, habitat-specific, patterns to emerge in terms of sediment mineralogical compositions.
However, over the habitat scales we have studied, our data indicates markedly uniform sediment mineralogical compositions, with the proportion of aragonite to HMC in the sediment accumulating across most of the habitats being in the range of 2:1 (Figure 7 and Table 1). Exceptions are the inner muddy bioturbated embayment of Rock Sound and the dense seagrass beds where the ratio of aragonite to HMC is much higher. In essence, this result means that the sediments accumulating beneath the seagrass beds contain a much higher proportion of aragonite than would be expected from calculations of production by green algae and seagrass, whilst surrounding habitats dominated by calcareous green algae have higher proportions of HMC. In combination, these results suggest that dilution or homogenization of sediments is occurring, and three particularly significant contributing factors can be identified; (1) sedimentary inputs from other sources; (2) post-depositional recrystallization and dissolution; and (3) the effects of physical sediment working and transport. These factors are relevant to understanding not only the relative importance of calcareous green algae and seagrass epiphytes in budgets for production of carbonate sediment, but also may explain why algae and seagrass epiphytes may play relatively small roles in rates of sediment generation across larger areas of some depositional systems, despite being visually obvious.
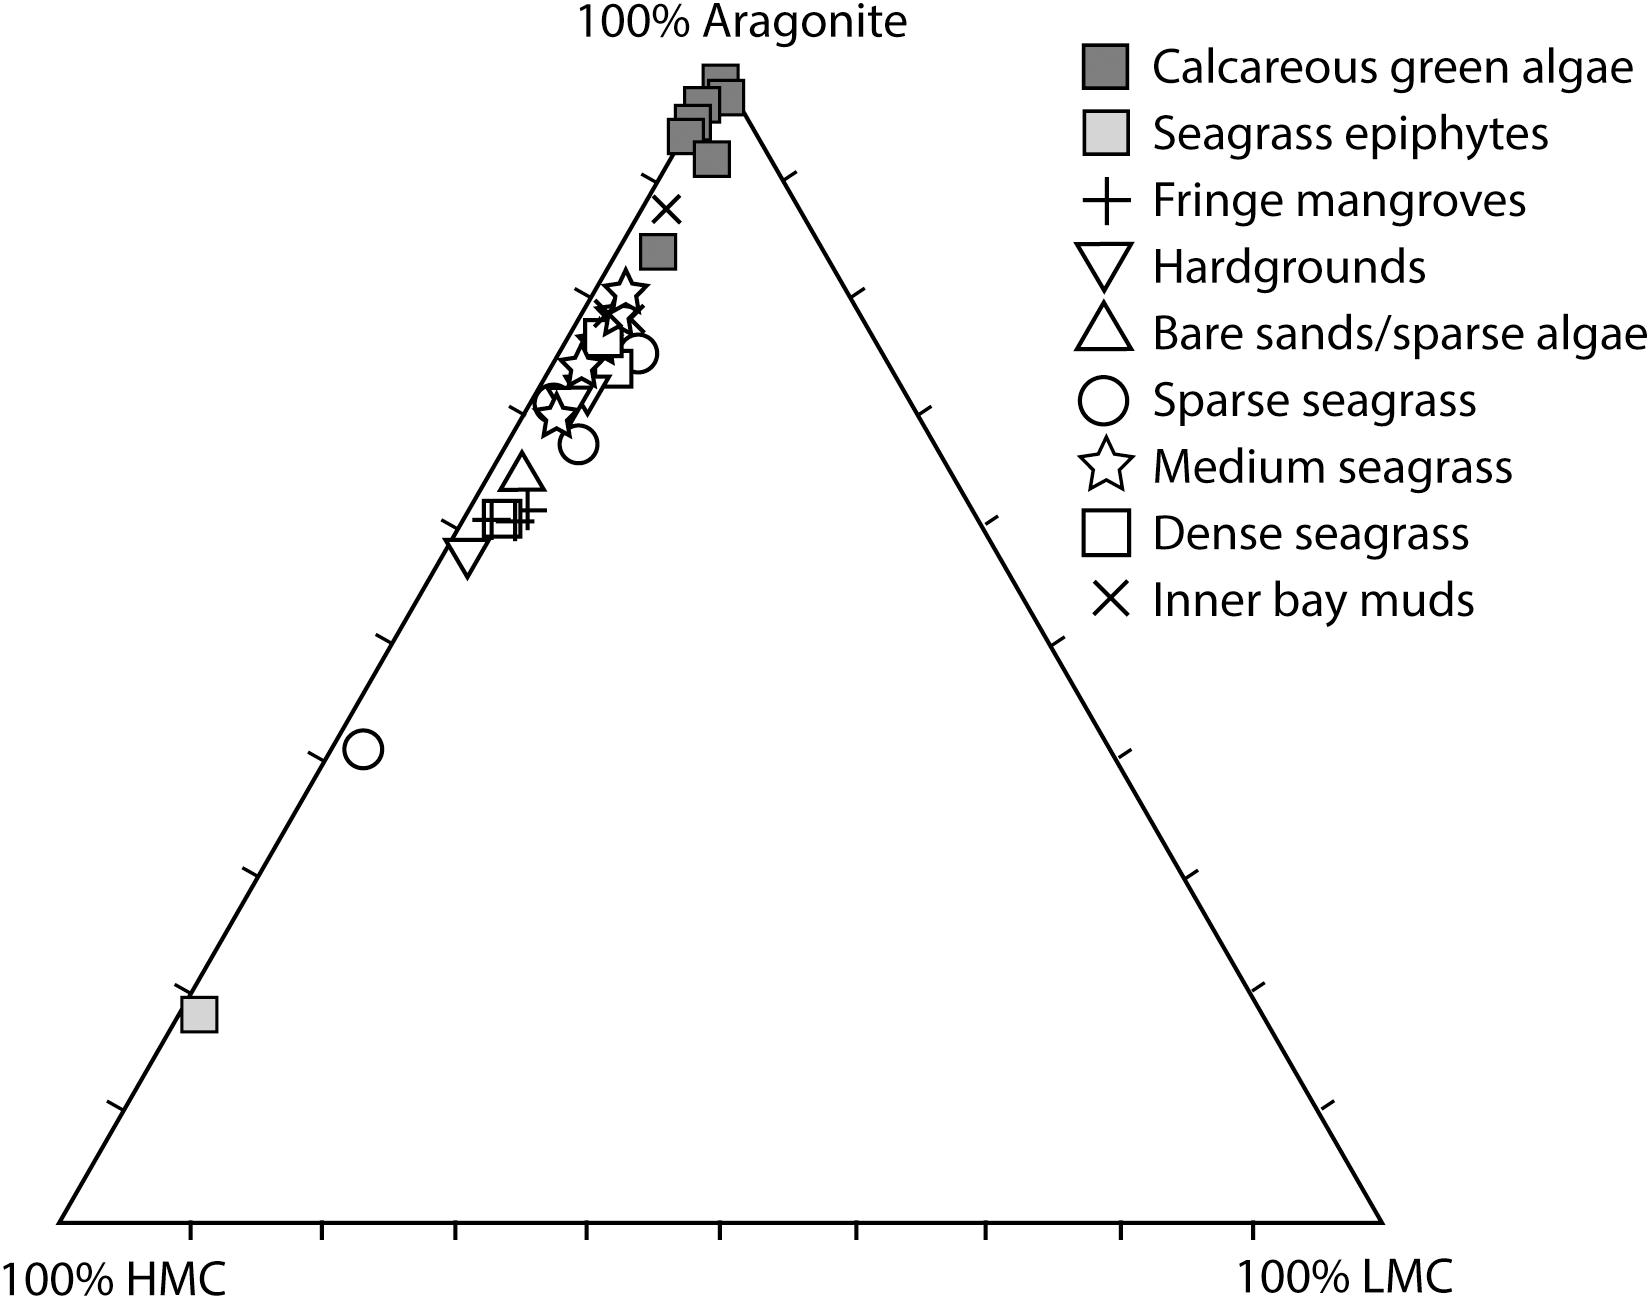
Figure 7. Ternary plot showing the measured proportions of aragonite : high Mg-calcite (HMC) : low Mg-calcite (LMC) in calcareous green algae (all species) and seagrass epiphytes against the mineralogies of sediments from each of the major habitat types across Eleuthera Bank.
In terms of additional sediment inputs, a number of potential contributing sources can be identified. These include fine-grained carbonates derived from “whitings” (suspended lime muds) (Shinn et al., 1989; Robbins et al., 1997), with Shinn et al. (1989) estimating that whitings on the Great Bahama Bank generated ∼8 g CaCO3 m−2 yr−1, and comprise ∼85% aragonite and ∼12% HMC sediment. We note that such rates are around the mean for algal carbonate production across our sites, so such inputs could well represent an important additional input of aragonite-rich sediment. Additional benthic biogenic sediment also derives from the post-mortem abrasion and breakdown of molluscan shells and from foraminifera, with the shells of bivalves comprising species-specific layers of either aragonite, or both aragonite and calcite (Chave, 1962), and foraminifera typically comprising LMC or HMC (Chave, 1962). Recent work also points to locally significant amounts of fine grained CaCO3 being produced intestinally by fish. These carbonates are mostly < 10 μm in size, are dominated (∼60%) by HMC carbonate phases, with estimates of production in the Bahamas being locally as high as 16.7 g CaCO3 m−2 yr−1 (but averaging < 1 g when habitats devoid of high fish biomass are included) (Salter et al., 2017). Significant amounts of fine-grained and aragonite-rich sediment reportedly can be precipitated directly by Thalassia seagrass inside their blades (Enriquez and Schubert, 2014) and, if applicable to seagrass beds in Eleuthera, such processes could help explain the evident disparity between the HMC-dominated epiphyte production and the dominance of aragonite in the seagrass bed sediments. Most importantly however, in terms of understanding system scale rates and types of carbonate sediment production, these observations clearly show that whilst calcareous algae and epiphytes can contribute large amounts of sediment locally, other sources of carbonate can be equally, or more important, both across the more sparsely colonized areas of such shelf and platform systems and even potentially within the seagrass beds where epiphyte production dominates. Thus, a picture of highly divergent inter-habitat sediment production regimes emerges.
Equally important in terms of the mineralogical composition of the accumulating sediments will be the effects of post-depositional sediment diagenesis and reworking. Reid et al. (1992) showed that widespread post-deposition abrasion, bioerosion, and micritization of skeletal grains can result in primary skeletal forms and mineralogies being rapidly altered, whilst rapid recrystallization of aragonite in calcareous algae to HMC has also been documented (Macintyre and Reid, 1995). Furthermore, it has been shown that net sediment dissolution can occur in some sediment-dominated platform systems (Andersson, 2015; Eyre et al., 2018) and, if this results in the preferential loss of specific carbonate phases, it could further explain some of the sediment homogenization we observe. Equally important in systems like Eleuthera, which experience strong ebb- and flood-tide currents (Dravis, 1979; Salter et al., 2014), will be the entrainment and reworking of sediments, moving material both on- and off-platform. This transport may well be a major factor influencing sediment accumulation across Eleuthera Bank given the clear homogeneity we observe in sediment mineralogy. The abundance of aragonite in the sediment in the denser seagrass beds (which mainly produce HMC-rich carbonates) and the predominance of fine-grained aragonite rich sediments in Rock Sound itself, which is essentially devoid of algal carbonates, are suggestive of these transport processes being important.
Conclusion
Methodologies to support estimates of shallow tropical marine sediment production are limited, and this major knowledge gap is important for reasons that include the supply of sediment to shorelines and islands. Here, we present a methodology designed to support estimates of the rates, grain sizes and mineralogies of carbonate sediment generated by several species of calcareous green algae and by seagrass epiphytes that are ubiquitous substrate colonizers across many tropical and sub-tropical marine systems. This method is based on the use of readily measurable dimensions of plants, thus allowing habitat-scale estimates of sediment production by each species that can then be integrated with estimates of production from other sources (see Perry et al., 2015) to quantify total carbonate sediment budgets for different habitats and systems. The specific findings of this study point to major inter-habitat differences in rates and types of algal and seagrass epiphyte-derived sediment production, with large areas of the study area actually having very low per unit area production rates (<10 g CaCO3 m−2 yr−1). In contrast, spatially restricted dense seagrass beds produce carbonate at high rates (>230 g CaCO3 m−2 yr−1). This observation, of a disproportionately important role of seagrass beds in sediment generation, has direct relevance to emerging ideas about rates of habitat loss or change. Seagrass beds specifically are, for example, threatened by direct removal/dredging, but may also experience expansion under nutrient enrichment. Methodologies, such as those presented here, have the potential to contribute to our understanding of the impacts of such changes because seagrass and algal meadows commonly co-exist and represent important benthic carbonate sediment producers in such systems.
Author Contributions
CP secured the project funding. All authors carried out the field work. CP and MS analyzed the data. All authors prepared the manuscript and gave their final approval for publication.
Funding
This work was funded by a UK Natural Environment Research Council Grant NE/K003143/1 to CP and through the generous support of the Earthwatch Institute to AH.
Conflict of Interest Statement
The authors declare that the research was conducted in the absence of any commercial or financial relationships that could be construed as a potential conflict of interest.
Acknowledgments
We wish to acknowledge the support and assistance of the staff at Cape Eleuthera Institute. We would like to thank R. Fidler for help with map production. Constructive comments from the two reviewers significantly improved this manuscript. This is contribution #122 from the Center for Coastal Oceans Research in the Institute for Water and Environment at Florida International University.
Supplementary Material
The Supplementary Material for this article can be found online at: https://www.frontiersin.org/articles/10.3389/fmars.2019.00120/full#supplementary-material
FIGURE S1 | Images showing the new growth above Alizarin Red stain line in (A) Halimeda incrassata; (B) Penicilllus dumetosus; and (C) Udotea flabellum. All after 10 days of post-staining growth.
TABLE S1 | Transect level estimates of carbonate production by each green algal species and by seagrass epiphytes.
TABLE S2 | Relative % contributions to different sediment grain size fractions by each algal species and by seagrass epiphytes following breakdown experiments. n = 3 per species (except for Thalassia epiphytes which was based on a single bulk sample).
References
Albert, S., Saunders, M. I., Roelfsema, C. M., Leon, J. X., Johnstone, E., Mackenzie, J. R., et al. (2017). Winners and losers as mangrove, coral and seagrass ecosystems respond to sea-level rise in Solomon Islands. Environ. Res. Lett. 12:094009. doi: 10.1088/1748-9326/aa7e68
Andersson, A. (2015). A fundamental paradigm for coral reef carbonate sediment dissolution. Front. Mar. Sci. 2:52. doi: 10.3389/fmars.2015.00052
Atkinson, M. J., and Grigg, R. W. (1984). Model of a coral reef ecosystem. Coral Reefs 3, 13–22. doi: 10.1007/BF00306136
Bach, S. (1979). Standing crop, growth and production of calcareous Siphonales (Chlorophyta) in a south Florida lagoon. Bull. Mar. Sci. 29, 191–201.
Bellwood, D. (1996). Production and reworking of sediment by parrotfishes (family Scaridae) on the great barrier reef, Australia. Mar. Biol. 125, 795–800. doi: 10.1007/BF00349262
Berelson, W. M., Balch, W. M., Najjar, R., Feely, R. A., Sabine, C., and Lee, K. (2007). Relating estimates of CaCO3 production, export, and dissolution in the water column to measurements of CaCO3 rain into sediment traps and dissolution on the sea floor: a revised global carbonate budget. Glob. Biogeochem. Cycles 21:GB1024. doi: 10.1029/2006GB002803
Bischoff, W., Bishop, F., and Mackenzie, F. (1983). Biogenically produced magnesian calcite: inhomogeneities in chemical and physical properties; comparison with synthetic phases. Am. Mineral. 68, 1183–1188.
Bosence, D., Rowlands, R., and Ml, Q. (1985). Carbonate budget Florida mud mound. Sedimentology 32, 317–343. doi: 10.1111/j.1365-3091.1985.tb00515.x
Braithwaite, C. (1973). Settling behaviour related to sieve analysis of skeletal sands. Sedimentology 20, 251–262. doi: 10.1111/j.1365-3091.1973.tb02048.x
Brock, J., Yates, K., Halley, R., Kuffner, I., Wright, C., and Hatcher, B. (2006). Northern Florida reef tract benthic metabolism scaled by remote sensing. Mar. Ecol. Prog. Ser. 312, 123–139. doi: 10.3354/meps312123
Chave, K. E. (1962). Factors influencing the mineralogy of carbonate sediments. Limnol. Oceanogr. 7, 218–223. doi: 10.4319/lo.1962.7.2.0218
Corlett, H., and Jones, B. (2007). Epiphyte communities on Thalassia testudinum from Grand Cayman, British West Indies: their composition, structure, and contribution to lagoonal sediments. Sediment. Geol. 194, 245–262. doi: 10.1016/j.sedgeo.2006.06.010
Courtney, T. A., Andersson, A. J., Bates, N. R., Collins, A., Cyronak, T., De Putron, S. J., et al. (2016). Comparing chemistry and census-based estimates of net ecosystem calcification on a rim reef in Bermuda. Front. Mar. Sci. 3:181. doi: 10.3389/fmars.2016.00181
Daby, D. (2003). Effects of seagrass bed removal for tourism purposes in a Mauritian bay. Environ. Pollut. 125, 313–324. doi: 10.1016/S0269-7491(03)00125-8
Davies, T., and Hooper, P. (1963). The determination of the calcite:aragonite ratio in mollusc shells by X-ray diffraction. Mineral. Magaz. 33, 608–612.
Doo, S., Hamylton, S., and Bryne, M. (2012). Reef-scale assessment of intertidal large benthic foraminifera populations on one tree island, great barrier reef and their future carbonate production potential in a warming ocean. Zool. Stud. 51, 1298–1307.
Dravis, J. (1979). Rapid and widespread generation of recent oolitic hardgrounds on a high energy Bahamian platform, Eleuthera bank, Bahamas. J. Sediment. Petrol. 49, 195–208.
Enriquez, S., and Schubert, N. (2014). Direct contribution of the seagrass Thalassia testudinum to lime mud production. Nat. Commun. 5:3835. doi: 10.1038/ncomms4835
Eyre, B., Cyronak, T., Drupp, P., Heinen, E., De Carlo, T., Sachs, J., et al. (2018). Coral reefs will transition to net dissolving before end of century. Science 359, 908–911. doi: 10.1126/science.aao1118
Flugel, E. (2004). Microfacies of Carbonate Rocks. Berlin: Springer-Verlag. doi: 10.1007/978-3-662-08726-8
Ford, M. R., and Kench, P. S. (2012). The durability of bioclastic sediments and implications for coral reef deposit formation. Sedimentology 59, 830–842. doi: 10.1111/j.1365-3091.2011.01281.x
Frankovich, T., and Zieman, J. (1995). A comparison of methods for the accurate measurement of epiphytic carbonate. Coast. Estuar. Res. 18, 279–284. doi: 10.2307/1352639
Freile, D. (2004). “Carbonate productivity rates of Halimeda in two different locations,” in Proceedings of the 11th Symposium of the Geology of the Bahamas and Other Regions, eds R. D. Lewis and B. C. Panuska (San Salvador: Gerace Research Center), 95–106.
Friele, D., and Hillis, L. (1997). “Carbonate productivity by Halimeda incrassata in a land proximal lagoon, Pico Feo, San Blas, Panama,” in Proceedings of the 8th International Coral Reef Symposium, eds H. A. Lessios and I. G. Macintyre (Panama: Smithsonian Tropical Research Institute), 767–772.
Gischler, E., and Zingeler, D. (2016). The origin of carbonate mud in isolated carbonate platforms of Belize, Central America. Int. J. Earth Sci. 91, 1054–1070. doi: 10.1007/s00531-002-0288-5
Goldsmith, J., Graf, D., and Hc, H. (1961). Lattice constants of the calcium-magnesium carbonates. Am. Mineral. 46, 453–457.
Green, E. P., Mumby, P. J., Edwards, A. J., and Clark, C. D. (2000). Remote Sensing Handbook for Tropical Coastal Management. Paris: UNESCO.
Harborne, A. R., Selwyn, J. D., Lawson, J. M., and Gallo, M. (2017). Environmental drivers of diurnal visits by transient predatory fishes to Caribbean patch reefs. J. Fish Biol. 90, 265–282. doi: 10.1111/jfb.13180
Husseini, S., and Matthews, R. (1972). Distribution of high-magnesium calcite in lime muds of the Great Bahama bank: diagenetic implications. J. Sediment. Petrol. 42, 179–182.
Land, L. (1970). Carbonate mud: production by epibiont growth on Thalassia testudinum. J. Sediment. Petrol. 40, 1361–1363. doi: 10.1306/74D721B7-2B21-11D7-8648000102C1865D
Lowenstam, H. (1955). Aragonite needles secreted by algae and some sedimentary implications. J. Sediment. Petrol. 25, 270–272.
Macintyre, I. G., and Reid, R. P. (1995). Crystal alteration in a living calcareous alga (Halimeda): implications for studies in skeletal diagensis. J. Sediment. Res. 65, 143–153.
Matthews, R. (1966). Genesis of recent lime mud in southern British Honduras. J. Sediment. Petrol. 36, 428–454. doi: 10.1306/74D714DD-2B21-11D7-8648000102C1865D
Mazarrasa, I., Marbà, N., Lovelock, C. E., Serrano, O., Lavery, P. S., Fourqurean, J. W., et al. (2015). Seagrass meadows as a globally significant carbonate reservoir. Biogeosci. Discuss. 12, 4107–4138. doi: 10.5194/bgd-12-4107-2015
Milliman, J., and Droxler, A. (1996). Neritic and pelagic carbonate sedimentation in the marine environment: ignorance is not bliss. Geol. Rundsch. 85, 496–504. doi: 10.1007/BF02369004
Multer, G. (1988). Growth rate, ultrastructure and sediment contribution of Halimeda incrassata and Halimeda monile, Nonsuch and Falmouth Bays, Antigua, W.I. Coral Reefs 6, 179–186. doi: 10.1007/BF00302014
Naumann, M. S., Niggl, W., Laforsch, C., Glaser, C., and Wild, C. (2009). Coral surface area quantification–evaluation of established techniques by comparison with computer tomography. Coral Reefs 28, 109–117. doi: 10.1007/s00338-008-0459-3
Nelsen, J., and Ginsburg, R. N. (1986). Calcium carbonate production by epibionts on Thalassia in Florida Bay. J. Sediment. Petrol. 56, 622–628.
Neumann, A., and Land, L. (1975). Lime mud deposition and calcareous algae in the bight of Abaco, Bahamas: a budget. J. Sediment. Petrol. 45, 763–786.
Newell, N. D., Purdy, E. G., and Imbrie, J. (1960). Bahamian oolitic sand. J. Geol. 68, 481–497. doi: 10.1086/626683
Orth, R., Carruthers, T., Dennison, W., Duarte, C., Fourqurean, J., Heck, K., et al. (2006). A global crisis for seagrass ecosystems. BioScience 56, 987–996. doi: 10.1641/0006-3568(2006)56[987:AGCFSE]2.0.CO;2
Patriquin, D. (1972). Carbonate mud production by epibionts on Thalassia: an estimate based on leaf growth rate data. J. Sediment. Petrol. 42, 687–689.
Payri, C. (1988). Halimeda contribution to organic and inorganic production in a Tahitian reef system. Coral Reefs 6, 251–262. doi: 10.1007/BF00302021
Perry, C. (1998). Grain susceptibility to the effects of microboring: implications for the preservation of skeletal carbonate. Sedimentology 45, 39–51. doi: 10.1046/j.1365-3091.1998.00134.x
Perry, C. (2000). Factors controlling sediment preservation on a north Jamaican fringing reef: a process-based approach to microfacies analysis. J. Sediment. Res. 70, 633–648. doi: 10.1306/2DC4092D-0E47-11D7-8643000102C1865D
Perry, C. T., and Beavington-Penney, S. J. (2005). Epiphytic calcium carbonate production and facies development within sub-tropical seagrass beds, Inhaca Island, Mozambique. Sediment. Geol. 174, 161–176. doi: 10.1016/j.sedgeo.2004.12.003
Perry, C. T., Kench, P. S., O’Leary, M. J., Morgan, K. M., and Januchowski-Hartley, F. (2015). Linking reef ecology to island building: parrotfish identified as major producers of island-building sediment in the Maldives. Geology 43, 503–506. doi: 10.1130/G36623.1
Perry, C. T., Morgan, K. M., and Salter, M. A. (2016). Sediment generation by Halimeda on atoll interior coral reefs of the southern Maldives: a census-based approach for estimating carbonate production by calcareous green algae. Sediment. Geol. 346, 17–24. doi: 10.1016/j.sedgeo.2016.10.005
Perry, C. T., Morgan, K. M., and Yarlett, R. T. (2017). Reef habitat type and spatial extent as interacting controls on platform-scale carbonate budgets. Front. Mar. Sci. 4:185. doi: 10.3389/fmars.2017.00185
Perry, C. T., Salter, M. A., Harborne, A. R., Crowley, S. F., Jelks, H. L., and Wilson, R. W. (2011). Fish as major carbonate mud producers and missing components of the tropical carbonate factory. Proc. Natl. Acad. Sci. U.S.A. 108, 3865–3869. doi: 10.1073/pnas.1015895108
Reid, R., Macintyre, I. G., and Post, J. (1992). Micritized skeletal grains in northern Belize lagoon: a major source of Mg-calcite mud. J. Sediment. Petrol. 62, 145–156.
Robbins, L., Tao, Y., and Evans, C. (1997). Temporal and spatial distribution of whitings on great Bahama bank and a new lime mud budget. Geology 25, 947–950. doi: 10.1130/0091-7613(1997)025<0947:TASDOW>2.3.CO;2
Salter, M. A., Harborne, A. R., Perry, C. T., and Wilson, R. W. (2017). Phase heterogeneity in carbonate production by marine fish influences their roles in sediment generation and the inorganic carbon cycle. Sci. Rep. 7:765. doi: 10.1038/s41598-017-00787-4
Salter, M. A., Perry, C. T., Stuart-Smith, R. D., Edgar, G. J., Wilson, R. W., and Harborne, A. R. (2018). Reef fish carbonate production assessments highlight regional variation in sedimentary significance. Geology 46, 699–702. doi: 10.1130/G45286.1
Salter, M. A., Perry, C. T., and Wilson, R. W. (2012). Production of mud-grade carbonates by marine fish: crystalline products and their sedimentary significance. Sedimentology 59, 2172–2198. doi: 10.1111/j.1365-3091.2012.01339.x
Salter, M. A., Perry, C. T., and Wilson, R. W. (2014). Size fraction analysis of fish-derived carbonates in shallow sub-tropical marine environments and a potentially unrecognised origin for peloidal carbonates. Sediment. Geol. 314, 17–30. doi: 10.1016/j.sedgeo.2014.10.005
Santavy, D. L., Courtney, L. A., Fisher, W. S., Quarles, R. L., and Jordan, S. J. (2013). Estimating surface area of sponges and gorgonians as indicators of habitat availability on Caribbean coral reefs. Hydrobiologia 707, 1–16. doi: 10.1007/s10750-012-1359-7
Sepulcre, S., Durand, N., and Bard, E. (2009). Mineralogical determination of reef and periplatform carbonates: calibration and implications for paleoceanography and radiochronology. Glob. Planet. Change 66, 1–9. doi: 10.1016/j.gloplacha.2008.07.008
Shinn, E., Steinen, R., Lidz, B., and Swart, P. (1989). Whitings: a sedimentological dilema. J. Sediment. Petrol. 59, 147–161. doi: 10.1306/212F8F3A-2B24-11D7-8648000102C1865D
Udy, J., Dennison, W., Long, W., and Mckenzie, L. (1999). Responses of seagrass to nutrients in the great barrier reef, Australia. Mar. Ecol. Prog. Ser. 185, 257–271. doi: 10.3354/meps185257
Vadrucci, M. R., Mazziotti, C., and Fiocca, A. (2013). Cell biovolume and surface area in phytoplankton of Mediterranean transitional water ecosystems: methodological aspects. Transit. Water. Bull. 7, 100–123.
Vroom, P., Smith, C., Coyer, J., Walters, L., Hunter, C., Beach, K., et al. (2003). Field biology of Halimeda tuna (Bryopsidales, Chlorophyta) across a depth gradient: comparative growth, survivorship, recruitment, and reproduction. Hydrobiologia 501, 149–166. doi: 10.1023/A:1026287816324
Walters, L., Bischoff, S., Patterson, W., and Lyons, T. (1993). Dissolution and recrystallization in modern shelf carbonates: evidence from pore water and solid phase chemistry. Philos. Trans. R. Soc. Lond. A 344, 27–36. doi: 10.1098/rsta.1993.0072
Walters, L., and Morse, J. (1984). Reactive surface area of skeletal carbonates during dissolution: effect of grain size. J. Sediment. Petrol. 54,1081–1090.
Keywords: carbonate budgets, carbonate sediments, calcareous algae, Halimeda, seagrass, biovolumes
Citation: Perry CT, Salter MA, Morgan KM and Harborne AR (2019) Census Estimates of Algal and Epiphytic Carbonate Production Highlight Tropical Seagrass Meadows as Sediment Production Hotspots. Front. Mar. Sci. 6:120. doi: 10.3389/fmars.2019.00120
Received: 16 November 2018; Accepted: 27 February 2019;
Published: 09 April 2019.
Edited by:
Eric Jeremy Hochberg, Bermuda Institute of Ocean Sciences, BermudaReviewed by:
Travis Courtney, University of California, San Diego, United StatesCharles Alan Jacoby, St. Johns River Water Management District, United States
Copyright © 2019 Perry, Salter, Morgan and Harborne. This is an open-access article distributed under the terms of the Creative Commons Attribution License (CC BY). The use, distribution or reproduction in other forums is permitted, provided the original author(s) and the copyright owner(s) are credited and that the original publication in this journal is cited, in accordance with accepted academic practice. No use, distribution or reproduction is permitted which does not comply with these terms.
*Correspondence: Chris T. Perry, Yy5wZXJyeUBleGV0ZXIuYWMudWs=