 Ge Chen1,2*
 Junwu Tang1
 Chaofang Zhao1,2Songhua Wu1,2Fangjie Yu1,2Chunyong Ma1,2Yongsheng Xu3Weibiao Chen4Yunhua Zhang5Jie Liu6Lixin Wu1,2
- 1Qingdao National Laboratory for Marine Science and Technology, Qingdao, China
- 2Department of Marine Technology, Ocean University of China, Qingdao, China
- 3Institute of Oceanology, Chinese Academy of Sciences, Qingdao, China
- 4Shanghai Institute of Optics and Fine Mechanics, Chinese Academy of Sciences, Shanghai, China
- 5National Space Science Center, Chinese Academy of Sciences, Beijing, China
- 6Beijing Institute of Spacecraft System Engineering, China Academy of Space Technology, Beijing, China
Among the various challenges that spaceborne radar observations of the ocean face, the following two issues are probably of a higher priority: inadequate dynamic resolution, and ineffective vertical penetration. It is therefore the vision of the National Laboratory for Marine Science and Technology of China that two highly anticipated breakthroughs in the coming decade are likely to be associated with radar interferometry and ocean lidar (OL) technology, which are expected to make a substantial contribution to a submesoscale-resolving and depth-resolving observation of the ocean. As an expanded follow-up of SWOT and an oceanic counterpart of CALIPSO, the planned “Guanlan” science mission comprises a dual-frequency (Ku and Ka) interferometric altimetry (IA), and a near-nadir pointing OL. Such an unprecedented combination of sensor systems has at least three prominent advantages. (i) The dual-frequency IA ensures a wider swath and a shorter repeat cycle which leads to a significantly improved temporal and spatial resolution up to days and kilometers. (ii) The first spaceborne active OL ensures a deeper penetration depth and an all-time detection which leads to a layered characterization of the optical properties of the subsurface ocean, while also serving as a near-nadir altimeter measuring vertical velocities associated with the divergence, and convergence of geostrophic eddy motions in the mixed layer. (iii) The simultaneous functioning of the IA/OL system allows for an enhanced correction of the contamination effects of the atmosphere and the air-sea interface, which in turn considerably reduces the error budgets of the two sensors. As a result, the integrated IA/OL payload is expected to resolve the ocean variability at submeso and sub-week scales with a centimeter-level accuracy, while also partially revealing marine life systems and ecosystems with a 10-m vertical interval in the euphotic layer, moving a significant step forward toward a “transparent ocean” down to the vicinity of the thermocline, both dynamically and bio-optically.
Introduction
Since the advent of ocean radar satellite in the 1970s (Fu et al., 2010), its development has followed three generic trends: (i) better sampling, (ii) higher accuracy, and (iii) more variables. Better sampling of the ocean normally refers to a broader coverage, a deeper penetration, a higher spatiotemporal resolution, and a longer time series. Upgraded sensors with refined algorithms (both theoretical and empirical) are major approaches aimed at improving the accuracy of remotely sensed parameters. Meanwhile, tremendous efforts have been devoted to testing new instrument (e.g., ocean lidar) and deriving new variables from spaceborne measurements. Ideally, the ultimate goal of ocean remote sensing is toward a quantitative derivation of all required variables, with a satisfactory accuracy, and a perfect sampling in near-real time. In reality, however, this can never be fully realized, but can always be gradually approached. In this white paper, the concept design of the Chinese Guanlan science mission with an interferometric altimeter (IA) and an ocean lidar (OL) onboard is described. We will demonstrate that the IA payload is expected to make a significant contribution to satellite altimetry in aspects of the above-mentioned trends (i) and (ii), while the OL payload is a good example of expanding remote sensing capacity in aspects of those trends mentioned in (i) and (iii).
Satellite Altimetry
The history of satellite altimetry can be largely divided into three phases as summarized in Table 1. (i) Phase I (1970–1980s): the mesoscale “diamond” phase; (ii) Phase II (1990–2010s): the semimesoscale “grid” phase; (iii) Phase III (2020s onward): the submesoscale “pixel” phase. Here we use three keywords to characterize the major geographical pattern of altimeter data products for each phase, which corresponds to an overall spatial resolution of ∼100 km, ∼50 km, and ∼10 km, respectively. In Phase I, traditional altimeters in exact-repeat orbits measure sea surface height (SSH) along intersecting ground tracks every 3/17 days (e.g., Fu, 1983). The regions between tracks (normally ∼1.5° along the equator) form a diamond pattern within which SSH is never sampled. In Phase II, the idea of “virtual constellation” of multiple altimeters operating simultaneously considerably improve the sampling, leading to the construction of a gridded SSH product (mostly 0.25° × 0.25°) on a daily basis (e.g., Ducet et al., 2000; Pujol et al., 2016). In the upcoming Phase III, wide-swath IAs will hopefully “image” the sea surface topography with a “pixel” size of less than 10 km × 10 km every 1–3 days (e.g., Fu and Ferrari, 2013).
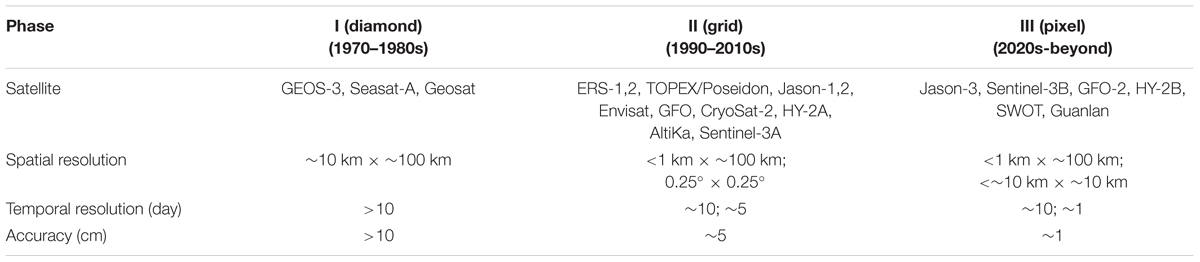
Table 1. Three phases of development for satellite altimetry.
The accuracy of sea level measurements has also been steadily improving from >10 cm to <5 cm throughout the past half century and will probably reach the level of ∼1 cm in the next decade. The combination of refined sampling and improved accuracy, as well as increasing time series, has naturally brought about continuous, sometimes critical, progress in dynamic oceanography. In the “diamond” phase, the technological feasibility, and scientific utility of satellite altimetry has been demonstrated by the GEOS-3, Seasat and Geosat missions, from which many interesting yet semi-quantitative results, such as signatures of basin scale ocean gyres, the Antarctic Circumpolar Current, as well as mesoscale ocean variabilities, have been obtained (e.g., Fu, 1983).
In the “grid” phase that followed, the contributions of satellite altimetry to ocean sciences are quantitative and substantial, while some are regarded as fundamental and even revolutionary. Typical examples include the systematic observation and a better understanding of ocean circulation, the Rossby wave, and the mesoscale eddy. First, altimetrically determined ocean topography has provided the first test bed for examining the performance of global ocean general circulation models at large scales (∼5 cm rms for wavelengths longer than 1000 km), although its further improvement requires more accurate geoid knowledge over a wide range of scales (Fu and Chelton, 2001). Second, altimetric measurements of SSH reveal a persistent westward propagation with characteristics similar to the linear Rossby waves by which the ocean adjusts to wind and thermal forcing (Chelton and Schlax, 1996), though it is now evident that the variability due to Rossby waves are only significant at wavelengths of ∼1000 km and longer (Scott et al., 2010). Third, most of the extratropical variability at wavelengths of ∼100-500 km, previously thought to be linear baroclinic Rossby waves, is actually westward propagating non-linear eddies that are nearly ubiquitous in the world oceans (Chelton et al., 2011b).
As the first planned mission of its kind in the upcoming “pixel” phase, the surface water and ocean topography (SWOT) satellite aims to measure both the land water and ocean topography with an unprecedented horizontal resolution (Fu and Ubelmann, 2014). The SWOT satellite will carry a Ka-band radar interferometer, designed to yield high spatial resolutions over two swaths of 50 km, with a 20-km gap centered at the nadir track (Durand et al., 2010). The primary oceanographic objective of SWOT is to characterize the ocean mesoscale and submesoscale circulation at spatial resolutions of ∼10 km and larger. It will also contribute to estimating the vertical motion of the ocean, taking place at scales of 10–100 km, which is important to the understanding of the energy balance of ocean circulation (Capet et al., 2008).
The progress of altimeter based dynamic oceanography has actually been accompanied by debates and controversies. Many of the problems arise due to imperfect (sometimes poor) sampling and inappropriate SSH reconstruction. Much of the hope to tackle these challenges lies in the launch of the next generation IAs, including the upcoming SWOT satellite, and the one that will be flown on our proposed Guanlan mission, which will advance sea level observation from the “grid” phase to the “pixel” phase, and the altimetric oceanography from a mesoscale period to a submesoscale era, when the corresponding levels of dynamic variability in the ocean energy cascade can be effectively resolved.
Spaceborne Lidar
As a pioneer of spaceborne lidar, the US space agency NASA (National Aeronautics and Space Administration) initiated the Lidar In-Space Technology Experiment (LITE) in 1988 (Winker et al., 1996). Following a successful feasibility study with an aerosol and cloud lidar onboard the Space Shuttle of Discovery in 1994, NASA and the French space agency CNES (Centre National d’Etudes Spatiales) launched their joint mission of CALIPSO (Cloud Aerosol Lidar and Infrared Pathfinder Satellite Observation) in 2006 (Winker et al., 2010), which transformed the satellite lidar technology from experimental to operational. In the years that followed, a dozen spaceborne lidars have been proposed by several national and international space agencies such as NASA and ESA (European Space Agency).
As a key element of the Aqua constellation (A-train), CALIPSO has three co-aligned major instruments (Winker et al., 2009): A 3-channel lidar (the Cloud-Aerosol Lidar with Orthogonal Polarization, CALIOP), an imaging infrared radiometer, and a wide-field camera. The primary goals of the CALIPSO mission include: (i) Observationally based estimates of direct and indirect aerosol radiative forcing; (ii) Improved characterization of surface longwave radiative fluxes and atmospheric heating rates; (iii) Improved model parameterizations of cloud-climate feedbacks. In short, the main purpose of CALIPSO is to provide a long-term mapping of the horizontal and vertical distributions of aerosol and cloud properties over the entire globe.
Despite of its atmosphere-climate oriented nature, the CALIPSO mission has provided valuable by-products for oceanographic studies throughout the past decade (see Hostetler et al. (2018) for a recent review). Behrenfeld et al. (2013) used CALIOP measurements to quantify global ocean phytoplankton biomass and total particulate organic carbon stocks. Lu et al. (2014) found significant relationships between integrated subsurface backscatter and chlorophyll-a concentration, as well as particulate organic carbon, which indicate a potential use of the CALIPSO lidar to estimate global chlorophyll-a and particulate organic carbon concentrations. Lu et al. (2016) introduced an approach to estimate the ocean subsurface layer-integrated backscatter and particulate backscattering coefficient from CALIOP 30° off-nadir lidar measurements. Behrenfeld et al. (2017) reported a decade of uninterrupted polar phytoplankton biomass cycles, and found that polar phytoplankton dynamics are categorized by “boom–bust” cycles resulting from slight imbalances in plankton predator–prey equilibria.
Compared to historical passive optical remote sensing of the ocean, spaceborne lidars have at least two unique advantages: First, vertical penetration into the mixed layer through which profiles of optical and even oceanographic properties can be quantitatively obtained; Second, an all-time measurement independent of solar radiation can be carried out. But the critical limitation, that all measurements are vertically integrated without depth information, remains. A dedicated spaceborne lidar such as the one proposed for the Guanlan science mission is therefore urgently needed in order to better understand the truly three-dimensional (3-D, rather than 2.5-D) structures in the subsurface ocean.
Scientific Goals
The primary scientific goals of the Guanlan mission are defined as follows:
(i) To resolve sea level variability at submeso and sub-week spatiotemporal scales with a centimeter accuracy using the IA instrument, so that global oceanic eddies (especially those short-lived small ones missed by current altimeter constellations) can be tracked individually during their full lifetimes.
The dominant scales of oceanic eddies range from days to years in time and from tens to hundreds of kilometers in space, serving as a key bridge of an energy cascade between large and small variabilities in the ocean. As evidenced in the SSH snapshot of the northwest Pacific derived from AVISO data (AVISO, 2016), both cyclonic and anticyclonic eddies are ubiquitous in the ocean and cover a variety of spatial scales (Figure 1a). Big eddies are obviously associated with strong currents along the mainstream and extension areas of the Kuroshio. Looking into an individual oceanic eddy, we further disclose the complexity of its inner structure (Figure 1b): A ∼10 km sized eddy “eye” with a minimum speed in the core region, surrounded by an internal circulation with an outward increasing geostrophic velocity until a maximum value is reached near the eddy boundary. In terms of lifetime evolution, eddies often fall into the submesoscale in size at birth and death (they usually last for 1 or 2 weeks), while remaining relatively energetic in the mesoscale for the rest of the time (Chen and Han, 2019). Therefore, a spaceborne IA with a submesoscale and a sub-week resolving capability is necessary for the full life cycle of an oceanic eddy to be continuously tracked.
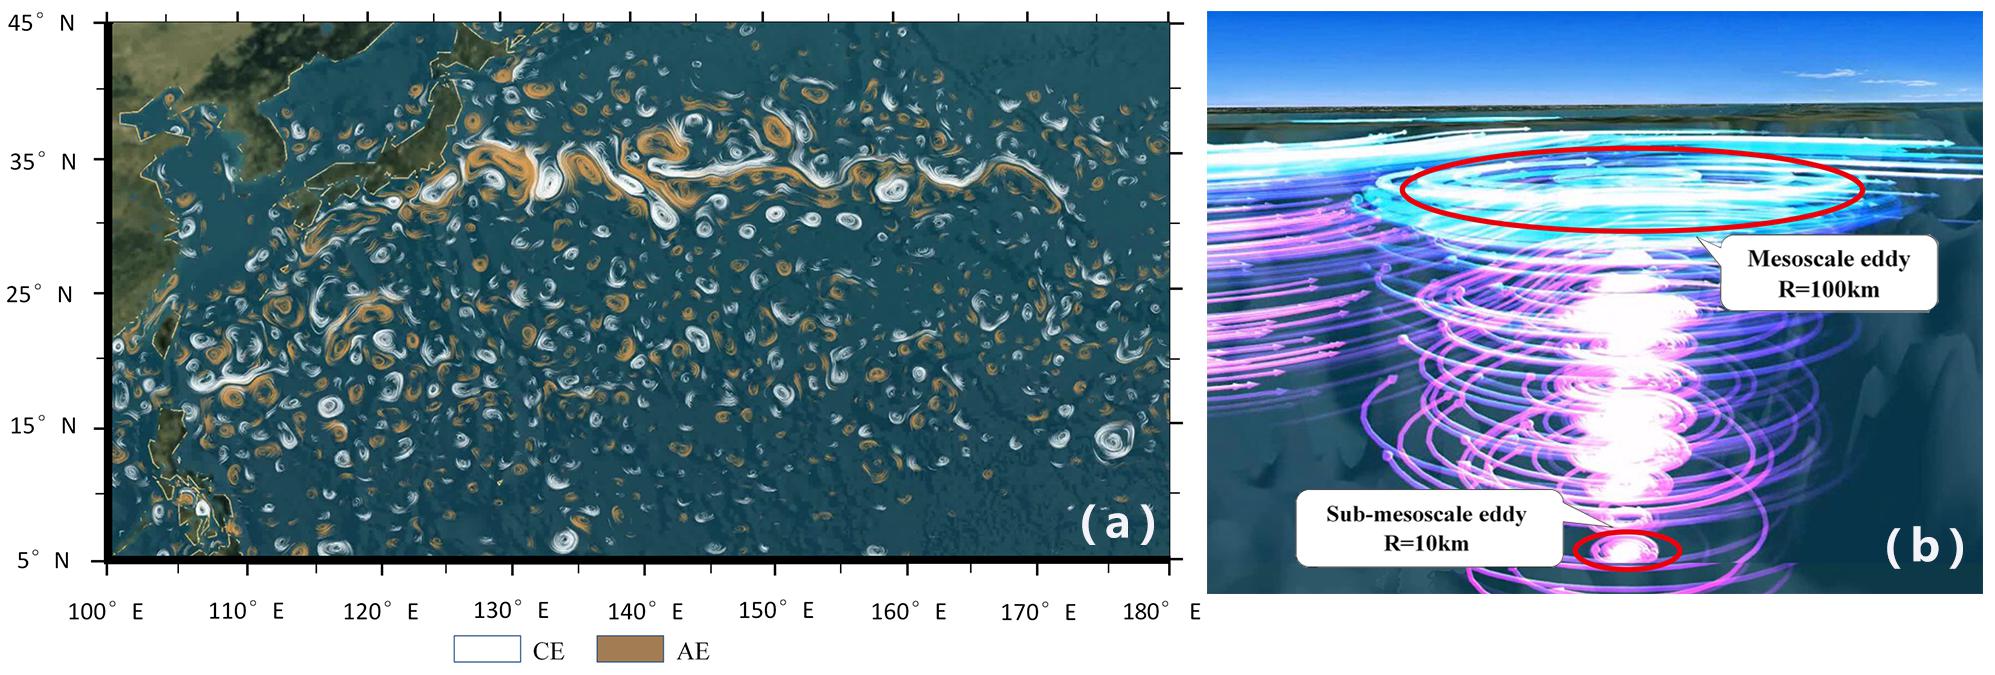
Figure 1. (a) A snapshot of massive eddies in the Northwest Pacific Ocean. (b) A typical example of the three-dimensional structure of an individual oceanic eddy.
(ii) To penetrate effectively into the oceanic mixed layer with the active OL instrument, so that a vertical derivation of the optical properties of the subsurface ocean can be obtained which may lead to an improved characterization of the thermocline formation and its associated dynamic features (Figure 2a).
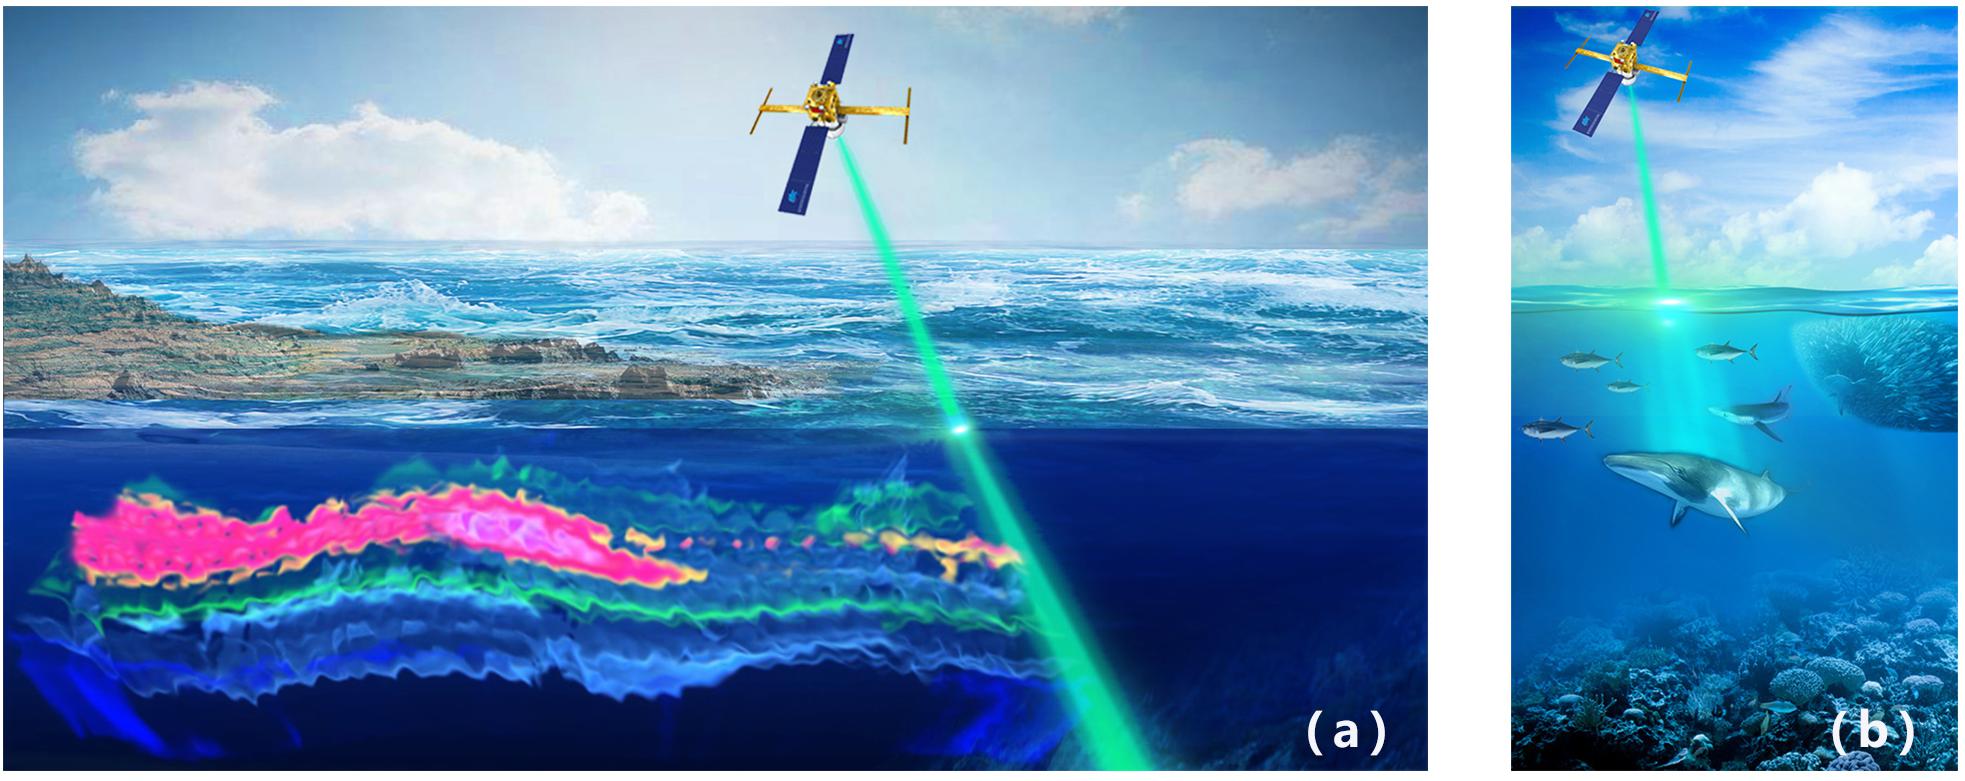
Figure 2. (a) Schematic of thermocline profiled by a spaceborne ocean lidar. (b) Schematic of fish school detected by a spaceborne ocean lidar.
Efforts to understand and model the dynamics of the upper ocean will be significantly advanced once the capacity to rapidly determine mixed layer depths (MLDs) over large regions is built. Spaceborne lidar technology is a potential choice for achieving this goal, since it has been demonstrated that the MLDs can be effectively derived from ocean optical properties (Zawada et al., 2005). The idea of this approach is based on the fact that optical properties are, to a large extent, determined by the biological productivity in the ocean which is proportional to the MLD (e.g., Behrenfeld and Falkowski, 1997). In other words, the frequent association of plankton layers with the pycnocline (Dekshenieks et al., 2001) implies that the pycnocline depth can often be mapped by a lidar system (Churnside and Donaghay, 2009; Churnside et al., 2013). In a feasibility study, Zawada et al. (2005) observed that the optical properties are strongly influenced by suspended particle concentrations, which generally reach a maximum at pycnoclines below the MLD. Quantitatively, a 70% agreement is found between the best hydrographical-optical algorithm pairings. This correlation is expected to be further increased when the active lidar system is used to complement the conventional passive optical remote sensing, as a result of the improvement from vertical integration to depth distribution. Figure 3 shows the estimated optical MLD with respect to the hydrological MLD as a function of latitude (partially adapted from Chen and Yu, 2015), which suggests that passive optical remote sensing can largely reach the thermocline depth in the tropical ocean, while a 100–200 m gap will rely on active lidar technology to fill in.
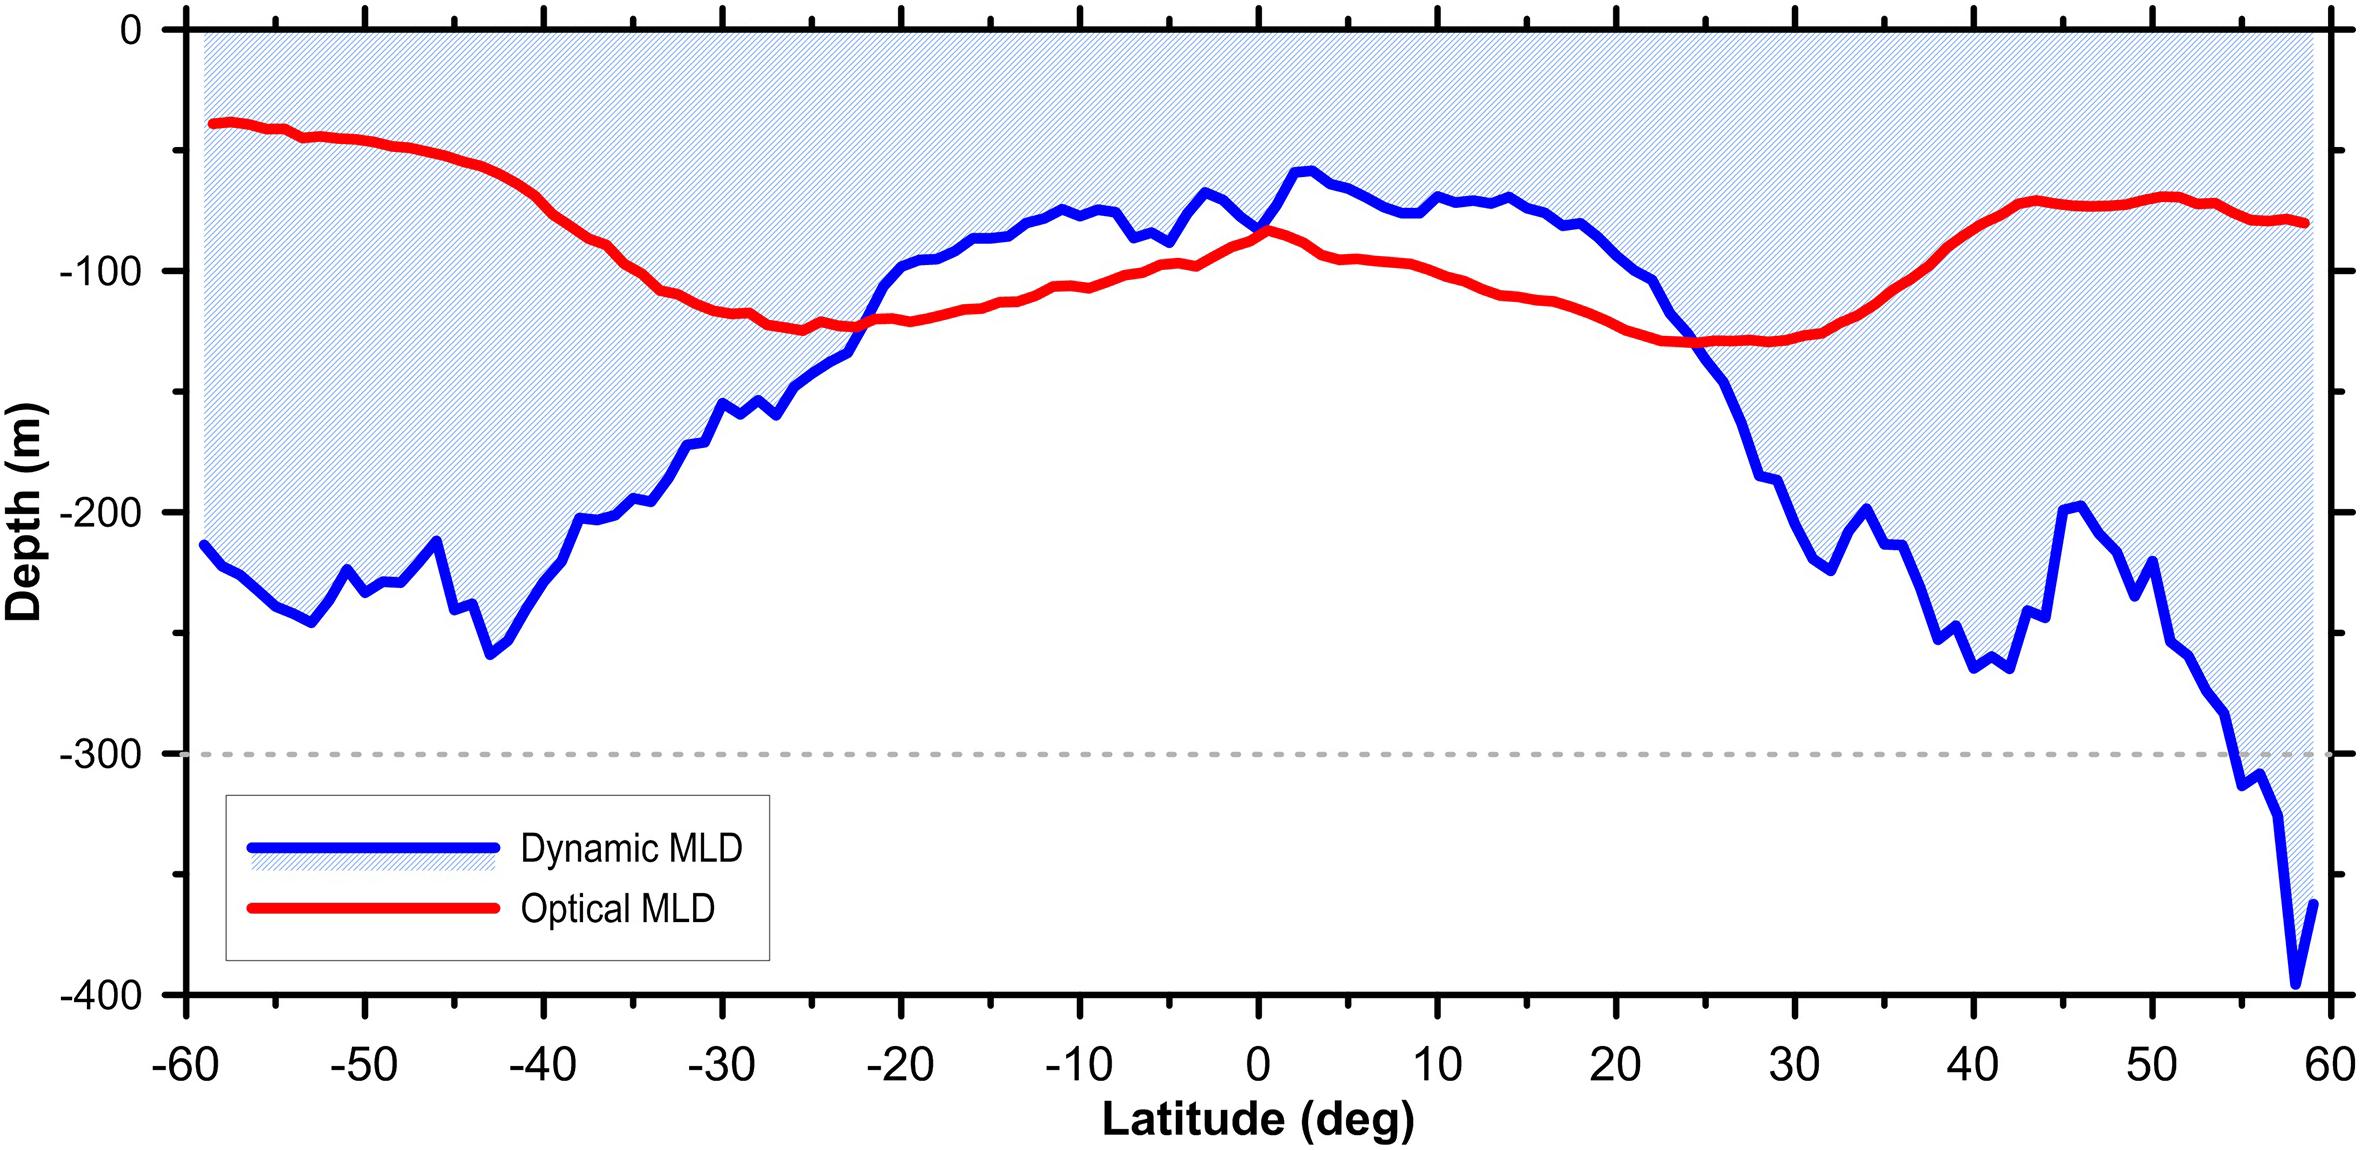
Figure 3. Zonally averaged MLD for the global oceans. The red and blue lines correspond to the optically and hydrographically derived MLDs, respectively.
(iii) To detect direct signals from big ocean fish and animals, and indirect signatures from various species of phytoplankton and zooplankton in the euphotic layer by OL in order to partially reveal the preliminary characteristics of the marine food web and the corresponding ecosystem.
As understood, lidars can produce depth-resolving profiles of various constituents of the ocean. The feasibility of detecting fish schools with an airborne lidar was demonstrated by Murphree et al. (1974), and has been confirmed by several subsequent analyses (e.g., Churnside, 2014). An ideal case is when large fish gather “separately,” so individuals can be “seen” and even be counted in the return signals (Figure 2b). A successful example is the depth and position of sixty-nine individual fish that are reported using the cross-polarized lidar signal at night, off the Oregon coast, most of which are suspected to be albacore tuna (Churnside et al., 2009). In addition to the measurements of phytoplankton and zooplankton, it is now clear that ship- or air-borne lidar can be used not only to estimate the biomass for fisheries, but also to investigate aspects of fish behaviors. Based on the experience gained with CALIOP, it seems feasible to build a spaceborne lidar with a depth resolution of ∼10 m to better match the oceanographic requirements. Combined with ocean color measurements, the OL would be a powerful tool for global observations of the upper ocean food web and marine ecosystem (Stephens et al., 2010).
Satellite Configuration and Primary Payloads
Among the various challenges in satellite observation of the ocean that need to be tackled, the following two issues are probably of a higher priority: inadequate dynamic resolution (i.e., kinetic energy leakage), and ineffective vertical penetration (i.e., ocean interior opaqueness). It is therefore the vision of the National Laboratory for Marine Science and Technology of China in Qingdao (QNLM) that two highly anticipated breakthroughs in the coming decade are likely to be associated with radar interferometry and lidar profiling technology, which would make a substantial contribution to an eddy-resolving and depth-resolving observation of the ocean. As an expanded follow-up of SWOT and an oceanic counterpart of CALIPSO, the planned Guanlan science mission comprises a dual-frequency (Ku and Ka) IA and a near-nadir pointing OL, as illustrated in Figure 4.
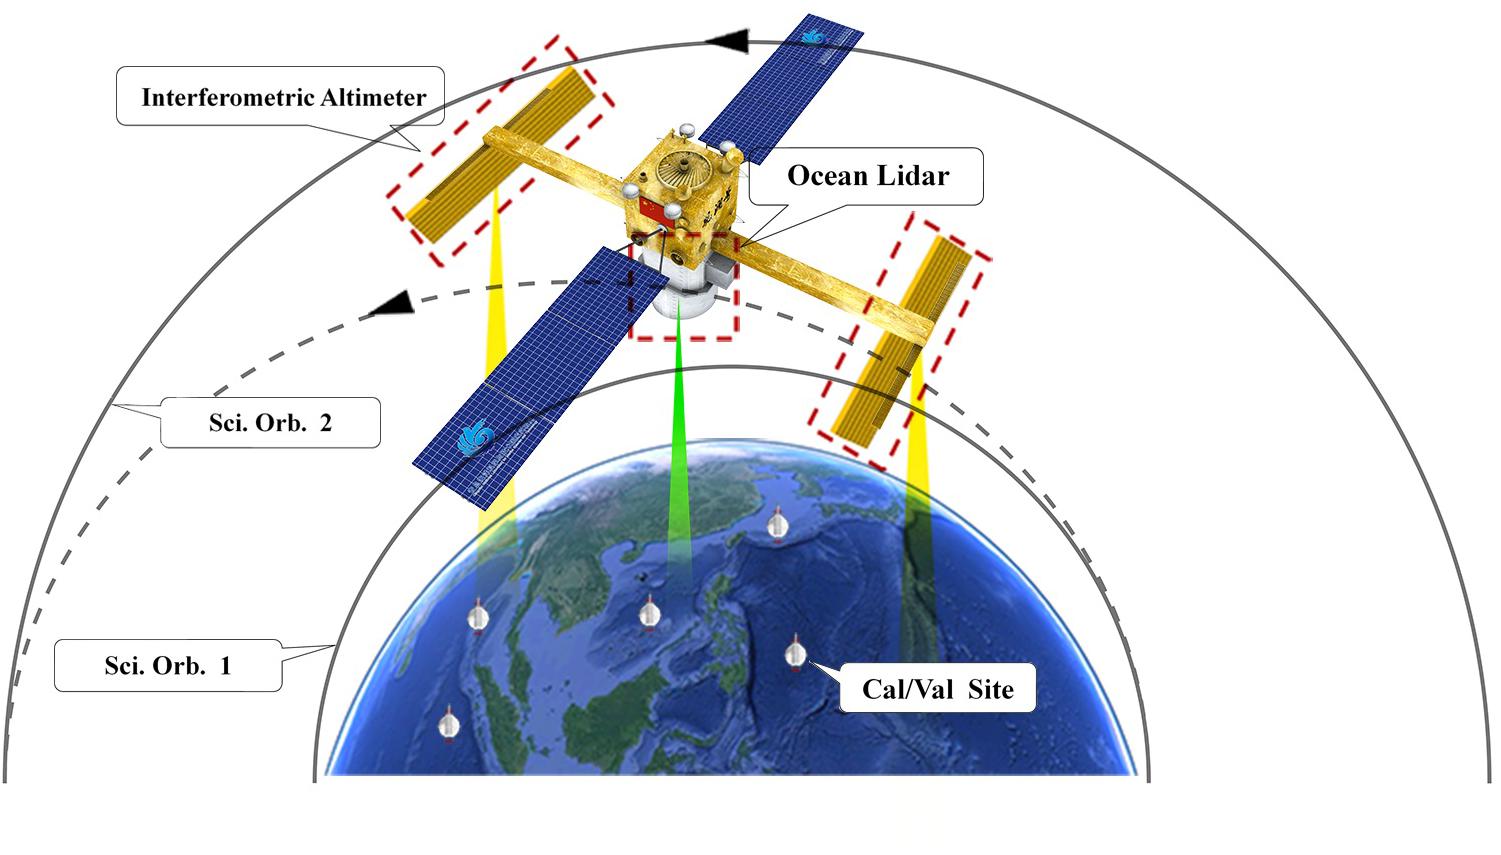
Figure 4. The orbit configuration and payload system of the Guanlan mission.
The Interferometric Altimeter Instrument
The Guanlan IA takes the two-side observation geometry with multiple Ku and Ka band interferometric beams at a relatively large range of incidence angle (Figure 5) so as to achieve a wider swath compared with SWOT. As shown in Figure 6, the Guanlan IA system is composed of pairs of multi-beam antennas, Ku/Ka front-ends, Ku/Ka SSPAs (solid state power amplifier), and multi-channel Ku/Ka receivers, as well as a Ku/Ka transmitter, a frequency synthesizer, central control electronics, and an onboard data preprocessing unit. Design considerations for each unit are briefly explained below.
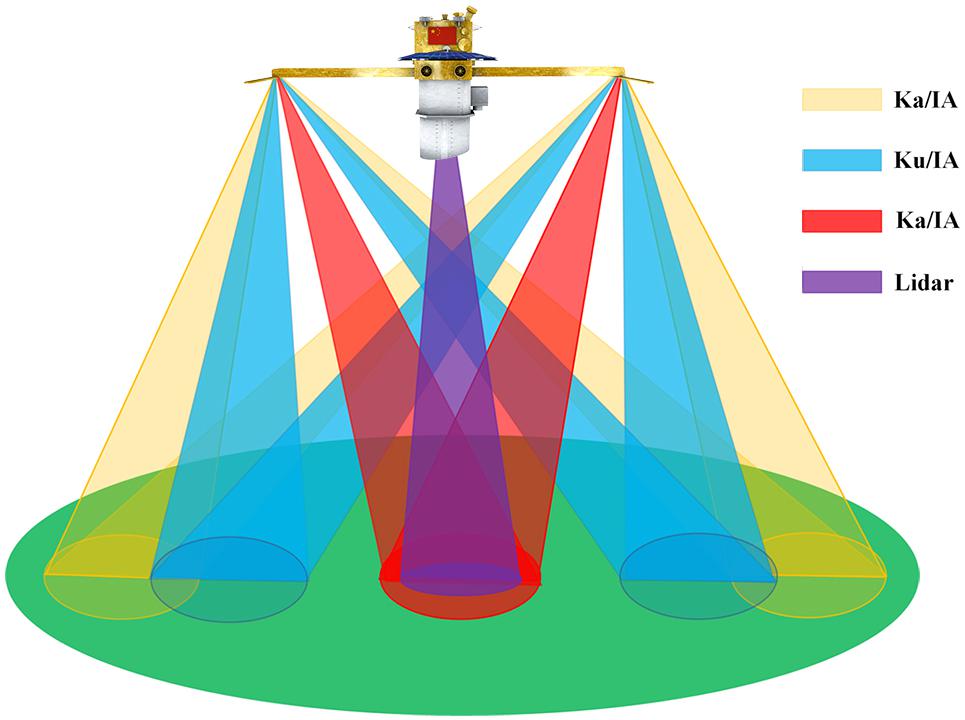
Figure 5. Measurement scheme of the Guanlan IA/OL system.
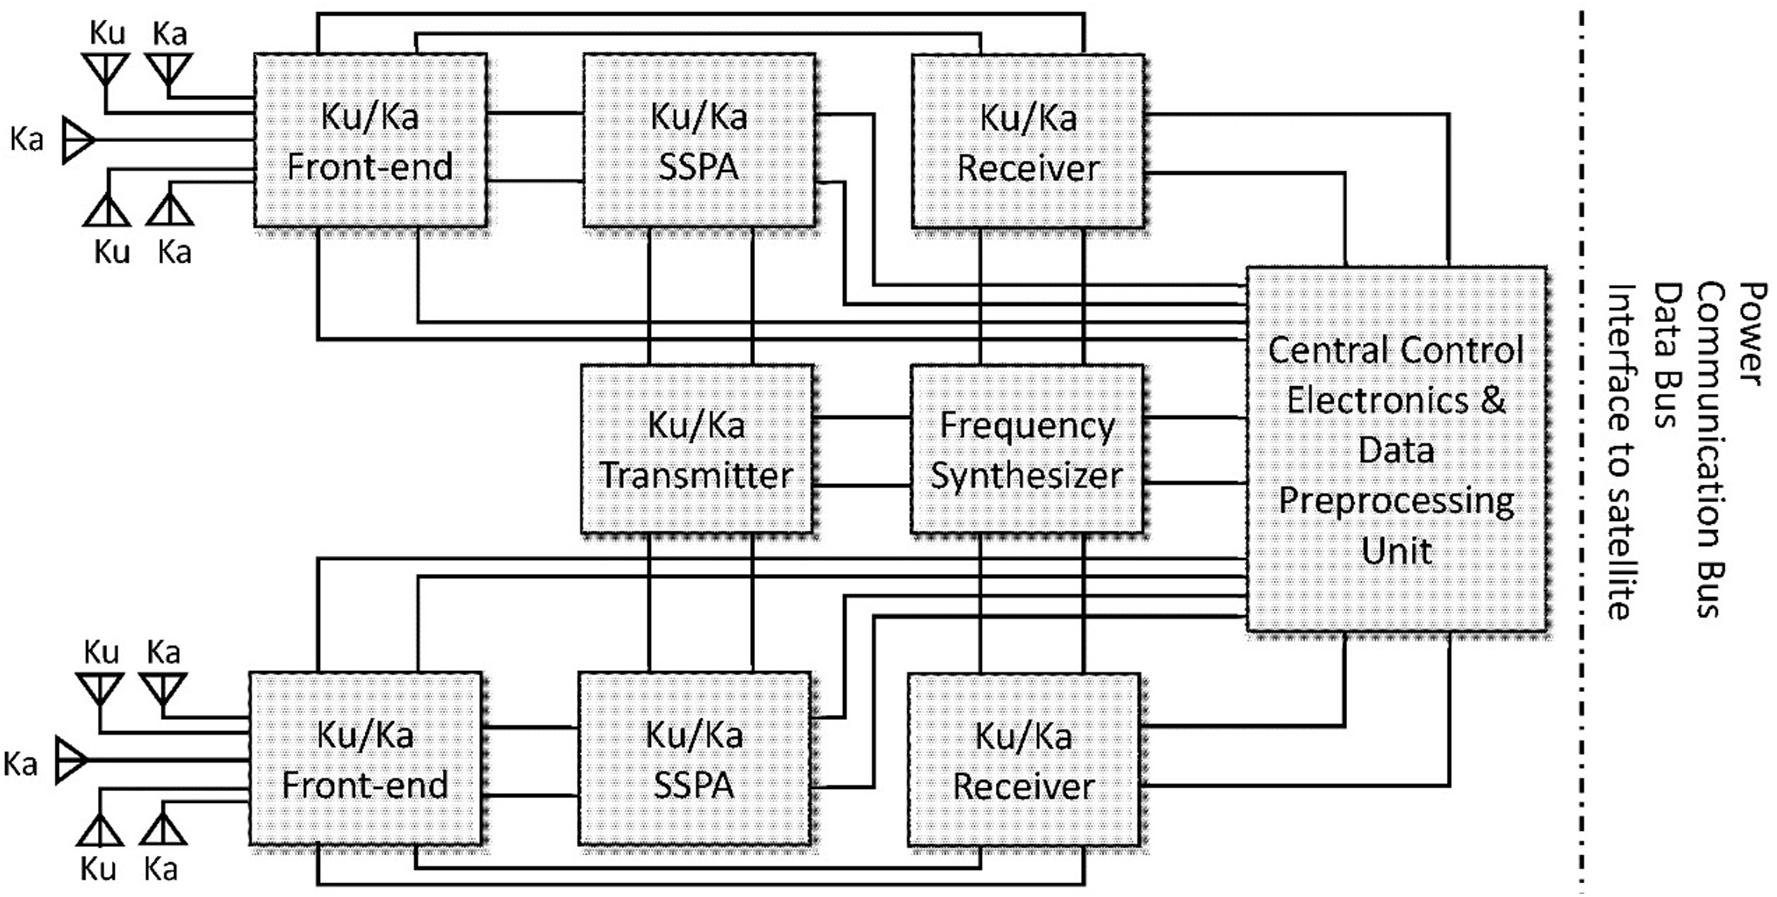
Figure 6. Component diagram of the Guanlan interferometric altimeter.
The Ku/Ka multi-beam antenna takes the form of a slotted-waveguide array, and the two antennas are identical, each with five beams, with two beams looking left (Ku/Ka), two beams looking right (Ku/Ka), and one beam looking nadir (Ka). The slotted waveguide array antenna can have a very stable phase center, which has been proven by the Tiangong-2 IA currently in orbit. Unlike a synthetic aperture radar (SAR) or an interferometric SAR, a smaller azimuth-size antenna instead of a large one is preferred for our IA. The initial design indicates that the antenna can be less than 3 m long.
The Ku/Ka front-end routines transmit Ku/Ka signals to different beams of the antenna and forward the received Ku/Ka echo signals to the Ku/Ka receivers, where an inner-calibration loop is incorporated by which the transmitted power and the phase can be monitored accurately and periodically. Special consideration should be given in order to handle the obvious challenge of high power.
Based on the successful application of a Ku-band high power SSPA, we are confident that it will have a stable performance, i.e., phase stability of the transmitted signal and long-lifetime, good electromagnetic compatibility and safe operation (anti-micro-discharging in space environment). The required maximum transmitted powers of both Ku and Ka SSPAs exceed 1000 W. Comprehensive measures should be taken for the thermal control due to the relatively low power efficiency compared to the traveling wave tube amplifier (TWTA). Since a power combination technique is used to achieve high energy transmission, it is easier to realize the power-control given that the transmitted power can be scaled according to different orbit heights.
Ku/Ka multi-channel receivers are also very crucial for obtaining a stable and accurate interferometric phase measurement, which is almost the only un-calibratable factor dominating the random height error budget. The design should consider issues both at device level [e.g., low noise amplifier, mixers, filters, radio frequency (RF), intermediate frequency (IF) and video amplifiers, in-phase, and quadrature demodulators] and at a circuit level (the layout and the isolation between RF and LO (local oscillator) frequency, and between LO and IF), as well as those related to the working environment, so as to guarantee the phase stability of the received signal from input to output. Our goal is to make the stability of the interferometric phase measurement better than 0.1° on a single pulse basis.
The frequency synthesizer unit uses a low phase noise and high stability atomic clock. The required LO frequencies for the transmitters/receivers, the working clock, the data sampling clock, and the data transmission clock, used by the central control electronics, are all generated directly from it or by phase referring to it. The low phase noise and low spurious performance of each frequency is very important for the phase stability of the interferometric system. The system architecture determines that the LO frequencies should be generated locally, i.e., the frequency synthesizer should be designed in a distributed fashion.
The central control electronics & onboard data preprocessing unit is responsible for controlling the entire working process according to different operating modes. Being adaptive to an orbit height variation from ∼500 to ∼800 km, the controlling time sequences for signal transmitting/receiving and data recording play a key role in realizing highly accurate and coherent measurements. The multi-channel analog to digital convertors (ADCs) should be highly synchronized at a picoseconds level. This unit is also in charge of all kinds of communications between the satellite and the payloads via various buses, as well as the transmission of science data to the ground station. Onboard data preprocessing is necessary in order to reduce the transmission rate under continuous observations.
The Guanlan dual-frequency IA takes the complementary advantages of the atmospherically less influenced Ku-band and the ionospherically insensitive Ka-band signals with a large B/λ value (B is the baseline length and λ is the wavelength), which facilitates accurate height retrieval under a wide swath over the ocean (Figure 5). The Ku band is designed to cover an inclining angle from 1° to 5.5° while the Ka band from 4.5° to 6°, forming an overlapped region between 4.5° and 5.5°. It should be pointed out, however, the large range between the two orbit heights corresponding to the two operational modes (∼500 km vs. ∼800 km, as will be addressed in the following section) could be a challenge for the design of the Guanlan IA.
It should be emphasized that B is a critical parameter for the IA, and there is an intrinsic conflict between its length and the system complexity: a longer baseline is good for achieving higher sensitivity of phase to height, but a more complicated in-orbit measurement system is required, and the interferometric phase may suffer from more serious motion errors and spatial decorrelation. A compromised B value has to be found along with an optimized orbit. Initial simulation shows that B should be at least greater than 10 m for our purpose.
The dual-frequency design is helpful to estimate baseline parameters (length and inclining angle). By utilizing the multi-beam antennas, five pairs of interferometry are formed, among which the nadir interferometric beams are useful for polar iceberg observation as well as for monitoring the baseline status over an appropriate (calm) sea surface. Data from the overlapped region can also be used to estimate the ionospheric delay for the Ku band.
The Ocean Lidar Instrument
As an active optical detection instrument capable of providing time-resolving and spectral-resolving measurements, the Guanlan OL is built to perform an all-time profiling of the attenuated coefficients, the backscatter coefficients, and the particle linear depolarization ratios from the sea surface to the mixed layer (Figure 7). Additionally, the OL is also designed to make possible measurements of the ocean fluorescence and the sea level elevation. As a complementary device, a multi-channel scanning radiometer may also be carried onboard to optionally conduct high-spectral-resolution passive observations.
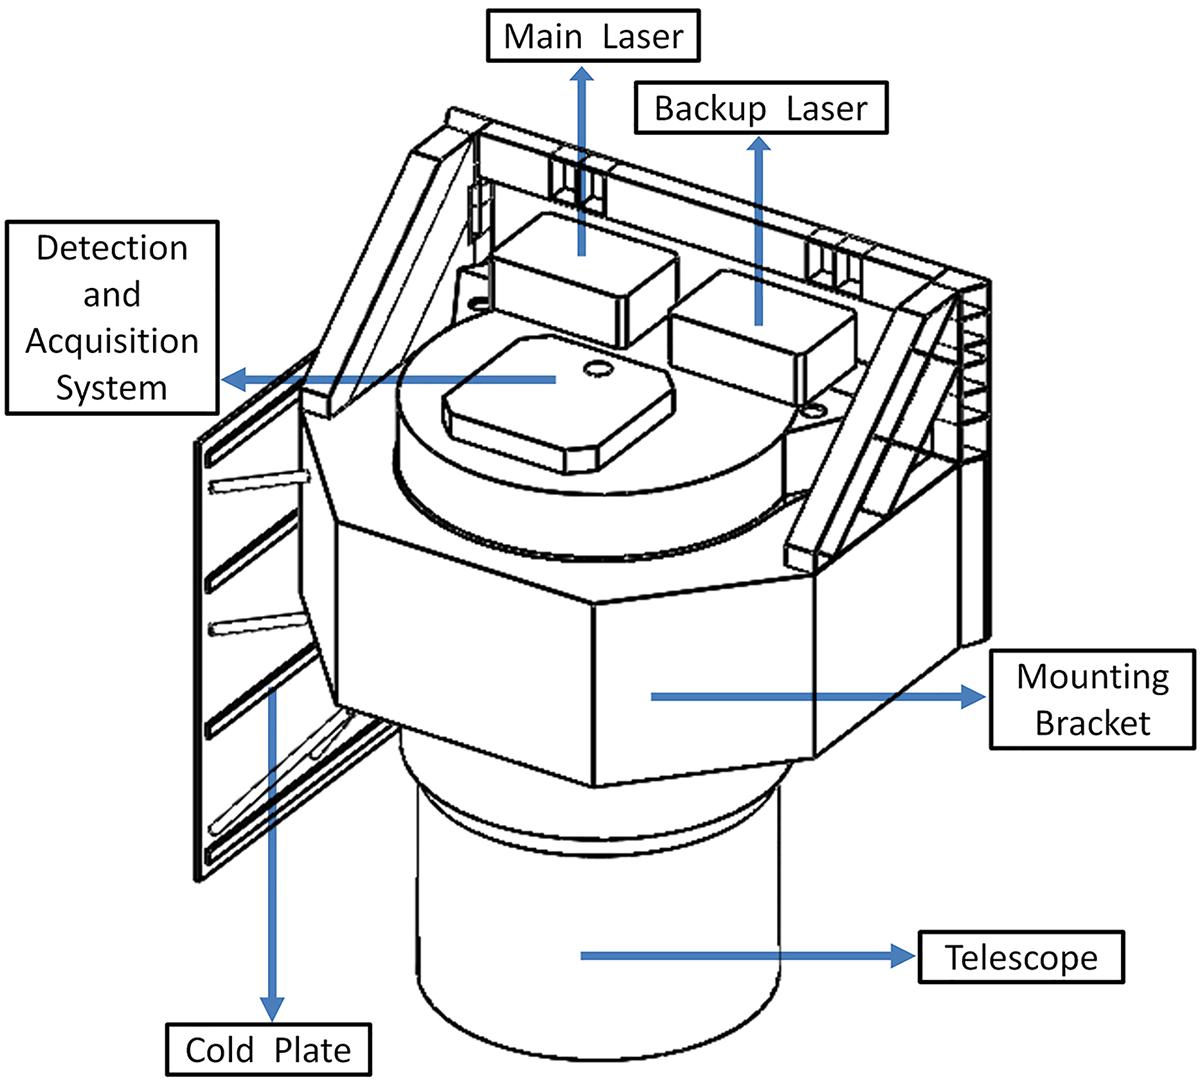
Figure 7. Configuration of the Guanlan ocean lidar.
The Guanlan OL has two fully redundant lasers, each with a narrow-linewidth laser that transmits simultaneous, co-aligned multi-wavelength (including the blue and green bands) pulses (Figure 8). The total output pulse energy is at joule level. The two lasers are expected to cover the full mission lifetime. The primary laser is scheduled to be fired at the launch of Guanlan, while the second one serves as a backup. For the receiver, a Cassegrain telescope with lightweight silicon carbide is designed to collect backscatter signals. The diameter of the telescope is approximately 1.2 m. For accurate measurements of the troposphere and subsurface ocean, a data acquisition subsystem with a high sensitivity and a large dynamic range is required. Therefore, an analog mode along with a photon counting mode will be operating simultaneously. To ensure data integrity and processing flexibility, high-speed waveform acquisition and variable digital discrimination techniques are adopted. The heat generated by lasers is dissipated via a radiant cooling panel. The OL is installed to the satellite platform in the overall mounting framework.
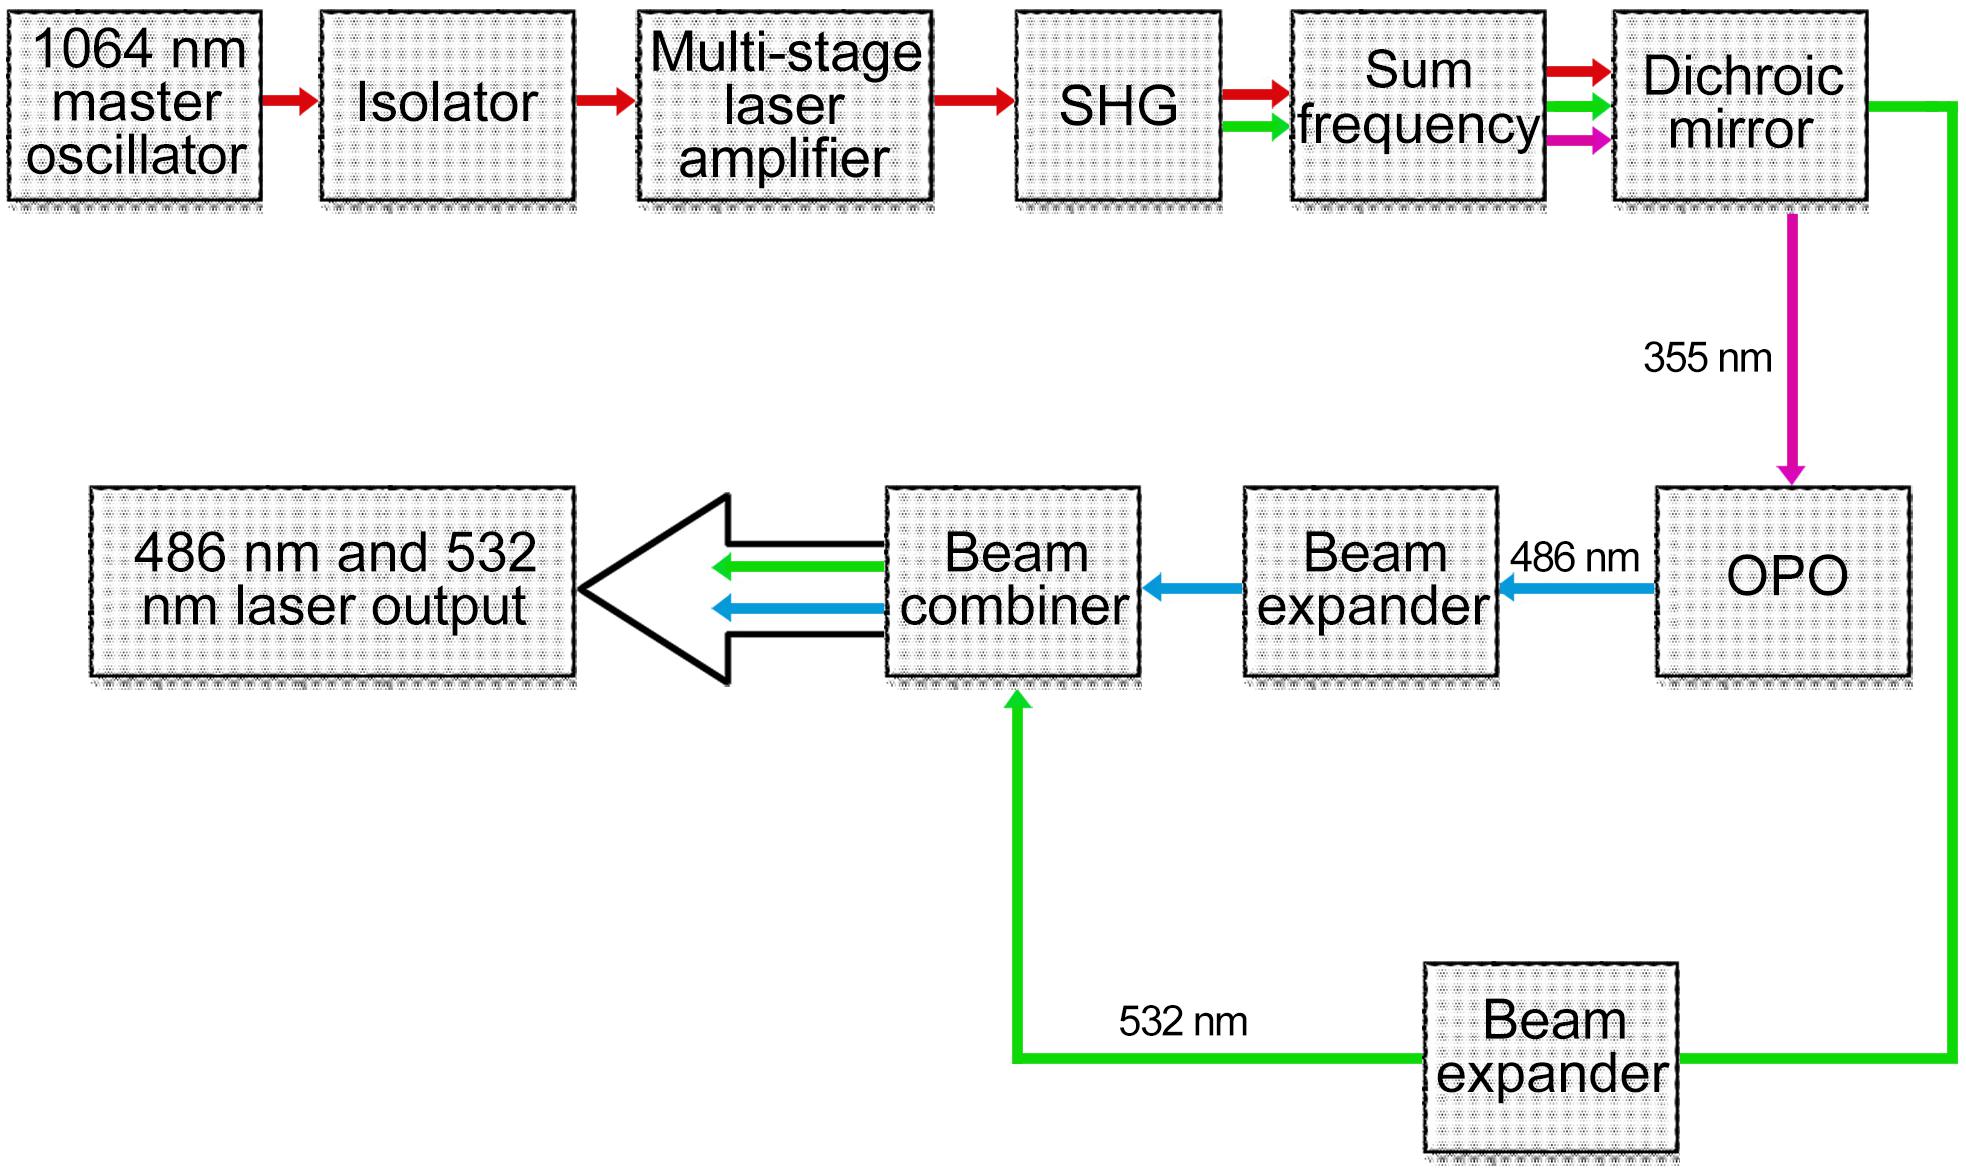
Figure 8. Component diagram of the Guanlan ocean lidar.
The technical route of the laser system is a solid-state main oscillation power amplifier combined with a non-linear frequency conversion technology. Multistage laser amplifiers are used to amplify the seed laser pulses from a 1064-nm main oscillator. The frequency of the amplified high energy 1064-nm laser is doubled to obtain 532.2-nm green laser pulses. A 355 nm ultraviolet laser is generated by a frequency sum of the 532.2-nm laser and the remaining 1064-nm laser. The 486.1-nm blue laser pulses will be generated by the 355-nm laser pumped optical parametric oscillator. Considering the scale and light damage in the actual space environment, multiple lasers are designed to meet with the parameters described above and obtain the 486.1-nm blue laser and the 532.2-nm green laser with single pulse energy greater than 1 joule each. A proper incidence angle will be adopted to avoid ocean surface reflection at nadir.
The receiving telescope adopts a Cassegrain structure, consisting of a primary mirror and a secondary mirror. The mirror-coated metal reflective film has a reflectivity of more than 95% in the blue-green band. The telescope has an effective receiving aperture of 1.2 m and a field of view of 0.2 mrad. Under the premise of ensuring the rigidity and stability of the mirror body, the weight of the telescope is to be reduced as much as possible. The primary and secondary mirrors are made of silicon carbide materials with high rigidity, excellent thermal conductivity, and high stability. The weight of the optimized telescope will be limited to less than 200 kg.
A more sensitive photon counting technique is used to detect laser echoes in multiple channels. With this technology, the echo signal of a single photon can be detected with a count rate of 100 MHz. A good signal-to-noise ratio can be obtained by time integration during the detection. In the case of receiving a large number of photons at the same time, the analog signal output can be realized by the accumulation of multi-channel signals. The analog signal is received by the acquisition card with a sampling rate of 1 GSps, and the continuous signal of the underwater vertical profile can be subsequently collected. The hybrid method of analog sampling and photon counting will improve detection sensitivity meanwhile provide a high dynamic range.
Orbit/Sampling and Calibration/Validation
Orbit Design and Sampling Strategy
In order to optimize the performance of each payload onboard the Guanlan satellite, two potential science orbits are proposed with a possible mid-term maneuver in between (Table 2): A low orbit of 495.953 km which is ideal for the OL to maximize its vertical penetration, and a high orbit of 791.254 km which is necessary for the IA to ensure a wide swath and fine spatiotemporal resolution. For both the low and high orbits, there will be an initial 3-month commissioning phase, followed by a science orbit phase which is expected to last for at least one year each. The orbit inclination of Guanlan is chosen to be 78.0° to cover the polar regions and avoid major tidal aliasings. Other considerations for orbit design include solar radiation, atmospheric contamination, and site selection for calibration and validation (Cal/Val).
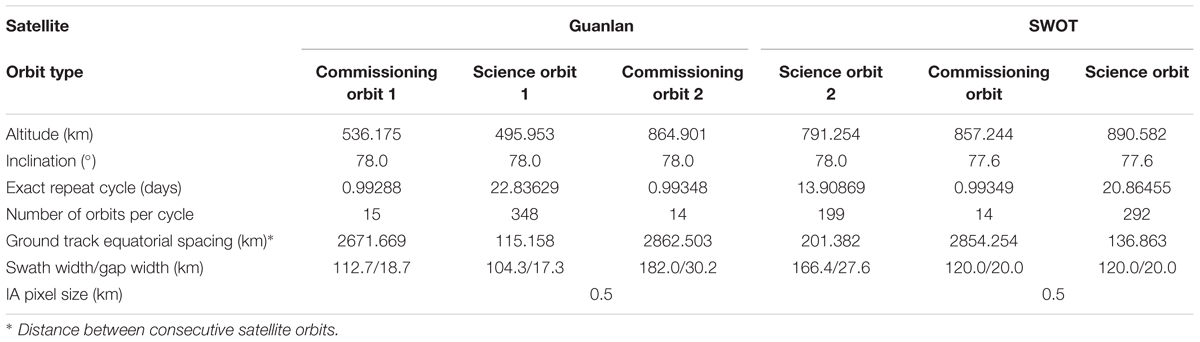
Table 2. Orbit characteristics for Guanlan and SWOT.
A comparison of the sampling density between the Guanlan and SWOT science orbits is shown in Figure 9. We tried to simulate the sampling process and estimated the data recovery efficiency under various combinations of Guanlan and SWOT orbits based on a 1/50° SSH grid, which is identical to the spatial resolution of the SWOT simulator. As shown in Table 3, the mean revisit times of SWOT, Guanlan science orbit 1 and 2 are 7.87 days, 8.45 days, and 5.61 days, respectively. Combining the Guanlan science orbit 1 or 2 with the SWOT orbit can reduce the revisit time to 4.28 days or 4.01 days, respectively. It is therefore apparent that a wider Guanlan swath (partially benefitting from the dual frequency design) or merging of tandem IA measurements can lead to a significant increase of the sampling efficiency by ∼1/4–1/2 compared to the SWOT mission alone. It should also be noted, however, that the penetration depth of the OL may have a reduction of 10–15% when the satellite is maneuvered from science orbit 1 to science orbit 2.
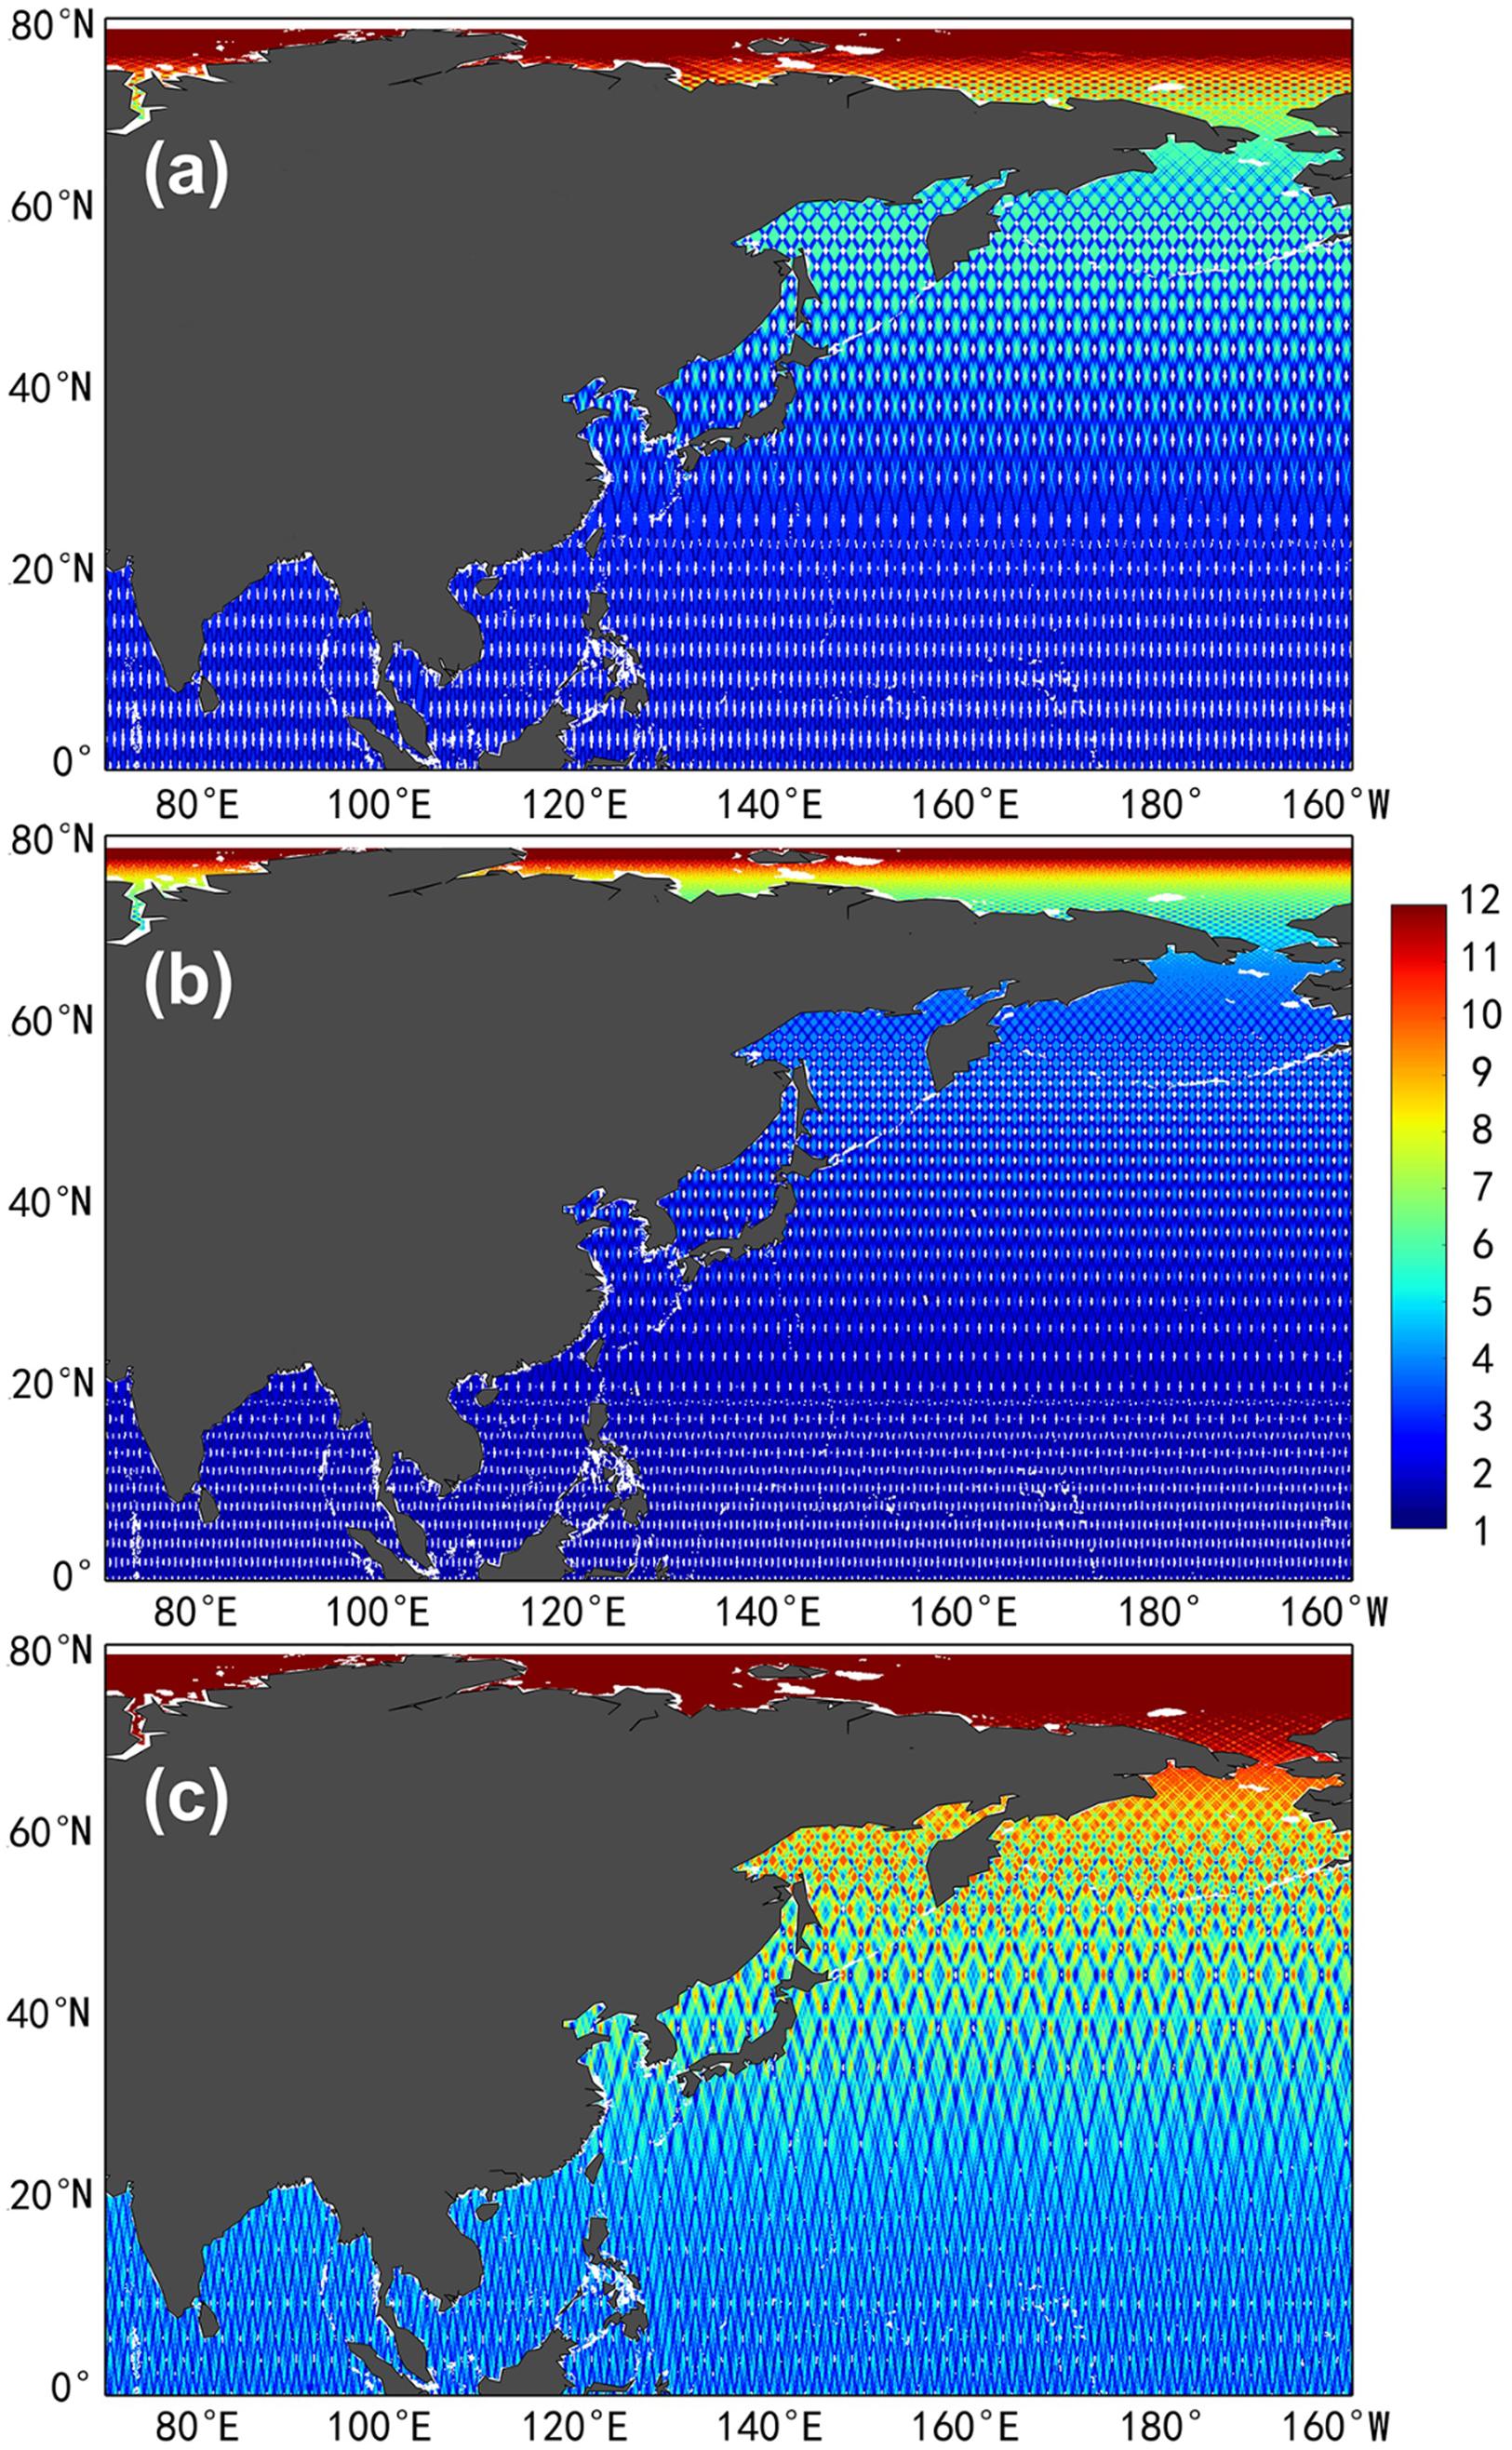
Figure 9. A comparison of the sampling density (within a 1/50° × 1/50° cell) between the Guanlan and SWOT orbits. (a) Guanlan science orbit 2. (b) SWOT orbit. (c) Is a sum of (a) and (b).

Table 3. Mean revisit time for Guanlan and SWOT.
The centimeter-level precise orbit determination (POD) of the Guanlan satellite relies on the combination of the Beidou/GPS-based global navigation satellite system (GNSS) and the satellite laser ranging (SLR) system, where the multimode GNSS receiver is used for orbit tracking, the onboard SLR is used for calibrating orbit error, and a multifrequency scheme is applied for eliminating ionospheric errors in the observation data. As the next generation Beidou III system with a global coverage will be established in 2020, the Guanlan mission scheduled beyond that may also have the option to rely solely on the Beidou/SLR system to achieve a centimeter-level POD.
Calibration and Validation Activities
Synchronous calibration/validation of the IA/OL sensors onboard the Guanlan satellite is a challenging task. Calibration of the SSH measurement for a wide swath consists of two stages: ground calibration before launch and in-orbit calibration after launch. In the first stage, the time-delay of each subsystem should be measured on the basis of which the total system delay can be estimated along with the initial phase of each channel and the performance of phase-AGC (automatic gain control). In the second stage, the gain pattern of the antenna, and the absolute phase and time-delay of the whole system will be periodically measured at the Amazon tropical rain forest, and by the arrays of man-made reflectors installed in land and oceanic sites where different kinds of calibration facilities are equipped.
As for the validation of SSH, given the 166.4-km wide swath and the ∼5-km pixel size of the Guanlan IA, our primary goal is to effectively resolve the complex dynamic variabilities at ∼10–100 km scales induced by the presence of rich submesoscale oceanic motions. No existing observation network can provide a synoptic wavenumber spectrum at these wavelengths. To tackle this difficulty, an integrated multi-sensor validation array is proposed, as illustrated in Figure 10. In the selection of validation site, we try to make best use of current observation arrays deployed by the QNLM in the western Pacific-South China Sea-Indian Ocean area, both near the seashore and in the open ocean. Possible collaboration with the SWOT mission will also be considered as far as the IA instrument is concerned. When the satellite overflies the validation platform, accurate SSHs can be derived using joint measurements from GNSS, tide gauges, and meteorological sensors. To make a simultaneous validation of SSH in two dimensions at submesoscales, a multi-sensor array will be deployed by means of integrating the PIES (pressure inverted echo sounder), the GNSS buoys, as well as a combined glider/mooring system. The pixel-wise difference of SSH between the Guanlan IA and the validation field array can therefore be calculated, resulting in a quantitative evaluation of the error budget specified in Table 4.
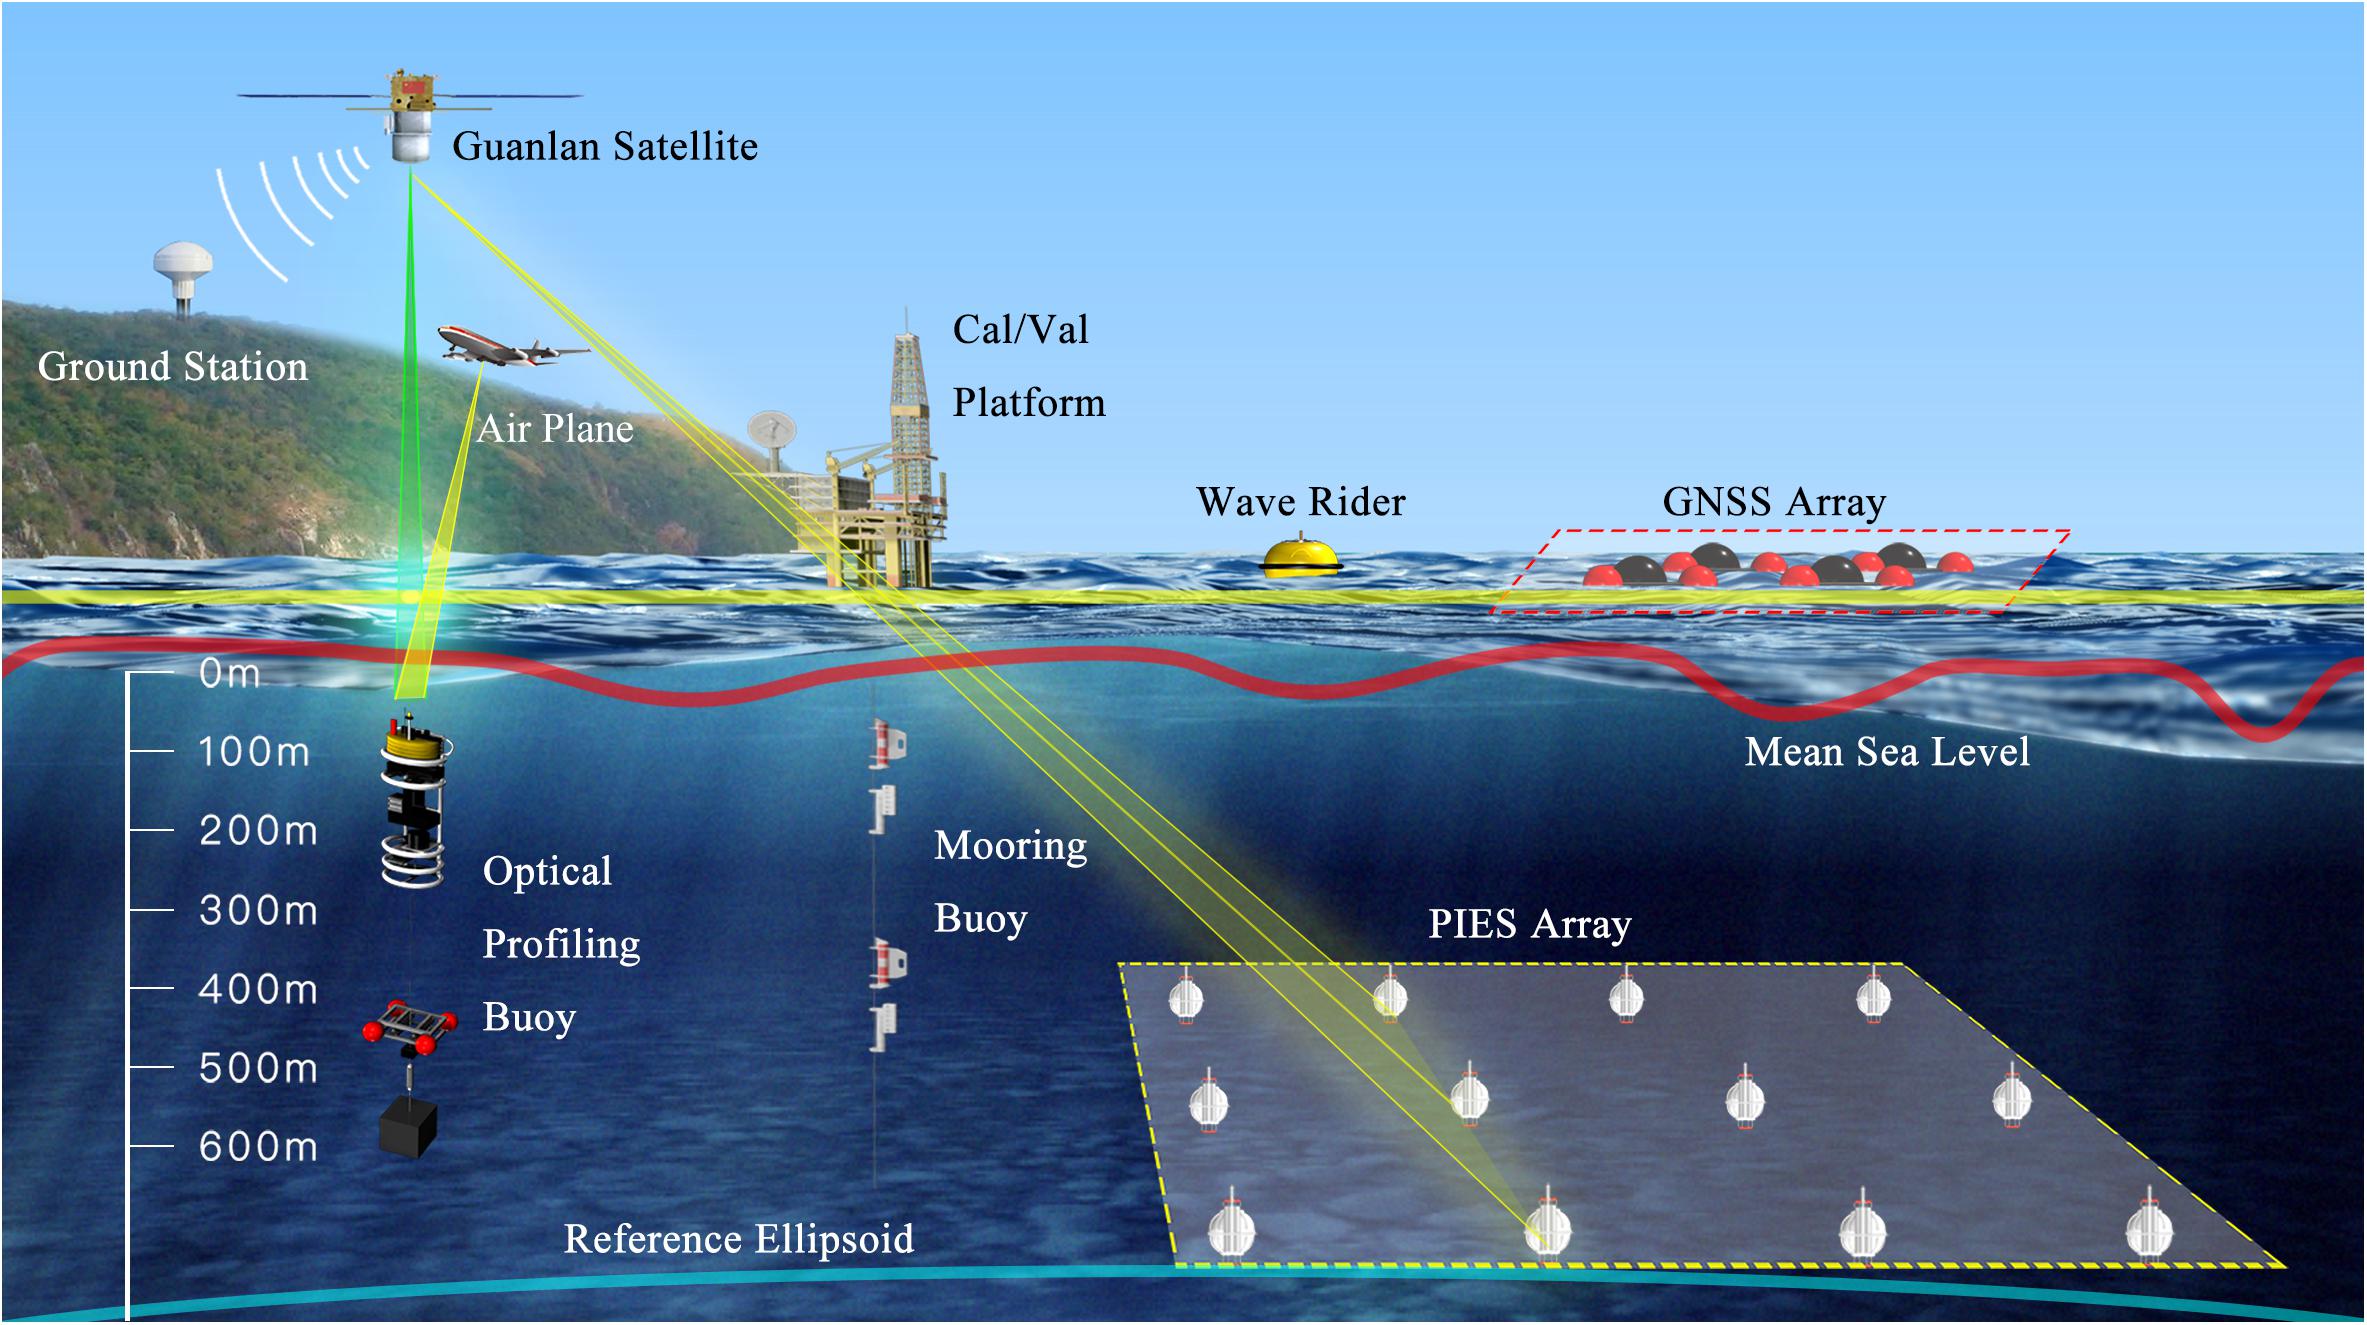
Figure 10. A schematic illustration of calibration/validation facility for the Guanlan IA and OL.
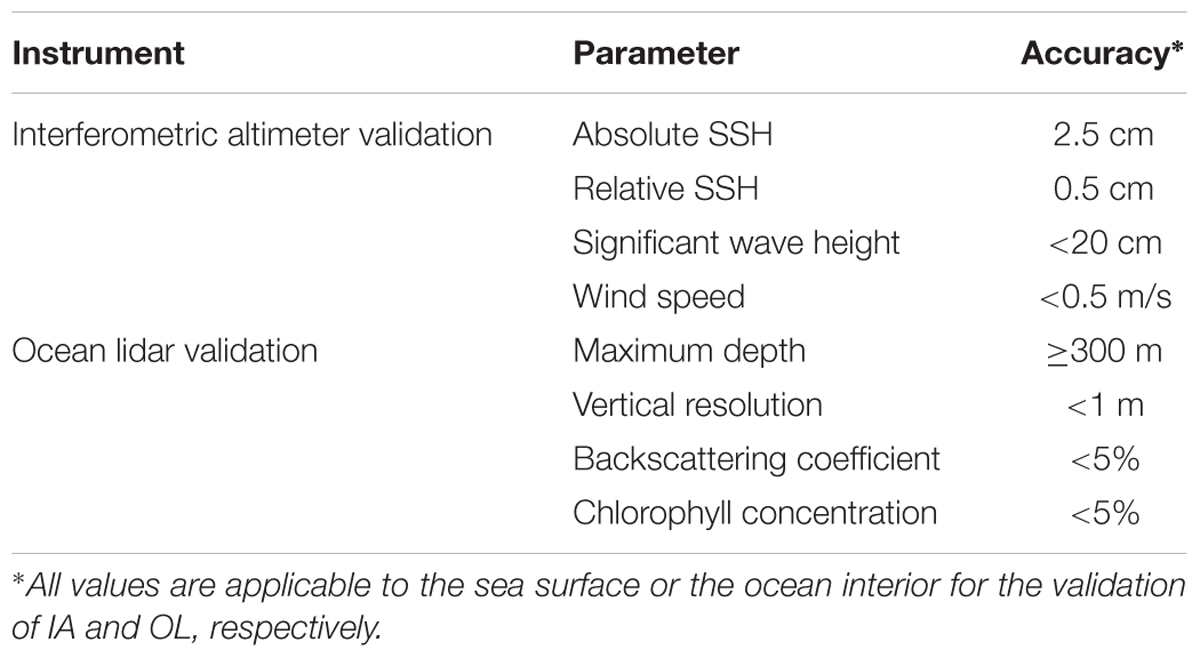
Table 4. Parameter and accuracy for the Guanlan IA/OL in situ validation system.
The spaceborne OL will mainly be calibrated by an airborne lidar. Based on the satellite orbit and laser emission direction, the trajectory of laser footprint (50–80 m for the two science orbits given in Table 2) at the sea surface can be calculated. The airborne lidar verification experiment is then carried out synchronously with satellite measurement in the trajectory direction. A flight altitude of about 4 km results in a ground path of greater than 50 km, and the trajectory deviation between the footprints of airborne and spaceborne lidars at the sea surface is expected to be less than 2 km. The time deviation between measurements from the two platforms will be less than 0.5 h. Aside from aircraft-based measurements, the calibration method based on the comparison between ocean surface signal and theoretical results (e.g., Cox-Munk theory) using wind speed or surface cross section derived from the radar is also feasible.
The validation of the Guanlan OL requires simultaneous measurements of the subsurface ocean by the laser satellite and an integrated optical buoy (Figure 10). To do so, an optical multi-parameter profiling system is developed using an automatic winch, along with a ship-borne lidar. The optical buoy will be deployed at the footprint of the satellite orbit, and continuous profiling observations will be carried out when the satellite overflies it. The maximum depth of the profile will exceed 300 m (almost twice as much as the usual penetration depth of an OL) and the vertical resolution will be less than 1 m. Multiple parameter measurements of temperature, salinity, chlorophyll concentration, backscattering coefficient and so on, will be collected and transmitted to the data center in near real time, where an integrated Cal/Val of the Guanlan OL will be implemented in order to reach the level of precision and accuracy described in Table 4.
Unique Characteristics and Potential Benefits
The payload system of the Guanlan science mission has a few unique technological characteristics and potential scientific contributions:
First, a unique combination of two active sensors of IA and OL (Figures 4, 5), which to our knowledge is the first of its kind in ocean satellite missions. The joint use of active microwave and lidar technologies will allow an integrated sensing of dynamic and biological properties, opening a new window for the cross-disciplinary study of the ocean. Meanwhile, the simultaneous functioning of the IA/OL system will allow an enhanced correction of the contaminations of the atmosphere and the air-sea interface which in turn effectively reduce the error budgets of the two sensors.
Second, the dual-frequency (Ku and Ka) IA, benefiting from a wider swath and a shorter repeat cycle, will lead to a substantially improved temporal and spatial resolution up to days and kilometers. The Guanlan satellite in combination with other IA missions including SWOT will hopefully serve as an observational foundation for submesoscale oceanography. In addition, oceanic precipitation is known to have very distinct impacts on the transmission of Ku- and Ka-band microwaves, on the basis of which rain-induced errors may be significantly reduced by using a dual-frequency technique. As far as ocean waves are concerned, the two bands also have different resonant frequencies, thus widening the wave spectrum that can be effectively resolved.
Third, as one of the first spaceborne OLs and an oceanic counterpart of CALIPSO, the Guanlan OL will be used as an experimental sensor to test a number of new ideas such as a replacement of the nadir-pointing conventional altimeter, a complementary sensor measuring the ocean component of the global carbon cycle, a new sensor demonstrating the feasibility of optical-acoustical conversion in the ocean, and an extended sensor tracing the paths of terrestrial dust into the ocean as well as its biogeochemical effects.
Outlook and Recommendations
To Contribute to and Benefit From the Era of Big Marine Data
The era of big marine data arrived in the early 2010s with nearly half of the contributions coming from satellite observations (Overpeck et al., 2011). Specifically, however, the majority of these remote sensing data come from visible and infrared sensors, while those from microwave instruments remain small due to the well-known limitations of coarse spatial resolution. The Guanlan altimetry, along with SWOT and other on-going and forthcoming missions of a similar nature (the wide swath imaging altimeter) will lead to a ∼104 increase in the daily altimetric data volume, while the intrinsic problem of poor sampling (particularly the along-track/cross-track asymmetry) associated with conventional altimeters will be largely resolved. This will mark the transition from the semimesoscale “grid” phase to submesoscale “pixel” phase in satellite altimetry, making a revolutionary contribution to modern sea level measurement as represented by a seamless coverage of the entire globe for the first time. In addition, if it downlinks data over land, it will be the first global measurements of snow depth measurements from a difference in the Ka/Ku band radar. It will therefore be a great contribution to the study of the cryosphere and snowfall.
It has to be recognized, however, that the volume of daily marine data acquisition is highly inhomogeneous in the vertical dimension: reducing from the level of petabyte at the sea surface to the level of kilobyte near the deepest ocean bottom. In other words, the ocean has entered the big data stage at the surface while it still remains in the small data stage at the bottom. The coexistence of big and small data in terms of ocean measurements is expected to last for a long time. As such, persistent availability of global ocean optical profile data from the Guanlan OL down to the depth of the maximum penetration appears to be extremely valuable, making a unique contribution to the observation of the oceanic mixed layer. It will also benefit by combining with concurrent in situ surface drifters and Argo floats to routinely provide a systematic monitoring of the upper ocean between 0 and 2000 m.
In the time domain, it is understood that the probability of detecting new or changing small scale oceanic features increases constantly with observational time (Wilson et al., 2010), because a higher signal-to-noise ratio can be statistically obtained with longer time series. The wider swath of the Guanlan IA ensures a shorter repeat cycle (and hence an extended time series) compared to SWOT or the conventional altimeter constellation. As pointed out by Scott et al. (2010), one would need more than one SWOT mission to capture the temporal variability of the ocean at submesoscales. The combined effect of shorter temporal resolution and a longer time series will hopefully help to enhance the characterization and eventually the prediction of oceanic features, from climate scales to weather scales, which is a significant step forward in modern dynamic oceanography.
Given the coexistence of big and small data in ocean science to date, particularly the highly inhomogeneous sampling as a function of depth (which limits us to capture only a very small fraction of the total vertical ocean variability), we would like to argue that no observation system is redundant for at least the next few decades. Similar to the metro system in a metropolitan, we are still at a very early stage with a single line of underground in operation. The traffic problem can be effectively alleviated only when a properly distributed network is fully established.
To Open a New Window for Interdisciplinary Studies of the Ocean
Interconnection among the physics, biology, and biogeochemistry of the ocean is a fundamental feature which occurs at a wide range of temporal and spatial scales. Typical examples include (but not limited to) coastal upwelling, El Niño/La Niña, Pacific Decadal Oscillation and so on. A very strong manifestation of physical-biological-biogeochemical interactions/covariations takes place at the oceanic mesoscale, the mechanisms of which necessitate the use of multidisciplinary approaches (Chelton et al., 2011a; McGillicuddy, 2016). Recent progress in automated methods for identifying and tracking individual eddies globally, with merged satellite altimeter data, has opened a new window to examine these interdisciplinary couplings in eddy-centric coordinates at an unprecedented semimesoscale (∼50 km).
Normally, a mesoscale eddy is a rotational water column that extends to hundreds (even exceeding one thousand) of meters in the upper ocean through the so-called Ekman spiral, mixed layer, mirror layer (Chen and Geng, 2018), and pycnocline (thermocline, halocline) layer, as well as acoustic waveguide in hydrodynamics and geophysics, and the photic zone and the compensation layer in biological oceanography. An ideal strategy for eddy observation is to simultaneously capture its surface signature along with its interior structure. This forms a key motivation of the Guanlan science mission, which integrates the capacity of microwave remote sensing (via IA) to measure the surface dynamic topography, and the advantage of optical (lidar) remote sensing (via OL) to profile the internal biological aspect of the eddy properties. It should be stressed that such cross-disciplinary studies are greatly facilitated by recent advances in artificial intelligence techniques for big data analytics.
To Serve as a Bridge to Better Link Model With Observation
Observation (both in situ and remote sensing) and modeling are the two most powerful tools in support of modern oceanography. Obviously, their roles will be maximized when they have properly matched spatiotemporal scales. The concept of eddy-resolving numerical models was initialed in the 1990s (Semtner and Chervin, 1992), which is largely in pace with the mesoscale resolving (∼100 km) capability of satellite altimetry (Fu et al., 1994). With the rapid development of computing power, basin scale numerical simulations have crossed the threshold of submesoscale (∼10 km) around the turn of this century (Smith et al., 2000). The best spatial resolution of merged altimeter data to date, however, has stuck at the semi-mesoscale, left far behind the ocean model resolution. There is concern that the long-time mismatch between model and observation will slow down and eventually limit the development of ocean modeling.
Fortunately, this situation is likely to be dramatically changed with the scheduled launch of SWOT in 2021, and will be further improved by other follow-up missions including Guanlan. With this new generation of spaceborne interferometric imaging radars, the altimeter resolution is expected to catch up with the model resolution at ∼10 km level on a global scale, thus rebalance the bridge between observation and numerical modeling as far as sea level is concerned. The implication of this advancement is going to be profound: while mesoscale eddies are responsible for ∼50% of horizontal heat and substance transport in the ocean, variabilities at submesoscale (e.g., fronts and filaments) account for about half of the total vertical transport (Lindstrom et al., 2010). Vertical velocities associated with divergences and convergences of geostrophically balanced velocities on 10 km scale penetrate down to a few hundred meters below the ocean surface (Lapeyre et al., 2006). This will enable the vertical transfer of heat, nutrients, and dissolved CO2 to be resolved via SSH, paving the way to a new era of submesoscale oceanography, which might be a significant breakthrough for marine science in the 21st century.
To Demonstrate the Feasibility of Direct Satellite Sensing of Marine Life
The essential oceanographic variables that can be measured from space by prevail sensors (visible, thermal infrared, and microwave) include sea surface temperature, ocean salinity, SSH, vector wind, sea state, ocean color, and sea ice (Bonekamp et al., 2010). As far as ocean color and marine ecosystem are concerned, persistent cloud cover, periods of constant night and prevailing low solar elevations in polar regions severely limit traditional passive satellite ocean color measurements, and leave vast areas unobserved for many consecutive months each year. The advent of lidar technology creates an unprecedented opportunity/possibility for laser remote sensing of the ocean in at least two aspects: (i) Reveal depth resolving (instead of vertically integrated) optical properties of nearly the entire subsurface oceans including the polar regions, as demonstrated by CLIPSO; (ii) Directly detect signals of ocean animals, both community and individual, in the subsurface ocean. The potential ability to detect marine life and their food web from space will set a very significant milestone in the development of ocean remote sensing. Such a dream has never been so close as today: the lidar footprint of the Guanlan satellite is comparable to the size of big fish who favor to stay in the subsurface ocean between 0 and 200 m (which properly matches the penetration depth of OL). As a result, it is highly anticipated that we will soon enter the period of life signal identification and even animal trajectory tracking from space in the coming decade.
In summary, the key objectives of the Guanlan science mission are to resolve SSH at submesoscales, globally, using IA, and to extend the penetration depth of space-borne OL to the vicinity of thermocline, moving a critical step forward toward an ultimate goal of an “transparent ocean” which relies on fine resolution, full spectrum, and multidisciplinary oceanographic sensing and observation. Meanwhile, an integrated physical-biological measurement of the ocean will be achieved by effectively combining advanced laser and radar technologies, serving as China’s novel contribution to the international ocean remote sensing and space oceanography communities.
Author Contributions
GC and LW conceived and designed the review. YX, YZ, and JL contributed to the interferometric altimetry. SW and WC contributed to the ocean lidar. JT and FY contributed to the calibration and validation. CZ and CM contributed to the orbit design and sampling strategy. GC, YZ, WC, FY, and CM wrote the manuscript. All authors reviewed the manuscript and approved it for publication.
Funding
This research was supported by the Qingdao National Laboratory for Marine Science and Technology of China under grants numbers 2018SDKJ102 and 2015ASTP-OS15.
Conflict of Interest Statement
The authors declare that the research was conducted in the absence of any commercial or financial relationships that could be construed as a potential conflict of interest.
References
AVISO (2016). 2016: SSALTO/DUACS User Handbook: (M)SLA and (M)ADT Near-Real Time and Delayed Time Products. Issue 5.0, CLS-DOS-NT-06-034, SALP-MU-P-EA-21065-CLS. Redwood, CA: AVISO, 29.
Behrenfeld, M. J., and Falkowski, P. G. (1997). Photosynthetic rates derived from satellite-based chlorophyll concentration. Limnol. Oceanogr. 42, 1–20. doi: 10.4319/lo.1997.42.1.0001
Behrenfeld, M. J., Hu, Y., Hostetler, C. A., Dall’Olmo, G., Rodier, S. D., Hair, J. W., et al. (2013). Space-based lidar measurements of global ocean carbon stocks. Geophys. Res. Lett. 40, 4355–4360. doi: 10.1002/grl.50816
Behrenfeld, M. J., Hu, Y., O’Malley, R. T., Boss, E. S., Hostetler, C. A., Siegel, D. A., et al. (2017). Annual boom–bust cycles of polar phytoplankton biomass revealed by space-based lidar. Nat. Geosci. 10, 118–122. doi: 10.1038/ngeo.2861
Bonekamp, H., Parisot, F., Wilson, S., Miller, L., Donlon, C., Drinkwater, M., et al. (2010). “Transitions towards operational space based ocean observations, from single research missions into series and constellations,” in Proceedings of OceanObs’09: Sustained Ocean Observations and Information for Society, Vol. 1, eds J. Hall, D. E. Harrison, and D. Stammer (Auckland: ESA Publication WPP-306), 06. doi: 10.5270/OceanObs09
Capet, X., Klein, P., Hua, B. L., Lapeyre, G., and McWilliams, J. C. (2008). Surface kinetic energy transfer in surface quasi-geostrophic flows. J. Fluid Mech. 604, 165–174.
Chelton, D. B., Gaube, P., Schlax, M., Early, J., and Samelson, R. (2011a). The influence of nonlinear mesoscale eddies on near-surface oceanic chlorophyll. Science 334, 328–332. doi: 10.1126/science.1208897
Chelton, D. B., Schlax, M. G., and Samelson, R. M. (2011b). Global observations of nonlinear mesoscale eddies. Prog. Oceanogr. 91, 167–216. doi: 10.1016/j.pocean.2011.01.002
Chelton, D. B., and Schlax, M. G. (1996). Global observations of oceanic Rossby waves. Science 272, 234–238. doi: 10.1126/science.272.5259.234
Chen, G., and Geng, D. (2018). A “mirror layer” of temperature and salinity in the ocean: characteristics and implications. Clim. Dyn. 52, 1–13. doi: 10.1007/s00382-018-4495-6
Chen, G., and Han, G. (2019). Contrasting short-lived with long-lived mesoscale eddies in the global ocean. J. Geophys. Res. (in press).
Chen, G., and Yu, F. (2015). An objective algorithm for estimating maximum oceanic mixed layer depth using concurrent temperature/salinity data from Argo floats. J. Geophys. Res. 120, 582–595. doi: 10.1002/2014JC010383
Churnside, J. H. (2014). Review of profiling oceanographic lidar. Opt. Eng. 53:051405. doi: 10.1117/1.OE.53.5.051405
Churnside, J. H., Demer, D. A., Griffith, D., and Emmett, R. L. (2009). Comparisons of lidar, acoustic and trawl data on two scales in the Northeast pacific ocean. CalCOFI Rep. 50, 118–122.
Churnside, J. H., and Donaghay, P. L. (2009). Thin scattering layers observed by airborne lidar. ICES J. Mar. Sci. 66, 778–789. doi: 10.1093/icesjms/fsp029
Churnside, J. H., McCarty, B. J., and Lu, X. M. (2013). Subsurface ocean signals from an orbiting polarization lidar. Remote Sens. 5, 3457–3475. doi: 10.3390/rs5073457
Dekshenieks, M. M., Donaghay, P. L., Sullivan, J. M., Rines, J. E. B., Osborn, T. R., and Twardowski, M. S. (2001). Temporal and spatial occurrence of thin phytoplankton layers in relation tophysical processes. Mar. Ecol. Prog. Ser. 223, 61–71. doi: 10.3354/meps223061
Ducet, N., Le Traon, P. Y., and Reverdin, G. (2000). Global high-resolution mapping of ocean circulation from the combination of TOPEX/Poseidon and ERS-1 and -2. J. Geophys. Res. 105, 19477–19498.
Durand, M., Fu, L.-L., Lettenmaier, D. P., Alsdorf, D. E., Rodriguez, E., and Esteban-Fernandez, D. (2010). The surface water and ocean topography mission: observing terrestrial surface water and oceanic submesoscale eddies. Proc. IEEE 98, 766–779.
Fu, L.-L. (1983). Recent progress in the application of satellite altimetry to observing the mesoscale variability and general circulation of the oceans. Rev. Geophys. Space Phys. 21, 1657–1666. doi: 10.1029/RG021i008p01657
Fu, L.-L., and Chelton, D. B. (2001). “Large-scale ocean circulation,” in Satellite Altimetry and the Earth Sciences: A Handbook for Techniques and Applications, Vol. 69, eds L.-L. Fu and A. Cazenave (San Diego, CA: Academic Press), 133–169. doi: 10.1016/S0074-6142(01)80147-9
Fu, L.-L., Chelton, D. B., Le Traon, P. Y., and Morrow, R. (2010). Eddy dynamics from satellite altimetry. Oceanography 23, 14–25. doi: 10.5670/oceanog.2010.02
Fu, L. L., Christensen, E. J., Yamarone, C. A., Lefever, M., Ménard, Y., Dorrer, M., et al. (1994). TOPEX/POSEIDON mission overview. J. Geophys. Res. 99, 24369–24381. doi: 10.1029/94JC0176
Fu, L.-L., and Ferrari, R. (2013). Observing oceanic submesoscale processes from space. EO 89, 488–489. doi: 10.1029/2008EO480003
Fu, L.-L., and Ubelmann, C. (2014). On the transition from profile altimeter to swath altimeter for observing global ocean surface topography. J. Atmos. Oceanic Technol. 31, 560–568. doi: 10.1175/JTECH-D-13-00109.1
Hostetler, C. A., Behrenfeld, M. J., Hu, Y., Hair, J. W., and Schulien, J. A. (2018). Spaceborne lidar in the study of marine systems. Annu. Rev. Mar. Sci. 10, 121–147. doi: 10.1146/annurev-marine-121916-063335
Lapeyre, G., Klein, P., and Hua, B. L. (2006). Oceanic restratification forced by surface frontogenesis. J. Phys. Oceanogr. 36, 1577–1590. doi: 10.1175/jpo2923.1
Lindstrom, E., Bourassa, M. A., Anders Breivik, L., and James Donlon, C. (2010). “Research satellite missions,” in Proceedings of OceanObs’09: Sustained Ocean Observations and Information for Society, Vol. 1, eds J. Hall, D. E. Harrison, and D. Stammer (Auckland: ESA Publication WPP-306), 28. doi: 10.5270/OceanObs09
Lu, X. M., Hu, Y., Trepte, C., Zeng, S., and Churnside, J. H. (2014). Ocean subsurface studies with the CALIPSO spaceborne lidar. J. Geophys. Res. 119, 4305–4317. doi: 10.1002/2014JC009970
Lu, X. M., Hu, Y. X., Pelon, J., Trepte, C., Liu, K., Rodier, S., et al. (2016). Retrieval of ocean subsurface particulate backscattering coefficient from space-borne CALIOP lidar measurements. Opt. Express 24, 29001–29008. doi: 10.1364/OE.24.029000
McGillicuddy, D. J. Jr. (2016). Mechanisms of physical-biological-biogeochemical interaction at the oceanic mesoscale. Annu. Rev. Mar. Sci. 8, 125–159. doi: 10.1146/annurev-marine-010814-015606
Murphree, D. L., Taylor, C. D., and McClendon, R. W. (1974). Mathematical modeling for the detection of fish by an airborne laser. AIAA J. 12, 1686–1692. doi: 10.2514/3.49579
Overpeck, J. T., Meehl, G. A., Bony, S., and Easterling, D. R. (2011). Climate data challenges in the 21st century. Science 331, 700–702. doi: 10.1126/science.1197869
Pujol, M.-I., Faugère, Y., Taburet, G., Dupuy, S., Pelloquin, C., Ablain, M., et al. (2016). DUACS DT2014: the new multi-mission altimeter data set reprocessed over 20 years. Ocean Sci. 12, 1067–1090.
Scott, R., Bourassa, M., Chelton, D., Cipollini, P., Ferrari, R., Fu, L., et al. (2010). “Satellite altimetry and key observations: what we’ve learned, and what’s possible with new technologies,” in Proceedings of OceanObs’09: Sustained Ocean Observations and Information for Society, Vol. 2, eds J. Hall, D. E. Harrison, and D. Stammer (Auckland: ESA Publication WPP-306), doi: 10.5270/OceanObs09.cwp.76
Semtner, A. J., and Chervin, R. M. (1992). Ocean general circulation from a global eddy-resolving model. J. Geophys. Res. 97, 5493–5550. doi: 10.1029/92JC00095
Smith, R. D., Maltrud, M. E., Bryan, F. O., and Hecht, M. W. (2000). Numerical simulation of the North Atlantic ocean at 1/10°. J. Phys. Oceanogr. 30, 1532–1561.
Stephens, M., Weimer, C., Saiki, E., and Lieber, M. (2010). “On-orbit models of the CALIOP lidar for enabling future mission design,” in Proceedings of SPIE-The International Society for Optical Engineering (Bellingham, WA: SPIE), doi: 10.1117/12.860900
Wilson, S., Parisot, F., Escudier, P., Fellous, J., Benveniste, J., Bonekamp, H., et al. (2010). “The ocean surface topography constellation: the next 15 years in satellite altimetry,” in Proceedings of OceanObs’09: Sustained Ocean Observations and Information for Society, Vol. 2, eds J. Hall, D. E. Harrison, and D. Stammer (Auckland: ESA Publication WPP-306), doi: 10.5270/OceanObs09.cwp.92
Winker, D. M., Couch, R. H., and McCormick, M. P. (1996). An overview of LITE: NASA’s lidar in-space technology experiment. Proc. IEEE 84, 164–180. doi: 10.1109/5.482227
Winker, D. M., Pelon, J., Coakley, J. A. Jr., Ackerman, S. A., Charlson, R. J., Colarco, P. R., et al. (2010). The CALIPSO mission: a global 3D view of aerosols and clouds. Bull. Am. Meteorol. Soc. 91, 1211–1229. doi: 10.1175/2010BAMS3009.1
Winker, D. M., Vaughan, M. A., Omar, A., Hu, Y., Powell, K. A., Liu, Z., et al. (2009). Overview of the CALIPSO Mission and CALIOP data processing algorithms. J. Atmos. Oceanic Technol. 26, 2310–2323. doi: 10.1175/2009JTECHA1281.1
Keywords: concept design, Guanlan science mission, interferometric altimetry, ocean lidar, space oceanography
Citation: Chen G, Tang J, Zhao C, Wu S, Yu F, Ma C, Xu Y, Chen W, Zhang Y, Liu J and Wu L (2019) Concept Design of the “Guanlan” Science Mission: China’s Novel Contribution to Space Oceanography. Front. Mar. Sci. 6:194. doi: 10.3389/fmars.2019.00194
Received: 02 November 2018; Accepted: 27 March 2019;
Published: 17 April 2019.
Edited by:
Amos Tiereyangn Kabo-Bah, University of Energy and Natural Resources, GhanaReviewed by:
Yongxiang Hu, Langley Research Center, United StatesPengwang Zhai, University of Maryland, Baltimore County, United States
Copyright © 2019 Chen, Tang, Zhao, Wu, Yu, Ma, Xu, Chen, Zhang, Liu and Wu. This is an open-access article distributed under the terms of the Creative Commons Attribution License (CC BY). The use, distribution or reproduction in other forums is permitted, provided the original author(s) and the copyright owner(s) are credited and that the original publication in this journal is cited, in accordance with accepted academic practice. No use, distribution or reproduction is permitted which does not comply with these terms.
*Correspondence: Ge Chen, Z2VjaGVuQG91Yy5lZHUuY24=