 Pierre Yves Le Traon1*
 Antonio Reppucci1
 Enrique Alvarez Fanjul2
 Lotfi Aouf3
 Arno Behrens4
 Maria Belmonte5
 Abderrahim Bentamy6
 Laurent Bertino7
 Vittorio Ernesto Brando8
 Matilde Brandt Kreiner9
 Mounir Benkiran1
 Thierry Carval6
 Stefania A. Ciliberti10
 Hervé Claustre11
 Emanuela Clementi10
 Giovanni Coppini10
 Gianpiero Cossarini12
 Marta De Alfonso Alonso-Muñoyerro2Anne Delamarche1Gerald Dibarboure13Frode Dinessen14Marie Drevillon1
 Yann Drillet1
 Yannice Faugere15
 Vicente Fernández16Andrew Fleming17M. Isabel Garcia-Hermosa1Marcos García Sotillo2
 Gilles Garric1
 Florent Gasparin1Cedric Giordan1
 Marion Gehlen18Marilaure L. Gregoire19
 Stephanie Guinehut15
 Mathieu Hamon1
 Chris Harris20
 Fabrice Hernandez1,21
 Jørgen B. Hinkler9
 Jacob Hoyer9
 Juha Karvonen22
 Susan Kay20
 Robert King20
 Thomas Lavergne14
 Benedicte Lemieux-Dudon10
 Leonardo Lima10
 Chongyuan Mao20
 Matthew J. Martin20
 Simona Masina10
 Angelique Melet1
 Bruno Buongiorno Nardelli8
 Glenn Nolan16
 Ananda Pascual23
 Jenny Pistoia10
 Atanas Palazov24Jean Francois Piolle6
 Marie Isabelle Pujol15
 Anne Christine Pequignet20Elisaveta Peneva25
 Begoña Pérez Gómez2Loic Petit de la Villeon6
 Nadia Pinardi10Andrea Pisano8
 Sylvie Pouliquen6
 Rebecca Reid20
 Elisabeth Remy1
 Rosalia Santoleri8
 John Siddorn20
 Jun She9
 Joanna Staneva4
 Ad Stoffelen5
 Marina Tonani20
 Luc Vandenbulcke19
 Karina von Schuckmann1
 Gianluca Volpe8
 Cecilie Wettre14Anna Zacharioudaki26
- 1Mercator Ocean International, Ramonville-Saint-Agne, France
- 2Puertos del Estado, Madrid, Spain
- 3Meteo France, Toulouse, France
- 4Helmholtz Centre for Materials and Coastal Research (HZG), Hamburg, Germany
- 5Royal Netherlands Meteorological Institute (KNMI), De Bilt, Netherlands
- 6Ifremer, Brest, France
- 7Nansen Environmental and Remote Sensing Center (NERSC), Bergen, Norway
- 8Italian National Research Council (CNR), Rome, Italy
- 9Danish Meteorological Institute (DMI), Copenhaguen, Denmark
- 10Euro-Mediterranean Center on Climate Change (CMCC), Bologna, Italy
- 11LOV, Villefranche-sur-Mer, France
- 12National Institute of Oceanography and Experimental Geophysics (OGS), Trieste, Italy
- 13Centre National d'Etudes Spatiales (CNES), Toulouse, France
- 14Met.No, Oslo, Norway
- 15Collecte Localisation Satellites (CLS), Ramonville-Saint-Agne, France
- 16EuroGOOS, Brussels, Belgium
- 17British Antarctic Survey (BAS), Cambridge, United Kingdom
- 18LSCE/IPSL, Gif-sur-Yvette, France
- 19Department of Astrophysics, Geophysics and Oceanography, University of Liege, Liege, Belgium
- 20Met Office, Exeter, United Kingdom
- 21IRD/Legos, Toulouse, France
- 22Finnish Meteorological Institute (FMI), Helsinki, Finland
- 23Instituto Mediterráneo de Estudios Avanzados (IMEDEA), Esporles, Spain
- 24Institute of Oceanology, Bulgarian Academy of Sciences (IOBAS), Varna, Bulgaria
- 25Department of Meteorology and Geophysics, University of Sofia, Sofia, Bulgaria
- 26Hellenic Centre for Marine Research (HCMR), Athens, Greece
The Copernicus Marine Environment Monitoring Service (CMEMS) provides regular and systematic reference information on the physical and biogeochemical ocean and sea-ice state for the global ocean and the European regional seas. CMEMS serves a wide range of users (more than 15,000 users are now registered to the service) and applications. Observations are a fundamental pillar of the CMEMS value-added chain that goes from observation to information and users. Observations are used by CMEMS Thematic Assembly Centres (TACs) to derive high-level data products and by CMEMS Monitoring and Forecasting Centres (MFCs) to validate and constrain their global and regional ocean analysis and forecasting systems. This paper presents an overview of CMEMS, its evolution, and how the value of in situ and satellite observations is increased through the generation of high-level products ready to be used by downstream applications and services. The complementary nature of satellite and in situ observations is highlighted. Long-term perspectives for the development of CMEMS are described and implications for the evolution of the in situ and satellite observing systems are outlined. Results from Observing System Evaluations (OSEs) and Observing System Simulation Experiments (OSSEs) illustrate the high dependencies of CMEMS systems on observations. Finally future CMEMS requirements for both satellite and in situ observations are detailed.
Introduction
The Copernicus Marine Environment Monitoring Service (CMEMS) is one of the six pillar services of the EU (European Union) Copernicus programme. Mercator Ocean International was tasked in 2014 by the EU under a delegation agreement to implement the operational phase of the service from 2015 to 2021. The CMEMS provides regular and systematic reference information on the physical and biogeochemical ocean and sea-ice state for the global ocean and the European regional seas. This capacity encompasses the description of the current situation (analysis), the prediction of the situation 10 days ahead (forecast), and the provision of consistent retrospective data records (reprocessing and reanalysis). CMEMS provides a sustainable response to European user needs in four areas: (i) maritime safety, (ii) marine resources, (iii) coastal and marine environment, and (iv) weather, seasonal forecast and climate. A major objective of the CMEMS is to deliver and maintain a state-of-the-art European service responding to public and private intermediate user needs, and thus involving explicitly and transparently these users in the service delivery definition.
The CMEMS mission includes:
✓ Providing short-term forecasts and outlooks for marine conditions and, as appropriate, to downstream services for warnings of and/or rapid responses to extreme or hazardous events;
✓ Providing detailed descriptions of the ocean state to initialize coupled ocean/atmosphere models for predicting changes in the atmosphere/climate;
✓ Monitoring and reporting on past and present marine environmental conditions (physics and biogeochemistry), in particular, the response of the oceans to climate change and other stressors;
✓ Analyzing and interpreting changes and trends of the marine environment;
✓ Providing an easy, efficient, and timely information delivery service to users;
✓ Developing a communication and outreach plan and activities that allow European users to fully benefit from information and intelligence about the marine environment.
Observations are a fundamental pillar of the CMEMS value-added chain that extends from observation to information and users. Use of modeling and data assimilation is then an essential step for transforming sparse in situ and surface satellite observations into four dimensional ocean fields and forecasts (e.g., Bell et al., 2015). Data assimilation allows dynamical interpolation of observations, taking into account the complementarities between the different types of observations, and allows derivation of parameters that are not directly observed. High spatial and temporal resolution ocean fields, consistent with observations and model dynamics and ocean forecasts, are thus derived. Such a science-based and state-of-the-art approach is required to best serve applications and users.
The ocean observing system is highly dependent on international cooperation and the international coordination from the Global Ocean Observing System (GOOS) and the Committee for Earth Observation Satellites (CEOS) is essential to CMEMS. CMEMS also benefits from and contributes to international cooperation and coordination on modeling and data assimilation through the GODAE OceanView/Ocean Predict programme and users and applications through the Group of Earth Observation (GEO) Blue Planet initiative.
The paper provides an overview of in situ and satellite observations that are used by CMEMS and details present and future requirements. The objective is to detail how integrated systems, such as CMEMS, critically depend on observations and provide the reader with long-term perspectives for the development of CMEMS and implications for the evolution of the in situ and satellite observing systems. This paper is organized as follows. An overview of CMEMS products, services, and users is given in section CMEMS Architecture, Products, and Users, while section CMEMS Service Evolution details over-arching goals and associated actions planned for the evolution of the service. To quantify the high dependencies of CMEMS systems on observations, results from OSEs (Observing System Evaluations) and OSSEs (Observing System Simulation Experiments) are presented in section Role and Impact of observations for the Copernicus Marine Service. Initial requirements, status and future requirements for satellite and in situ observations are discussed in sections Satellite Observations Used by the Copernicus Marine Service: Status and Requirements and In situ Observations Used by the Copernicus Marine Service: Status and Gaps, respectively. Main conclusions are given in section Conclusion.
CMEMS Architecture, Products, and Users
Architecture
The backbone of the CMEMS relies on a distributed architecture of production centers for observations (Thematic Assembly Centres—TACs), modeling/assimilation (Monitoring and Forecasting Centres—MFCs) and a Central Information System (CIS) (Figure 1); it includes:
- Eight TACs, six satellite TACs organized by ocean variables (sea-surface topography, ocean color, sea-surface temperature, sea-ice, winds and waves), one for in situ observations and one multi-observation TAC (that merges different in situ and satellite data to elaborate high-level products). These production centers gather observation data from in situ networks [e.g., the Global Ocean Observing System (GOOS), the Joint Technical Commission for Oceanography and Marine Meteorology (JCOMM), and the European Global Ocean Observing System (EuroGOOS) and from the Copernicus satellite component, through the European Space Agency (ESA) and the European organization for the exploitation of Meteorological Satellite (EUMETSAT)]. TACs generate validated data sets directly useable for assimilation in models (MFCs) and derive high-level products (i.e., gridded multi-sensor products) directly useable for downstream applications.
- Seven MFCs, distributed according to the marine area covered (Global Ocean, Arctic Ocean, Baltic Sea, North Atlantic North West European Shelf, North Atlantic Iberia-Biscay-Ireland area, Mediterranean Sea and Black Sea), that generate model-based products on the ocean physical state and biogeochemical characteristics, including forecasts, hindcasts and reanalyses.
- A CIS, encompassing the management and organization of CMEMS information and products. A single catalog (global and European coverage) is offered to users. The CIS allows searching, viewing, downloading products and monitoring of the system. A manned service desk provides a network of technical and marine experts to support users.
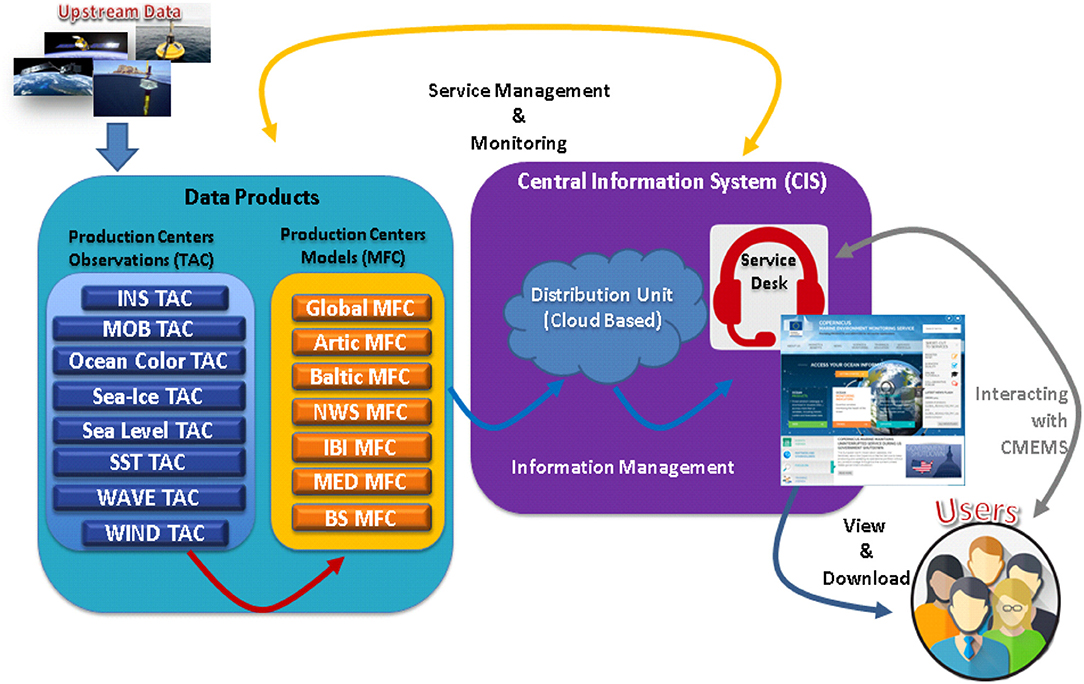
Figure 1. CMEMS Architecture.
Products
CMEMS products are based on state-of-the-art data processing and advanced modeling and data assimilation techniques. The product uncertainties are assessed through rigorous internationally recognized quality assessment methods (e.g., Hernandez et al., 2015). CMEMS today provides about 160 different products for observations and model outputs (CMEMS catalog at http://marine.copernicus.eu) covering ocean physics (temperature, salinity, sea level, currents, waves), sea-ice (concentration, thickness, drift) and biogeochemistry (chl-a, oxygen, pH, nutrients). Modeling and data assimilation products have a resolution of 1/12° for the global scale and from 1/24° to 1/72° for the regional applications. The CMEMS CIS and its service desk provide an easy, efficient and timely access to CMEMS data and products and related information.
CMEMS publishes an annual Ocean State Report (Von Schuckmann et al., 2017, 2018) for the scientific community, as well as for policy and decision-makers. It provides information on the state of the global ocean and European regional seas and how they have changed over the recent past. The Ocean State Reports rely on the unique capability and expertise that CMEMS gathers in Europe to monitor, assess and report on past and present marine environmental conditions and to analyse and interpret changes and trends in the marine environment. Based on Ocean State Report results, CMEMS produces Ocean Monitoring Indicators (OMIs) that are used to monitor the main changes and trends in the marine environment over the past 25 years. The CMEMS data and products allow comprehensive monitoring of the global ocean and European seas. CMEMS Ocean State Reports and associated OMIs go one step further by developing science-based assessments of the state and health of our oceans and seas.
Data Access
All CMEMS products (NetCDF format) are freely accessible through a single internet interface (http://marine.copernicus.eu/getting-started/).
The interactive catalog (http://marine.copernicus.eu/services-portfolio/access-to-products/) allows users to select products according to geographical area, parameter, time span, and vertical coverage. Users can also select a product by using a key-word search. Once a product has been selected, the user can view it without registration.
Once a product has been selected, CMEMS offers three different authenticated download mechanisms:
• Subsetter (HTTP protocol, subset the files) to extract and download only a part of a product (per area, per variable, for a period of time, some depths).
• Direct Get File (HTTP protocol) to download large dataset (according to a period of time).
• CMEMS FTP (standard FTP protocol).
Access to the catalog and instructions to discover, search and download CMEMS products are detailed in a dedicated “Tutorial Section” (http://marine.copernicus.eu/training/online-tutorials/).
Users
CMEMS provides a core/generic service targeting downstream service providers (intermediate users) and serving a wide range of users and applications. Four key application areas have been identified:
• Maritime Safety: marine operations, sea-ice forecasting, incident response (e.g., oil-spill), ship routing, search and rescue, flood prevention and offshore industries and operations.
• Marine Resources: sustainable management of living marine resources, including fisheries and aquaculture. The primary goals of fishery management are ecosystem services, as well as maximum sustainable yield and rebuilding overexploited stocks. Aquaculture management bodies provide advice on the assessment of the multitrophic productivity and on the environmental impact of marine farming.
• Marine and coastal environment: monitoring and understanding good environmental status (see the European Marine Strategy Framework Directive), sustainable tourism and aquaculture, protection of the coasts against erosion and land-based sources of pollution, as well as human and ecosystem health. The development of effective Integrated Coastal Zone Management concepts and decision-making support systems are also included.
• Weather, seasonal forecasting and climate: quality-controlled marine information on a daily basis, as well as long time series of reprocessed data and reanalyses.
CMEMS is also important to make progress toward assessing the impact of ocean physical and biogeochemical changes on biology and biodiversity.
Details of CMEMS benefit areas and a series of use cases (>150) are available at http://marine.copernicus.eu/markets/.
The CMEMS service desk regularly monitors the number and types of users, the statistics on downloaded products and user satisfaction (Figure 2). More than 15,000 users are now registered with the service and there has been a steady increase in the uptake of the service over the past couple of years. CMEMS users are distributed across its four benefit areas. More than half of CMEMS users and 25% of the number of downloads come from research organizations. Public sector applications (e.g., policy, environmental monitoring, and marine safety) represent 18% of the users and 33% of the number of downloads. Private sector applications account for 13% of the users and 35% of the number of downloads. Users access model-based and observation products equally. The same holds for real-time (observations, models) and delayed mode (reprocessed data sets and reanalyses) products. The most frequently downloaded products are the real-time global analyses and forecasts, followed by reprocessed and real-time gridded sea-level maps. Real-time global gridded sea-surface temperature (SST), global ocean reanalyses and Mediterranean Sea regional analyses and forecasts are the next group of most-downloaded products.
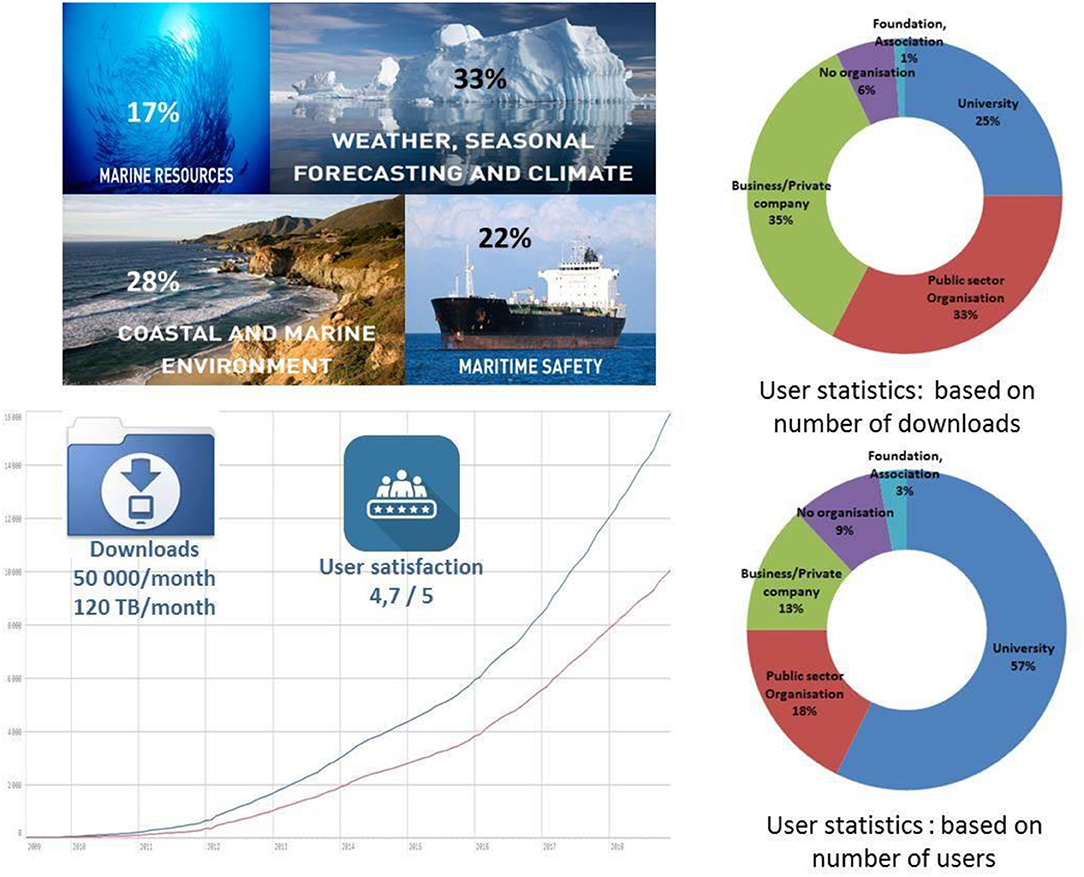
Figure 2. CMEMS Service Monitoring statistics. Number of registered users (blue) and active users (i.e., those who have downloaded data; lower left; red). User statistics (average over 2018) per benefit areas (upper left) and per user types, based on number of users (upper right) and number of downloads (lower right). User satisfaction figure, number of downloads per month (1 download = 1 user x 1 dataset) and volume of downloads per month are also given.
CMEMS Service Evolution
Strategy
CMEMS evolves based on requirements from its users, considering both existing and future needs, and the need to maintain competitiveness with respect to international players. CMEMS evolution responds to new science and technology (e.g., modeling and assimilation developments and data processing technologies) and opportunities emerging from satellite and in situ observations, thus strongly linking CMEMS evolution to that of the in situ and satellite observing systems.
The CMEMS Service Evolution high-level strategy and its associated Research and Development (R&D) priorities (Mercator Ocean, 2016; CMEMS STAC, 2017) introduce a set of overarching goals and associated actions and R&D priorities for evolving the service from its initial state toward a mature, state-of-the-art, leading and innovative Copernicus Service.
Drivers: Societal Needs and Blue Growth
The need to monitor and forecast the oceans has never been so high on the political agenda: (1) the Sustainable Development Goal 14, “Conserve and sustainably use the oceans, seas and marine resources for sustainable development” is firmly on the 2030 agenda of the United Nations; (2) the Intergovernmental Panel on Climate Change decided to prepare a report “The Ocean and Cryosphere in a Changing Climate”; and (3) the G7 science ministers have set up a special initiative on the future of the ocean and its seas. Monitoring and forecasting are essential for sustainable management of the ocean and its resources, which are under pressure due to the effects of climate change and other human activities (e.g., fishing, pollution, mining), as well as for developing the blue economy. It is equally important in order to understand and predict how our climate is evolving. In 2010, the ocean economy represented USD 1.5 trillion in value (OECD, 2016). By 2030, conservative assessment estimates that ocean economy will grow to more than USD 3 trillion, much of which will rely on coastal tourism, offshore oil and gas and port activities. Marine aquaculture will grow at an annual rate of 5.7% between 2010 and 2030. The blue economy growth will increase stress on ocean resources and marine spatial planning, especially in exclusive economic zones. The need for much better management of the oceans, relying on comprehensive ocean observing, monitoring, forecasting and assessment activities, is the main driver for CMEMS and its evolution.
Gathering User Requirements and Translating Them Into Future Service Solutions
CMEMS is a user-driven service with user requirements being regularly gathered by Mercator Ocean International and its CMEMS partners through user workshops (regional and thematic), training sessions, questionnaires and regular user interactions with the CMEMS service desk. Initially, the main requirements from users included the need for better spatial resolution, improved quality assessment and the addition of wave products (both observations and model-based products) into the service catalog.
User requirements drive the evolution of CMEMS service, which, in turn, leads to revised specifications for satellite and in situ observations. User requirements (e.g., knowledge of the ocean currents at 1-km resolution) do not translate directly into satellite or in situ observation requirements. User requirements must go through the service value-added chain, taking into account, in particular, the complementary nature of satellite and in situ observations and the role of modeling and data assimilation. CMEMS requirements for future observations are thus based on an analysis of the observations required and most important for improving/constraining future CMEMS products and services.
Service Evolution
CMEMS service evolution and associated R&D activities are essential in order to respond to user needs, maintain state-of-the-art systems and to benefit from improved observing systems and scientific advances in processing, validation methodologies, modeling and data assimilation. As described in Le Traon et al. (2017a), important R&D advances have been achieved during CMEMS Phase 1 (April 2015-April 2018) and a significantly improved service is now provided to the users, including wave products, improved model resolution, wave/circulation coupling, better use of existing satellite and in situ observations, uptake of Sentinel-1 (S-1) (sea-ice coverage, ocean waves) and Sentinel-3 (S-3) (altimetry, sea-surface temperature, ocean color) data, longer time series of reprocessed in situ and satellite data and ocean reanalyses, improved and more homogenized product quality assessments, ocean monitoring indicators and ocean state reports.
In April 2018, CMEMS entered its Phase II (April 2018-April 2021). During this time, the following improvements or evolutions are planned:
• Improving product quality and product quality assessment.
• Improved horizontal and vertical model resolution.
• Increasing the number of MFCs with explicit representation of tides.
• Wave/circulation coupling to better represent upper-ocean dynamics (e.g., currents).
• Improved data assimilation methods (e.g., ensemble methods) and the assimilation of new types of data (e.g., sea-ice thickness).
• Improved CMEMS biogeochemical (BGC) products (observations and model-based), with the assimilation of ocean color satellite observations in all BGC models and the progressive assimilation of BGC Argo data.
• New observation products [in particular, surface currents from High Frequency (HF) radars; sea-ice thickness from Cryosat-2, SMOS and Sentinel-3; partial pressure of CO2 (pCO2) and acidity (pH) from in situ observations].
• Better addressing requirements of coastal users. Improved satellite products (e.g., high-resolution ocean color) will be proposed and stronger links with downstream coastal modeling systems will be set up.
• In parallel, the Copernicus Data and Information Access Services (DIAS) platforms (e.g., wekeo.eu) will allow the development of new services by providing an integrated access to data and products from all Sentinel satellites and Copernicus Services. Cloud-based processing capabilities will be provided so that users can develop and execute their own applications.
In the longer term, CMEMS will need to significantly evolve in order to monitor and forecast the ocean at finer scale and to improve the monitoring of the coastal zone. In the post-2025 time period, CMEMS model resolutions will increase by a factor of at least three (e.g., global 1/36°, regional 1/108°) compared to the present, and more-advanced data assimilation methods will be available. The objective will be to characterize, at fine scale, the upper-ocean dynamics to improve, in particular, our ability to describe and forecast the ocean currents and provide better boundary conditions for very-high-resolution coastal models. This enhanced resolution is essential for key applications, such as maritime safety, maritime transport, search and rescue, fish egg and larvae drift modeling, riverine influence in the coastal environment, pollution monitoring and offshore operations. Fine-resolution modeling also poses strong challenges for the evolution of satellite (e.g., wide-swath altimetry) and in situ (e.g., high-resolution coastal observations) observing system evolution.
CMEMS must also improve its ability to monitor and forecast the BGC state of the ocean (e.g., ocean carbon uptake, acidification, de-oxygenation, eutrophication, water quality, biological productivity). Improved BGC products are required for the Marine Strategy Framework Directive (MSFD), guiding decisions and actions by governments and industry, and supporting knowledge-based management of marine resources (fishery, aquaculture). CMEMS offer is critically dependent on major improvements in the “green” component of the observing system, such as advanced satellite derived products, dedicated algorithms, and innovative in situ technologies (e.g., BGC Argo, Gliders, FerryBoxes, and Continuous Plankton Recorders).
Role and Impact of Observations for the Copernicus Marine Service
The Role of Observations
The quality of CMEMS products is highly dependent on the availability of upstream in situ and satellite observations. Observations are used both by CMEMS TACs to create data products, and by CMEMS MFCs to validate and constrain their global and regional ocean analysis and forecasting systems. CMEMS critically depends on the near-real-time availability of high-resolution satellite data. In situ data are of paramount importance for CMEMS because they provide information about the ocean interior which cannot be observed from space. In situ observations also can locally sample high-frequency and high-resolution ocean processes, in particular, in the coastal zone that are essential for model and satellite validation activities.
The outstanding development of the Copernicus Sentinel missions has already had a major impact on CMEMS (Le Traon et al., 2017a). The impact will be even greater when the Sentinel constellations are fully implemented. CMEMS systems are, in particular, highly dependent on the status of the altimeter constellation. There is a clear degradation of analysis and forecast quality when reducing the number of assimilated altimeters. Sea-ice products and services have been strongly improved, thanks to the Sentinel-1 A/B constellation; however, they are also very dependent on third-party passive microwave missions. Ocean color and SST data from Sentinel-3 improved the quality of CMEMS ocean color and SST products. Sentinel-2 is not yet integrated into CMEMS products, but already demonstrated high potential for coastal zone monitoring. In situ observations also play a critical role within CMEMS. The Argo array of profiling floats has, in particular, a major impact on the quality of CMEMS global and regional analyses and forecasts (e.g., Turpin et al., 2016; Le Traon et al., 2017a).
Based on CMEMS Phase I activities, we now have a more refined understanding on the impact and utility of observing systems for the Copernicus Marine Service. The impact of present and future observations can be quantified and more precise recommendations for the observing system evolution can be derived. These assessments are described in sections Assessing the Impact of Present and Future Observations and Altimeter Constellation along with background information needed to revise/update CMEMS observation requirements provided in sections Satellite Observations Used by the Copernicus Marine Service: Status and Requirements and In situ Observations Used by the Copernicus Marine Service: Status and Gaps.
Assessing the Impact of Present and Future Observations
Ocean forecasting systems have a high dependency on observation availability and quality. Observation impact studies are required to:
• verify that observation information is “optimally” used in the analysis step and improve the assimilation components,
• quantify the impact of the present observation network on ocean analyses and forecasts,
• demonstrate the value of an observation network for operational ocean analysis and forecasts,
• help define and test new mission concepts, from an integrated system perspective involving satellite and in situ observations and numerical models.
Observation impact monitoring is part of CMEMS regular activities. This is done through OSEs and OSSEs (Fujii et al., this issue). By withholding observations, OSEs assess the impact of an existing data set on the performance of a modeling and data assimilation system (e.g., Lea et al., 2014). OSSEs help in designing future observing systems, evaluating their different configurations, exploring their potential impact, and performing preparatory data assimilation work. In an OSSE, one model is used to perform a “truth” run to produce synthetic observations for assimilation into the test model. The test model's performance is evaluated by comparing it against the truth run. OSSEs need to be calibrated with OSEs to ensure that results are meaningful (Hoffman and Atlas, 2016).
OSSEs and OSEs require significant computer infrastructure to run research versions of operational systems. Alternative and complementary approaches exist (Fujii et al., in review). The computation of Degrees of Freedom of the System (DFS) (Cardinali et al., 2004; Oke et al., 2015) allows, in particular, monitoring of the relative impact of observations on analyses. The DFS represent the equivalent number of independent observations that constrain the model analysis at the observation point. Comparing the DFS with the number of observations indicates the information content. Computation of DFS is simple in theory, but the practical implementation depends on the data assimilation scheme. DFS monitoring is progressively being implemented in the CMEMS MFCs and TACs. Even though the DFS values inherently have no physical meaning, providing them for each assimilation cycle has various practical uses:
• It serves as an internal diagnostic to verify that the relative impact of each assimilated data type or subset is balanced: no individual data stream is out-competing the other data sources.
• It provides a no-cost indication of how changes in upstream data (typically their frequency, location or accuracy) affect the relative balance between assimilated datasets.
• Changes of model settings can be similarly assessed.
• It provides a convenient way to assess the potential impact of planned missions, for which the data is not yet available, but the orbits, repeat cycles and the measurement uncertainties are known to some degree.
CMEMS has also developed multi-observations ocean products and systems based on observations (satellite and in situ) and state-of-the-art statistical data fusion techniques. They cover the physical and biogeochemical states of the ocean, at the surface and at depth. OSEs/OSSEs based on statistical data fusion techniques are lighter and complementary approaches to studies based on modeling and data assimilation systems. OSEs were used, for example, to evaluate the synergic use of satellite observation in improving the accuracy and resolution of observational products, such as currents (e.g., Rio et al., 2016; Rio and Santoleri, 2018) or salinity (e.g., Buongiorno Nardelli, 2012).
Synthesis of OSE/OSSE Results
Altimeter Constellation
Sea-level multi-mission altimeter data sets are very sensitive to the altimeter constellation (in terms of the number of satellites and their orbital configuration). Historically, OSEs and OSSEs have been used in altimetry to measure or predict the impact of a constellation (e.g., Le Traon and Dibarboure, 1999). In the last decade, due to the increase of the number of altimetry missions, numerous studies have been performed. The first objective was to monitor the quality of the product as a function of the constellation. Dibarboure et al. (2011) quantified the higher level of Eddy Kinetic Energy observed with four satellites compared to two satellites. Then, with the aging of Jason-1, Jason-2 and Altika, the various scenarios for their end of life needed to be analyzed (e.g., Dibarboure et al., 2012, 2018). Several analyses also were performed to find the best compromise for the orbits of Sentinel-3B and D to give to the Sentinel-3 constellation the capacity to monitor mesoscale variability much better than initially planned. Finally OSEs/OSSEs are needed to optimize future constellations (planned for the 2020/2030 time frame) and assess the potential of future altimetry missions (e.g., Pujol et al., 2012). Figure 3 gives an overview of all the configuration change for past 25 years. It shows the relative contribution (in percent) of each mission in the CMEMS multi-altimeter maps. This contribution is derived from a DFS analysis computed as part of the offline production chain of the CMEMS Sea Level TAC.
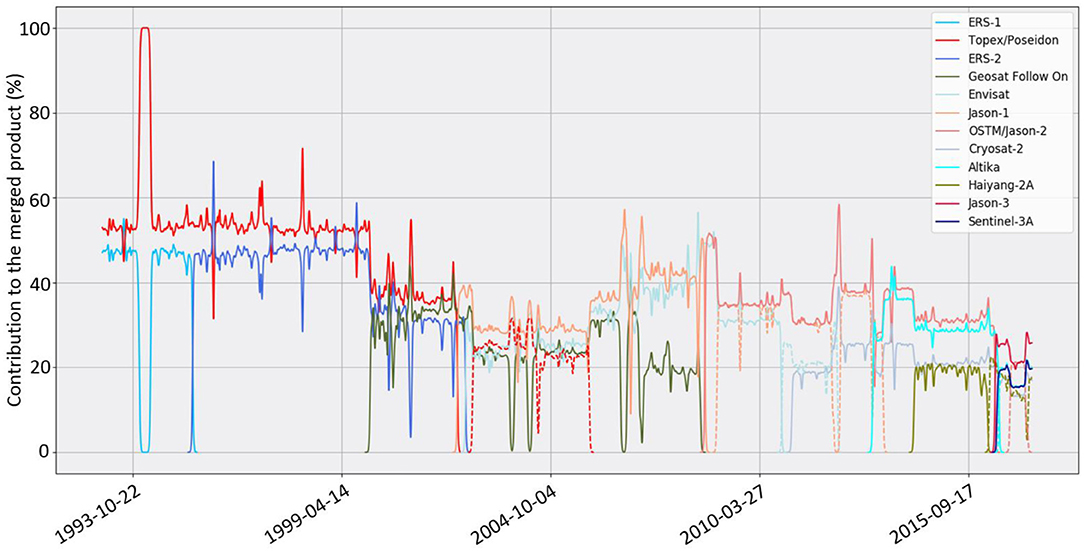
Figure 3. Relative contribution (in percent) of each altimeter mission in the CMEMS multi-mission altimeter maps. Results are derived from a Degrees of Freedom of the System analysis. The top-right legend details the name of the altimeter missions in chronological order. In several cases, when the orbit configuration changes (e.g., management at the end of life of the mission) the mission contribution is represented by a dashed line.
CMEMS modeling and data assimilation systems highly depend on the status of the altimeter constellation (Le Traon et al., 2017b). Both OSEs (e.g., Hamon et al., in press) and OSSEs (e.g., Verrier et al., 2017) demonstrate the major contribution of altimetry. At least three and preferably four altimeters are required to constrain modeling and data assimilation systems (Figure 4). This is particularly true with high-resolution data assimilation systems. A new generation of nadir altimeters now provides enhanced capability, thanks to a Synthetic Aperture Radar (SAR) mode that reduces measurement noise (Boy et al., 2017; Heslop et al., 2017). A first assessment of the impact of SAR mode altimetry on ocean analysis and forecasting was carried out using OSSEs with the global Mercator Ocean high-resolution 1/12° system (Verrier et al., 2018). Compared to conventional altimetry, a constellation of three SAR altimeters reduces Sea Surface Height (SSH) variance errors for both analyses and forecasts by about 20% in western boundary currents, suggesting that use of SAR multiple altimeter missions with high-resolution models will improve the capability of the ocean analysis and forecasting systems in the near future.
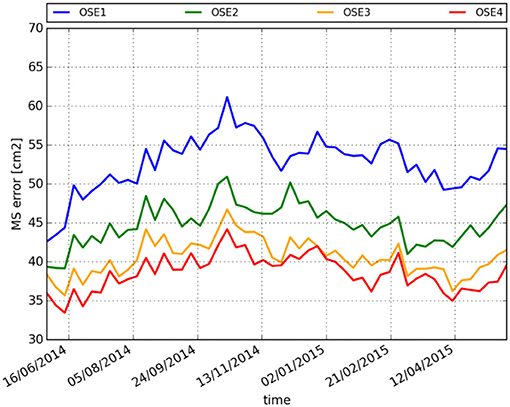
Figure 4. Time series of Sea Surface Height (SSH) forecasts Mean Squared (MS) error (cm2) for different Observing System Experiments (OSEs) assimilating 1, 2, 3, and 4 altimeters.
Accurate knowledge of the Mean Dynamic Topography (MDT) is a fundamental element for assimilation into operational ocean forecasting systems (e.g., Le Traon et al., 2017b). Thanks to the inputs of altimetric, in situ data and gravimetric missions (GRACE and GOCE satellite missions) data, MDTs are regularly updated (Rio et al., 2011, 2014), leading to considerable improvements in both forecasts and analyses. Hamon et al. (in press) showed that, in terms of impact on SSH, assimilating an updated release of the MDT is comparable to assimilating a fourth altimeter. Due to steric adjustments, temperature and salinity biases in the top-2,000 m-depth layer are also reduced.
Wide-Swath Altimetry
Mercator Ocean has performed initial OSSEs for Surface Water Ocean Topography (SWOT) mission using a 1/12° regional model of the IBI region that includes tidal forcing (Benkiran, personal communication). The truth run was derived from a 1/36° model run over the same region. SWOT errors were derived using the NASA-JPL SWOT Simulator, taking into account only white-noise error from the Ka-band radar interferometer instrument (Karin). This first study demonstrated the feasibility of assimilating SWOT data in Mercator Ocean high-resolution models. It also quantified how SWOT should better constrain ocean models, compared to conventional nadir altimeters. Compared to three nadir altimeters, SWOT combined with three nadir altimeters (post-2021 situation) should allow a reduction of 5-day sea-level analysis and forecast errors by about 45 and 30%, respectively. The system is also able to sustain the appropriate level of mesoscale activity, in spite of the SWOT revisit time (21 days).
The impact of a constellation of two wide-swath altimetry missions was investigated with the same IBI data assimilation system (Bonaduce et al., 2018). This assessment was carried out as part of an ESA study on the potential role of wide-swath altimetry for the long-term (post 2030) evolution of the Copernicus satellite component. In that study, noise-level requirements were less stringent than for the SWOT mission (by a factor of two to four compared to Karin/SWOT instrument). Considering a constellation of three nadir and two wide-swath altimeters, the ocean analysis error was reduced up to 50%, with respect to conventional altimeters (Figure 5). The accuracy of the analysis also is more stable in time with the reduced revisit time provided by two large swath altimeters, compared to only one.
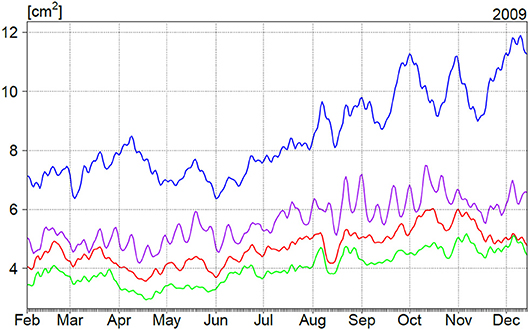
Figure 5. Impact of a constellation of two wide-swath altimetry missions in a Northeast regional data assimilation system, for different constellation configurations and different instrumental error budgets (with reference to the SWOT Karin instrument) (Bonaduce et al., 2018). In that study, noise level requirements were less stringent as for Karin instrument. OSSE1 = 3 altimeters (SAR mode) (blue), OSSE2 = OSSE1 + Wide Swath (4 times Karin error) (violet), OSSE3 = OSSE1 + 2 Wide Swath (4 times Karin error) (red), OSSE4 = OSSE1 + 2 Wide Swath (2 times Karin error) (green). Units are in cm2. Results are given from February to December 2009.
Argo and Its Extensions
The global Argo array has successfully provided large-scale ocean temperature and salinity estimates in the upper-2,000 dbar for more than 15 years, complementing satellite observations in the global ocean observing system (Riser et al., 2016). It is clearly identified as a central piece of operational oceanography (e.g., Le Traon, 2013). Several impact studies have been conducted within the Euro-Argo Improvements for the Copernicus Marine Service (E-AIMS) project to evaluate and quantify how the existing Argo array constrains ocean analysis and forecasting systems. These studies showed that the existing Argo network has strong impacts on upper-ocean representation (Turpin et al., 2016). Argo also has a strong impact at the regional scale for both the Mediterranean and Black Seas (e.g., Grayek et al., 2015; Sánchez-Román et al., 2017).
The future evolution of Argo is mainly through the extension and improvement in the regional and polar seas, into the deep ocean, in the western boundary currents and through adding biogeochemical measurements (Roemmich et al., in review). As part of the European Union's Horizon 2020 (H2020) AtlantOS project (https://www.atlantos-h2020.eu/), four European forecasting centers have coordinated efforts to perform multi-system OSSE experiments for Argo and its extensions (Gasparin et al., 2019). It has been shown that doubling the number of Argo floats in the western boundary currents and along the equator would generally improve both temperature and salinity representation. Implementation of a deep Argo array (1 float every 5 × 5 square, monthly) that samples to 4,000 dbar, or to bottom, would remove temperature and salinity biases in the deep ocean basins (Figure 6). Further investigations have demonstrated that such a deep array would (i) improve the representation of the deep circulation (e.g., western boundary currents), and (ii) provide robust estimates of deep ocean climatic signals (Gasparin, personal communication), which are of critical interest for CMEMS reanalyses. In addition to these experiments for physical parameters, numerical experiments have shown that assimilating BGC-Argo data complements surface ocean color data by improving model estimates of oxygen, nutrients, carbon and chlorophyll throughout the water column (Wood et al., 2018).
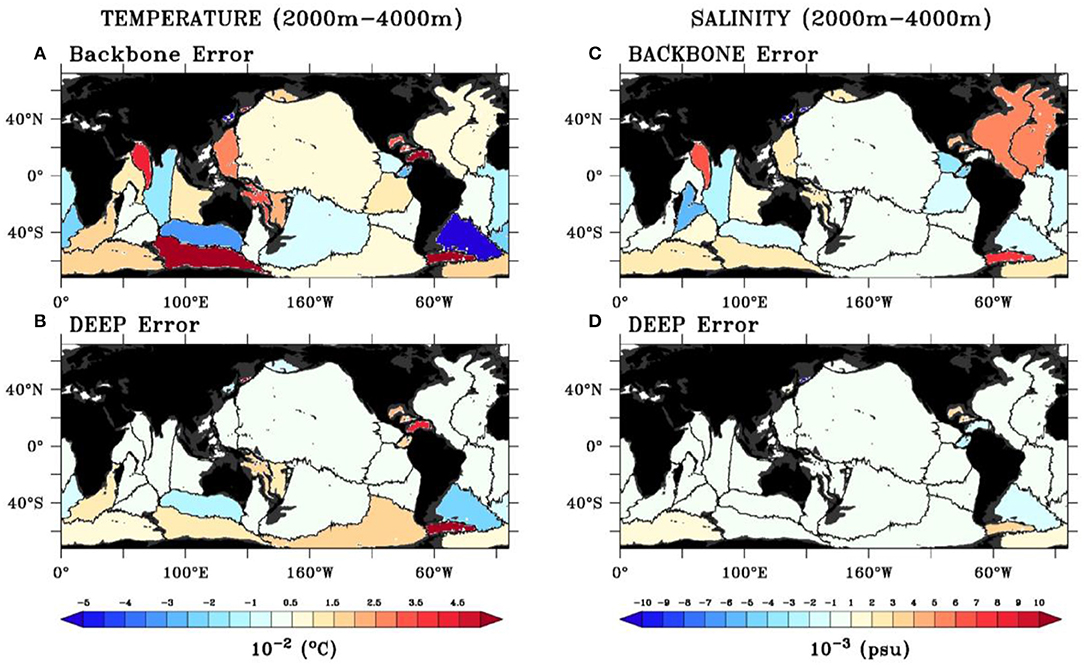
Figure 6. Basin-averaged error in the layer 2000–4000 m, for (A,B) temperature and (C,D) salinity from the Backbone (assimilation of altimetry, core-Argo, XBT, moorings) and the Deep (Backbone+deep-Argo) experiments.
The impact of assimilating BGC Argo data jointly with satellite chlorophyll observations in the Mediterranean Sea has been analyzed as part of the CMEMS Service Evolution MASSIMILI project (Cossarini et al., 2019). Results show that, when a dataset is assimilated, the model performance computed on the same dataset improves on the order of 50–70%. However, the joint assimilation experiments are not always providing the overall best results because of some inconsistencies between the observation datasets. Chlorophyll vertical dynamics are significantly improved only when the BGC-Argo data are assimilated. Satellite assimilation can generate negative impacts, highlighting a potential limit to propagating surface information into vertical dimension through statistical operators.
Sea-Surface Salinity
Several satellite missions (SMOS, SMAP and Aquarius) were launched in recent years to observe global Sea-Surface Salinity (SSS) from space. CMEMS ocean forecasting systems rely on sub-surface salinity observations, mainly from Argo floats, to constrain the SSS. Model and in situ SSS data comparison shows model uncertainties to be <0.1/0.2 pss in most of the ocean regions, with larger errors found in ocean regions controlled by large river runoffs (e.g., Amazon plume, Gulf of Mexico) and in the tropical oceans (e.g., Lellouche et al., 2018). SSS observations from space, even if still suffering from large-scale biases, provide valuable information (e.g., Reul et al., 2013; Martin et al., 2019). CMEMS already provides SSS maps based on a combination of in situ and SMOS data (Droghei et al., 2018). In the framework of the ESA SMOS Nino 2015 project, the impact of satellite SSS data assimilation was assessed with the Met Office and Mercator Ocean global ocean analysis and forecasting systems (Tranchant et al., 2018; Martin et al., 2019). Results show that satellite SSS data assimilation can constrain model forecasts without introducing incoherent information compared to the other assimilated observations. A bias correction still has to be applied within the assimilation process, even if “debiased” SSS data products are assimilated. Further progress on satellite SSS retrievals is required to enhance the benefit of satellite SSS data assimilation, particularly when close to the coasts and at high latitudes.
Sea-Ice Observations
Numerous OSSEs have been carried out for sea-ice remote sensing, in particular for sea-ice thickness products from CryoSat-2 (Lisæter et al., 2007; Blockley and Peterson, 2018), as well as for thin ice thickness from SMOS (Yang et al., 2014; Xie et al., 2016) and both satellites together (Allard et al., 2018; Mu et al., 2018; Xie et al., 2018). Assimilation of combined CryoSat-2 and SMOS sea-ice thickness products in the Arctic MFC has a very positive impact by reducing sea-ice thickness errors by 12 to 24% (Xie et al., 2018). Improvements in sea-ice concentrations data have also been assessed by OSSEs (Posey et al., 2015). Weighting the value from different observation types has been done by adjoint modeling (Kaminski et al., 2018). The assimilation of sea-ice drift has been less successful, so far, partly because of the short model memory of sea-ice drift and partly because of sea-ice models deficiencies (Stark et al., 2008; Sakov et al., 2012). More details are given in the Swart et al. (in review) paper on Polar Ocean Observations.
Surface Carbon Observations
OSSEs have also been conducted in the framework of the AtlantOS project for surface ocean carbon products (pCO2) using CMEMS multi-observation platform for ocean carbon and a statistical model (Denvil-Sommer et al., 2018). The aim of the work was to identify an optimal observational network for pCO2 for the Atlantic Ocean using simulated observations and output from the NEMO-PISCES model. Tests highlighted the need for data in the South Atlantic Ocean, the Surface Ocean CO2 Atlas (SOCAT) having sparse coverage in the Southern Hemisphere.
The main results (Sommer et al., 2018) show that the combination of (1) the SOCAT data base (integrating data from multiple platforms) with (2) a network of BGC Argo floats at around one quarter of current physical Argo resolution, and (3) existing moorings provides an optimal solution, which probably could be implemented with the least cost.
The network could be further improved by instrumenting Baffin Bay, the Labrador Sea, and the Norwegian Sea, as well as regions along the coast of Africa (10°N to 20°S) with moorings or additional BGC-Argo floats.
Waves
Satellite wave observations are used to improve the wave products provided by CMEMS MFCs, ultimately yielding better surface fluxes needed for coupling with ocean circulation models. Currently, significant wave heights (SWH) from five altimeters (Jason-2 and 3, Saral/Altika, Cryosat-2 and Sentinel-3A) are routinely assimilated every 3 h in the global CMEMS MFC wave system, leading to very accurate integrated wave parameters. For example, the normalized scatter index (given by the ratio between the standard deviation of the difference between modeled and observed parameter and the mean of the observed parameter) of SWH is below 9% in high and intermediate latitudes and is even > 8% for tropical regions (Aouf et al., 2018a).
The assimilation of satellite wave data in wave models is the most efficient way to correct the uncertainties related to the wind forcing, in particular for storm cases. The case of Campbell Island, south of New Zealand is highlighted. Significant wave heights of more than 12 m were observed there by altimeters from 7 to 10 May 2018 (Figure 7A). At 12:00 (UTC) during the storm on 8 May 2018, the Metocean Solutions buoy at Campbell Island recorded the peak of SWH of 14 m, which clearly agrees with the analysis provided by the global CMEMS-MFC (Figure 7B).
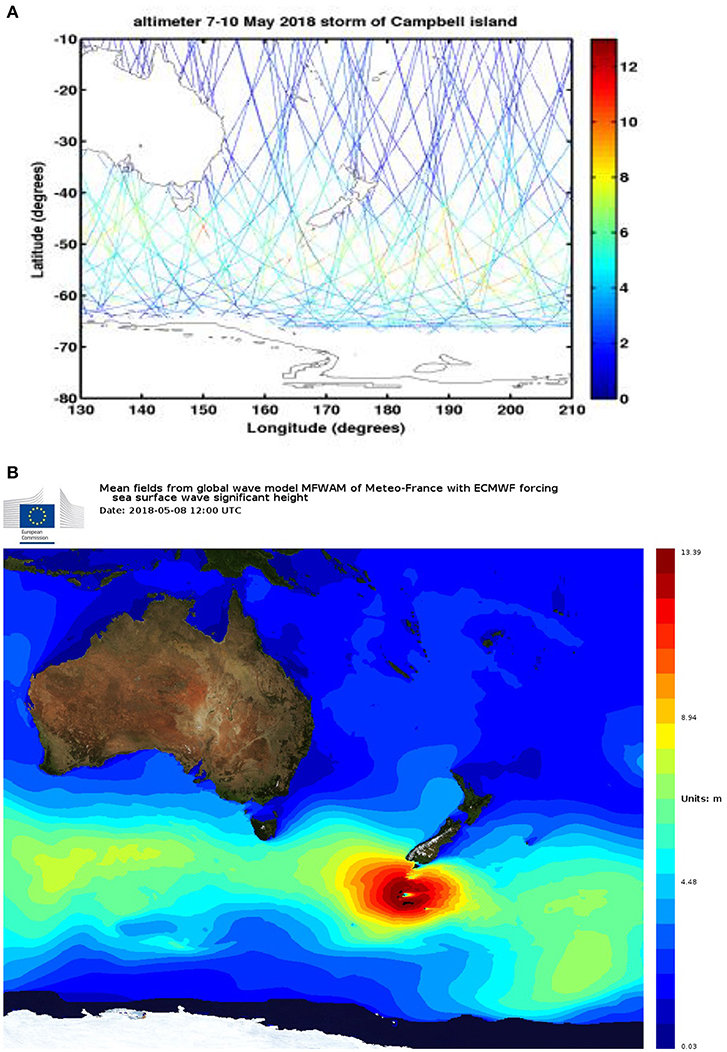
Figure 7. (A) Significant wave heights on ground tracks from 5 altimeters during the storm at Campbell Island (south of New Zeland) from 7 to 10 May 2018. (B) Significant wave heights from the global CMEMS-MFC wave system on 8 May 2018 at 12:00 UTC. High waves induced by a severe storm, with SWH of 13.8 meters at Campbell Island south of New Zealand.
At the regional level, the impact of assimilating satellite observations on the Med-Wave system has been evaluated considering the Med-Waves-V4 system, assimilating along-track significant wave height observations from Jason-2 and Saral satellites at 3-hourly intervals, vs. the Med-Waves-V3.2 system without data assimilation (Ravdas et al., 2018). Data assimilation improves results along satellite tracks, as well as at the great majority of the wave buoy locations.
Satellite wave data concern not only altimeter significant wave heights, but also directional wave spectra provided by Synthetic Aperture Radar (SAR). Because of the SAR's inability to image short and steep waves (with a wavelength less than about 200 m) in the azimuth direction due to their incoherent nature, SAR wave measurements are often referred to as swell measurements (hereinafter referred to as “swell spectra”). SAR swell spectra are currently provided by two Copernicus satellites, Sentinel-1A and 1B. The combined assimilation of SAR swell spectra and altimeters wave heights corrects both the wind-sea and the swell, which is independent of the wind and can propagate freely over long distances for many days. The most striking example of the impact of assimilating SAR directional swell spectra is the correction of swells generated by storms in high latitudes of the southern Pacific Ocean, which propagate to French Polynesia, the United States' west coast and western Central and South America. The assimilation of SAR swell spectra from Sentinel-1 improves the peak period of long waves longer than 12 s by roughly 16% (Aouf et al., 2018b). As swell is free of wind dependency, the assimilation of SAR swell spectra is persistent, staying effective for up to 3 days in the forecast period.
The French-Chinese satellite CFOSAT, with its innovative wave scatterometer called SWIM (Surface Waves Investigation and Monitoring), was launched in October 2018 (Hauser et al., 2017). It will measure significant wave height at nadir and retrieve directional wave spectra from combined incidence angles (ranging from 2° to 10°) every 70 km. The SWIM wave spectra will improve the wavelength azimuthal cut-off to 70 m from 200 m for SAR wave spectra retrieved from Sentinel-1. This means that more mixed-seas wave systems will be included in the assimilation process. The global CMEMS-MFC is ready to use such directional wave observations, with complementary impact between CFOSAT and Sentinel-1. OSSEs have demonstrated a significant positive impact on the integrated wave parameters (Aouf et al., 2018b).
Synthesis
The use of OSEs and OSSEs, along with regular assessment of the impact of observations on data assimilation systems, is central to the CMEMS strategy. Results depend on the data assimilation systems themselves. To derive robust results, the use of multiple systems is preferable, when feasible. Regardless, OSEs and OSSEs provide relevant information on how observations constrain ocean analyses and forecasts that feed downstream applications and users.
It is important to note that most of the OSEs/OSSEs studies described above are based on integrated global and regional ocean observing systems. They take into account the role of modeling and data assimilation (i.e., a model forecast provides better a priori information compared to climatology). The impact of a given observing system is not analyzed independently of the other components (e.g., the impact of Argo takes into account the synergy with satellite altimetry), providing a much better and more realistic measure of the impact of a given observing system.
Satellite Observations Used by the Copernicus Marine Service: Status and Requirements
Initial Requirements and Status
Satellite requirements for the Copernicus Marine Service have been detailed in the GMES Marine Core Service (MCS) implementation group report (Ryder, 2007; Le Traon, 2018). They are briefly summarized below:
• In addition to meteorological satellites (polar-orbiting, geostationary), a high-precision infrared SST satellite mission is needed to give the highest absolute SST accuracy. A microwave mission is also needed to provide an all-weather global observation of SST.
• At least four altimeters are required in order to observe the mesoscale currents. This is also useful for significant wave height measurements. A long-term series of a high-accuracy altimeter system (Jason satellites) is needed to serve as a reference for the other altimeter missions and for the monitoring of climate signals.
• Ocean color is increasingly important, in particular, in coastal areas. At least two concurrent low-Earth-orbit satellites are required for global coverage.
• Several wind scatterometers are required to globally monitor the near-surface wind field at high temporal and spatial resolution. Scatterometers, in combination with passive microwave radiometry, are also highly important for sea-ice monitoring.
• At least two SAR satellites are required for waves, sea-ice characteristics and oil-spill monitoring.
Thanks, in particular, to the development of the Copernicus satellite component, these initial requirements are now met, in particular, with Jason-3 (and later Sentinel 6) for the reference altimeter mission and the Sentinel 1 (SAR) and Sentinel 3 (sea-surface temperature, ocean color and altimetry) two-satellite constellations. Other complementary missions provide needed data, in particular, through other European or non-European satellites and instruments (e.g., MSG, METOP, DMSP/SSM/I, GCOM/AMSR-2, AltiKa, RadarSat, Suomi-NPP, NOAA-20, HY2A/B, CFOSAT).
Future Requirements
CMEMS has defined its main requirements for evolving the Copernicus satellite component (CMEMS, 2017). Based on user requirements and CMEMS's evolution over the next decade (see section Service Evolution), the main CMEMS recommendations/priorities for evolving the Copernicus Satellite Component (evolution and new generation of Sentinels) are as follows:
• Ensure continuity of the present capability of the Sentinel missions S1, S3, S6 for CMEMS and S2 for downstream coastal applications.
• Develop new capabilities for wide swath-altimetry. This is essential to constrain future CMEMS high-resolution ocean models and downstream coastal models.
• Fly a geostationary ocean color mission to strongly improve the time resolution of ocean color observations for European seas.
• Fly a European microwave mission [the Copernicus Imaging Microwave Radiometer mission (CIMR)] for high-spatial-resolution sea-surface temperature, sea-ice concentration, sea-ice drift, sea-ice thickness and sea-surface salinity.
• Ensure continuity (with improvements) of the Cryosat-2 mission (Copernicus Polar Ice and Snow Topography Mission) for sea-ice thickness monitoring and sea-level monitoring in polar regions.
• R&D actions should be developed, in parallel, to advance our capabilities to observe sea-surface salinities and ocean currents from space.
There are also a series of specific short-term requirements for altimeter measurements over the coming years. Given the potential impact of SAR altimetry, continuous effort is required to improve SAR processing for Sentinel-3 A/B (and future C/D) and refine the resolution of the associated products from 7 to 1 km. Continuity of Cryosat-2 altimeter high-latitudes observations of the ocean and sea-ice observations is required. Sea level in the leads would strongly improve the coverage of these regions and would maximize the use of Cryosat-2 data in CMEMS. It will also be important to include data from recently launched opportunity missions (e.g., CFOSAT and HY2B) to ensure the robustness of the CMEMS multi-mission altimeter system. Same holds for wave and wind measurements from these missions. Developing Near-Real-Time (NRT) processing of SWOT is essential for demonstrating its impact on operational applications. Finally, improving MDTs (based on the GRACE and GOCE satellite missions and in situ observations) is of utmost importance, given the impact in data assimilation systems (Le Traon et al., 2017b; Hamon et al., in press).
As far as ocean color data is concerned, with the presence of two-concurrent low Earth orbit operational satellites, the Copernicus Sentinel 3 A/B Ocean and Land Color Instrument (OLCI) sensor will have a dramatic impact on Ocean Color products and their quality. Monitoring rapidly evolving BGC phenomena (e.g., river outflows, phytoplankton and harmful algae blooms, sub-mesoscale features) and the coastal zone are a strong user requirement, implying an additional requirement for ocean color geostationary satellite, which would provide unique capabilities for such monitoring.
The exploitation of the high-resolution (<60 m) multispectral sensor capabilities on board the Sentinel-2 A/B constellation is also of great interest to CMEMS. Sentinel-2 data, with a resolution between 10 and 60 m and a revisit time of 5 days at the equator, complements the lower-spatial-resolution (300 m) daily global coverage offered by the Sentinel-3 constellation; these data are highly relevant to developing new high-resolution coastal ocean color products, improving sea-ice detection and, potentially, deriving bathymetry near the coast.
CMEMS delivers near-real-time and reprocessed satellite-based information products of the sea-ice cover for the polar and global oceans. The products (e.g., the Tactical Navigation Ice Charts) are directly accessed by end users and ingested by the MFCs to constrain (and/or validate) their forecasts and re-analyses. Sea-ice concentrations are assimilated at Arctic and Global MFCs, both in real- and delayed-time mode. Ice thicknesses from Cryosat2 and SMOS are now assimilated at the Arctic MFC; the global MFC plans to assimilate such products in the near future. Sea-ice drift data are currently assimilated in the CMEMS Arctic system, but, so far, this has limited impact with respect to the assimilation of sea-ice concentration and thicknesses. Specific CMEMS requirements for polar and snow monitoring were outlined in CMEMS (2016). Sea-ice concentration from passive microwave radiometry is, by far, the better-controlled sea-ice quantity entering the operational systems. CMEMS (2016) stated the importance of ensuring continuity and improving the quality of sea-ice concentration products, both for climate monitoring and near-real-time applications. Concerning prospects for a Copernicus Space Component Expansion phase, CMEMS's prioritization of the polar regions agrees with the EU Polar Expert Group (Duchossois et al., 2018) in recommending retaining the Copernicus Imaging Microwave Radiometer (CIMR) mission as first priority.
In situ Observations Used by the Copernicus Marine Service: Status and Gaps
Initial Requirements
The main global and regional (European seas) in situ observing systems required for the Copernicus Marine Service have been listed in the GMES MCS implementation plan (Ryder, 2007). They include:
• Argo floats for measuring temperature and salinity profiles to ~2,000 m and, by tracking them, mean subsurface currents.
• Research vessels, which deliver complete suites of multidisciplinary parameters from the surface to the ocean floor.
• XBTs launched underway by research vessels and ships of opportunity for measuring temperature and salinity profiles to ~450–750 m depth.
• Moorings capable of continuously measuring, over long periods of time at fixed locations, subsurface temperature and salinity profiles, currents, waves, biogeochemical and meteorological parameters.
• Ferry-Box and other regional ship-of-opportunity measurement programmes for surface transects, which may include temperature, salinity, turbidity, chlorophyll, nutrient, oxygen, pH, CO2 fugacity and algal types.
• The network of tide gauges, which provides long-term reference and validation sea-level data.
• Gliders, which complement floats and moorings and are able to perform transects of physical and biogeochemical parameters from the surface to 1,000 m.
• Surface drifters, which passively follow the horizontal near-surface flow via a drogue/sail. They complement satellites for sea-surface temperature measurements.
• Long-range (up to 200 km) HF-radar monitoring systems in specific regions of interest and importance.
• Sea mammals, fitted with non-invasive miniaturized ocean sensors that can help collect measurements in remote places, such as polar areas.
Status—In situ Observations From the CMEMS in situ TAC
The CMEMS in situ Thematic Assembly Center (INS-TAC) is the main interface between CMEMS and the global, regional and coastal in situ observing networks. Its role is to collect, process and quality control the upstream in situ data required to both constrain and directly validate modeling and data assimilation systems and to directly serve downstream applications and services.
The main types of in situ observing systems aggregated by INS-TAC include all the platforms identified in Ryder (2007) and many others. These systems were made available over the years, when their quality was deemed appropriate to meet service requirements.
The INS-TAC provides vertical profiles and time-series data coming from different types of instruments (e.g., floats, drifters, moorings, gliders, tide gauges, vessels, HF radars) and for different parameters (temperature, salinity, currents, sea level, wave, chlorophyll, oxygen, nutrients, pH, fugacity of CO2). The INS-TAC delivers aggregated data sets spanning near-real-time products that are delivered within 24 h, having completed automatic quality processing from acquisition, to scientifically assessed reprocessed (REP) products. The first type of product is used by the MFCs to generate and validate their forecasts, while the second type is used for reanalysis purposes.
The INS-TAC does not operate any in situ observing systems, rather interacting with the platform operators to collect and aggregate the best-possible version of their data. At the global scale, INS-TAC collaborates with the JCOMM networks (Argo, DBCP, OceanSites, GOSUD, OceanGliders, GO-SHIP, GLOSS), and the main international [e.g., the US National Center for Environmental Information (NCEI) World Ocean Database (WOD), the US National Data Buoy Center, the Australian Integrated Marine Observing System (IMOS) and European [SeaDataNet, International Council for the Exploration of the Sea (ICES), EMODnet] aggregators. At the European scale, the INS-TAC mainly collaborates with the EuroGOOS Regional Operational Oceanographic Systems (ROOS) and their task teams, which operate and coordinate most of the regional monitoring systems. Several EuroGOOS task teams have been established in recent years, in particular, for coordinating different observing platforms in Europe [FerryBox, Tide gauges, Gliders, HF radars, Argo floats (Euro-Argo), Fixed platforms (EMSO) and Animal-borne instruments]. One of their objectives is to link data management standards within CMEMS INS-TAC with those of existing global networks. In some cases, these task teams, such as the HF Radar EuroGOOS Task Team, have enabled the integration and enhancement of a completely new technology network.
At the global scale, the most important source of profile data for INS-TAC is the Argo network (about 4,000 platforms cycling every 10 days) and its extensions to the deep ocean and biogeochemical parameters. It is complemented by XBT lines (about 50 lines, half of which were active in 2018), sea mammals in high latitudes and, in delayed mode, the GO-SHIP hydrographic sections (60 lines in 2018) and other research cruises observations from US-NCEI and CCHDO (CLIVAR and Carbon Hydrographic Data Office). In European seas, glider data, especially in the Mediterranean and the North West shelves, as well as Conductivity, Temperature, Depth (CTD) monitoring for the Nordic and Baltic Seas can be found in the INS-TAC database. Global ocean research cruise data from SeaDataNet complement delayed mode coverage.
For time-series data, the most important source of observations is the DBCP network, which operates more than 1,400 drifters and 20 Arctic buoys. It is complemented by the GOSUD and Voluntary Observing Ships (VOS) network that provide both SST and SSS observations, as well as surface carbon data. The Argo network also provides time-series of temperature and salinity at the surface and at drifting depth, along with derived velocity information. In European seas, FerryBox lines (mainly the Baltic and North West shelves), tide gauges all along the European coasts, and coastal monitoring stations operated by EuroGOOS ROOS members also are integrated in the database. Finally, as for profile data and for reprocessed products, time-series data sets are complemented with historical research data from the US-NCEI-WOD database, from SeaDataNet NODCs, and for biogeochemical data, from EMODnet-Chemistry and ICOS (Integrated Carbon Observation System) Ocean Thematic Center.
Thanks to the Argo program, global coverage for the Essential Ocean Variables (EOVs) temperature and salinity is fine, but significant gaps appear for the abyssal ocean, seasonally ice-covered seas, fine scales and in coastal and shelf seas. Similarly, the coverage is much better for physical than for biogeochemical variables.
Figure 8 shows the in situ data available from the INS-TAC over a three-month period (January to March 2018). The number of in situ data available per EOV (temperature, salinity, current, waves, sea level, oxygen, chlorophyll, nitrate, pCO2, turbidity, pH) in near-real time for a given month (June 2018) is shown in Figure 9 for both the global ocean and European seas. Similar coverage for global and regional seas is observed, but physical parameters (temperature, salinity, currents, waves, and sea level) have better coverage in European seas. The gaps for biogeochemical EOVs at global and regional scales are clearly highlighted. Even though the coverage is improving, thanks to the development of autonomous platforms, such as BGC-Argo, FerryBoxes or gliders, it is still far less than CMEMS needs.
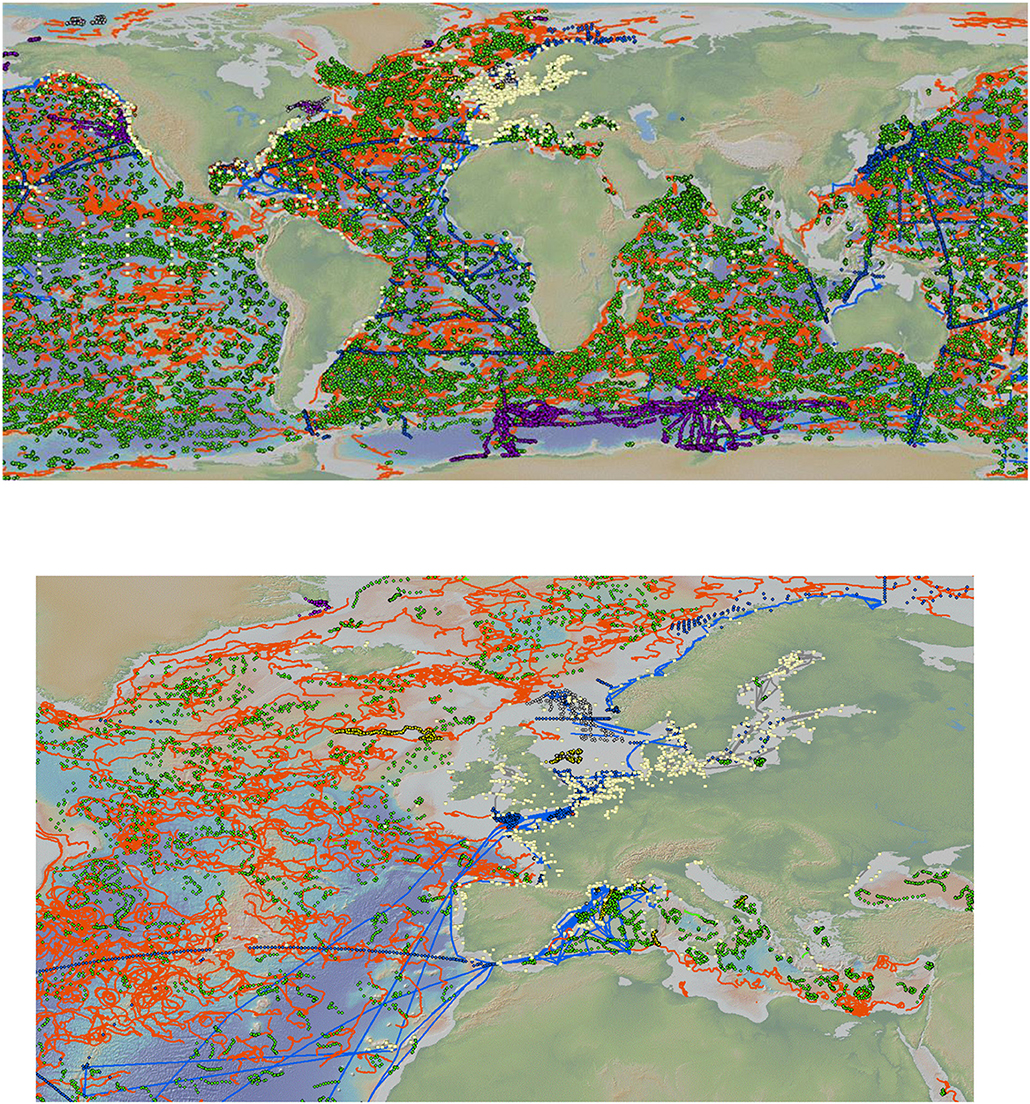
Figure 8. Data at INS-TAC for Spring (January-March) 2018. Argo (green), vessels (XBT and CTD, thermosalinograps (blue), sea mammals (purple), gliders (yellow), moorings, tide gauges and rivers (white) (global and zoom on European seas).
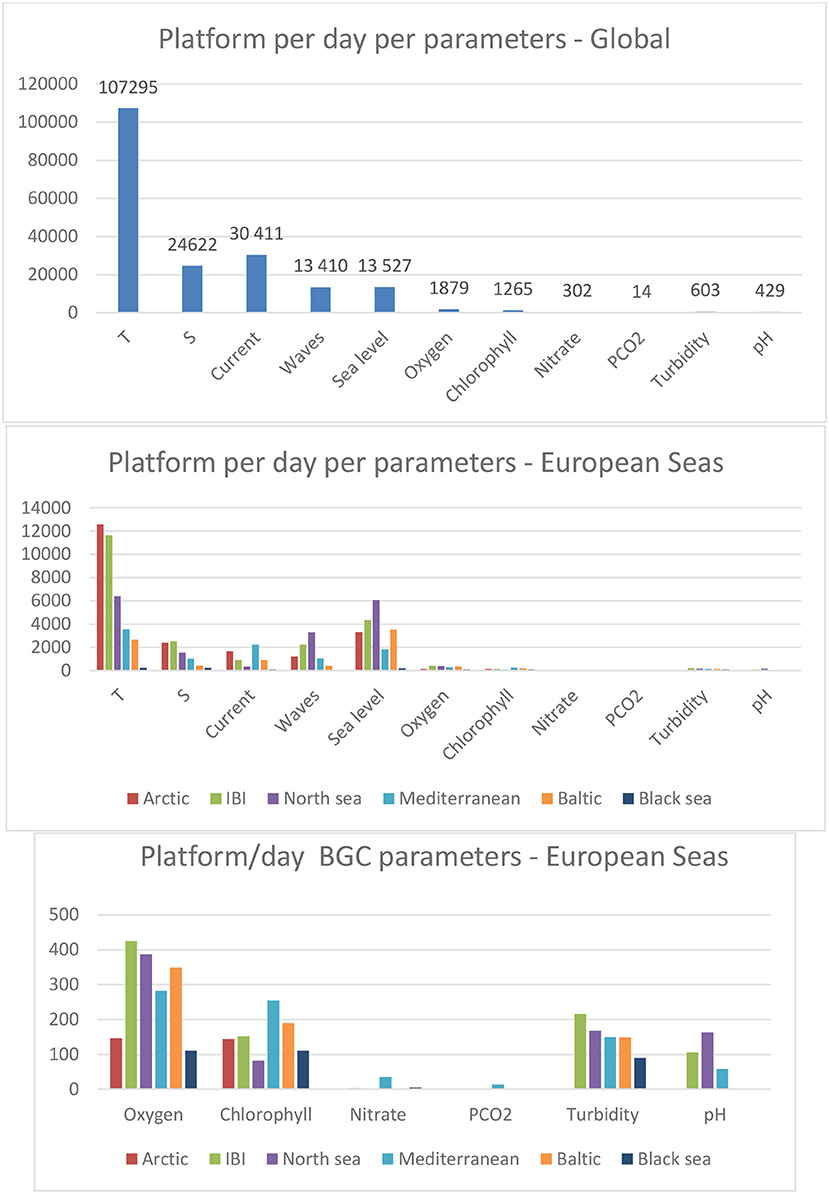
Figure 9. Number of platforms providing observations per day (June 2018) by parameter (temperature, salinity, current, waves, sea level, oxygen, chlorophyll, nitrate, pCO2, turbidity, pH): (Top) global scale, (Middle) European seas (20N - 90N, 30W - 40E), and (Bottom) zoom on biogeochemical (BGC) data for the European seas.
Use by MFCs and TACs and Future Requirements
Global
The CMEMS global ocean analysis and physical forecasting system assimilates in situ temperature and salinity profiles and time series from Argo floats, XBTs, CTDs, moorings, gliders and sea mammal measurements (e.g., Lellouche et al., 2013). At the global scale the assimilation of Argo observations provides an efficient constraint on large-scale ocean temperature and salinity in the upper-2,000 m. Other platforms target processes having different spatial and temporal scales and constrain the analyses at regional/local scales. However, some regions remain under-sampled, such as the Southern Ocean, the Arctic Ocean or the deep ocean, which limits the ability of the system to represent the global ocean state.
Some available observations are not (yet) assimilated in the global systems [e.g., surface drifters, ThermoSalinoGraphs (TSG) and FerryBoxes]. Non-assimilated observations are, however, essential for independent qualification/validation of analyses and forecasts and for evaluating model and system improvements. In particular, model velocities are systematically validated with observations from surface drifters, Argo, HF radars and moorings, while tide gauges allow validating sea-level variability in coastal regions.
The BGC, sea-ice and wave analysis and forecasting systems are currently constrained by satellite observations only and do not yet assimilate in situ observations. BGC in situ observations are used for model development and analysis validation. BGC Argo floats increasingly provide observations of oxygen, chlorophyll, pH and nitrate. The GLODAP data base includes in situ data for oxygen, nutrients, dissolved inorganic carbon and alkalinity from other platforms than the Argo floats. Similarly, in situ sea-ice observations, more specifically the thickness of the different ice and snow categories from the unified sea-ice Climate Data Record (CDR) data base in the Arctic, are used to validate the ice model. Significant wave height and period (peak and mean) from buoys are essential for validating global wave products.
In the future, the following variables should be observed with better global coverage:
• BGC measurements: oxygen, nitrate, pH, CO2 fugacity, alkalinity, Chl-a.
• Deep temperature and salinity measurements (below 2,000 m).
• In situ velocity observations.
• In situ sea-ice observations, including thickness, temperature and snow depth.
• Open-ocean wave measurements.
The main need is to collect measurements for under-sampled variables (e.g., velocity, BGC) and under-sampled regions (e.g., polar and deep oceans). The development of the global in situ Argo BGC array constitutes a strong priority for CMEMS, because the lack of in situ BGC data limits our ability to monitor and forecast the state of the “green” ocean.
Arctic
Key variables to characterize the water masses and their variability within the Arctic are temperature, and salinity, together with ice properties (thickness, drift). Today these variables are measured by ice-tethered profilers (ITP), acoustic tomography, Argo floats, sea mammals, moorings, drifters, and, when possible, by research cruises CTD. At the moment, the number of such platforms is very limited and insufficient to monitor the entire region. In the coming decades, the Barents Sea may become ice-free all year round and would need conventional ocean monitoring technology, but other shelf seas are likely to keep a seasonal ice cover. There are severe limitations with measurements within the seasonal ice zone, which is growing broader, and none of the platforms available today can collect data there.
During the International Polar Year (IPY) (2007–2009) several Ice-Tethered Profilers (ITPs) were deployed, registering temperature and salinity profiles. These proved able to cut, by half, errors in water mass properties in the ARC MFC reanalysis (Xie et al., 2017), especially in the Atlantic water layers. Since the IPY, the number of ITPs has severely dropped, so augmenting the number of ITP, up to the level of the IPY (5 to 10 ITPs) or higher, would enable higher forecast quality in the Arctic. The perennial ice coverage available for ice-tethered equipment, however, has also further diminished in the meantime, limiting the zone where ITPs can operate for a long time. Marine mammals make a more agile sampling of the seasonal ice zone but their data need delayed-mode processing and are not assimilated in real-time forecasts. Research cruises are more frequent in the summer, but data are seldom transmitted in real-time. Acoustic tomography can also provide integrated temperature observations of high accuracy, but their use in data assimilation is still underdeveloped.
BGC data in Arctic waters, nutrients in particular, are necessary for predicting primary production, but not all observations are publicly available or harmonized for processing long time series. Autonomous platforms, like BGC-Argo should, therefore, be prioritized.
Operational wave buoys data are not publicly available, except in Iceland; although historical data exist in the offshore industry. As a rule of thumb, the safety of shipping and fishing activities will require a dozen of those, evenly spaced along the Northern Sea route. With reduced ice cover, observations of waves by accelerometers in sea-ice are also expected to become increasingly important.
With respect to sea-ice, a high priority should be given to in situ ice thickness, snow depth and ice temperature, as they are expected to improve satellite retrievals of ice thickness. To this end, more ice mass balance (IMB) buoys (autonomous instruments equipped with acoustic sounders and temperature/pressure sensors that are specifically designed to monitor variation of the sea-ice layer and its snow cover) are needed. With summers getting warmer, observations of melt ponds also are becoming all the more important. The first priority parameters would be melt pond area fraction and albedo, which can be used to validate satellite data and models. Other important melt pond variables will only be available on small scales and should, therefore, be used for model process parameterization (e.g., melt pond topography, multi-spectral albedo, ice thickness below melt pond).
North West European Shelf
The North West Shelf (NWS) MFC routinely downloads and quality controls satellite data, as well as in situ temperature and salinity profiles from Argo floats (only available in the off-shelf areas), drifters, gliders, moored buoys, marine mammals, and research ship observations for data assimilation. For verification and validation purposes, drifter-derived currents, HF Radar and tide gauges are used. There is a need to increase the in situ data coverage, especially on the shelf. Currently, the low spatial and temporal sampling of the sub-surface in the North, Irish and Celtic Seas, coupled with a lack of current and air-sea flux observations, hinders progress in identifying and reducing model biases. The number of BGC observations is unsatisfactory and, it should be noted, the BGC Argo observations, so useful elsewhere, will not be available on the shelf. Complementary techniques, such as increased use of gliders and FerryBoxes (to include biogeochemistry) would be welcomed. Data availability in real-time, for all types of observations, plays a key role for data assimilation, verification and monitoring; therefore, timeliness is a clear requirement for a forecasting system.
Iberian-Biscay-Ireland
The Iberian-Biscay-Ireland (IBI) MFC assimilates temperature and salinity vertical profile data from Argo floats. Product quality metrics are computed using data from multiple platforms, such as moored buoys, Argo and BGC-Argo floats, drifters, gliders, XBTs, CTDs, HF Radar. The coverage of in situ data in shelf/coastal areas is still too scarce. In the future, it will be important to increase the number of near-real-time in situ observations in shelf and in coastal areas of the IBI region. HF Radars are useful for monitoring high-frequency surface circulation dynamics. To better monitor the three-dimensional circulation on the shelf, more acoustic Doppler current profiler (ADCP) observations (if possible, available in NRT) are needed. In situ BGC data coverage in the IBI area certainly must be enhanced. The current lack of these in situ data is a major shortcoming that prevents the estimation of meaningful biogeochemical monitoring indicators in the area.
Mediterranean Sea
There is a recognized concern about the status of the Mediterranean observing system and its future. There are important gaps due to the lack of instruments and poor data policy, in particular for central-eastern Mediterranean Sea and the northern African coast, leading to a strong North-South West/East imbalance.
When looking more specifically at platform types, at MED-MFC Argo floats, CTD and XBT platforms are assimilated into the system and also used for quality assessment, while moorings are used only to assess the quality of the system through independent validation. The existing coverage of the Argo network is about 60 active floats in the Mediterranean Sea, which is twice the standard Argo density. This should be, at least, maintained as recommended by the Euro-Argo ERIC (European Research Infrastructure Consortium) (Bittig et al., 2017). Full-profile vertical resolution is required for CMEMS operational analyses. There is also a need for an increased number of Argo floats in highly dynamical areas and for the deep region. This goes along with the need to reintroduce XBT measurements and to increase the number of in situ velocity observations (e.g. ADCP, moorings, HF Radars, drifters).
Wave buoy observations of significant wave height and mean wave period are used to calibrate and validate the Med-waves modeling system. Maintaining and increasing the number of wave buoys and including wave measurements from HF Radars are required, in particular in the central and eastern Mediterranean and along the African coasts.
A clear need exists for increased coverage in the eastern and southern Mediterranean in terms of the number of BGC-Argo floats and number of moorings equipped with BGC sensors.
Black Sea
The Black Sea MFC (BS-MFC) physical modeling system assimilates temperature and salinity profiles from Argo floats, moorings, XBT, and bathythermographs (MBT). There is a clear lack of data to be regularly used for improving forecasts products. In particular, to better represent coastal dynamics, regularly updated and continuous-in-time coastal profilers and moorings are requested. The in situ observing system should evolve, accounting for the importance of having coastal observatories, in particular wave buoys, ADCP and HF radars to feed the next generation of BS physical and wave modeling. Ad hoc and continuous monitoring is required in the shelf area, especially in the northern part of the Black Sea and in the Danube Delta. The Black Sea wave model suffers from a lack of in situ wave measurements.
For near-real-time validation, the BS-MFC biogeochemical model (Grégoire et al., 2008) essentially relies on BGC Argo floats that provide oxygen, fluorescence, the photosynthetically active radiation and backscattering coefficients. The system, however, suffers from the lack of regional data to regularly be used for improving the validation exercise and for assimilation. In particular, as an anoxic basin, the dynamic of the carbonate system (pH, dissolved inorganic carbon and alkalinity) and the conversion of in situ fluorescence into chlorophyll (e.g., from BGC-Argo floats) require particular algorithms supported by adequate monitoring efforts. The lack of carbon system observations currently prevents a sound assessment of acidification in the Black Sea and its modeling. Moreover, being a turbid area, with anomalously high colored dissolved organic matter, Black Sea shelf waters require extensive observations for assessing its inherent optical properties in support of developing high-quality ocean color products. So far, the biogeochemical variable that has the best spatial and temporal coverage is oxygen, because it is provided by BGC Argo floats (Stanev et al., 2013, 2018). On the shelf, where there is evidence of seasonal hypoxia, the monitoring of oxygen is crucial. BGC Argo floats cannot go there. Cruises, moorings and gliders offer alternative solutions.
Baltic Sea
For the Baltic Sea, CMEMS's in situ ocean observations include FerryBox lines, moorings, Research Vessels (R/Vs), tide gauges and Argo floats. In recent years, HF radars have been tested in the transition waters and gliders have been tested in the central Baltic Sea. Although the deployed platforms are providing data with sufficient spatial and temporal resolution, coverage should be improved: the Baltic Sea includes 17 sub-basins, with significant spatial variability in physical and biogeochemical characteristics, thus requiring in situ observations in all sub-basins to ensure spatial representativeness in the validation of regional products.
In general, more moorings for temperature and salinity are needed in the Danish straits and more stations for BGC measurements should be deployed over the central and northern Baltic areas (more than half of the sub-basins have insufficient data for assessing eutrophication). An optimal sampling design is needed for integrating the multi-platforms, especially through enhancing the role of shallow-water Argo floats. Finally, data management also should be improved. The Baltic Operational Oceanographic System (BOOS) partners are also members of the HELCOM monitoring program for environment assessment, which is carried out mainly through ship monitoring. The observations, having low sampling frequency and full spatial coverage, include most of the EOVs and Essential Biodiversity Variables (EBVs); however, most of the ship data cannot be accessed in a timely manner for operational forecasting and ocean state assessment reporting. Currently, only 10% of BOOS partners provide near-real-time ship data.
Specific Requirements for the Validation of Satellite Data Products
The calibration and validation of the upstream (Level-2) satellite data are the responsibility of ESA and EUMETSAT, which are working to develop a dedicated in situ observation system to ensure the acquisition of high-quality in situ measurements, accompanied with their uncertainties, also referenced to as “Fiducial Reference Measurements” (FRM). These measurements can be used by CMEMS TACs and MFCs for their validation activities. It is important that CMEMS requirements are taken into account when designing and developing new platforms for acquiring FRM.
Satellite-based sea-level (and geostrophic velocity) measurements are validated using tide gauge networks, drifting buoys, gliders, HF radar, ADCP and Argo profilers. While, at the global scale, the number of available in situ observations is adequate to routinely conduct validation, at the regional level, particularly for the Mediterranean Sea and Black Sea, available tide gauge datasets are still too limited for a robust validation.
In situ data are used to evaluate and calibrate ocean color remote sensing algorithms and to validate the operational products distributed by CMEMS. These measurements are acquired through a variety of systems and platforms, such as automated in-water and tower-based radiometers, and from profiles acquired during dedicated research cruises. At the moment, these observations are very sparse and limited. There is a clear need for improving the number of platforms able to perform such measurements. Additionally, the future systems should be designed to allow a NRT data stream and enable operational capabilities that meet CMEMS service needs. Given the potentially large number of match ups with satellite observations, the use of BGC Argo data offers a complementary approach for the routine validation of satellite ocean color products.
Validation of SST products is operationally done using in situ data acquired from surface drifting buoys, Argo floats, in situ ship radiometers and moored buoys, as independent source of comparison. In situ data need to be collected at the highest available frequency and they should contain more metadata to better select and/or filter out data for confidence in the validation. Satellite sensors provide measurements of the skin layer; however almost all CMEMS interpolated products are built to represent the “foundation” temperature (namely the temperature at a depth that is not affected by skin effects and by the diurnal cycle). Nevertheless, significant differences can be found between in situ observations collected at different depths, depending on the local time and atmospheric conditions. In terms of coverage, it is recommended that measurements over the Black Sea, the Baltic Sea and the Arctic region be increased due to the very low number of observations there. An additional important requirement for satellite validation is to have the in situ measurements available in near-real-time, e.g., within 24 h of acquisition.
Validation of sea-ice products derived from satellite measurements is carried out using ship measurements from ice breakers, ice mass balance buoy measurements, drifter Global Positioning System (GPS) buoys, and ITP. At the moment, there is a great lack of in situ data for both the Arctic and Antarctic regions.
For wind and wave measurement validation, it is recommended that the number of moored buoys, the main platform used for validation, be increased to better represent regional geophysical conditions. Most wave buoys are located in the northern hemisphere near U.S. east and west coasts and European coasts. There is a clear need to cover tropical and the southern ocean basins to validate new satellite wave data, such those provided by CFOSAT and Sentinel-1. It would be very useful, in particular, to include wave sensors in the Prediction and Research Moored Array in the Tropical Atlantic (PIRATA) and Tropical Pacific Observing System (TPOS) tropical networks. Such sensors will help, on the one hand, validate the assimilation of SAR wave spectra in CMEMS wave models and, on the other hand, to better describe heat and momentum fluxes for the ocean-atmosphere coupled system.
It is important to note that, to better link Argo observations with satellite observations, bearing in mind sensor technology limitation issues, efforts should be carried out to better sample the top 5 meters of the ocean.
Conclusion
The Copernicus Marine Service has run a successful initial phase over the past 4 years. Operational capabilities have been demonstrated, user uptake and user base have been steadily increasing and service evolution activities allow regular improvements of the products and services provided to users. Observations are a fundamental pillar of the CMEMS value-added chain, thus CMEMS is highly dependent on the timely availability of comprehensive satellite and in situ observations. This core dependency is managed by CMEMS to ensure its requirements are incorporated in observation plans. The main role of CMEMS is to detail its requirements (from an integrated system perspective), carry out impact assessments and interact with the Copernicus satellite and in situ components for implementation issues. The role of CMEMS is also to advocate on the fundamental role of observations for the services it provides.
Based on an analysis of existing and future observing capabilities, impact assessment studies and long-term service evolution plans, the main CMEMS recommendations for the evolution of the ocean observing system can be summarized as follows:
• Continuity of the present capabilities of the Sentinel missions should first be ensured. In addition to already decided missions, such as SWOT, that are expected to have an important impact on CMEMS (Morrow et al., 2019), new capabilities should be developed on the medium (before 2025) and long term (after 2030). In the medium term, a European passive microwave mission for high-spatial-resolution ocean surface temperature, sea-ice concentration, sea-ice drift, thin sea-ice thickness and sea-surface salinity should be developed. Continuity (with improvements) of the Cryosat-2 mission for sea-ice thickness and sea-level monitoring in polar regions should be ensured. It is also important to fly the SKIM (Sea surface KInematics Multiscale monitoring) surface current R&D mission to demonstrate its potential for CMEMS. In the longer term, new capabilities for operational wide-swath altimetry and geostationary ocean color mission over Europe should be developed.
• As far as the in situ observing system is concerned, there are critical sustainability gaps, sampling gaps and major BGC observations gaps (e.g., carbon, oxygen, nutrients, chl-a). In terms of EOVs, these gaps should be filled through different networks. The evolution of satellite observations toward higher space/time resolution also suggests that maintaining and enhancing the in situ observing system are critical for validating and complementing future high-resolution satellite observations. In terms of platforms, consolidation of the Argo core mission (temperature and salinity−0 to 2,000 m), including the sampling of polar and marginal seas and developing its two major extensions (BGC Argo and Deep Argo) (Roemmich et al., in review), is a strong priority for CMEMS at global and regional levels. Nowadays, Argo is the key in situ network for operational oceanography, providing thousands of daily measurements of ocean physics and, progressively, becoming the main source of BGC observations in the open seas. Argo needs to be complemented by reference measurements from long time series at fixed points from moorings and ship-based hydrographic surveys with the best quality (GO-SHIP) standards. Improving ROOSes and key observing systems, such as FerryBoxes, gliders, tide gauges and HF radars, are strong priorities for regional CMEMS products. A specific effort for the Arctic region is needed because there are severe limitations with measurements within the seasonal ice zone, which is growing broader, and none of the platforms available today can collect data there. Developing a dedicated network capable of collecting FRMs for all the ocean variables estimated by the Copernicus Satellite component is also important for CMEMS.
These requirements will evolve over time as CMEMS's integrated systems develop. It is essential to strengthen CMEMS capabilities for assessing the impact of present and future observations (particularly for BGC EOVs) to guide observing system agencies, as well as to better use observations in models. These activities should be developed further in Copernicus 2.0 (post 2021) in cooperation with international partners.
The development of improved and more integrated in situ and satellite observing systems required by CMEMS will also require strengthening international cooperation and coordination on observations (GOOS, CEOS), modeling and data assimilation (GODAE OceanView/Ocean Predict) and applications and users (GEO Blue Planet).
Author Contributions
All authors listed have made a substantial, direct and intellectual contribution to the work, and approved it for publication.
Funding
European Commission (Copernicus Marine Service). Part of a delegated agreement between the European Commission and Mercator Ocean.
Conflict of Interest Statement
The authors declare that the research was conducted in the absence of any commercial or financial relationships that could be construed as a potential conflict of interest.
References
Allard, R. A., Farrell, S. L., Hebert, D. A., Johnston, W. F., Li, L., Kurtz, N. T., et al. (2018). Utilizing CryoSat-2 sea ice thickness to initialize a coupled ice-ocean modelling system. Adv. Space Res. 62, 1265–1280. doi: 10.1016/j.asr.2017.12.030
Aouf, L., Dalphinet, A., Law-Chune, S., and Drillet, Y. (2018a). “The upgraded CMEMS global wave system: improvements and efficiency for the ocean/waves coupling,” in EGU General Assembly Conference (Vienna).
Aouf, L., Hauser, D, Tison, C., and Chapron, B. (2018b). “On the assimilation of multi-source of directional wave spectra from Sentinel-1 and CFOSAT in the wave model MFWAM: toward an operational use in CMEMS-MFC,” in Proceedings of IGARSS (Valencia).
Bell, M. J., Le Traon, P.-Y., Smith, N. R., Dombrowsky, E, and Wilmer-Becker, K (2015). An introduction to GODAE oceanview. J. Oper. Oceanogr. 8, 2–11. doi: 10.1080/1755876X.2015.1022041
Bittig, H., Claustre, H., D'ortenzio, F., Donnelly, M., Gourcuff, C., Haapala, J., et al. (2017). Strategy for Evolution of Argo in Europe. Plouzané: Euro-Argo ERIC. doi: 10.13155/48526
Blockley, E. W., and Peterson, K. A. (2018). Improving met office seasonal predictions of arctic sea ice using assimilation of CryoSat-2 thickness. Cryosphere 12, 3419–3438. doi: 10.5194/tc-12-3419-2018
Bonaduce, A., Benkiran, M., Remy, E., Le Traon, P. Y., and Garric, G (2018). Contribution of future wide-swath altimetry missions to ocean analysis and forecasting. Ocn. Sci. 14, 1405–1421. doi: 10.5194/os-14-1405-2018
Boy, F., Desjonquères, J. D., Picot, N., Moreau, T., and Raynal, M. (2017). CryoSat-2 SAR-mode over oceans: processing methods, global assessment, and benefits. IEEE Trans. Geosci. Remote Sens. 55, 148–158. doi: 10.1109/TGRS.2016.2601958
Buongiorno Nardelli, B. (2012). A novel approach for the high-resolution interpolation of in situ sea surface salinity. J. Atmos. Ocn. Technol. 29, 867–879. doi: 10.1175/JTECH-D-11-00099.1
Cardinali, C., Pezzulli, S., and Andersson, E. (2004). Influence-matrix diagnostic of a data assimilation system. Q. J. R. Meteorol. Soc. 130, 2767–2786. doi: 10.1256/qj.03.205
CMEMS (2016). Position paper Polar and snow cover applications: User Requirements Workshop (Brussels).
CMEMS (2017). CMEMS Requirements for the Evolution of the Copernicus Satellite Component. Mercator Ocean and CMEMS Partners.
CMEMS STAC (2017). Copernicus Marine Environment Monitoring Service (CMEMS) Service Evolution Strategy: R&D priorities. Version 3. Available online at: http://marine.copernicus.eu/wp-content/uploads/2017/06/CMEMS-Service_evolution_strategy_RD_priorities_V3-final.pdf (accessed April 26, 2019).
Cossarini, G., Mariotti, L., Feudale, L., Mignot, A., Salon, S., Taillandier, V., et al. (2019). Towards operational 3D-Var assimilation of chlorophyll biogeochemical-argo float data into a biogeochemical model of the Mediterranean Sea. Ocn. Model. 133, 112–128. doi: 10.1016/j.ocemod.2018.11.005
Denvil-Sommer, A., Gehlen, M., Vrac, M., and Mejia, C. (2018). FFNN-LSCE: A two-step neural network model for the reconstruction of surface ocean pCO2 over the Global Ocean. Geosci. Model Dev. doi: 10.5194/gmd-2018-247
Dibarboure, G, Lamy, A., Pujol, M. I., and Jettou, G. (2018). The drifting phase of SARAL/AltiKa: securing a stable 2 mesoscale sampling with an unmaintained decaying altitude. Remote Sens. 10:1051. doi: 10.3390/rs10071051
Dibarboure, G., Pujol, M. I., Briol, F., Le Traon, P. Y., Larnicol, G., Picot, N., et al. (2011). Jason-2 in DUACS: first tandem results and impact on processing and products. Mar. Geod. 34, 214–241. doi: 10.1080/01490419.2011.584826
Dibarboure, G., Schaeffer, P., Escudier, M. I., Pujol, J. F., Legeais, Y., Faugère, R., et al. (2012). Finding desirable orbit options for the “extension of life” phase of jason-1. Mar. Geod. 35, 363–399. doi: 10.1080/01490419.2012.717854
Droghei, R., Buongiorno Nardelli, B., and Santoleri, R. (2018). A new global sea surface salinity and density dataset from multivariate observations (1993–2016). Front. Mar. Sci. 5:84. doi: 10.3389/fmars.2018.00084
Duchossois, G., Strobl, P., Toumazou, V., Antunes, S., Bartsch, A., Diehl, T., et al. (2018). User Requirements for a Copernicus Polar Mission - Phase 2 Report. EUR 29144 EN, Publications Office of the European Union, Luxembourg.
Gasparin, F., Guinehut, S., Mao, C., Mirouze, I., Rémy, E., King, R., et al. (2019). Requirements for an integrated in situ Atlantic ocean observing system from coordinated observing system simulation experiments. Front. Mar. Sci. 6:83. doi: 10.3389/fmars.2019.00083
Grayek, S., Stanev, E. V., and Schulz-Stellenfleth, J Assessment of the Black Sea observing system. A focus on 2005-2012 Argo campaigns. Ocn Dynamics (2015). 65:1665. doi: 10.1007/s10236-015-0889-8
Grégoire, M., Raick, C., and Soetaert, K. (2008). Numerical modelling of the central black sea ecosystem functioning during the eutrophication phase. Prog. Oceanogr. 76, 286–333. doi: 10.1016/j.pocean.2008.01.002
Hamon, M., Greiner, E., Remy, E, and Le Traon, P. Y. (in press). Impact of multiple altimeter data mean dynamic topography in a global analysis forecasting system. J. Atmos. Oceanic Technol.
Hauser, D., Tison, C., Amiot, T., Delaye, L., Corcoral, N., and Castillan, P. (2017). SWIM: The first spaceborne wave scatterometer. IEEE Trans. Geosci. Remote Sens. 55, 3000–3014. doi: 10.1109/TGRS.2017.2658672
Hernandez, F., Blockley, E., Brassington, G. B., Davidson, F., Divakaran, P., Drevillon, M., et al. (2015). Recent progress in performance evaluations and near real-time assessment of operational ocean products. J. Oper. Oceanogr. 8, 221–238, doi: 10.1080/1755876X.2015.1050282
Heslop, E., Sánchez-Román, A., Pascual, A., Rodríguez, D., Reeve, K. A., Faugère, Y., et al. (2017). Sentinel-3A views ocean variability more accurately at finer resolution. Geophys. Res. Lett. 44, 12,367–12,374. doi: 10.1002/2017GL076244
Hoffman, R. N., and Atlas, R. (2016). Future observing system simulation experiments. Bull Am. Meteorol. Soc. 97, 1601–1616. doi: 10.1175/BAMS-D-15-00200.1
Kaminski, T., Kauker, F., Toudal Pedersen, L., Voßbeck, M., Haak, H., Niederdrenk, L., et al. (2018). Arctic mission benefit analysis: impact of sea ice thickness, freeboard, and snow depth products on sea ice forecast performance. Cryosphere 12, 2569–2594. doi: 10.5194/tc-12-2569-2018
Le Traon, P. Y. (2013). From satellite altimetry to argo and operational oceanography: three revolutions in oceanography. Ocn. Sci. 9, 901–915. doi: 10.5194/os-9-901-2013
Le Traon, P. Y. (2018). “Satellites and operational oceanography,” in New Front. Operat. Oceanogr., eds E. Chassignet, A. Pascual, J. Tintoré, and J. Verron (GODAE OceanView), 161–190. doi: 10.17125/gov2018.ch07
Le Traon, P. Y., Ali, A., Alvarez Fanjul, E., Aouf, L., Axell, L., Aznar, R., et al. (2017a). The copernicus marine environmental monitoring service: main scientific achievements and future prospects. Mercator. Ocn. J. 56, 101. doi: 10.25575/56
Le Traon, P. Y., and Dibarboure, G. (1999). Mesoscale mapping capabilities of multiple-satellite altimeter missions. J. Atmos. Oceanic Technol. 16, 1208–1223.
Le Traon, P. Y., Dibarboure, G., Jacobs, G., Martin, M., Remy, E., and Schiller, A. (2017b). Use of Satellite Altimetry for Operational Oceanography in Satellite Altimetry Over Oceans and Land Surfaces. eds Stammer and Cazenave. Boca Raton, FL: CRC Press.
Lea, D. J., Martin, M. J., and Oke, P. R. (2014). Demonstrating the complementarity of observations in an operational ocean forecasting system. Q.J.R. Meteorol. Soc. 140, 2037–2049. doi: 10.1002/qj.2281
Lellouche, J.-M., Greiner, E., Le Galloudec, O., Garric, G., Regnier, C., Drevillon, M., et al. (2018). Recent updates to the copernicus marine service global ocean monitoring and forecasting real-time 1/12° high-resolution system. Ocn. Sci. 14, 1093–1126. doi: 10.5194/os-14-1093-2018
Lellouche, J. M., Le Galloudec, O., Drévillon, M., Régnier, C., Greiner, E., Garric, G., et al. (2013). Evaluation of global monitoring and forecasting systems at Mercator Océan. Ocn. Sci. 9, 57–81. doi: 10.5194/os-9-57-2013
Lisæter, K. A., Evensen, G., and Laxon, S. (2007). Assimilating synthetic CryoSat sea ice thickness in a coupled ice-ocean model. J. Geophys. Res. 112:C07023. doi: 10.1029/2006JC003786
Martin, M. J., King, R. R., While, J., and Aguiar, A. B. (2019). Assimilating satellite sea surface salinity data from SMOS, Aquarius and SMAP into a global ocean forecasting system. Q. J. R. Meteorol. Soc.145, 705–726. doi: 10.1002/qj.3461
Mercator Ocean (2016). CMEMS High Level Service Evolution Strategy. Document prepared with the support of the CMEMS Science and Technology Advisory Committee (STAC). Available online at: http://marine.copernicus.eu/science-learning/service-evolution/service-evolution-strategy/ (accessed April 26, 2019).
Morrow, R., Fu, L. L., Ardhuin, F., Benkiran, M., Chapron, B., Cosme, E., et al. (2019). Global observations of fine-scale ocean surface topography with the Surface Water and Ocean Topography (SWOT) Mission. Front. Mar. Sci. 6. doi: 10.3389/fmars.2019.00232
Mu, L., Yang, Q., Losch, M., Losa, S. N., Ricker, R., Nerger, L., et al. (2018). Improving sea ice thickness estimates by assimilating CryoSat-2 and SMOS sea ice thickness data simultaneously. Q. J. R. Meteorol. Soc. 144, 529–538. doi: 10.1002/qj.3225
Oke, P. R., Larnicol, G., Fujii, Y., Smith, G. C., Lea, D. J., Guinehut, S., et al. (2015). Assessing the impact of observations on ocean forecasts and reanalyses: Part 1, global studies. J. Oper. Oceanograph. 8, 49–62. doi: 10.1080/1755876X.2015.1022067
Posey, P. G., Metzger, E. J., Wallcraft, A. J., Hebert, D. A., Allard, R. A., Smedstad, O. M., et al. (2015). Improving Arctic sea ice edge forecasts by assimilating high horizontal resolution sea ice concentration data into the US Navy's ice forecast systems. Cryosphere 9, 1735–1745. doi: 10.5194/tc-9-1735-2015
Pujol, M. I., Dibarboure, G., Le Traon, P. Y., and Klein, P. (2012). Using high-resolution altimetry to observe mesoscale signals. J. Atmos. Oceanic Technol. 29, 1409–1416. doi: 10.1175/JTECH-D-12-00032.1
Ravdas, M., Zacharioudaki, A., and Korres, G. (2018). Implementation and validation of a new operational wave forecasting system of the Mediterranean Monitoring and Forecasting Centre in the framework of the Copernicus Marine Environment Monitoring Service. Nat. Hazards Earth Syst. Sci. 18, 2675–2695. doi: 10.5194/nhess-18-2675-2018
Reul, N., Fournier, S., Boutin, J., Hernandez, O., Maes, C., Chapron, B., et al. (2013). Sea surface salinity observations from space with the SMOS satellite: a new means to monitor the marine branch of the water cycle. Surv. Geophys. 35, 1–42.
Rio, M. H., Guinehut, S., and Larnicol, G. (2011). New CNES-CLS09 global mean dynamic topography computed from the combination of GRACE data, altimetry, and in situ measurements. J. Geophys. Res. 116:C07018. doi: 10.1029/2010JC006505
Rio, M. H., Pascual, A., Poulain, P. M., Menna, M., Barceló, B., and Tintoré, J. (2014). Computation of a new mean dynamic topography for the Mediterranean Sea from model outputs, altimeter measurements and oceanographic in situ data. Ocn. Sci. 10, 731–744. doi: 10.5194/osd-11-655-2014
Rio, M. H., and Santoleri, R. (2018). Improved global surface currents from the merging of altimetry and seasurface temperature data. Remote Sens. Environ. 216, 770–785. doi: 10.1016/j.rse.2018.06.003
Rio, M. H., Santoleri, R., Bourdalle-Badie, R., Griffa, A., Piterbarg, L., and Taburet, G. (2016). Improving the altimeter-derived surface currents using high-resolution sea surface temperature data: a feasability study based on model outputs. J. Atmos. Oceanic Technol. 33, 2769–2784. doi: 10.1175/JTECH-D-16-0017.1
Riser, S. C, Freeland, H. J., and Roemmich, D. (2016). Fifteen years of ocean observations with the global Argo array. Nat. Clim. Change 6, 145–153. doi: 10.1038/nclimate2872
Ryder (2007). GMES Fast Track Marine Core Service Strategic Implementation Plan. Final draft. By Dr. Peter Ryder for the Marine Core Service Implementation Group. Marine Core Service implementation group report.
Sakov, P., Counillon, F., Bertino, L., Lisæter, K. A., Oke, P. R., and Korablev, A. (2012). TOPAZ4: an ocean-sea ice data assimilation system for the North Atlantic and Arctic. Ocn. Sci. 8, 633–656. doi: 10.5194/os-8-633-2012
Sánchez-Román, A., Ruiz, S., Pascual, A., Mourre, B., and Guinehut, S. (2017). On the mesoscale monitoring capability of Argo floats in the Mediterranean Sea. Ocn. Sci. 13, 223–234. doi: 10.5194/os-13-223-2017
Sommer, A., Gehlen, M., and Vrac, M. (2018). Use of Statistical Techniques for Identifying an Optimal Observational Network for Enabling Ocean Carbon System Estimates. Annexed to Report D1.5 of the European H2020 AtlantOS project (N° 633211).
Stanev, E. V., He, Y., Grayek, S., and Boetius, A. (2013). Oxygen dynamics in the Black Sea as seen by argo profiling floats. Geophys. Res. Lett. 40, 3085–3090. doi: 10.1002/grl.50606
Stanev, E. V., Poulain, P. M., Grayek, S., Johnson, K. S., Claustre, H., and Murray, J. W. (2018). Understanding the dynamics of the oxic-anoxic interface in the Black Sea. Geophys. Res. Lett. 45, 864–871. doi: 10.1002/2017GL076206
Stark, J. D., Ridley, J., Martin, M. M., and Hines, A. (2008). Sea ice concentration and motion assimilation in a sea ice–ocean model. J. Geophys. Res. 113:C05S91. doi: 10.1029/2007JC0042242008
Tranchant, B., Remy, E., Greiner, E., and Legalloudec, O. (2018). Data assimilation of SMOS observations into the Mercator Ocean operational system: focus on the Nino 2015 event. Ocn. Sci. doi: 10.5194/os-2018-113
Turpin, V., Remy, E., and Le Traon, P. Y. (2016). How essential are Argo observations to constrain a global ocean data assimilation system? Publisher's official version: Ocn. Sci. 12, 257–274. doi: 10.5194/os-12-257-2016
Verrier, S., Le Traon, P. Y., and Remy, E. (2017). Assessing the impact of multiple altimeter missions and argo in a global eddy-permitting data assimilation system. Ocn. Sci. 13, 1077–1092. doi: 10.5194/os-13-1077-2017
Verrier, S., Le Traon, P. Y., Remy, E., and Lellouche, J. M. (2018). Assessing the impact of SAR altimetry for global ocean analysis and forecasting. J. Oper. Oceanogr. 11, 82–86. doi: 10.1080/1755876X.2018.1505028
Von Schuckmann, K., Le Traon, P. Y., Smith, N., Pascual, A., Brasseur, P., Fennel, K., et al. (2017). The copernicus marine environment monitoring service ocean state report. J. Oper. Oceanogr. 9, s235–s320. doi: 10.1080/1755876X.2016.1273446
Von Schuckmann, K., Le Traon, P. Y., Smith, N., Pascual, A., Brasseur, P., Fennel, K. S., et al. (2018). Copernicus marine service ocean state report. J. Oper. Oceanograp. 11, 1–142. doi: 10.1080/1755876X.2018.1489208
Wood, R., Ford, D., Gasprin, F., Palmer, M., Rémy, E., le Traon, P.Y., Blaker, A., et al. (2018). Synthesis of OSSE Results. Atlantos H2020 deliverable D1.5 Available online at: https://www.atlantos-h2020.eu/project-information/work-packages/deliverables/ (accessed April 26, 2019).
Xie, J., Bertino, L., Counillon, F., Lisæter, K. A., and Sakov, P. (2017). Quality assessment of the TOPAZ4 reanalysis in the Arctic over the period 1991–2013. Ocn. Sci., 13, 123–144. doi: 10.5194/os-13-123-2017
Xie, J., Counillon, F., and Bertino, L. (2018). Impact of assimilating a merged sea-ice thickness from CryoSat-2 and SMOS in the Arctic reanalysis. Cryosphere 12, 3671–3691, doi: 10.5194/tc-12-3671-2018
Xie, J., Counillon, F., Bertino, L., Tian-Kunze, X., and Kaleschke, L. (2016). Benefits of assimilating thin sea-ice thickness from SMOS into the TOPAZ system. Cryosphere 10, 2745–2761. doi: 10.5194/tc-10-2745-2016
Keywords: ocean, observing systems, satellite, in situ, data assimilation, services
Citation: Le Traon PY, Reppucci A, Alvarez Fanjul E, Aouf L, Behrens A, Belmonte M, Bentamy A, Bertino L, Brando VE, Kreiner MB, Benkiran M, Carval T, Ciliberti SA, Claustre H, Clementi E, Coppini G, Cossarini G, De Alfonso Alonso-Muñoyerro M, Delamarche A, Dibarboure G, Dinessen F, Drevillon M, Drillet Y, Faugere Y, Fernández V, Fleming A, Garcia-Hermosa MI, Sotillo MG, Garric G, Gasparin F, Giordan C, Gehlen M, Gregoire ML, Guinehut S, Hamon M, Harris C, Hernandez F, Hinkler JB, Hoyer J, Karvonen J, Kay S, King R, Lavergne T, Lemieux-Dudon B, Lima L, Mao C, Martin MJ, Masina S, Melet A, Buongiorno Nardelli B, Nolan G, Pascual A, Pistoia J, Palazov A, Piolle JF, Pujol MI, Pequignet AC, Peneva E, Pérez Gómez B, Petit de la Villeon L, Pinardi N, Pisano A, Pouliquen S, Reid R, Remy E, Santoleri R, Siddorn J, She J, Staneva J, Stoffelen A, Tonani M, Vandenbulcke L, von Schuckmann K, Volpe G, Wettre C and Zacharioudaki A (2019) From Observation to Information and Users: The Copernicus Marine Service Perspective. Front. Mar. Sci. 6:234. doi: 10.3389/fmars.2019.00234
Received: 19 November 2018; Accepted: 16 April 2019;
Published: 22 May 2019.
Edited by:
Frank Edgar Muller-Karger, University of South Florida, United StatesReviewed by:
Eric Judson Bayler, Center for Satellite Applications and Research (STAR NOAA), United StatesJorge Vazquez, NASA Jet Propulsion Laboratory (JPL), United States
Vardis Maximilian Tsontos, NASA Jet Propulsion Laboratory (JPL), United States
Copyright © 2019 Le Traon, Reppucci, Alvarez Fanjul, Aouf, Behrens, Belmonte, Bentamy, Bertino, Brando, Kreiner, Benkiran, Carval, Ciliberti, Claustre, Clementi, Coppini, Cossarini, De Alfonso Alonso-Muñoyerro, Delamarche, Dibarboure, Dinessen, Drevillon, Drillet, Faugere, Fernández, Fleming, Garcia-Hermosa, Sotillo, Garric, Gasparin, Giordan, Gehlen, Gregoire, Guinehut, Hamon, Harris, Hernandez, Hinkler, Hoyer, Karvonen, Kay, King, Lavergne, Lemieux-Dudon, Lima, Mao, Martin, Masina, Melet, Buongiorno Nardelli, Nolan, Pascual, Pistoia, Palazov, Piolle, Pujol, Pequignet, Peneva, Pérez Gómez, Petit de la Villeon, Pinardi, Pisano, Pouliquen, Reid, Remy, Santoleri, Siddorn, She, Staneva, Stoffelen, Tonani, Vandenbulcke, von Schuckmann, Volpe, Wettre and Zacharioudaki. This is an open-access article distributed under the terms of the Creative Commons Attribution License (CC BY). The use, distribution or reproduction in other forums is permitted, provided the original author(s) and the copyright owner(s) are credited and that the original publication in this journal is cited, in accordance with accepted academic practice. No use, distribution or reproduction is permitted which does not comply with these terms.
*Correspondence: Pierre Yves Le Traon, cGllcnJlLXl2ZXMubGV0cmFvbkBtZXJjYXRvci1vY2Vhbi5mcg==